Ox_Khalyl
1738Me gusta0Compartir en el chat59Aficionados39Seguir
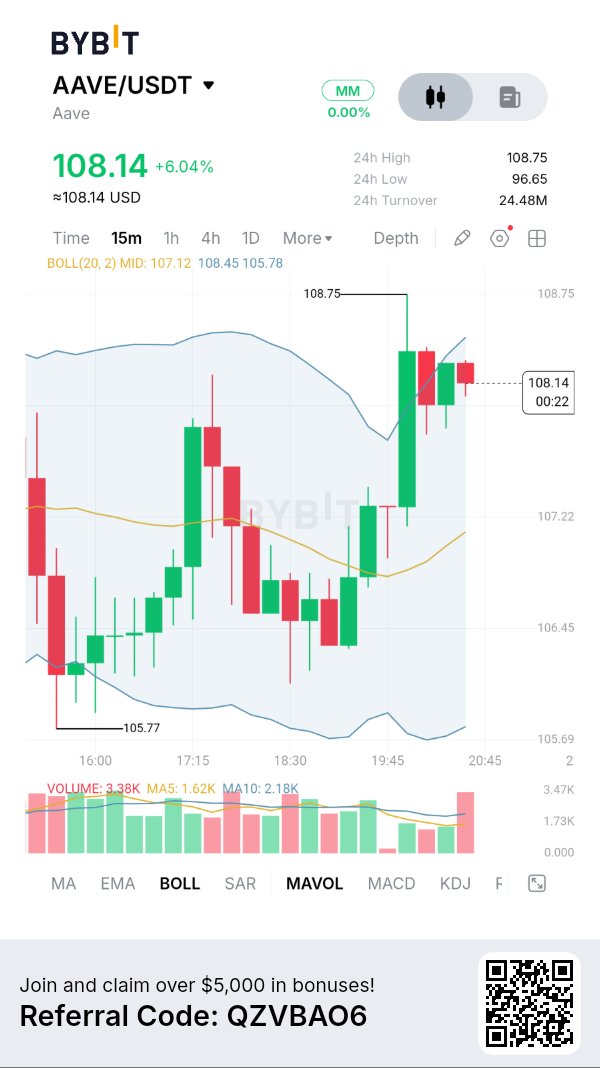
AAVE ($AAVE): Buyers Push Price Above $108 as Recovery Momentum Builds FUNDAMENTAL ANALYSIS Aave remains one of the leading decentralized lending protocols, allowing users to supply assets, earn interest and borrow against crypto collateral. Its latest major development is Aave V4, which introduces a Hub-and-Spoke architecture designed to improve liquidity management, capital efficiency and risk isolation. Aave's October development update reported that V4 deposits surpassed $1.5 billion, while the wider protocol reached $1.1 trillion in cumulative borrowing volume. These milestones reinforce Aave's position in DeFi, although protocol growth does not automatically guarantee token price appreciation. TOKENOMICS AAVE has a maximum supply of 16 million tokens. Its utility includes protocol governance and participation in the Safety Module. The DAO also operates a buyback program funded by protocol revenue, creating another potential source of market demand. However, buybacks, staking and protocol growth must be evaluated alongside circulating supply, liquidity and broader market conditions. CHART + INDICATORS According to the supplied Bybit 15-minute chart: - Current price: $108.14 - 24H change: +6.04% - 24H high: $108.75 - 24H low: $96.65 - 24H turnover: $24.48M - Bollinger midline: $107.12 - Upper band: $108.45 - Lower band: $105.78 - Recent chart low: $105.77 $AAVEUSDT has recovered strongly from $105.77 and reclaimed the Bollinger midline. Price is now testing the upper band around $108.45. Volume stands at 3.38K, above MA5 at 1.62K and MA10 at 2.18K. This suggests stronger participation during the recent recovery. However, price is approaching resistance, so a rejection remains possible. BULLISH SCENARIO A sustained move above $108.45, followed by a successful retest, could open the way toward $108.75. A convincing breakout above $108.75 would strengthen the recovery and potentially attract additional buyers. BEARISH SCENARIO Failure to break the upper Bollinger Band could trigger a pullback toward $107.12. Losing the midline would weaken the immediate bullish structure, while a deeper correction could expose $105.78 again. MY TRADING PLAN I would avoid chasing the current green candles. For a bullish entry, I want a confirmed breakout above $108.45, improving volume and a successful retest. If price gets rejected, I would watch how it reacts around $107.12 before considering another opportunity. Position sizing and stop-loss placement should reflect the volatility of the market. MY INTERPRETATION AAVE is showing encouraging recovery momentum, supported by stronger volume and a move above the Bollinger midline. Its fundamentals remain interesting, particularly with V4 expansion and growing protocol activity. But the immediate technical challenge is whether buyers can overcome $108.45 and establish acceptance above $108.75. Is AAVE preparing for another leg higher, or are buyers approaching a resistance zone where sellers could regain control? #IMPACTbyTrade

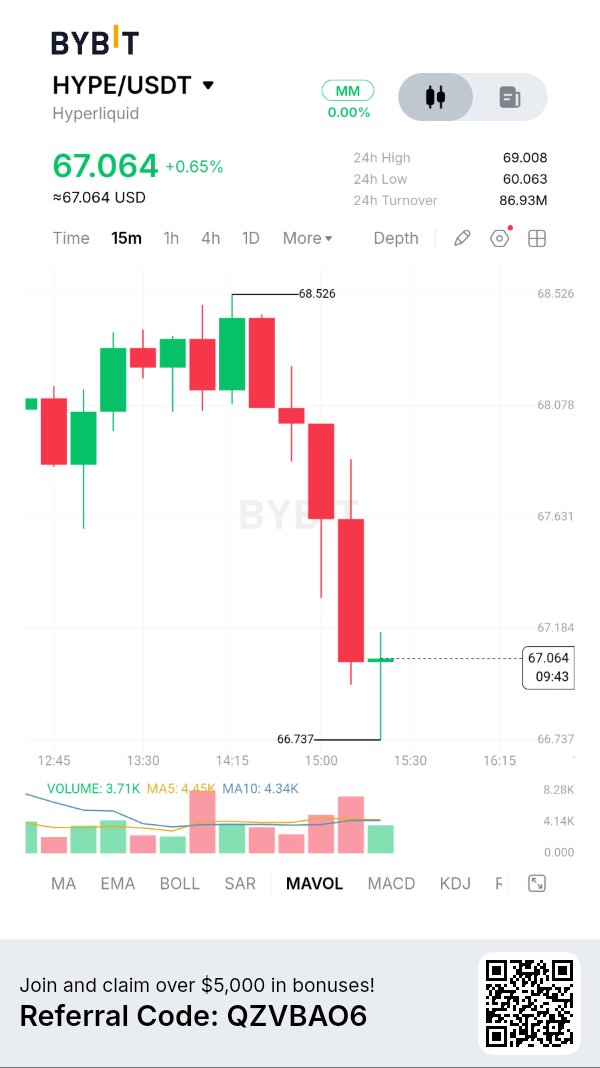
Los compradores intentan defender los $66.74 mientras HYPEUSDT se enfrenta a otra prueba técnica ANÁLISIS FUNDAMENTAL Hyperliquid está construyendo uno de los ecosistemas de trading descentralizado más importantes, con futuros perpetuos on-chain, mercados spot y una infraestructura DeFi en expansión. Su ventaja competitiva radica en su experiencia de trading, su profunda liquidez y su creciente adopción. Una parte importante de su modelo económico es el Fondo de Asistencia, que utiliza aproximadamente el 99% de las comisiones del protocolo para comprar HYPE en el mercado abierto. Esto crea una conexión entre la actividad de la plataforma y la demanda potencial del token. Sin embargo, unos fundamentos sólidos del protocolo no garantizan una recuperación inmediata del precio. El sentimiento del mercado, los desbloqueos de tokens y la presión de venta siguen siendo riesgos importantes. TOKENOMICS HYPE tiene un suministro máximo inicialmente fijado en 1.000 millones de tokens, distribuidos entre recompensas de la comunidad, colaboradores y otras asignaciones del ecosistema. El mecanismo de recompra del Fondo de Asistencia y las quemas de comisiones de HyperEVM respaldan la narrativa de reducción de la oferta. Sin embargo, las emisiones continuas y la adquisición de derechos (vesting) de los colaboradores pueden introducir una presión de oferta adicional. La pregunta importante es si la demanda del protocolo puede absorber constantemente la nueva oferta de tokens. GRÁFICO + INDICADORES Según el gráfico de 15 minutos de Bybit proporcionado: - Precio actual: $67.064 - Cambio en 24H: +0.65% - Máximo en 24H: $69.008 - Mínimo en 24H: $60.063 - Volumen en 24H: $86.93M - Máximo visible en el gráfico: $68.526 - Mínimo reciente en el gráfico: $66.737 HYPE experimentó una fuerte caída desde el área de $68.50 antes de encontrar un soporte temporal alrededor de los $66.74. La última vela muestra un pequeño intento de recuperación, pero el volumen de 3.71K se mantiene por debajo de la MA5 (4.45K) y de la MA10 (4.34K). Esto sugiere que los compradores están intentando estabilizar el precio, pero todavía se necesita una participación más fuerte. ESCENARIO ALCISTA Una defensa exitosa de los $66.74, seguida de una recuperación de los $67.18, podría abrir el camino hacia los $67.63 y $68.08. Un breakout sostenido por encima de los $68.53 proporcionaría una evidencia más sólida de recuperación. ESCENARIO BAJISTA No mantener los $66.74 podría exponer a HYPE a otra ola de ventas. Un volumen de compra débil y continuo, junto con un rechazo por debajo de los $67.18, mantendría la estructura a corto plazo vulnerable. MI PLAN DE TRADING Evitaría perseguir el rebote actual. Para una configuración alcista, quiero una recuperación confirmada de los $67.18 seguida de un retest exitoso y un volumen en mejora. Si el soporte se rompe, prefiero esperar a una nueva estructura antes que forzar una entrada. MI INTERPRETACIÓN HYPE tiene un ecosistema convincente y un modelo de token que conecta la actividad del protocolo con la demanda del mercado. Sin embargo, el gráfico actualmente muestra una estabilización más que una reversión confirmada. La próxima batalla importante está alrededor de los $67.18, mientras que los $66.74 siguen siendo el soporte inmediato a vigilar. ¿Podrán los compradores convertir este soporte en el inicio de una recuperación, o se está preparando HYPE para otro tramo a la baja? IMPACTbyTrade

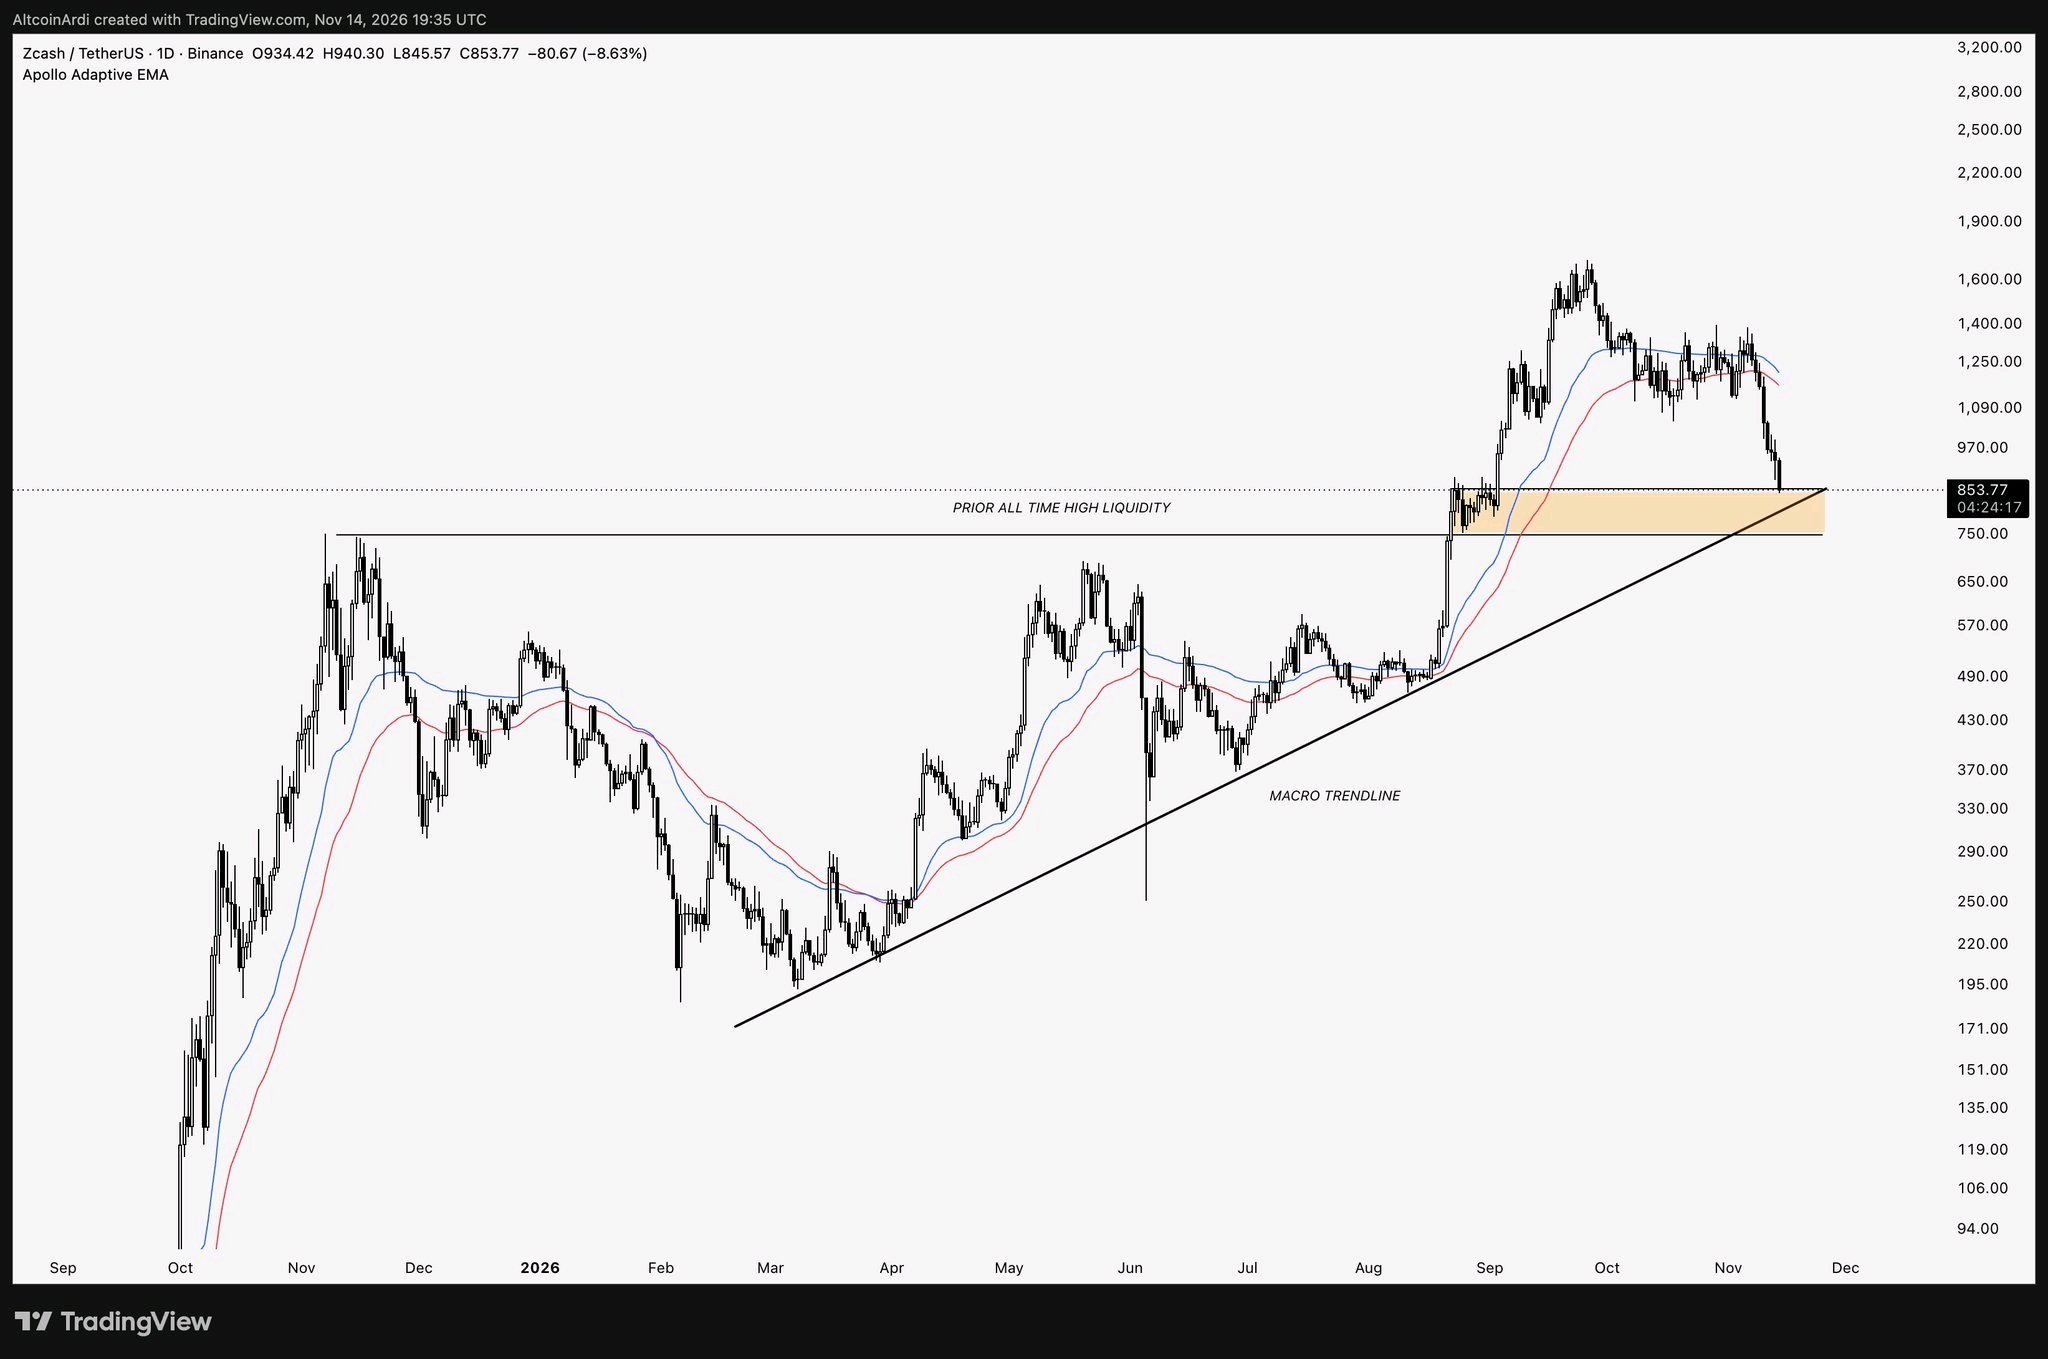
$ZEC now moving into the latter stages of the macro roadmap I laid out a month ago. We've seen the move into our highlighted range fast-tracked with no relief rally, given the price action across BTC and the market over the last week. It's also slowly approaching the macro trendline that's been carrying every major pullback since the February lows at $180, which is a pretty important development to watch. My expectation is still that we find some sort of bounce from the liquidity within this range before hunting the liquidity below the prior all-time high in an attempt to stabilise. Then we can see what the rest of the year carries for the chart. I think naturally, there's a lot of bearishness on Zcash right now, but a hunt below the prior all-time-high liquidity would represent roughly a 60% correction. While that seemed unlikely when I first proposed it, it's still in line with what we've seen from prior euphoric highs. So in my opinion, there's not a lot to be worried or surprised about. Personally, I have DCA'd into some spot positions today as a hedge against my shorts from $1,420, and will continue to reassess where to add to my holdings as we see the action develop throughout the rest of the year. $BTCUSDT #IMPACTbyTrade

$HYPE 16% DOWN TODAY🩸
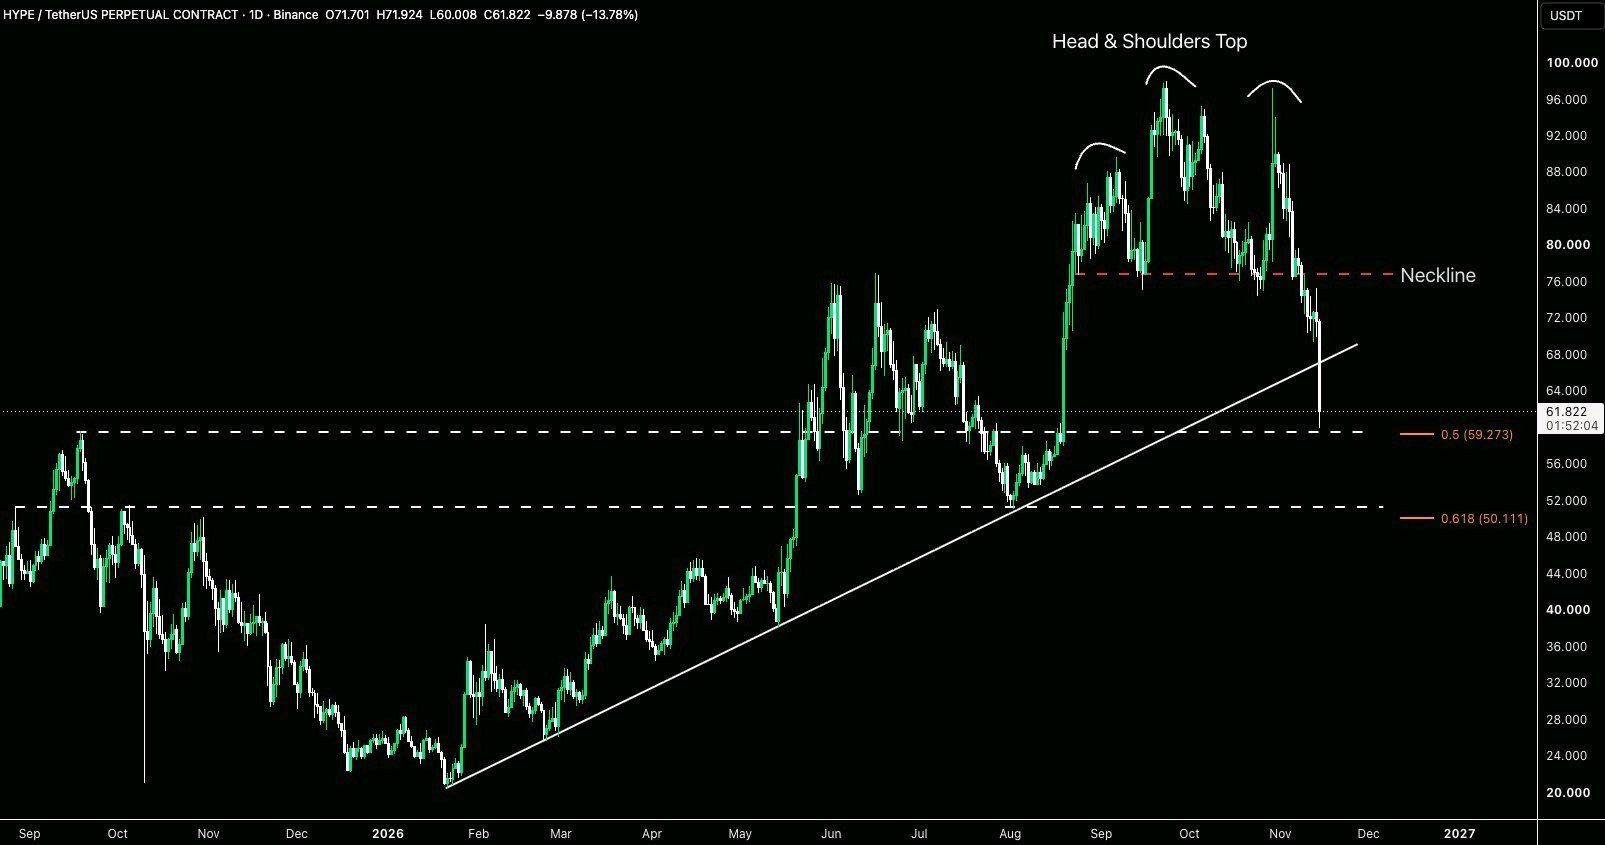
After slicing through its ascending trendline, $HYPEUSDT has now reached our next marked support level around $59, the previous all-time high, where price is attempting a relief bounce. Despite being one of crypto's largest revenue-generating businesses, Hyperliquid is not immune to broader market weakness. When $BTCUSDT enters risk-off mode, even fundamentally strong projects can experience aggressive selling pressure. The next four weeks will be the most important phase of this cycle for $BTCUSDT. Cannot stress this enough. Q4 weakness was always part of the expectation. In both 2018 and 2022, we saw aggressive de-risking towards the end of the midterm year before the market started recovering. What makes this cycle more precarious is that Bitcoin had already broken its prior weekly and monthly lower highs in late Q3, which was a first compared with the prior cycles. This correction now puts those breaks at risk of becoming a macro fakeout, exercising the Law of Trapped Positioning. It's pretty crucial that market makers have enough order-book liquidity to absorb the selling and defend range lows, which would allow Bitcoin to establish a higher low. Otherwise, losing this support region would invalidate the case that this is purely a correction within a developing expansion, and we are in for a deeper reversion. The general expectation remains that most of this weakness plays out towards the end of Q4. Of course, that doesn’t mean January has to be straight up, but in neither of the prior two cycles did January produce a fresh cycle low. Both the previous cycles saw expansion during Q1. In 2019, we saw an initial expansion alongside stabilisation before the move accelerated in Q2. In 2023, the expansion was considerably more aggressive from the start of the year. People will likely become increasingly bearish if we spend another few weeks trading lower. But as long as we protect that support and build a higher low, I’d expect this period to give us opportunities to accumulate ahead of the 2027 run. #IMPACTbyTrade
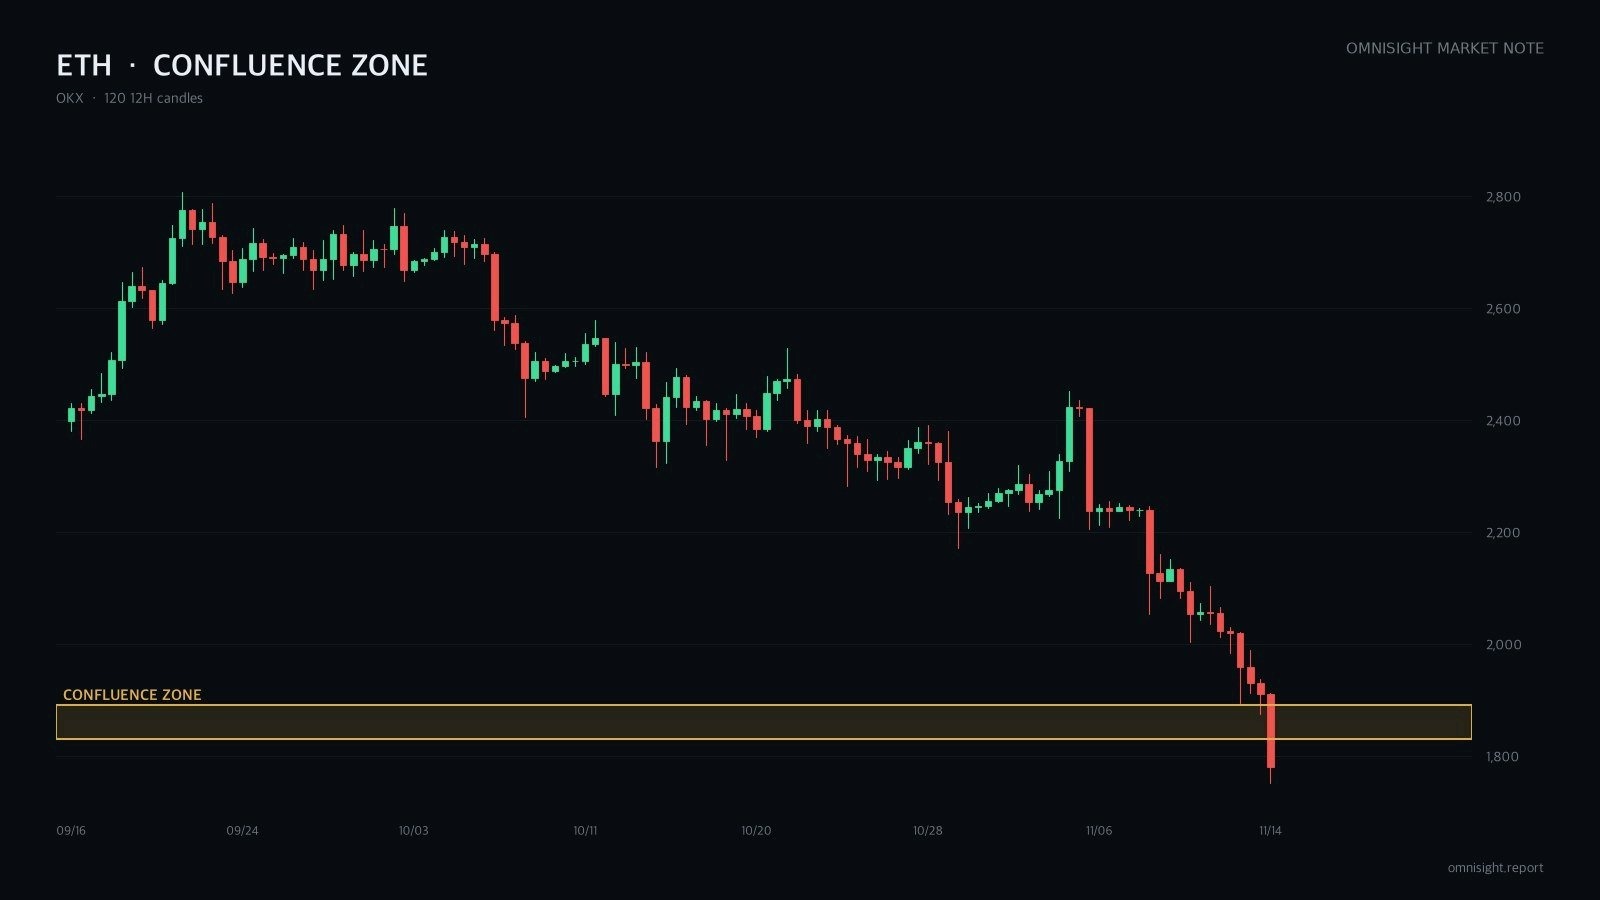
$ETHUSDT is down nearly 10% on the week, and I'm not chasing it lower. I lean short, but only on a bounce. The spot I want is where an unfilled 4h gap, broken support and the retracement of the last leg all stack up. The catch: it's deeply oversold, so the bounce could come hard. Every timeframe I track is printing lower highs and lower lows. Price sits under all its moving averages. Momentum made new lows alongside price, so there's no sign selling pressure is fading. - Three of four technical methods point short. - The rally zone is crowded with overhead supply. - Spot ETF outflows and a weak BTC keep risk appetite low. That overlap matters because a bounce into it has to chew through several sellers at once. From an ICT view, the 4h, 12h and daily structure all step lower with no break of structure to the upside yet. Buy-side liquidity sits just above the gap, so a bounce that runs those stops and then rolls over is the natural path. I'm wrong if price clears the last swing high on the 4h. That would end the lower-high sequence. Risks: oversold readings and negative funding can fuel a short squeeze. Or price slides without a bounce and the order never fills. Not investment advice. All decisions and responsibility are your own. #IMPACTbyTrade
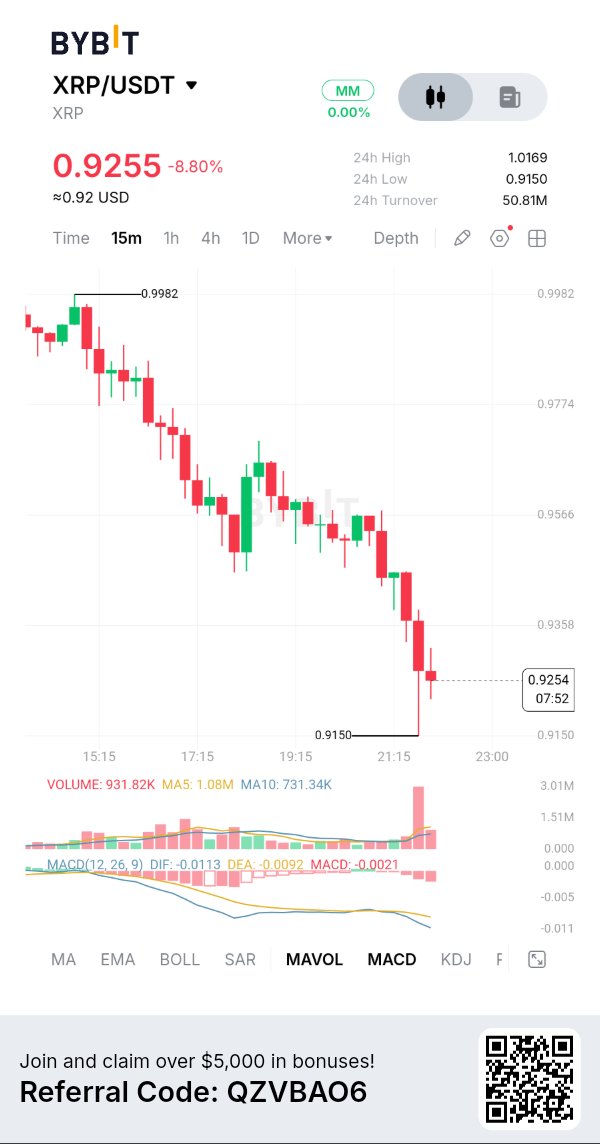
$XRPUSDT está experimentando una presión de venta significativa, con el token cotizando alrededor de $0.9255, una caída aproximada del 8.80% en la instantánea proporcionada por Bybit. El descenso ha sido particularmente agresivo, con el precio cayendo desde el máximo del gráfico de $0.9982 hacia los $0.9150. Los vendedores han mantenido el control a través de varias velas bajistas consecutivas, lo que sugiere que a los compradores les está costando establecer una recuperación significativa. Sin embargo, el precio actual se acerca a una zona de soporte importante. La próxima reacción podría determinar si XRP se estabiliza o extiende su caída. ANÁLISIS FUNDAMENTAL A pesar de la debilidad en el precio, el ecosistema de XRP sigue desarrollándose. Un avance importante es la expansión de la infraestructura institucional de Ripple. El 28 de octubre, Ripple anunció que se acercaba a una tasa de ejecución de ingresos anualizados por productos de 900 millones de dólares y destacó asociaciones que involucran a BNY y Robinhood. Otro avance es el papel creciente de RLUSD, la moneda estable de Ripple, junto con las iniciativas de custodia institucional y tokenización en el XRP Ledger. Estos desarrollos podrían fortalecer la relevancia a largo plazo del ecosistema en pagos e infraestructura financiera. Sin embargo, el éxito comercial de Ripple y la demanda del token XRP no son necesariamente lo mismo. Los inversores aún deben evaluar cuánto se traduce el crecimiento del ecosistema en utilidad real y demanda de XRP. TOKENOMICS XRP tiene un suministro máximo de 100 mil millones de tokens y no depende de la minería ni de recompensas de bloque inflacionarias. Una parte significativa de su suministro permanece asociada con las tenencias y acuerdos de depósito en garantía (escrow) de Ripple. Según la divulgación de SBI Holdings del 28 de octubre de 2026, aproximadamente 63.35 mil millones de XRP circulaban en el mercado, mientras que 31.4 mil millones de XRP permanecían bajo depósito en garantía. Las liberaciones de depósitos en garantía y las distribuciones posteriores siguen siendo importantes porque el suministro adicional disponible puede influir en la liquidez del mercado y la presión de venta. MACRO + MERCADO El entorno más amplio de las criptomonedas está creando dificultades adicionales para XRP. La debilidad de Bitcoin, las condiciones financieras más estrictas y la disminución del apetito por el riesgo han contribuido a las ventas en todo el mercado de altcoins. También hay un avance preocupante en la demanda institucional. Los productos de inversión en XRP registraron aproximadamente 19.13 millones de dólares en salidas netas semanales para la semana que finalizó el 13 de noviembre, según informes recientes del mercado. Esto sugiere que la demanda institucional enfrenta presión al mismo tiempo que el sentimiento minorista se debilita. Hasta que las condiciones generales del mercado mejoren, a XRP le puede costar establecer una recuperación sostenible. GRÁFICO + INDICADORES Según el gráfico de 15 minutos de Bybit proporcionado: Precio actual: $0.9255 Cambio en 24H: -8.80% Máximo 24H: $1.0169 Mínimo 24H: $0.9150 Volumen de operaciones 24H: $50.81M Máximo visible en el gráfico: $0.9982 Soporte inmediato: $0.9150 La estructura técnica sigue siendo bajista, con máximos y mínimos decrecientes consecutivos. Lecturas del MACD: DIF: -0.0113 DEA: -0.0092 Histograma: -0.0021 El histograma negativo y las líneas del MACD con pendiente descendente indican que el impulso bajista sigue siendo dominante. El volumen actualmente marca 931.82K, comparado con la MA5 en 1.08M y la MA10 en 731.34K. Esto sugiere que la actividad comercial reciente está por encima del promedio de 10 periodos, aunque el volumen más reciente está por debajo de la MA5. Los niveles de resistencia inmediatos son $0.9358 y $0.9566, seguidos de $0.9774. ESCENARIO ALCISTA Para que los compradores retomen el control, XRP debe defender primero el área de soporte de $0.9150. Una recuperación por encima de $0.9358 proporcionaría una indicación temprana de que la presión de venta está disminuyendo. Un movimiento más fuerte por encima de $0.9566, respaldado por un volumen en mejora, podría abrir el camino hacia los $0.9774 y, eventualmente, hacia los $0.9982. Quisiera confirmación a través de una participación de compra más fuerte en lugar de depender de un rebote de alivio temporal. ESCENARIO BAJISTA Si XRP pierde los $0.9150 en un cierre confirmado de 15 minutos, la estructura de soporte actual se rompería. Eso podría exponer al mercado a más caídas, particularmente si Bitcoin y el mercado de altcoins en general permanecen débiles. Una recuperación sostenida por encima de $0.9566 debilitaría la perspectiva bajista inmediata. MI PLAN DE TRADING Evitaría tratar de atrapar el precio en caída sin confirmación. Para una configuración alcista, quiero ver que los compradores defiendan los $0.9150, recuperen los $0.9358 y demuestren un volumen más fuerte. Para una configuración bajista, esperaría una ruptura confirmada por debajo de $0.9150 seguida de un retest fallido. El tamaño de la posición debe mantenerse controlado, con un nivel de invalidación predefinido y sin exposición innecesaria durante periodos de volatilidad extrema. POR QUÉ IMPORTA ESTA CONFIGURACIÓN XRP sigue siendo un activo importante dentro del ecosistema de pagos digitales, pero la adopción a largo plazo no elimina el riesgo de mercado a corto plazo. La próxima reacción alrededor de los $0.9150 podría proporcionar una indicación importante de si los compradores finalmente están preparados para defender esta caída o si se está desarrollando otro movimiento a la baja. ¿Defenderá XRP los $0.9150 y comenzará una recuperación, o se están preparando los vendedores para empujar el precio aún más abajo? #IMPACTbyTrade
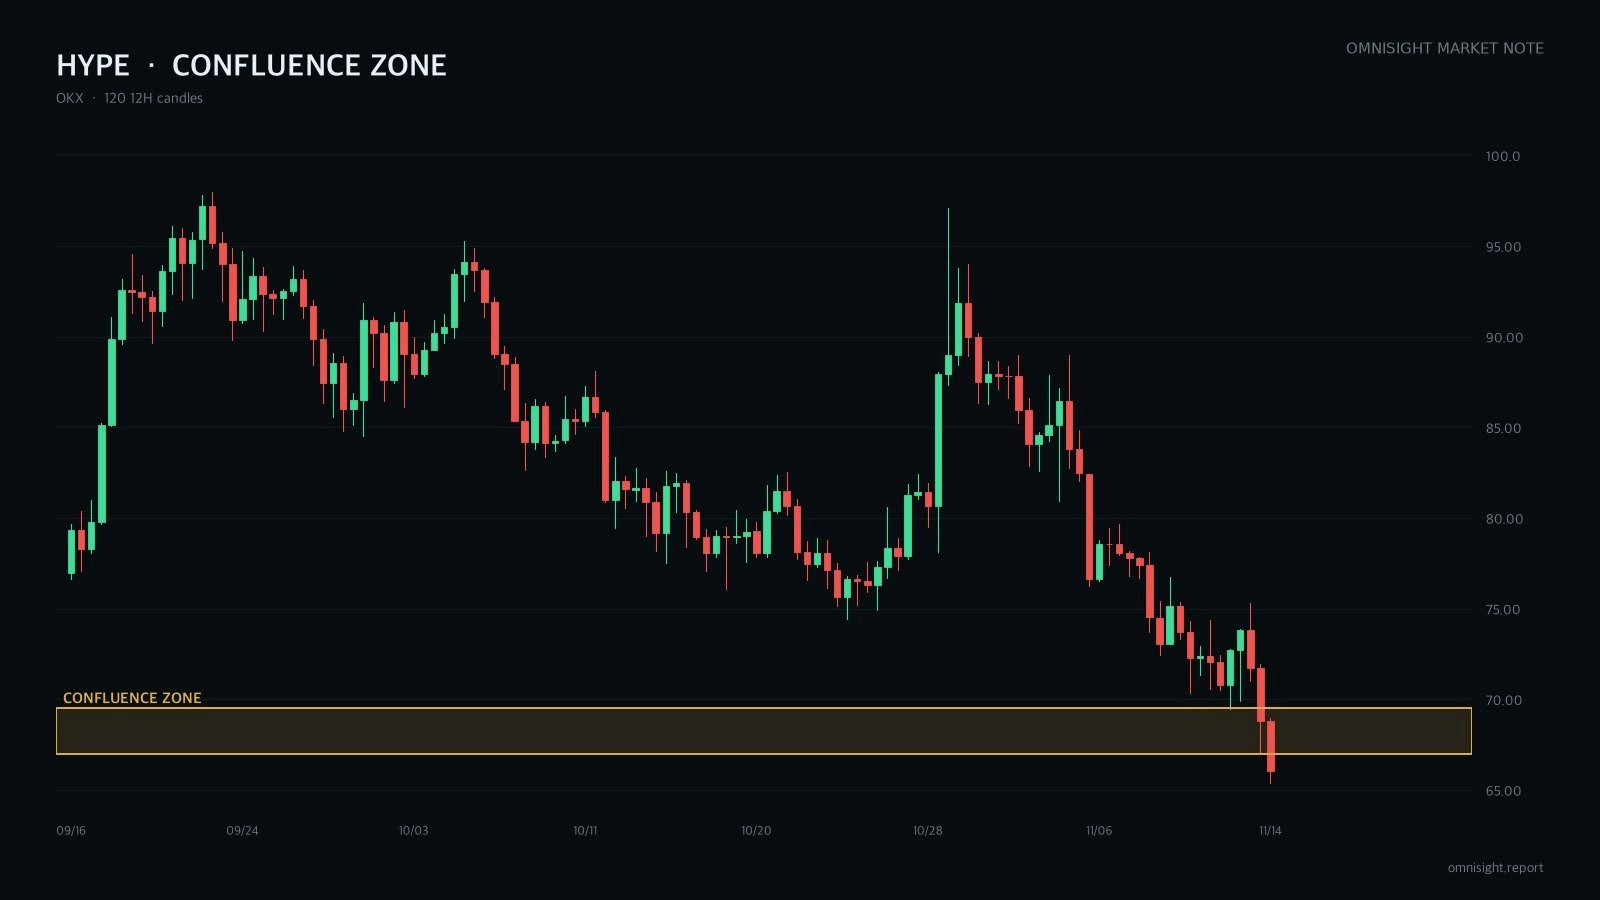
$HYPEUSDT rompió su promedio de un año y el piso anterior al cierre en dos días. Tengo un sesgo bajista, pero no voy a vender aquí. Estoy esperando un rebote de vuelta al soporte roto. El precio está en la parte baja del movimiento. Perseguirlo es una mala operación. La caída atravesó el soporte diario y de 12 horas sin recuperación. Las temporalidades más bajas muestran divergencia alcista, así que un rebote corto parece probable primero. Por qué esa zona: - Un gap de 4h que dejó la venta masiva - El retroceso de 0.618–0.705 del último tramo bajista - Un retesteo del piso roto desde abajo Tres razones en una banda estrecha hacen que sea un plan, no una adivinanza. Visión de ICT: la liquidez del lado de venta debajo de los mínimos anteriores no fue barrida y recuperada. Fue atravesada directamente. Eso convierte el nivel en resistencia. Un rebote a la mitad premium del tramo sobre un bloque de órdenes bajista es donde los vendedores obtienen el mejor precio. Dónde estoy equivocado: un cierre de 4h por encima del gap superior de 12h y la EMA de 20 de 4h significa que la estructura cambió, no es solo un retroceso. Ahí me retiro. Riesgos: esto viene justo después de que BTC tocara un mínimo de tres meses y una cascada de liquidaciones, así que los movimientos pueden ser violentos. Si el precio sigue deslizándose sin un rebote, la orden se queda sin ejecutar y no persigo el precio. Esto no es consejo de inversión. Todas las decisiones y la responsabilidad son tuyas. #IMPACTbyTrade

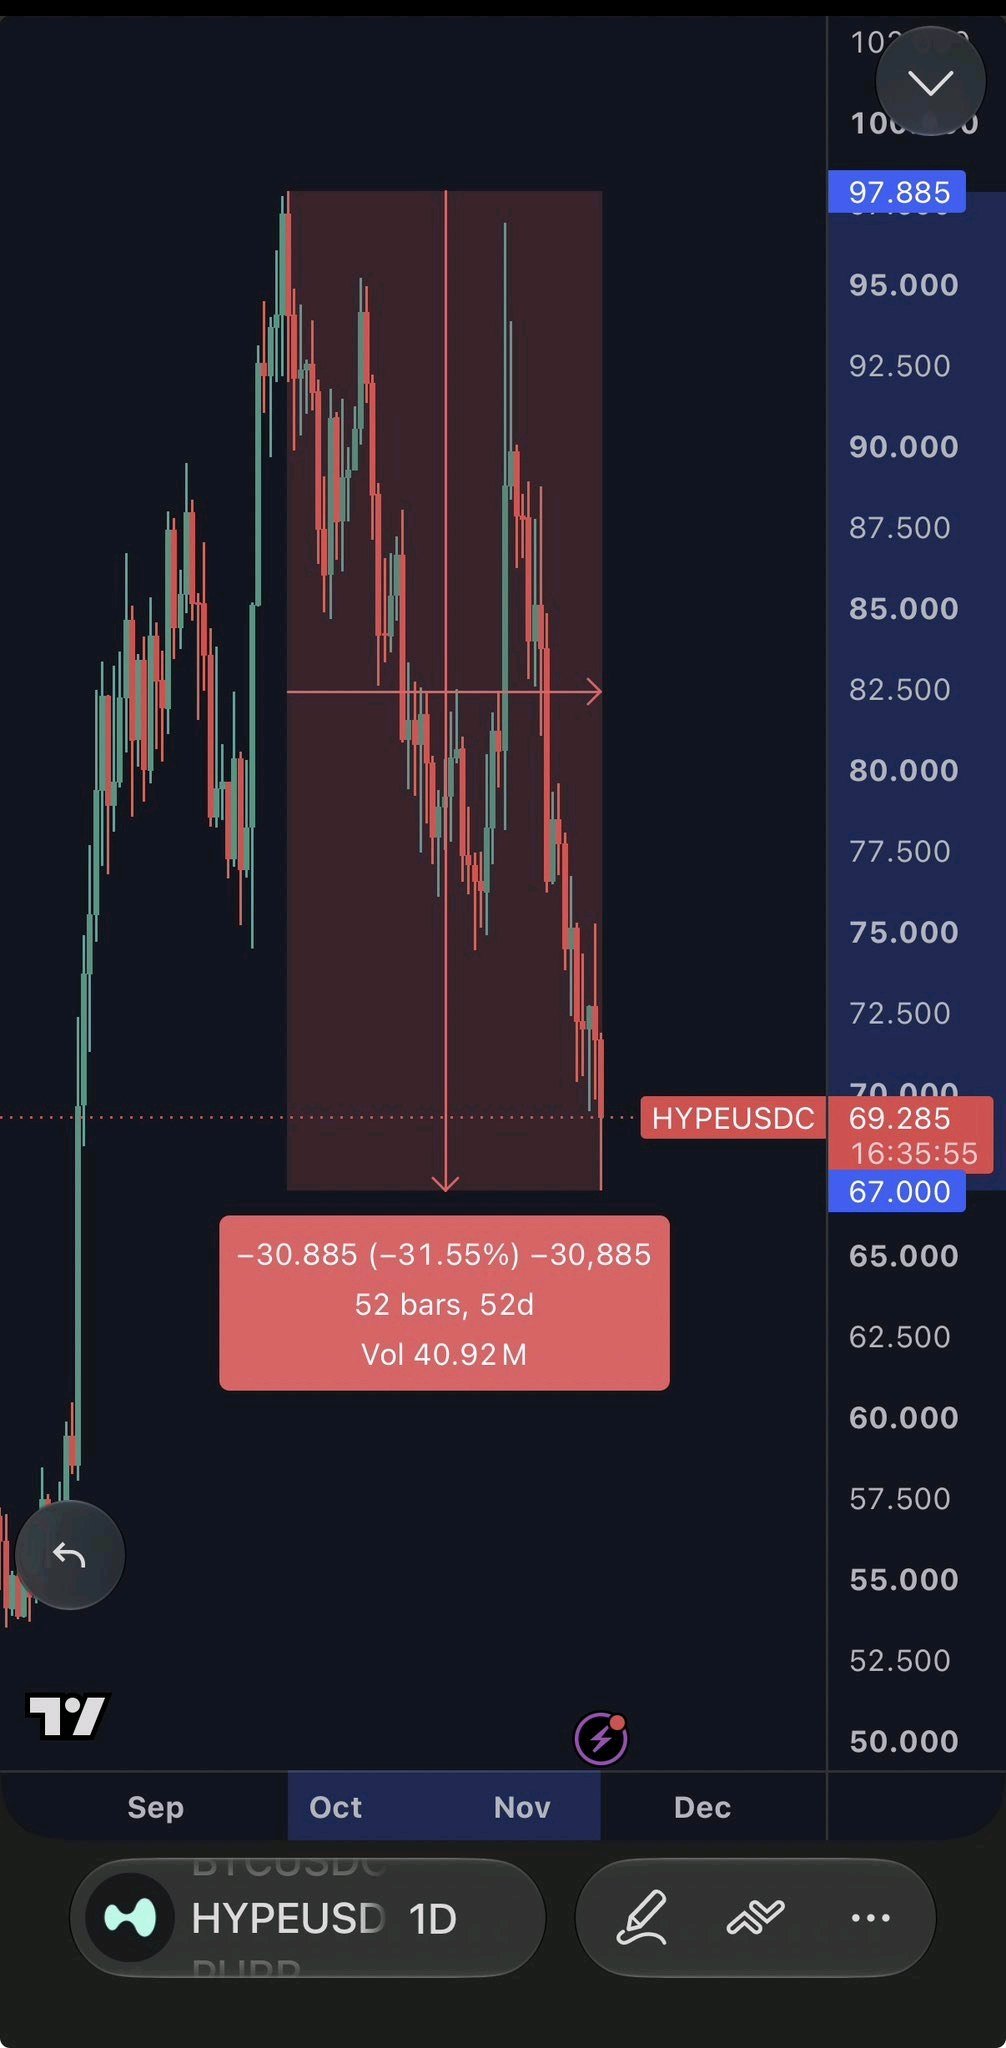
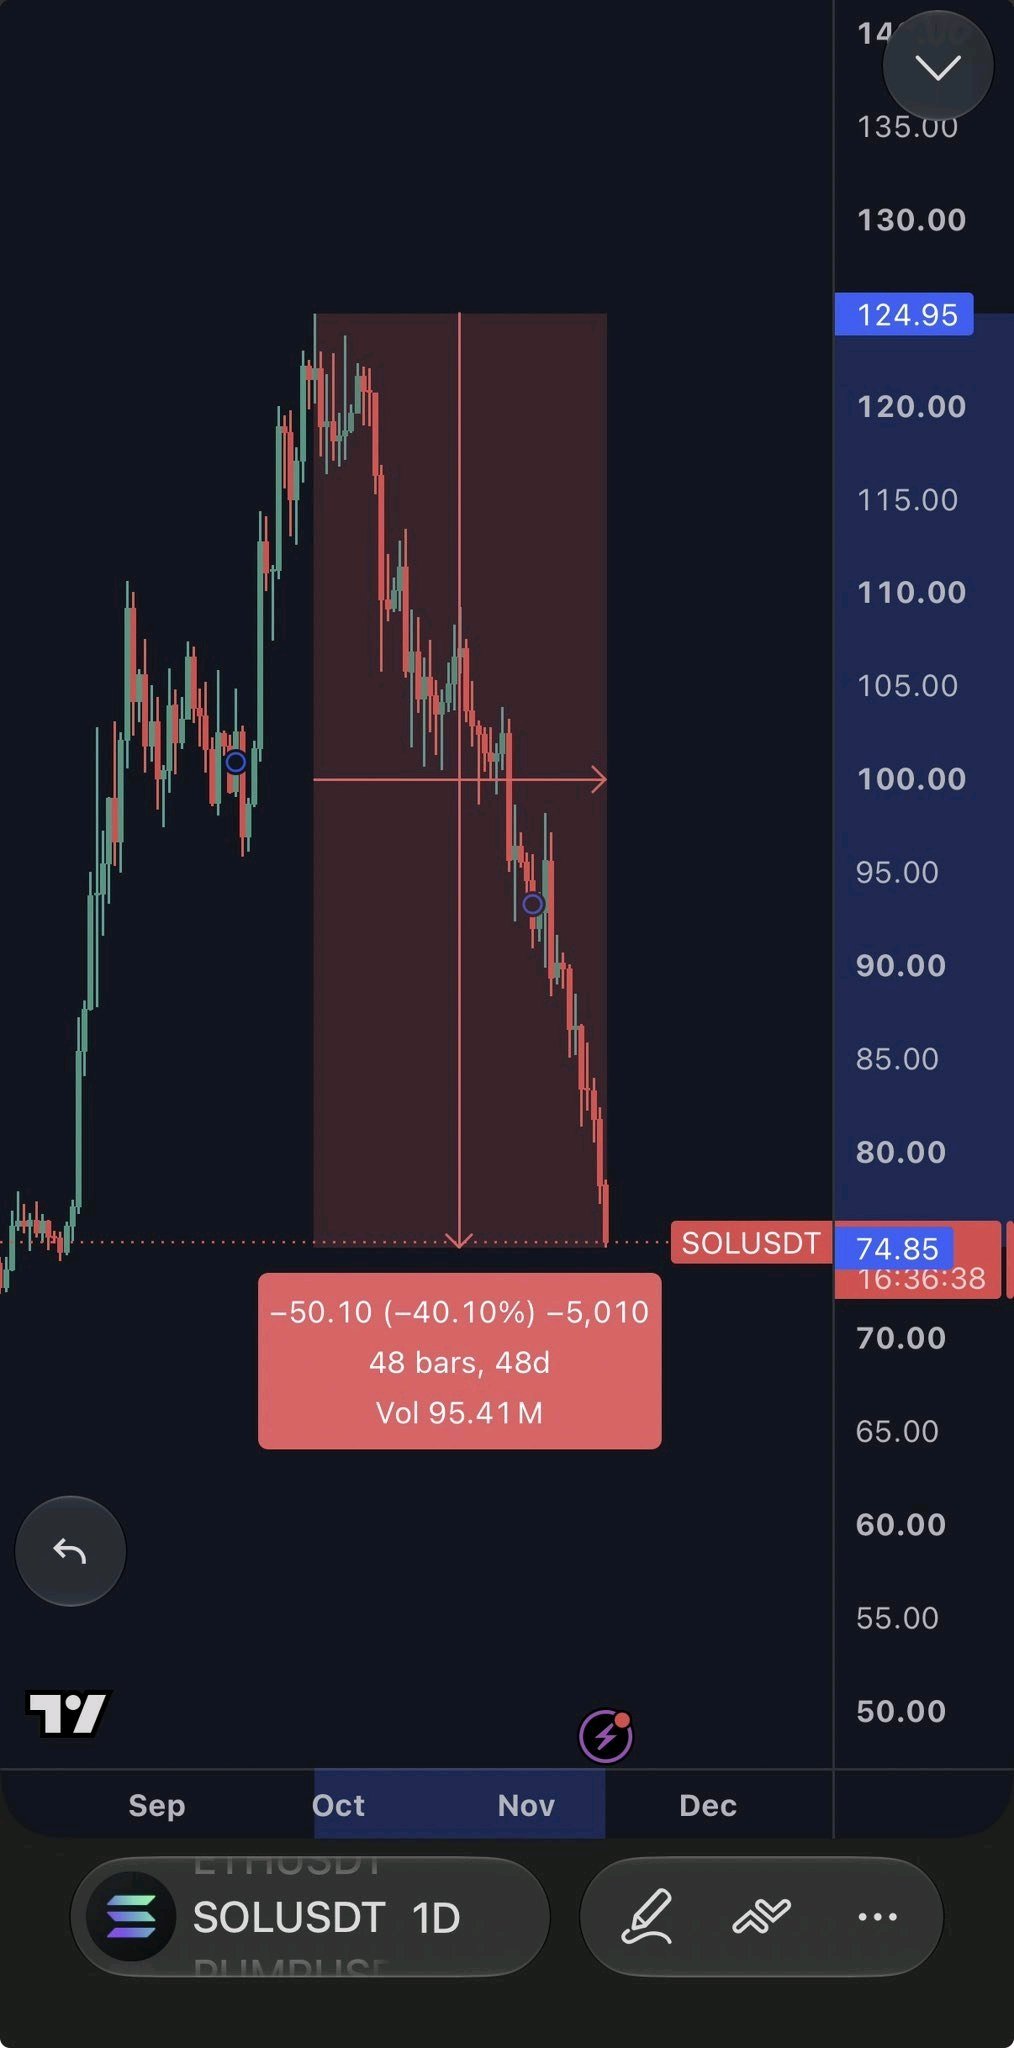
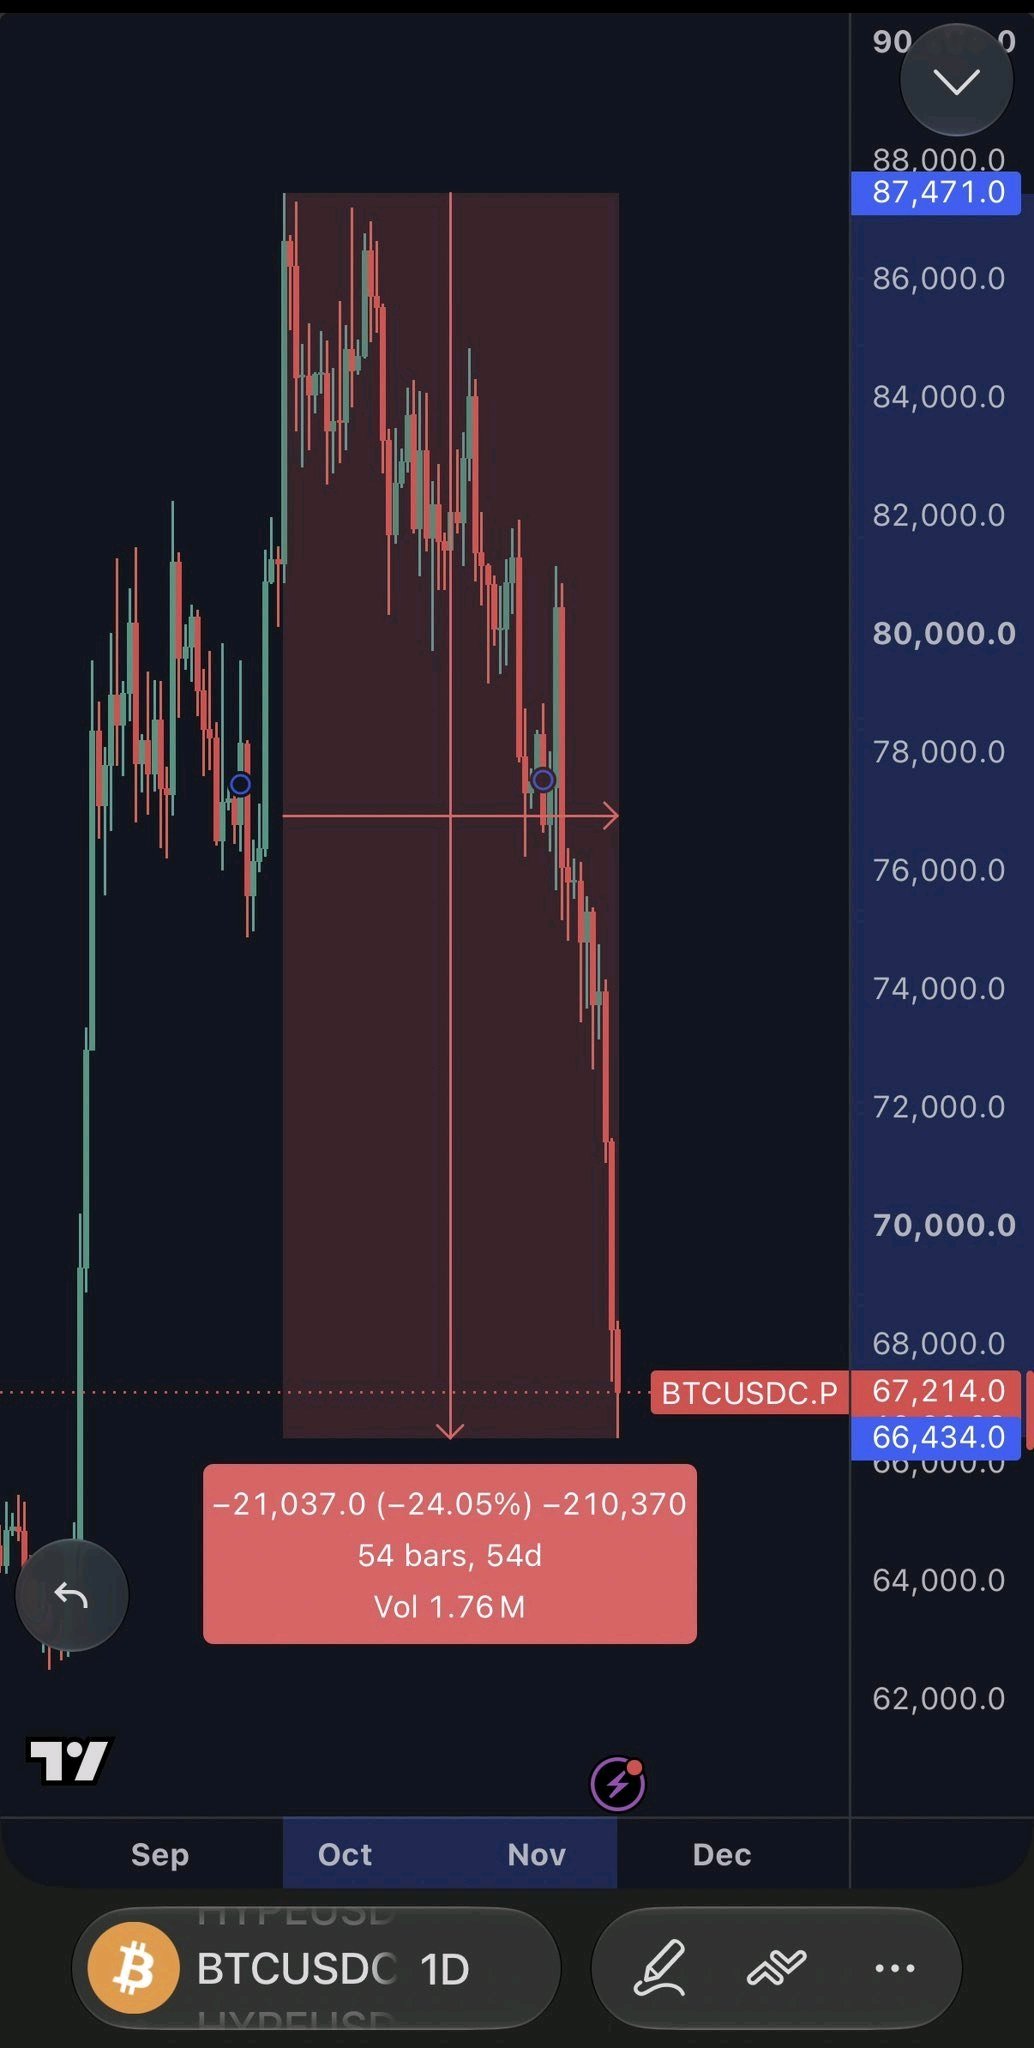
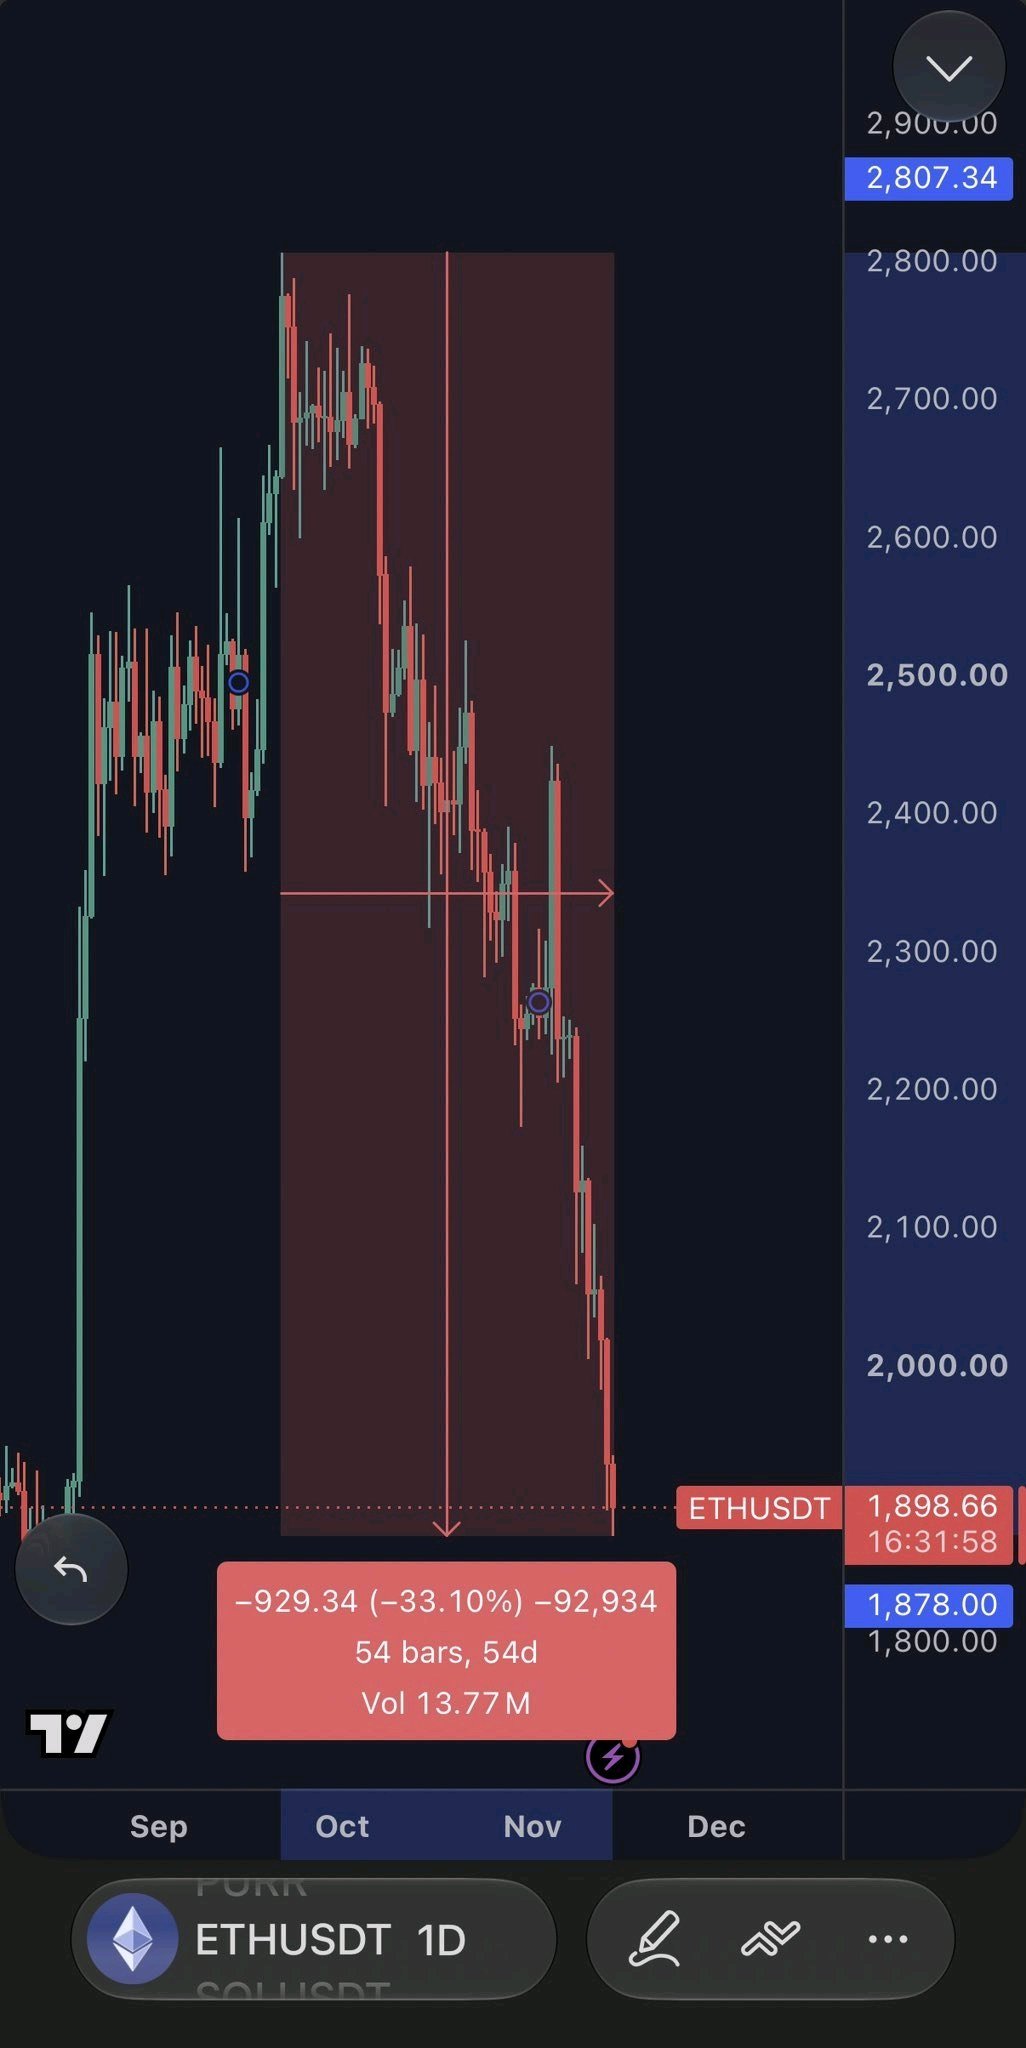
People are complaining about $HYPEUSDT but what about $SOLUSDT ?? With a 2.5x bigger market cap, $SOL is still down more (-40%) from its top 48 days ago and -75% from its ATH 669 days ago. $ETH is down 33% from its top 54 days ago and -62% from its ATH 457 days ago. $BTC is down 24% from its top 61 days ago and -47% from its ATH 396 days ago. Meanwhile, $HYPE is down 31% from its top 52 days ago, but unlike all the others above, that top was its ATH lol Sell EVERYTHING (all majors included), buy spot $HYPE and chill. Why buy majors like $ETH, $SOL or even $BTC that dump harder when the market is nuking and underperform when the market is going back up?? Why not invest in the only coin among those that has the biggest and most diversified revenue stream in the entire crypto industry? 99% of that revenue goes directly toward supporting the price every single day. Yeah, because only the revenue that benefits holders matters, not just the revenue itself. If your shitty project is generating a lot of revenue but gives only 10% of it back to the community, who fuckin cares. All of this while having a lower market cap than all those majors, meaning even bigger upside potential. People are like “yeah but HYPE already performed a lot” but are buying $BTC, $ETH or even $SOL lol There is no second best. Hyperliquid. #IMPACTbyTrade
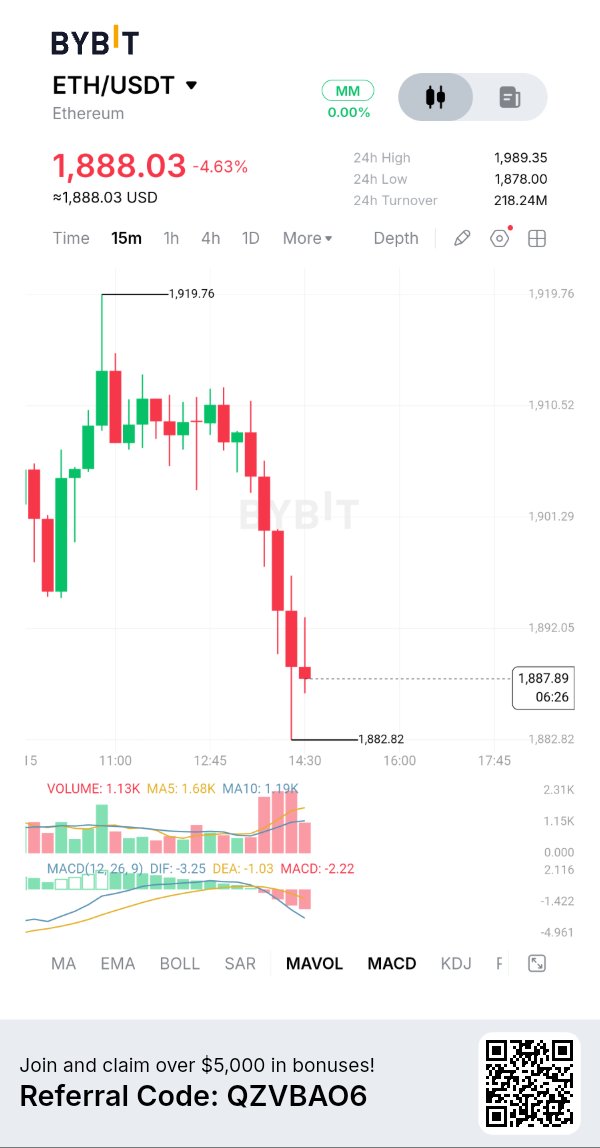
Ethereum is facing renewed selling pressure, with $ETHUSDT trading around $1,888.03, down approximately 4.63% in the supplied Bybit snapshot. The latest decline is particularly interesting because it follows an earlier attempt to stabilize around the $1,910 region. Sellers have now pushed price toward the $1,882 area, putting short-term support under pressure. The important question is whether buyers can defend this region or whether Ethereum is preparing for another leg lower. FUNDAMENTAL ANALYSIS Ethereum remains one of the most important smart-contract ecosystems, supporting decentralized finance, stablecoins, tokenization and thousands of applications. Its network activity remains encouraging. Ethereum Institutional's November 5 research reported that mainnet averaged 2.17 million daily transactions between January and October 2026, up 54% year over year. Stablecoin transfers on Ethereum mainnet also reached approximately $25.8 trillion during that period, demonstrating the network's importance in global on-chain financial activity. Another development worth monitoring is Glamsterdam, Ethereum's upcoming upgrade focused on improving execution capacity and network efficiency. Its activation schedule remains subject to testing and confirmation. The long-term fundamentals remain interesting, but network adoption does not automatically translate into immediate ETH price appreciation. TOKENOMICS ETH has no fixed maximum supply. Its monetary model combines staking-related issuance with transaction-fee burning through EIP-1559. This creates a dynamic supply structure: ETH can become deflationary when burning exceeds issuance, but it can also experience net inflation when issuance exceeds burning. Staking remains important because it secures the network while reducing the amount of ETH freely available for trading. The relationship between network activity, staking participation and fee burning remains essential when evaluating ETH's long-term value. MACRO + MARKET The broader market environment is currently challenging. Bitcoin has experienced renewed selling pressure, while November's market research highlights weakening institutional demand and substantial outflows from spot crypto investment products. Binance Research also reported that total cryptocurrency market capitalization declined 9.1% to approximately $2.70 trillion in its November market review. Additionally, expectations of further Federal Reserve tightening are creating pressure on risk-sensitive assets. Ethereum is unlikely to escape these broader market conditions. A sustained recovery will require improvements in both ETH-specific demand and overall market sentiment. CHART + INDICATORS According to the supplied Bybit 15-minute chart: Current price: $1,888.03 24H change: -4.63% 24H high: $1,989.35 24H low: $1,878.00 24H turnover: $218.24M Visible chart high: $1,919.76 Recent chart low: $1,882.82 The chart shows a sharp decline from the $1,910 region, with consecutive bearish candles pushing ETH toward the session low. MACD readings: DIF: -3.25 DEA: -1.03 Histogram: -2.22 The negative histogram and falling MACD lines indicate strengthening short-term bearish momentum. Volume currently reads 1.13K, below MA5 at 1.68K and slightly below MA10 at 1.19K. This suggests that selling pressure is significant, although participation is not exceptionally strong compared with the recent averages. The immediate support zone is $1,882–$1,878. Initial resistance sits around $1,892, followed by $1,901 and $1,910. BULLISH SCENARIO For buyers to regain control, ETH first needs to defend the $1,878–$1,882 support region. A recovery above $1,892 would be an early indication that selling pressure is easing. A stronger move above $1,901, supported by improving volume, could open the way toward $1,910 and eventually $1,919. I would want to see a confirmed breakout and successful retest rather than treating one green candle as a trend reversal. BEARISH SCENARIO If ETH loses $1,878 on a confirmed 15-minute close, sellers could extend the decline. The next important downside reference would be the psychological $1,850 region, followed by $1,830 if broader selling pressure continues. A quick recovery above $1,892 would weaken the immediate bearish setup. MY TRADING PLAN I would avoid entering blindly while ETH is approaching support. For a bullish position, I want to see buyers defend $1,878 and reclaim $1,892 with stronger volume. For a bearish position, I would prefer a confirmed breakdown below $1,878 followed by a failed recovery attempt. MY INTERPRETATION The biggest concern is the combination of consecutive bearish candles and a negative MACD histogram. Although Ethereum's fundamentals remain strong, the current chart does not yet show convincing evidence that buyers are ready to reverse the decline. #IMPACTbyTrade

Core’s TVL Plunges Nearly 40% in a Single Day
$COREUSDT total value locked (TVL) has fallen to approximately $2 million, marking a nearly 40% decline in just 24 hours. Most of the remaining DeFi value is concentrated in a single protocol, @b14g_network, the dual staking layer that previously accounted for much of the activity across the $CORE ecosystem. The decline is particularly striking given that Core’s TVL exceeded $800 million at its peak in late 2024 and remained in the hundreds of millions throughout 2025. Today, only a small fraction of that value remains. Despite the sharp contraction, the blockchain continues to process tens of thousands of transactions daily. However, transaction fees are nearly zero, while liquidity has become extremely limited. Core’s situation highlights the risks of an ecosystem relying too heavily on a single protocol. When most DeFi activity depends on one project, a single vulnerability or setback could undermine the entire ecosystem’s growth narrative. #IMPACTbyTrade

$HYPEUSDT lost the floor it held for two days, and it didn't just wick it. Two big hourly candles closed through on roughly 4x normal volume. I'm short-biased, waiting for a bounce back into that broken floor. The catch: it's already oversold, so no chasing. Since the cycle high, both highs and lows have been stepping lower on the daily and 12h. Why the retest area matters: - The broken floor, the daily 200 EMA and today's unfilled hourly gap stack in one place. - It also lines up with the deep retracement of today's drop. - A first retest of old support is where sellers tend to reappear. That overlap is why it's a zone, not a single line. On ICT, the liquidity below the floor wasn't swept and reclaimed. It was taken with closes. That turns the old floor into resistance, and the upper half of today's drop becomes the area to sell into, not chase. I'm wrong if a 4h close reclaims today's high along with the short-term averages. That's a reversal, not a pullback, and the short case is gone. Risks: BTC just hit a 12-week low after heavy liquidations, so sharp squeezes can hit. HYPE's own tailwinds (rising open interest, buybacks) may slow the drop. Not investment advice. All decisions and responsibility are your own. #IMPACTbyTrade
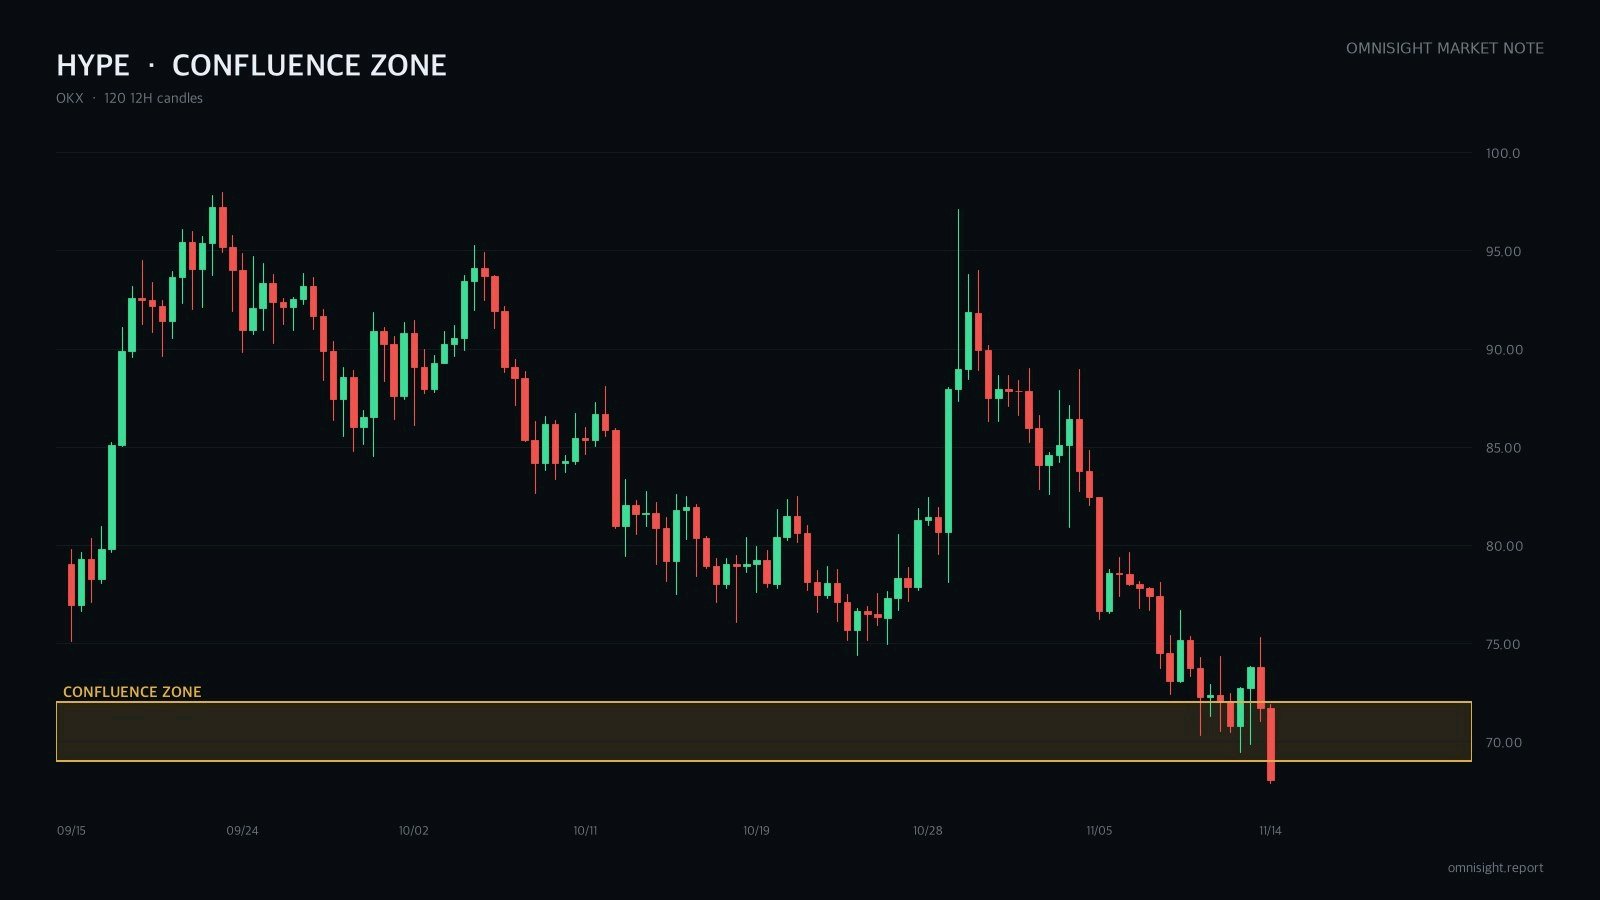
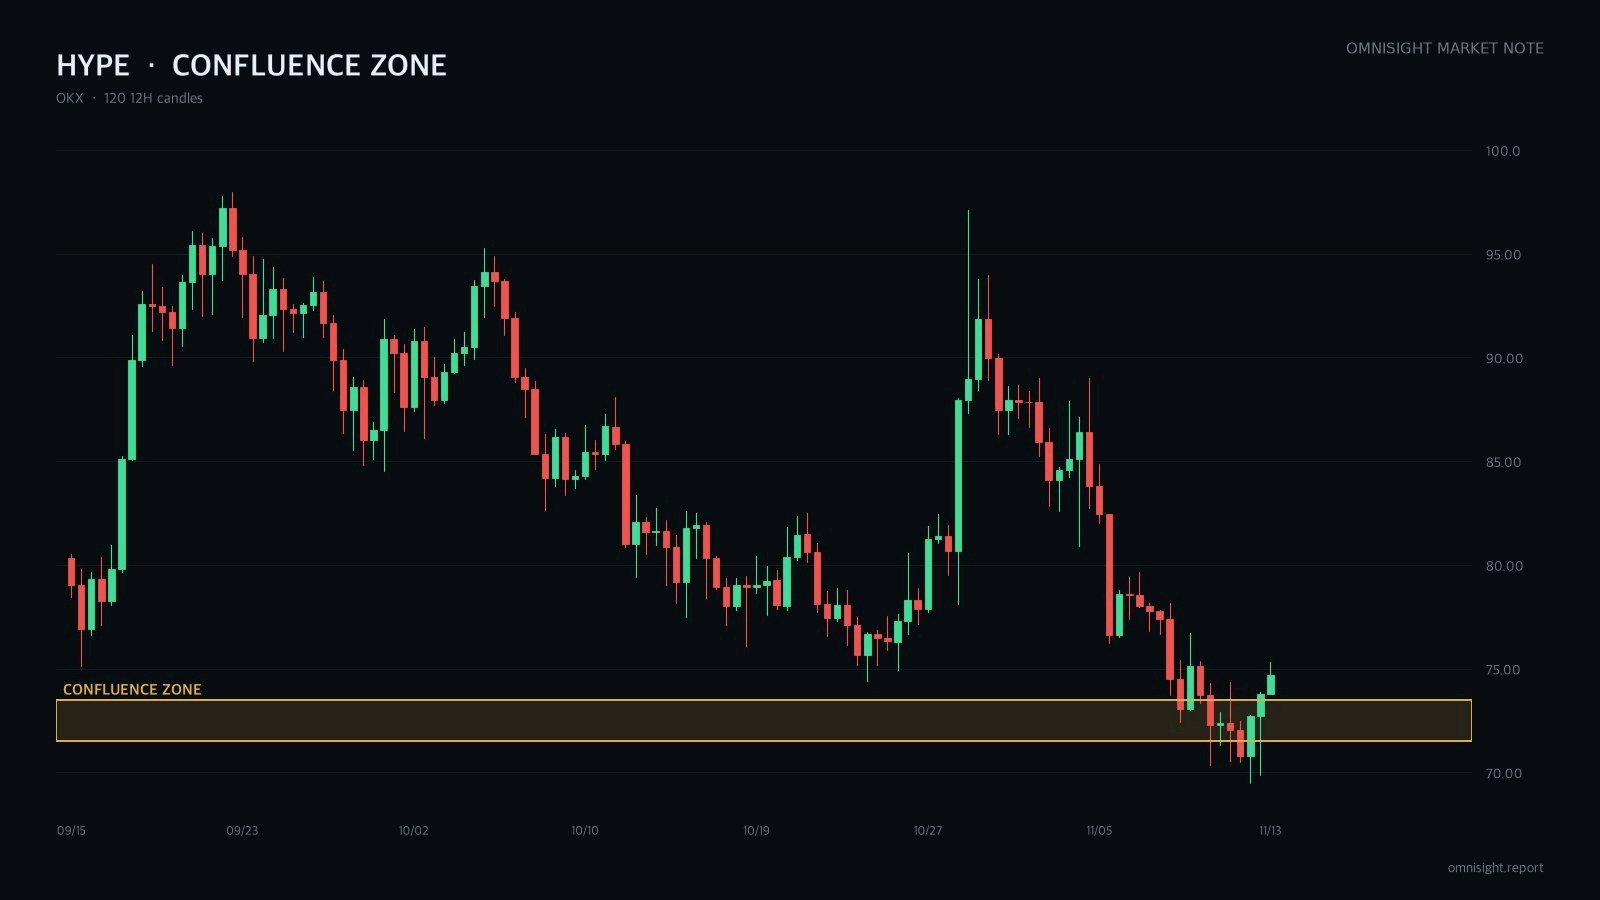
$HYPEUSDT mantuvo su soporte en un día en que Bitcoin cayó a un mínimo de 12 semanas. Marcó un mínimo más alto y superó el último máximo de rebote. Me inclino a ir en largo, pero no voy a perseguir el precio. El cierre de 4h aún no ha confirmado la ruptura, así que quiero un retroceso hasta donde empezó el breakout. Contexto: la caída desde el máximo anterior parece una corrección de cinco ondas terminada. El mínimo se produjo con un volumen alto, y la prueba de hoy se mantuvo más arriba con un volumen aún mayor. - Tres de los cuatro métodos técnicos se inclinan por el largo; solo ICT está en contra. - La zona de retroceso agrupa el promedio a corto plazo de 4h, un fair value gap del movimiento de hoy y el rango anterior a la ruptura. - El mínimo también se sitúa sobre la EMA 200 diaria. Tres razones en un mismo punto es la razón por la que prefiero esperar ahí en lugar de perseguir el precio. Divergencia: a través de tres mínimos de 4h, el precio bajó cada vez mientras que el impulso del RSI y MACD subió en cada ocasión. Los vendedores perdieron fuerza en cada empujón hacia abajo. El gráfico diario aún no lo confirma, así que lo trato como una señal de 4h, no como un cambio de tendencia. Si el precio rompe justo por debajo de este mínimo, estaba equivocado. Ese mínimo ancla la divergencia, así que perderlo anula mi lectura. Riesgos: más de $1.6B liquidados en un día dejan esto muy inestable. El gráfico diario y el de 12h todavía muestran máximos más bajos, con resistencia de medias móviles por encima. No es un consejo de inversión. Todas las decisiones y la responsabilidad son tuyas. #IMPACTbyTrade
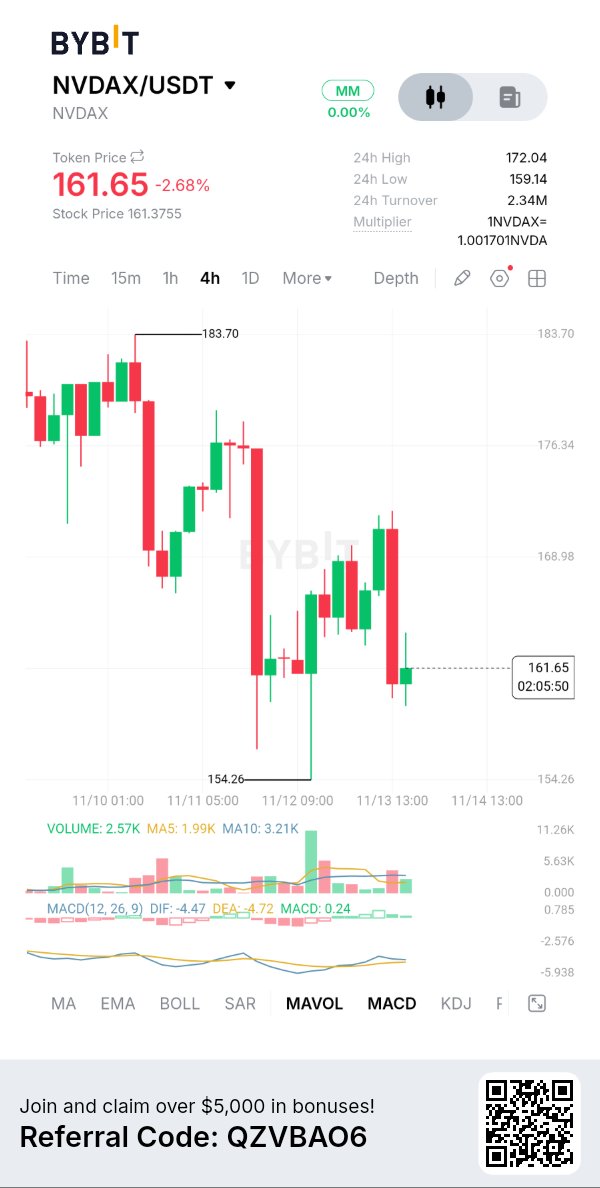
$NVDAXUSDT provides tokenized economic exposure to NVIDIA Corporation, one of the most important companies in the artificial intelligence and semiconductor industries. The product is issued by Backed Assets (JE) Limited and structured as a tracker certificate backed by the underlying NVIDIA shares. This means holders receive economic exposure rather than direct ownership or shareholder voting rights. NVIDIA's fundamentals remain important to this market. Its Q2 FY2027 results reported $96.2 billion in revenue, representing 106% year-over-year growth, with data-center revenue reaching $89 billion. However, strong company performance does not guarantee immediate price appreciation. Market expectations, valuation and investor sentiment remain important factors. TOKENOMICS AND STRUCTURE Unlike conventional cryptocurrencies, NVDAX does not have a mining or inflation-based token supply model. Its value is linked to the underlying NVIDIA stock exposure, with the issuer maintaining collateral arrangements for the product. The issuer currently lists no management fee, although issuance, redemption and third-party trading fees may apply. Investors should also consider issuer, custody, liquidity and market-hours risks. MACRO + MARKET The broader technology market is facing increased uncertainty. NVIDIA shares have recently experienced significant selling pressure, with investors watching developments surrounding company leadership, AI spending and the upcoming November 17 earnings announcement. This matters because NVDAX ultimately reflects exposure to NVIDIA rather than an independent crypto ecosystem. Weakness in technology stocks could continue weighing on the token, even if the wider cryptocurrency market begins recovering. CHART + INDICATORS According to the supplied Bybit 4-hour chart: Current price: $161.65 24H change: -2.68% 24H high: $172.04 24H low: $159.14 24H turnover: $2.34M Major chart resistance: $183.70 Recent swing low: $154.26 The chart shows a recovery attempt following a significant decline. However, the recent rejection around $168–$169 suggests sellers are still active. BEARISH SCENARIO Failure to reclaim $168.98 could leave NVDAX vulnerable to another decline. A break below the $159.14 area would weaken the immediate recovery structure, while losing $154.26 would expose the chart to further downside. MY TRADING PLAN I would not chase the current rebound. My preference is to wait for a confirmed breakout above $168.98 and a successful retest before considering a bullish position. If price continues struggling below resistance, patience is preferable to forcing an entry. Position sizing should account for the volatility of the underlying stock and the additional risks associated with tokenized securities. #IMPACTbyTrade
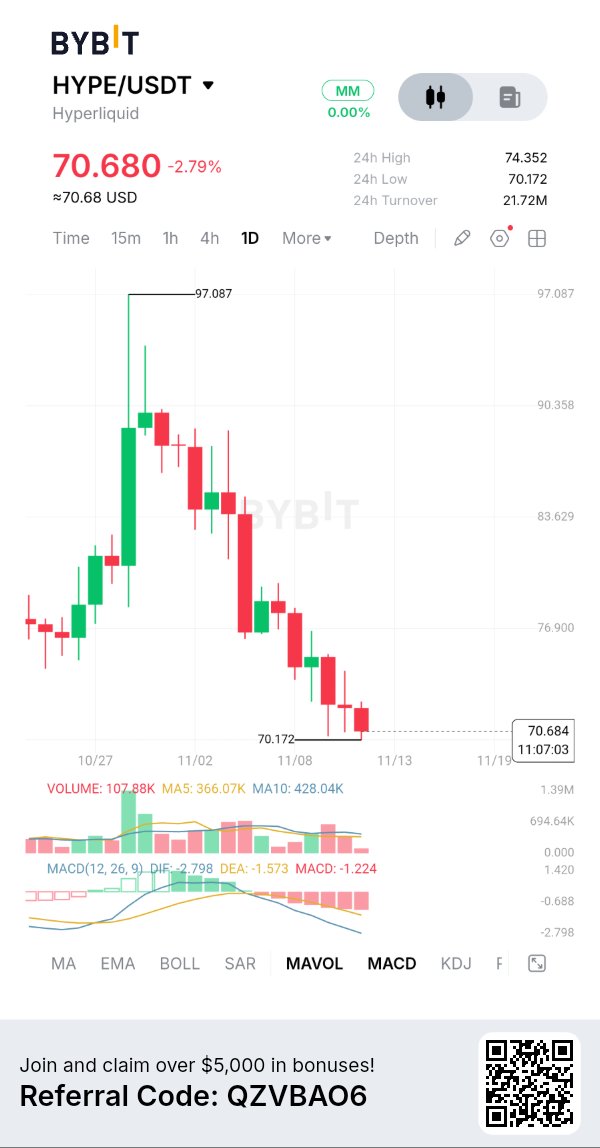
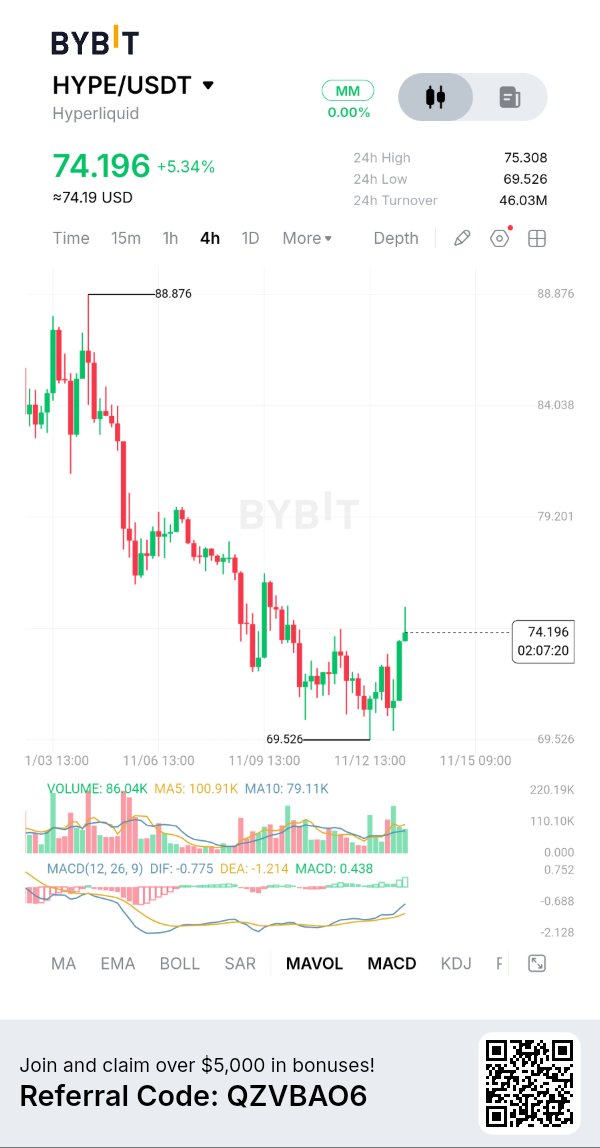
Hyperliquid muestra un renovado interés de compra después de un periodo prolongado de debilidad. Su token nativo, $HYPEUSDT , ha subido aproximadamente un 5.34% en la instantánea de mercado proporcionada, recuperándose de la región de $69.526 para cotizar alrededor de $74.196. La recuperación es importante porque llega tras una caída prolongada desde el máximo del gráfico de $88.876. Los compradores están empezando a desafiar la estructura bajista previa, pero el mercado aún necesita reclamar niveles de resistencia más altos antes de que se pueda establecer una reversión duradera. Mi atención está puesta en si esta recuperación puede atraer un volumen sostenido y traducirse en una estructura de mercado más fuerte. ANÁLISIS FUNDAMENTAL Hyperliquid se ha desarrollado más allá de un exchange descentralizado de futuros perpetuos convencional. Su ecosistema se está expandiendo hacia mercados financieros adicionales, incluyendo la exposición a activos tokenizados del mundo real y el trading basado en eventos. Un desarrollo importante es HIP-3, que permite a equipos de terceros implementar sus propios mercados perpetuos en Hyperliquid. Según una investigación del tercer trimestre de 2026 de Bitwise, los mercados HIP-3 generaron aproximadamente $261.5 mil millones en volumen trimestral, lo que representa el 36.5% del volumen total de trading de perpetuos. Hyperliquid también registró $730.1 mil millones en volumen total de trading durante el trimestre. Otro desarrollo importante es HIP-4, que expande el ecosistema hacia mercados de resultados totalmente colateralizados. Estos desarrollos son importantes porque demuestran que Hyperliquid está intentando construir una infraestructura de trading financiero más amplia en lugar de depender exclusivamente de los perpetuos cripto. Sin embargo, la expansión del ecosistema debe traducirse, en última instancia, en una actividad económica sostenible y en demanda de HYPE. TOKENOMICS HYPE tiene un suministro máximo de 1 mil millones de tokens. Su asignación incluye: 31% distribuido a través del airdrop original de Génesis. 38.9% reservado para futuras emisiones y recompensas a la comunidad. 23.8% asignado a los contribuyentes principales. HYPE también desempeña varios roles dentro del ecosistema, incluyendo staking, gobernanza y utilidad relacionada con el colateral. Una consideración importante es el cronograma de vesting continuo. Las futuras liberaciones de tokens pueden aumentar el suministro disponible y potencialmente crear presión de venta. Por lo tanto, el crecimiento del ecosistema debe evaluarse junto con el suministro circulante, la participación en staking y la distribución de tokens. Un protocolo exitoso no garantiza automáticamente la apreciación de su token nativo. MACRO + MERCADO El entorno macroeconómico general sigue siendo importante para los activos especulativos. La Reserva Federal mantuvo su rango objetivo de tasas de interés en 3.75%–4% tras su decisión del 28 de octubre. Sin embargo, los comentarios del presidente de la Fed de Nueva York, John Williams, el 13 de noviembre indican que la inflación sigue siendo una preocupación y que la incertidumbre sobre la política monetaria no ha desaparecido. Para HYPE, esto significa que el apetito general por los activos de riesgo sigue siendo una variable importante. La dirección de Bitcoin, la liquidez institucional y la actividad general del mercado de derivados podrían influir en si la recuperación actual se convierte en algo más fuerte. GRÁFICO + INDICADORES Mi gráfico de 4 horas de Bybit proporcionado muestra: Precio actual: $74.196 Cambio en 24 horas: +5.34% Máximo en 24 horas: $75.308 Mínimo en 24 horas: $69.526 Volumen de negociación: $46.03M Máximo reciente del gráfico: $88.876 Mínimo reciente del gráfico: $69.526 El gráfico muestra una recuperación desde el área de $69.526, con varias velas alcistas consecutivas empujando el precio de vuelta hacia $74. La primera resistencia importante se encuentra alrededor de $75.308. Una ruptura exitosa podría poner el foco en $79.201, seguido de $84.038. El MACD muestra una mejora alentadora: DIF: -0.775 DEA: -1.214 Histograma: +0.438 El histograma positivo indica una mejora en el impulso alcista. Sin embargo, ambas líneas del MACD permanecen por debajo de cero, por lo que aún no se confirma una reversión alcista más amplia. El volumen actualmente marca 86.04K, comparado con la MA5 en 100.91K y la MA10 en 79.11K. Esto sugiere que la participación ha mejorado en relación con el promedio de 10 periodos, aunque la lectura más reciente permanece por debajo de la MA5. Un volumen más fuerte haría que la recuperación fuera más convincente. ESCENARIO ALCISTA Mi confirmación alcista sería un cierre decisivo de 4 horas por encima de $75.308, seguido de un retest exitoso. Si los compradores defienden la ruptura, $79.201 se convierte en la siguiente resistencia importante. Un movimiento sostenido por encima de esa región podría abrir la posibilidad de probar los $84.038. La configuración alcista se debilitaría si el precio pierde el área reclamada de $74 y no logra recuperarla. ESCENARIO BAJISTA Si HYPE enfrenta rechazo alrededor de $75.308, los vendedores podrían empujar el precio de vuelta hacia la región de $74.038. La falta de mantenimiento de esta área de recuperación aumentaría la posibilidad de otra prueba del soporte inferior. El mínimo oscilante de $69.526 sigue siendo la referencia bajista crítica en el gráfico proporcionado. Una ruptura decisiva por debajo de ese nivel invalidaría la estructura de recuperación actual y debilitaría significativamente el argumento alcista. #IMPACTbyTrade

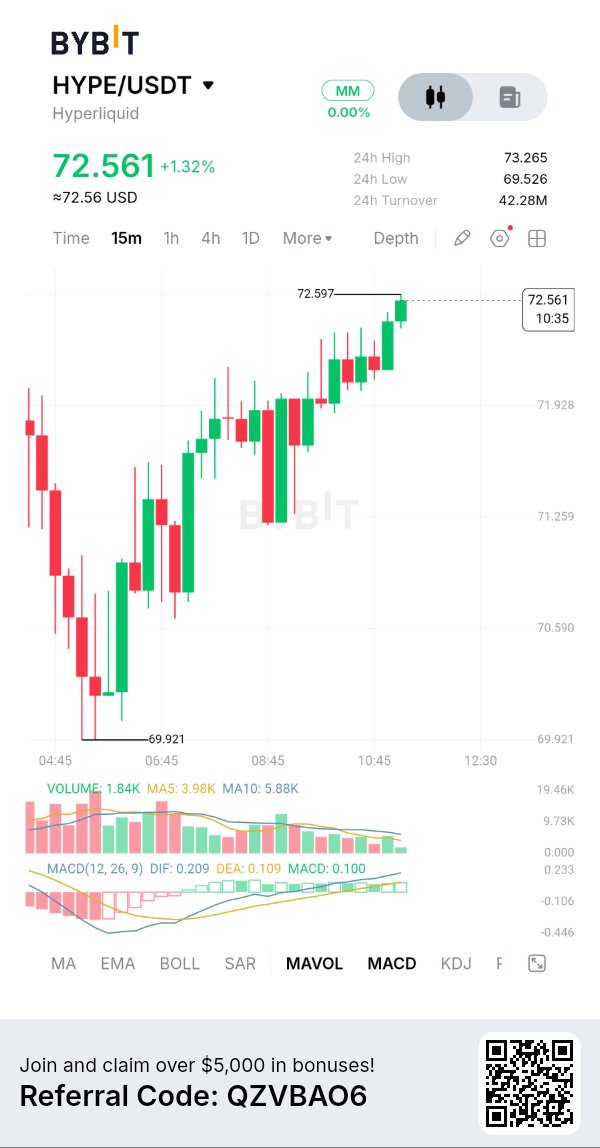
$HYPEUSDT is currently trading around $72, down 3.34%, following a sharp sell-off on the hourly chart. The price briefly dropped below $71 before buyers stepped in, triggering a recovery toward $72. Now we're seeing consolidation as trading volume begins to cool down. What stands out to me is the buying response after the sell-off. The market is still under pressure, but buyers are clearly defending the lower levels. For now, I'm watching whether $HYPE can reclaim $73 and build momentum toward $74. Short-term volatility doesn't change my long-term conviction in Hyperliquid. $HYPE is approaching a critical phase in its long-term market structure. This daily chart presents an interesting Elliott Wave scenario, with several potential price targets depending on how the current correction develops. Key levels highlighted: - $74.62 — critical support and bullish wave-count invalidation level - $68.75 — potential deeper correction target - $62.58 — extended downside target - $100–$110 — potential recovery toward the 5-month channel resistance - $128–$140 — longer-term 2-year channel resistance zone The broader ascending channel remains an important part of the bullish thesis, but the correction needs to complete before higher targets become realistic. What interests me most is the distinction between short-term weakness and the larger market structure. A decline toward support doesn't automatically mean the long-term trend is over. However, losing key levels could significantly change the technical outlook. I'm watching for stabilization, renewed buying pressure, and confirmation of a trend reversal before treating the higher targets as achievable. Hyperliquid's fundamentals remain my long-term focus, but price action still needs to confirm the bullish scenario. #IMPACTbyTrade

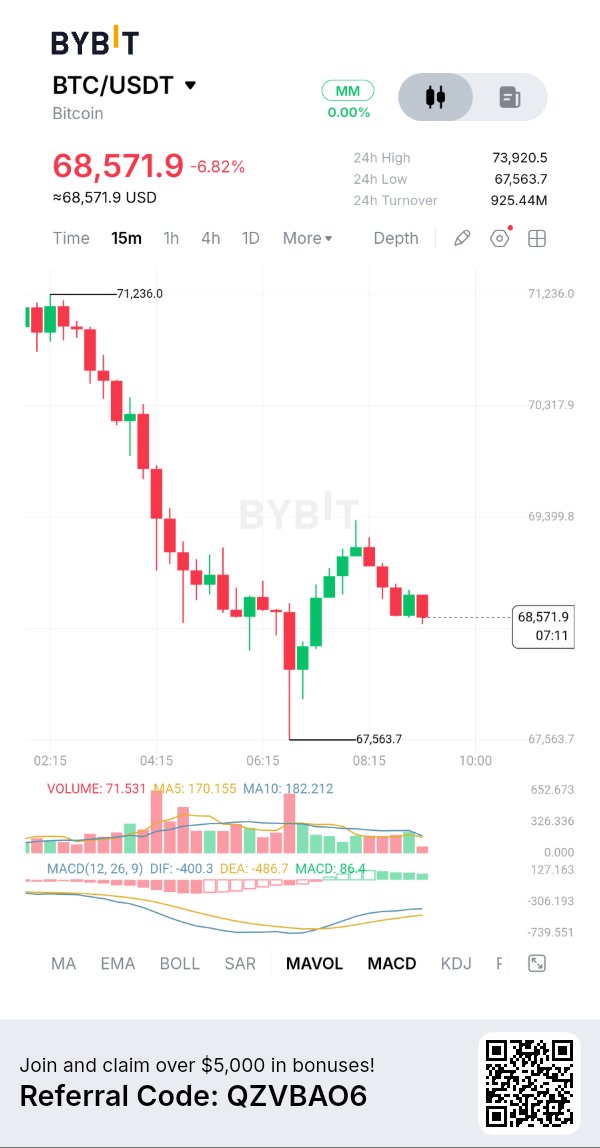
$BTCUSDT broke down hard today, and every timeframe I track is still printing lower highs and lower lows. I'm bearish, but I'm not selling here. I'm waiting for a bounce into the gap the drop left behind. The problem: momentum is extremely oversold, and shorting into that is how you get squeezed. Price lost the bottom of its 4h box and sits below the key moving averages on every timeframe. What lines up: - The selloff left two stacked price gaps above, on the 1h and 4h. - A broken round number sits right in that area. - The midday candle that started the collapse opened there too. When a gap fill, a lost round number and the breakdown origin overlap, a bounce has a clear place to stall. ICT read: higher-timeframe bias is down, and ICT sells the retracement into imbalance, not the low. The zone isn't a deep premium short, and I accept that. Where I'm wrong: if price reclaims today's breakdown high, the structure is repaired and the idea is gone. Risks: funding has turned negative after heavy liquidations, so a short-covering spike can blow through the zone. If there's no bounce at all, the order may never fill. Not investment advice. All decisions and responsibility are your own. #IMPACTbyTrade

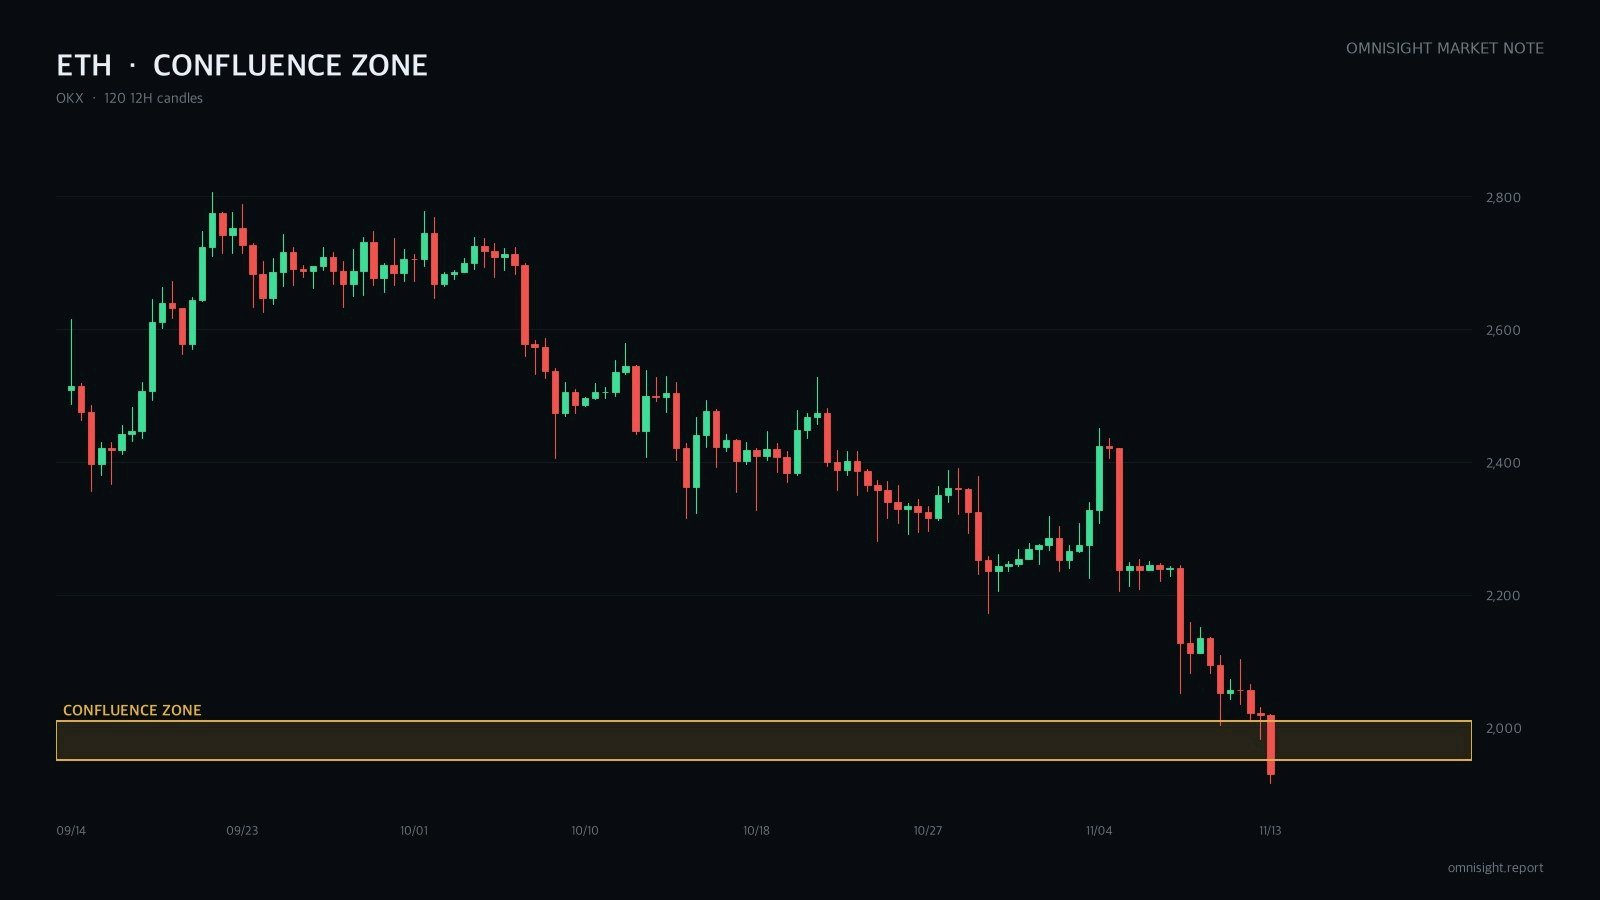
$ETHUSDT just printed its lowest level since August after a one-hour flush. My bias is short, but not here. I'm waiting for a bounce into overlapping resistance above and selling that, not chasing the low. The catch: forced selling this heavy can also mean the sellers are done. Daily, 12h and 4h all keep making lower highs and lower lows. No timeframe shows a turn up yet. Why the short case holds: - Three of four technical methods lean short, and their entry zones land in the same pocket. - A 4h bullish divergence failed today. Price and RSI both made new lows across 4h, 12h and daily. - Hot CPI, a strong dollar, ETF outflows and a large long liquidation all hit within 48 hours. Different reasons, same area. That overlap is the point. ICT read: the sell zone is where the half retracement of the last 4h leg, short-term bearish imbalances and old support turned resistance stack together. I'm wrong if price clears that lower high and the supply block above it. That breaks the lower-high sequence. Risks: Wyckoff reads the flush as possible capitulation on heavy volume. And if price never bounces, the limit order simply doesn't fill. Not investment advice. All decisions and responsibility are your own. #IMPACTbyTrade
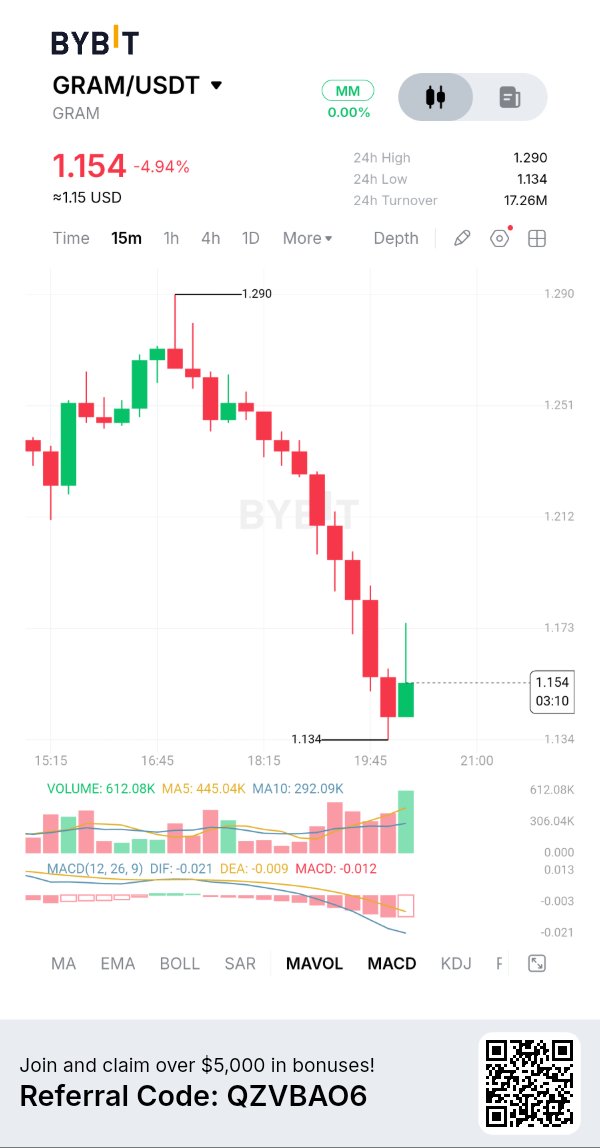
$GRAMUSDT is facing significant selling pressure after declining from $1.290 to a recent low of $1.134. The token is currently trading around $1.154, down approximately 4.94%, according to the supplied Bybit snapshot. Key Market Figures $1.154 — Current price $1.290 — 24H high $1.134 — Critical support $1.173 — Immediate resistance $1.212 — Next resistance $17.26M — 24H turnover Technical Analysis The 15-minute chart shows a clear bearish structure, with consecutive lower highs and lower lows. Although buyers have started defending $1.134, the recovery remains unconfirmed. The MACD remains negative, with DIF at -0.021 and DEA at -0.009, suggesting bearish momentum is still dominant. Trading volume has increased, but stronger buying participation is needed to support a sustainable recovery. Bullish Scenario: If GRAM holds above $1.134, buyers could attempt a recovery toward $1.173. A breakout above this level could open the way toward $1.212. Bearish Scenario: Failure to maintain $1.134 could trigger another downward move and expose GRAM to further losses. Market Outlook GRAM is approaching an important decision point. The current bounce is encouraging, but confirmation requires stronger volume and a break above resistance. Will buyers defend $1.13, or are we about to see another leg down? #IMPACTbyTrade

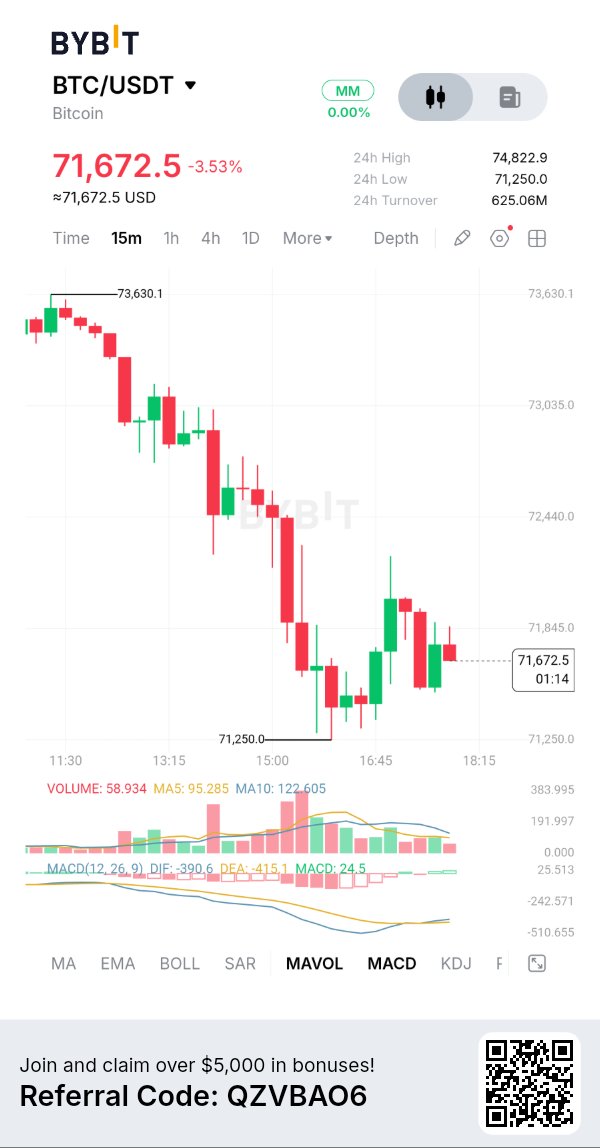
$BTCUSDT is experiencing another challenging trading session, with sellers maintaining significant control over short-term price action. The latest 15-minute chart reveals a sharp decline from the $73,630 region, followed by an attempt to stabilize around $71,250. BTC is currently trading around $71,672.5, representing a decline of approximately 3.53% in the displayed 24-hour market data. The 24-hour high stands at $74,822.9, while the low is approximately $71,250. Trading turnover has reached $625.06 million. What makes the current setup interesting is that Bitcoin is showing early signs of a possible short-term momentum recovery despite the broader selling pressure. However, buyers still need to demonstrate sufficient strength to reclaim important resistance levels. Key Market Figures $71,672.5 — Current price area $74,822.9 — 24-hour high $71,250 — 24-hour low and recent chart support $71,845 — Immediate resistance $72,440 — Next resistance $73,035 — Major recovery resistance $73,630.1 — Previous chart high $625.06M — 24-hour trading turnover -3.53% — Displayed 24-hour price change Technical Analysis On the 15-minute timeframe, Bitcoin is displaying a clear short-term bearish structure. The chart shows a sequence of lower highs and lower lows, indicating that sellers have been consistently controlling price direction. The decline accelerated around the $72,440 region, eventually pushing BTC toward $71,250. Buyers responded around the recent low, creating a temporary rebound toward the $71,845 area. However, the latest candles suggest that upward momentum is still struggling to develop. The MACD indicator provides an interesting signal. The DIF currently stands around -390.6, while the DEA is approximately -415.1, producing a positive histogram reading of 24.5. This indicates that short-term bearish momentum may be weakening. However, both MACD lines remain below the zero line. Therefore, this development should not yet be interpreted as confirmation of a bullish trend reversal. Trading volume also deserves attention. The latest displayed volume is approximately 58.934K, compared with MA5 of 95.285K and MA10 of 122.605K. This suggests that recent trading activity is relatively subdued compared with the previous volume averages. A stronger recovery would ideally require increased buying participation. Bullish Scenario: For Bitcoin buyers to regain control, the first priority is maintaining support above $71,250. If BTC successfully defends this region and attracts stronger buying volume, the first recovery target would be around $71,845. A sustained move above that level could open the door toward $72,440. If buyers manage to reclaim $72,440 with convincing momentum, the next important resistance would be around $73,035. A stronger breakout could eventually bring the $73,630 region back into focus. However, a genuine recovery would require more than a temporary bounce. Increasing volume and sustained higher lows would provide better confirmation. Bearish Scenario: The bearish outlook remains relevant as long as Bitcoin continues to struggle below the $71,845–$72,440 resistance region. If buyers fail to maintain the current rebound, sellers could push BTC back toward $71,250. A decisive breakdown below this level would weaken the existing support structure and potentially expose Bitcoin to another downward move. Continued selling pressure, particularly alongside increasing red-candle volume, would strengthen the bearish argument. Market Outlook Bitcoin is currently at an important short-term decision point. The defense of $71,250 is encouraging, while the positive MACD histogram suggests that selling momentum may be gradually slowing. Nevertheless, the overall 15-minute structure remains bearish, and the latest recovery has not yet established a convincing bullish trend. For now, I would focus on two important areas: $71,250 as the critical support level and $71,845–$72,440 as the immediate recovery zone. A successful reclaim of resistance, supported by stronger buying volume, could improve the short-term outlook. On the other hand, losing $71,250 would increase the possibility of another downward extension. One important thing to remember is that a positive MACD histogram during a market decline does not automatically mean the bottom is in. The big question: Is Bitcoin preparing for a short-term relief rally, or are sellers simply taking a brief pause before another move lower? The next few 15-minute candles could provide important clues about who is gaining control. #IMPACTbyTrade
Todo el mundo solo le presta atención a los listados coreanos de $HYPEUSDT esta semana y se durmieron por completo en lo rápido que Hyperliquid está construyendo realmente una capa financiera. El mercado está sangrando, Upbit y Bithumb no dieron ese pump instantáneo de FOMO minorista que todos esperaban, y sí, $HYPE recibió un golpe de cerca del 25%. Lo que sea. Lo que está pasando es mucho más importante que una vela semanal. Aquí está lo que realmente está conectando en este momento: Uniswap v2/v3/v4 acaba de lanzarse en Elysium (el nuevo Arbitrum Orbit L2 de Kinetiq). Esta es la solución a la queja más antigua de Hyperliquid, el spot y DeFi siempre fueron lentos como la chingada. Finalmente algo que no se siente como operar en 2021. Elysium ejecuta bloques de 100ms y usa $HYPE nativo como el único gas. Los constructores finalmente tienen un entorno rápido adecuado para AMMs, launchpads y hooks de v4 que pueden conectarse directamente al libro de órdenes de HyperCore. Esta pieza faltaba antes. Upbit y Bithumb abren pares KRW a través de HyperEVM, el retail coreano puede soltar fiat directamente sin tocar USDT u otros intermediarios. Mientras tanto, los mercados de RWA a través de HIP-3 generan constantemente $4-5 mil millones de volumen diario, casi la mitad de todo lo que procesa el protocolo. Acciones y commodities en la cadena 24/7. Ya no es una función secundaria. Los críticos tienen razón: la actividad temprana en Elysium es mayormente basura de memecoins, y el listado coreano no salvó el precio. Ok. Pero miren la pila real: perps cripto profundos + trading de acciones y commodities 24/7 + Uniswap L2 de alta velocidad + rieles directos de fiat coreano. Hyperliquid dejó de ser solo un DEX de perps hace mucho tiempo. Se está convirtiendo en una capa financiera completa en la cadena, les guste o no el precio a la gente. #IMPACTbyTrade