MDFUNDS
3292Me gusta0Compartir en el chat88Aficionados137Seguir
this user would provide you a more insightful about cryptocurrency with explicit trading analysis.
this user would provide you a more insightful about cryptocurrency with explicit trading analysis.
#Bitcoin #BTCUSDT #CryptoMarket #MDFUNDS
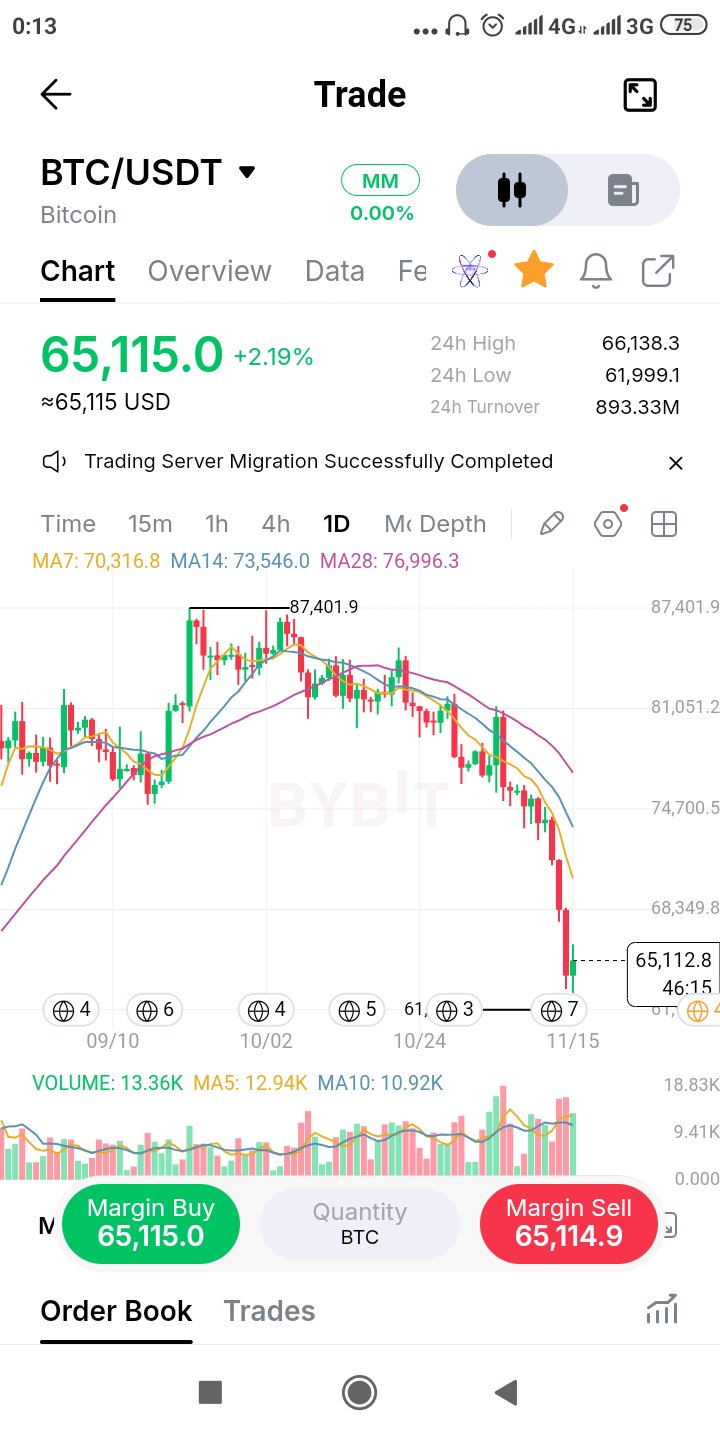
Bitcoin's $62K reaction: Is the market beginning to absorb selling pressure? Bitcoin's daily chart is showing something worth examining beyond the headline price decline. After failing to sustain its advance from the $87,401 peak, BTC entered a persistent sequence of lower highs and lower lows. The latest downside expansion pushed price towards $61,999, where buyers have started producing a visible response. BTC is now trading around $65,115, but the broader structure remains under considerable pressure. Here's the detail that interests me. Daily volume stands at 13.36K, above both its five-day average of 12.94K and ten-day average of 10.92K. That tells us participation has increased during this volatile phase. In Wyckoff terms, increased selling effort followed by a reaction from buyers can be worth monitoring. However, high volume alone does not confirm accumulation or a selling climax. The subsequent price behaviour must provide that evidence. The moving averages reinforce the caution: MA7: $70,316 MA14: $73,546 MA28: $76,996 All three remain above current price, reflecting the prevailing bearish alignment. The levels I'm watching: $61,999 — The immediate downside reference. A decisive loss could expose BTC to another leg lower. $68,350 — The first meaningful recovery hurdle visible on the chart. $70,316 — The daily MA7, which could become an important test of short-term trend recovery. What I want to see is whether BTC can establish a higher low, recover lost resistance and sustain that move with meaningful participation. Until then, calling this a confirmed bottom would be premature. My question to the market: Are we witnessing the early stages of selling-pressure exhaustion, or is this simply a temporary pause before another bearish expansion? #Bitcoin #BTCUSDT #CryptoMarket #MDFUNDS $BTCUSDT #ByXIMPACT
#QNT #Quant #AnálisisCripto #MDFUNDS
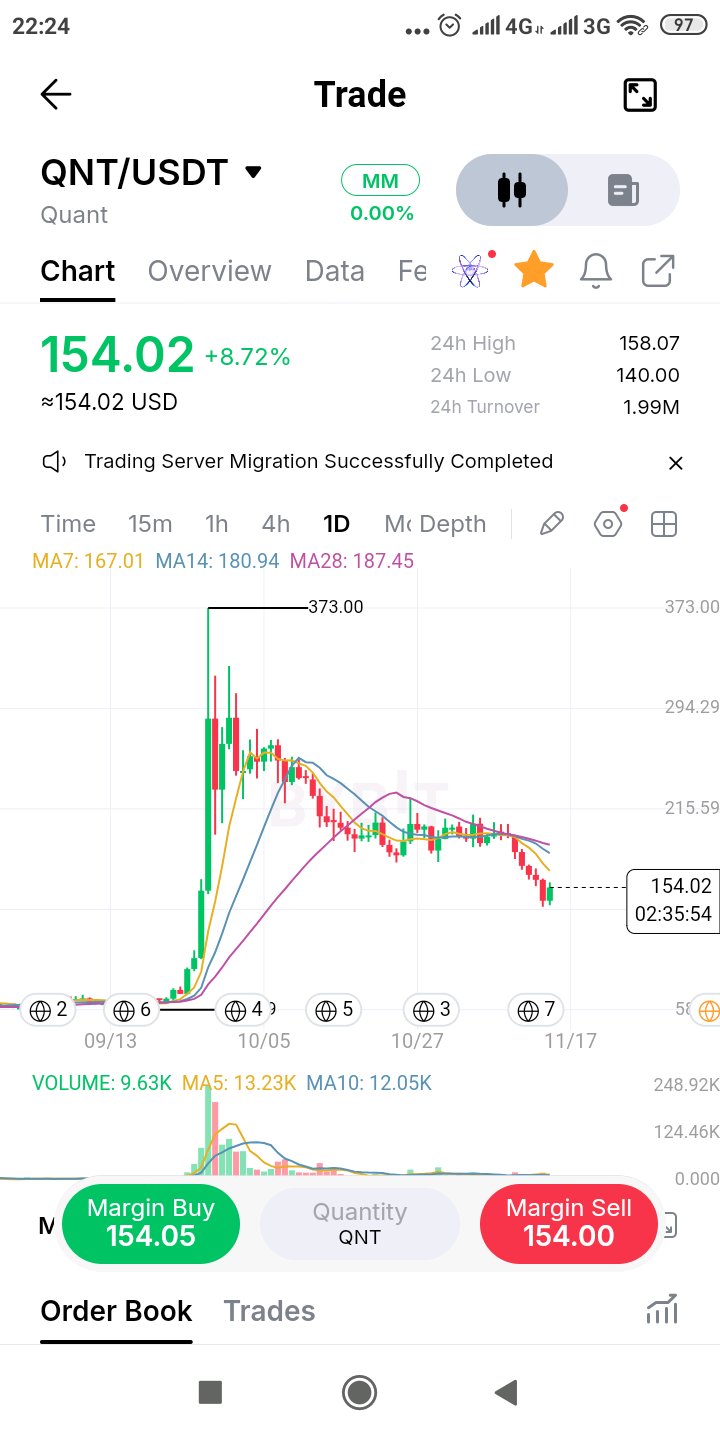
$QNTUSDT — Un repunte de alivio no es todavía un cambio de tendencia QNT ha rebotado fuertemente desde la región de los $140, ganando un 8.72% y alcanzando un máximo intradía de $158.07. Esa reacción es significativa, pero no me apresuraría a interpretarla como un cambio estructural alcista. Veamos el panorama general. Desde su explosiva expansión hacia los $373, QNT ha ido cediendo progresivamente sus ganancias. El mercado pasó por una fase de distribución prolongada y declive, intentó estabilizarse alrededor de la región de los $200, y ahora ha experimentado otro tramo a la baja. El rebote de hoy demuestra que los compradores están reaccionando a precios más bajos. Lo que sigue siendo incierto es si esa demanda es lo suficientemente fuerte como para revertir la estructura predominante. Las medias móviles ofrecen una perspectiva importante: MA7: $167.01 MA14: $180.94 MA28: $187.45 El precio permanece por debajo de las tres. Esto significa que la recuperación actual sigue ocurriendo por debajo de las referencias de tendencia diaria más importantes del mercado. Estoy particularmente interesado en tres áreas de precio: $140: La referencia bajista inmediata establecida por el último mínimo diario. $158–$167: El primer desafío de recuperación. Mantenerse por encima de esta región y recuperar la MA7 mejoraría el panorama a corto plazo. $180–$187: Una zona de recuperación más sustancial donde convergen las siguientes dos medias móviles. El volumen también merece atención. Los 9.63K mostrados siguen estando por debajo de las medias de volumen MA5 y MA10. Hasta que la participación no mejore, el rebote tiene que demostrar su validez. Hay una lección aquí de la Teoría de Dow: una reversión significativa requiere algo más que una vela verde fuerte. El mercado debe comenzar a establecer una secuencia diferente de máximos y mínimos. Mi pregunta: ¿Están los compradores empezando a defender QNT en los $140, o simplemente estamos siendo testigos de un repunte de alivio temporal dentro de una estructura bajista más grande? $QNTUSDT #ByXIMPACT
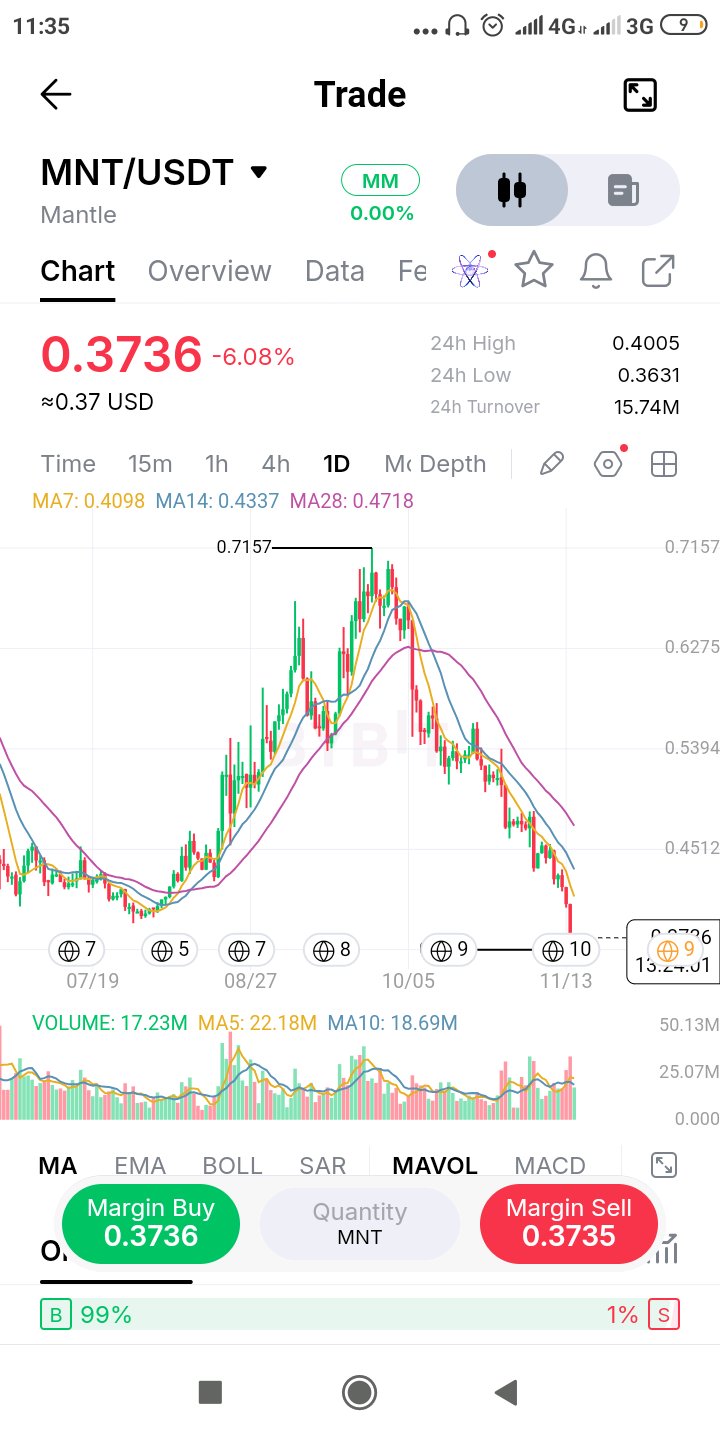
$MNTUSDT's daily candle is still open, and it's the most important one on the chart right now. Price is 0.3736, down 6%, and it has pushed under the July-August base, the floor the whole rally was built on. That's the entire run from the 0.7157 high erased, about 48%. But an intraday break isn't a breakdown. The close decides. A daily close back above roughly 0.385-0.39 turns this into a failed breakdown, the kind that traps late sellers. A close under it confirms the base is gone. If it is gone, the classic measuring rule from Edwards & Magee is the base's own height projected down from the break. That range ran roughly 0.39 to 0.45, which points to the low 0.33s. I'd treat that as a reference level, not a forecast. For bulls, even a bounce has work to do. 0.4005 is the 24h high, then the 7MA at 0.4098, with the 14 and 28 MAs (0.4337, 0.4718) stacked above and falling. Price sits 21% under the 28MA. $MNTUSDT #ByXIMPACT
#PIEVERSE #CryptoMarket #Altcoins #MDFUNDS
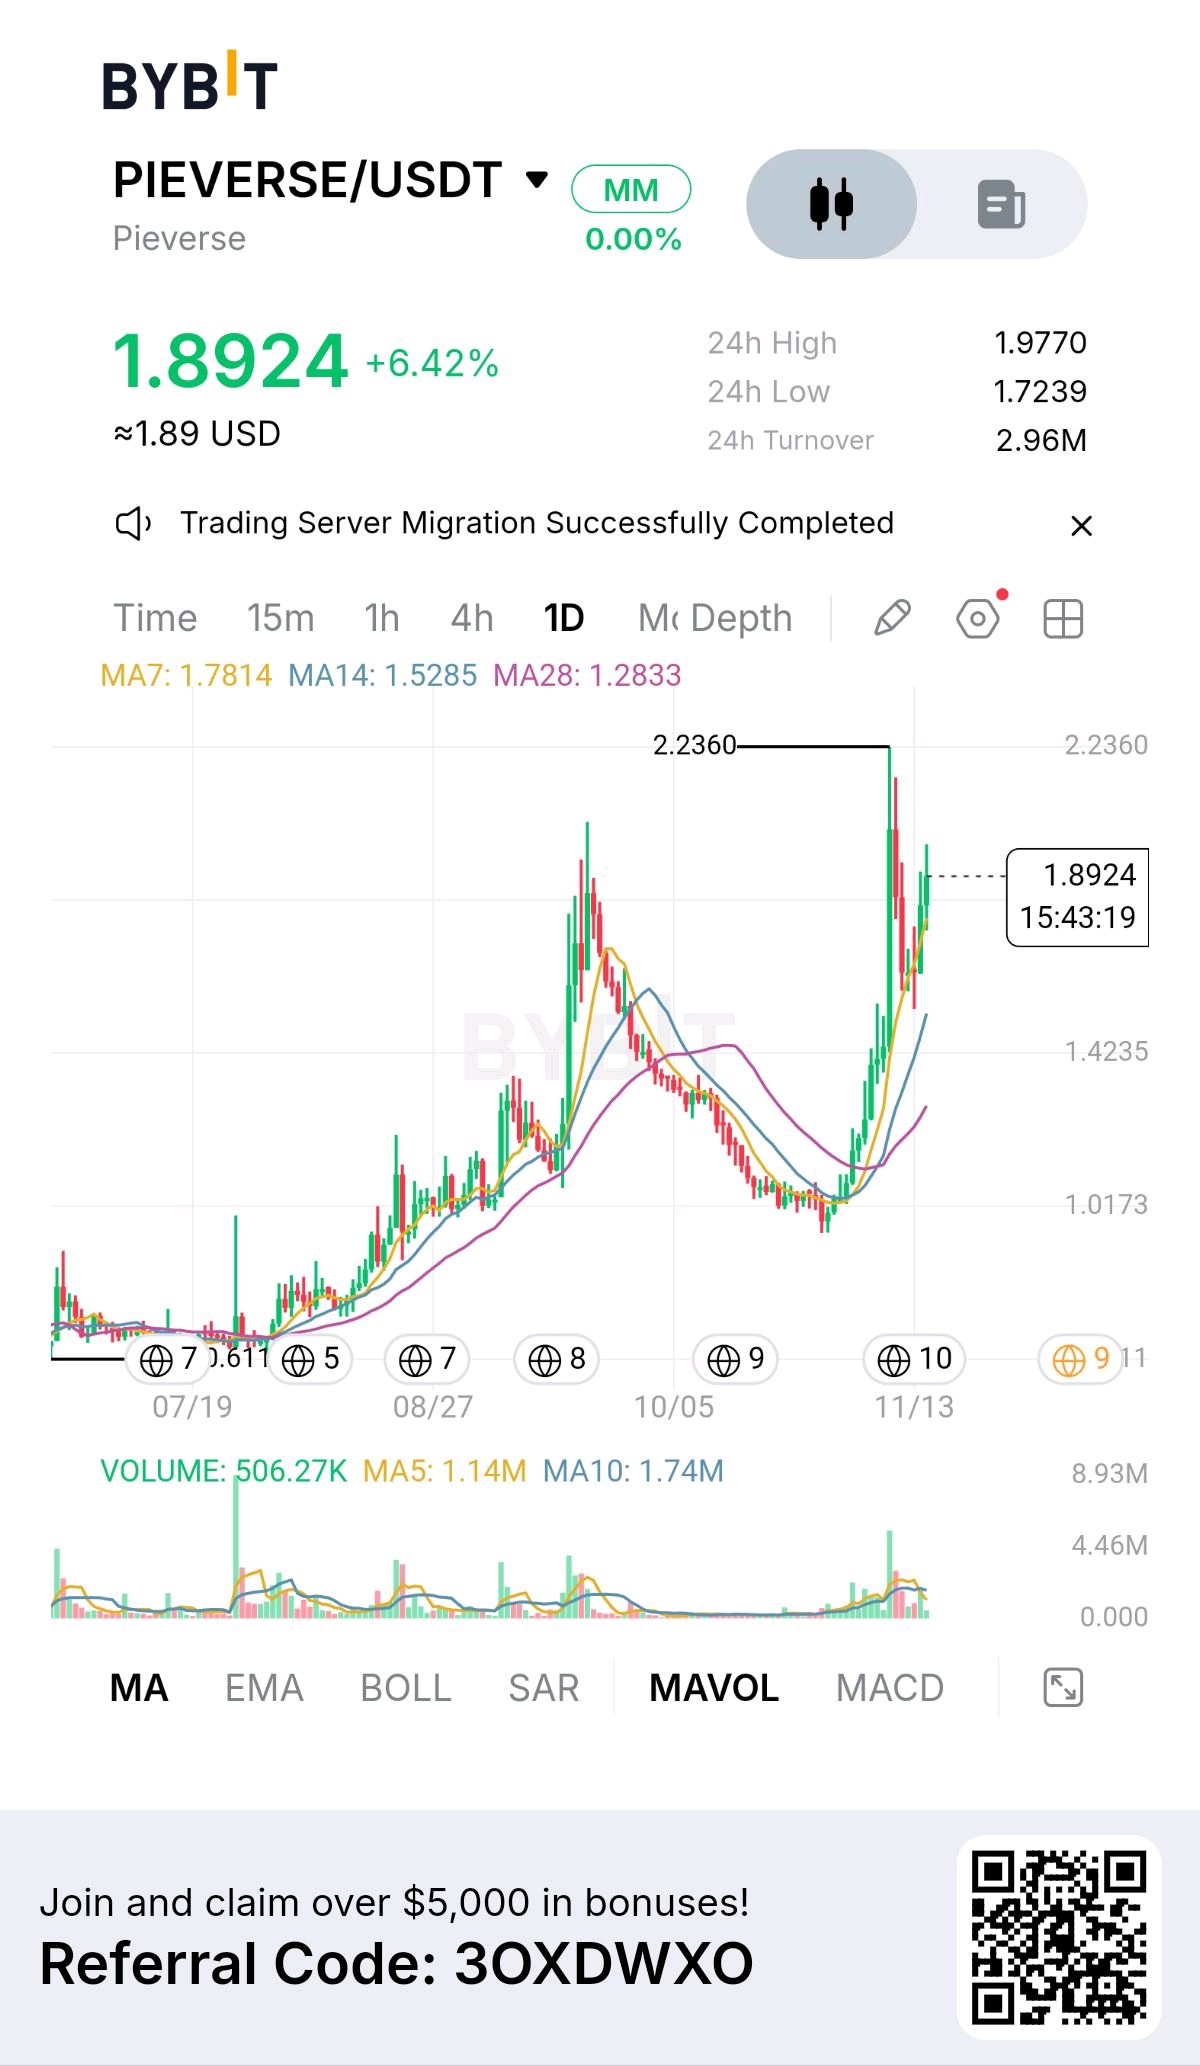
$PIEVERSEUSDT — Buyers are back, but can they sustain control? PIEVERSE has undergone a significant structural change on the daily chart. After spending an extended period declining towards the $1.00 region, the market produced an aggressive upside expansion, reaching approximately $2.236 before encountering selling pressure. What makes the current setup interesting is that the subsequent retracement hasn't erased the entire recovery. Price has rebounded to $1.8924 and is trading above all three moving averages: MA7: $1.7814 MA14: $1.5285 MA28: $1.2833 The bullish alignment suggests that the recovery has developed beyond a simple one-day price spike. However, I wouldn't confuse a strong recovery with an established continuation breakout. Here is where the next price reaction matters: The $1.977 area is the immediate resistance to watch, followed by the previous major swing high around $2.236. A convincing break and hold above these levels would strengthen the continuation argument. On the downside, $1.78 is an important near-term reference, close to the seven-day moving average. Losing that area would raise the possibility of another corrective phase, with $1.53 becoming a deeper reference point. There is also a volume question. The displayed volume is 506.27K, below its MA5 of 1.14M and MA10 of 1.74M. Since the daily candle may still be developing, the final volume reading matters. A breakout without stronger participation deserves caution. My interpretation: PIEVERSE has demonstrated a meaningful recovery, but the market still needs to prove that buyers can absorb supply around the recent highs. Would you rather see PIEVERSE consolidate above $1.78 before another attempt higher, or do you think buyers have enough momentum to challenge $2.23 directly? $PIEVERSEUSDT #ByXIMPACT
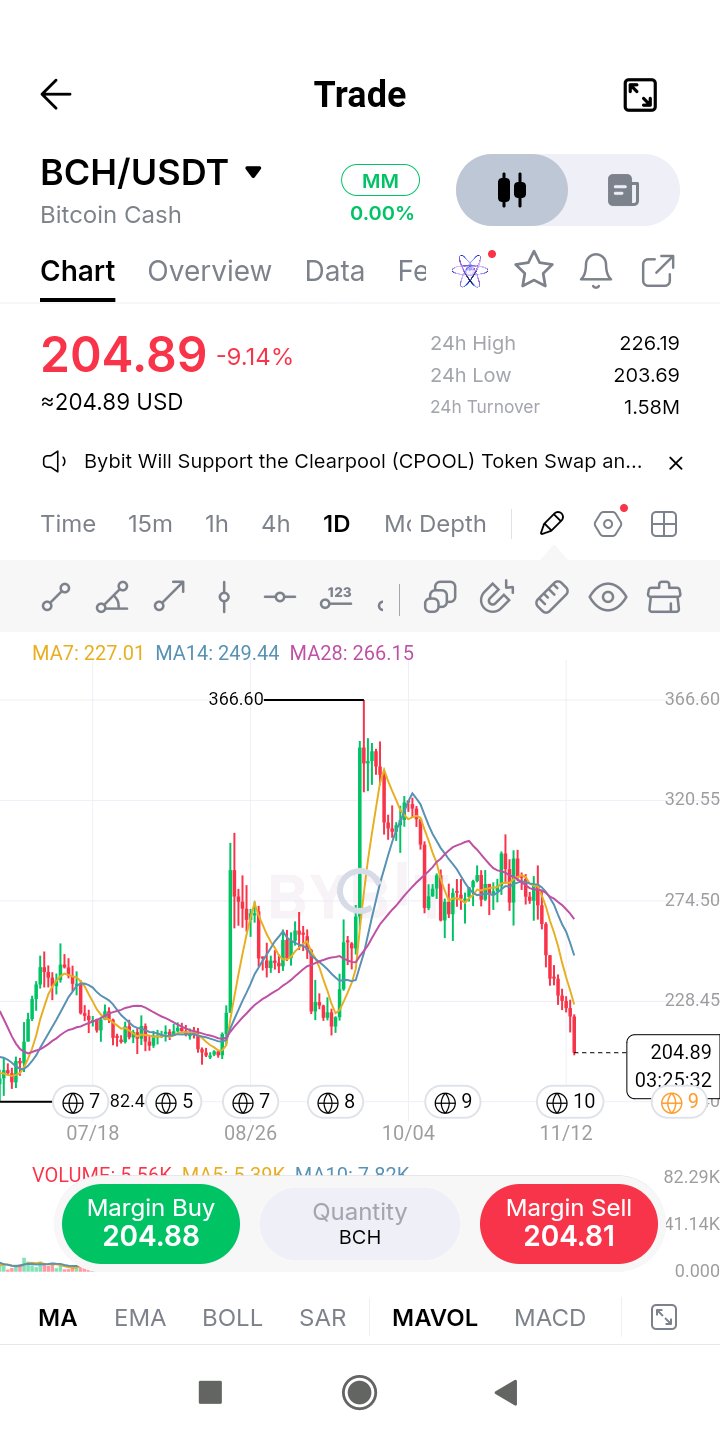
$BCHUSDT is back where its August breakout began. The only question left is whether anyone still cares about that level. The run to 366 has been fully retraced. Price is down 44% from the high and trades near 205, right around the base the late-August impulse launched from. Zones like that either pull in buyers who missed the first move or get sliced through. Today it's being tested hard: down 9% on the day, rejected at 226, which is the 7MA (227), and sitting 23% under the 28MA with every average rolling over. In Stan Weinstein's stage framework, price below declining averages is Stage 4, the one stage where the discipline is not to buy. An old launch pad doesn't change that on its own. It needs a base first: a tight range, volume drying up, a higher low. Below today's low at 203.7, the next real support I see is the July low near 182, about 11% lower. Above, 227 and then the 14MA near 249 have to go before I'd call anything a recovery. $BCHUSDT #ByXIMPACT
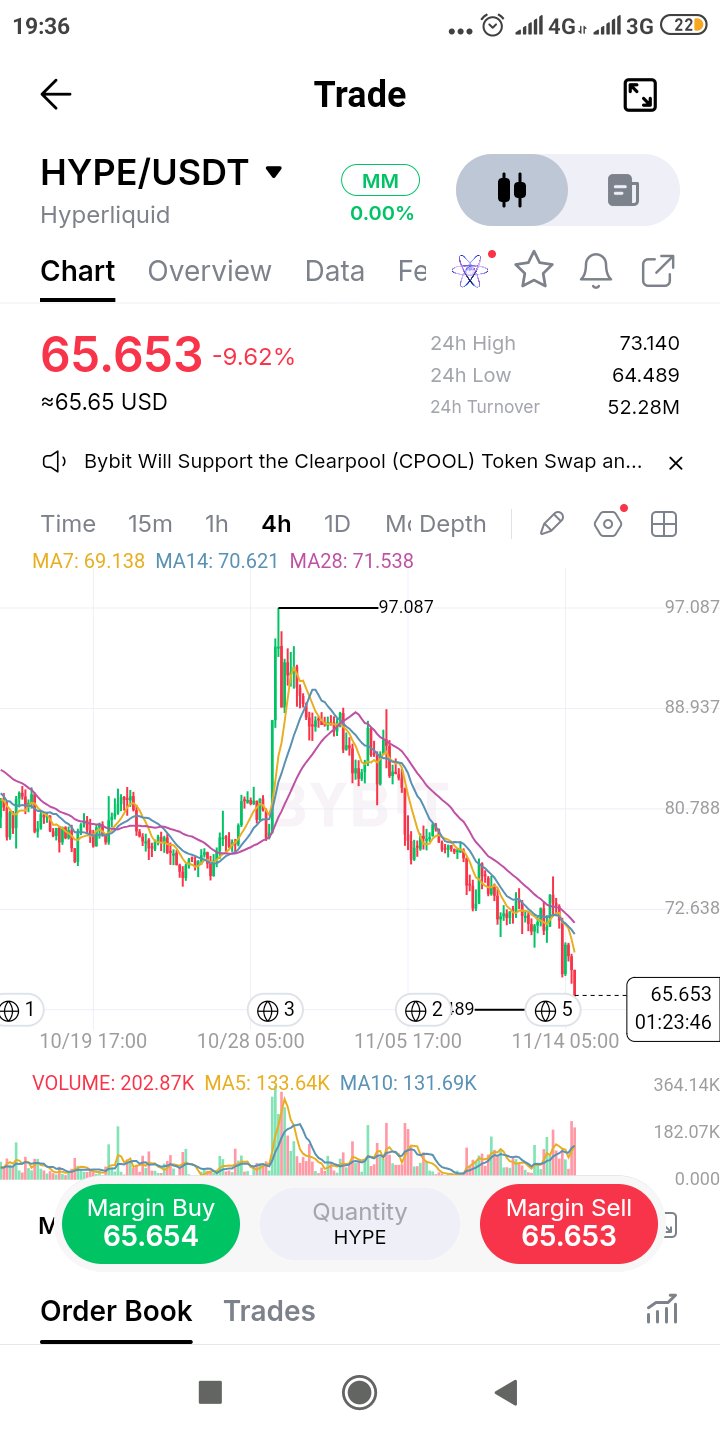
$HYPE no solo borró la subida de octubre, sino que la eliminó por completo y siguió cayendo. El precio está en 65.7, por debajo de toda la base desde la que se lanzó el pico de 97. Eso importa por una de las reglas más antiguas de Edwards & Magee: el soporte roto se convierte en resistencia. El nivel de 75-80 que se mantuvo en octubre ahora es oferta superior. Más cerca, el rango de 70.6 a 73.1 acumula la media móvil de 14, la de 28 y el máximo de 24 horas en una sola banda que ya rechazó el precio una vez en las últimas 24 horas. Lo que los alcistas no deberían ignorar: esto no es un desangramiento silencioso. El volumen en 4H está operando alrededor de un 50% por encima de sus promedios recientes mientras el precio rompe a la baja, así que hay participación real detrás del movimiento. Una ruptura con volumen generalmente busca un retesteo antes de cualquier otra cosa. El suelo inmediato es el mínimo de hoy en 64.49. Por debajo de eso, no veo mucha estructura hasta la base del verano en los 50 bajos, lo cual es un largo camino hacia abajo. Los rebotes hacia la banda de 69-73 son donde esperaría oferta, no una razón para perseguir. Un cierre en 4H por encima de 73 cambiaría mi visión. $HYPEUSDT#ByXIMPACT
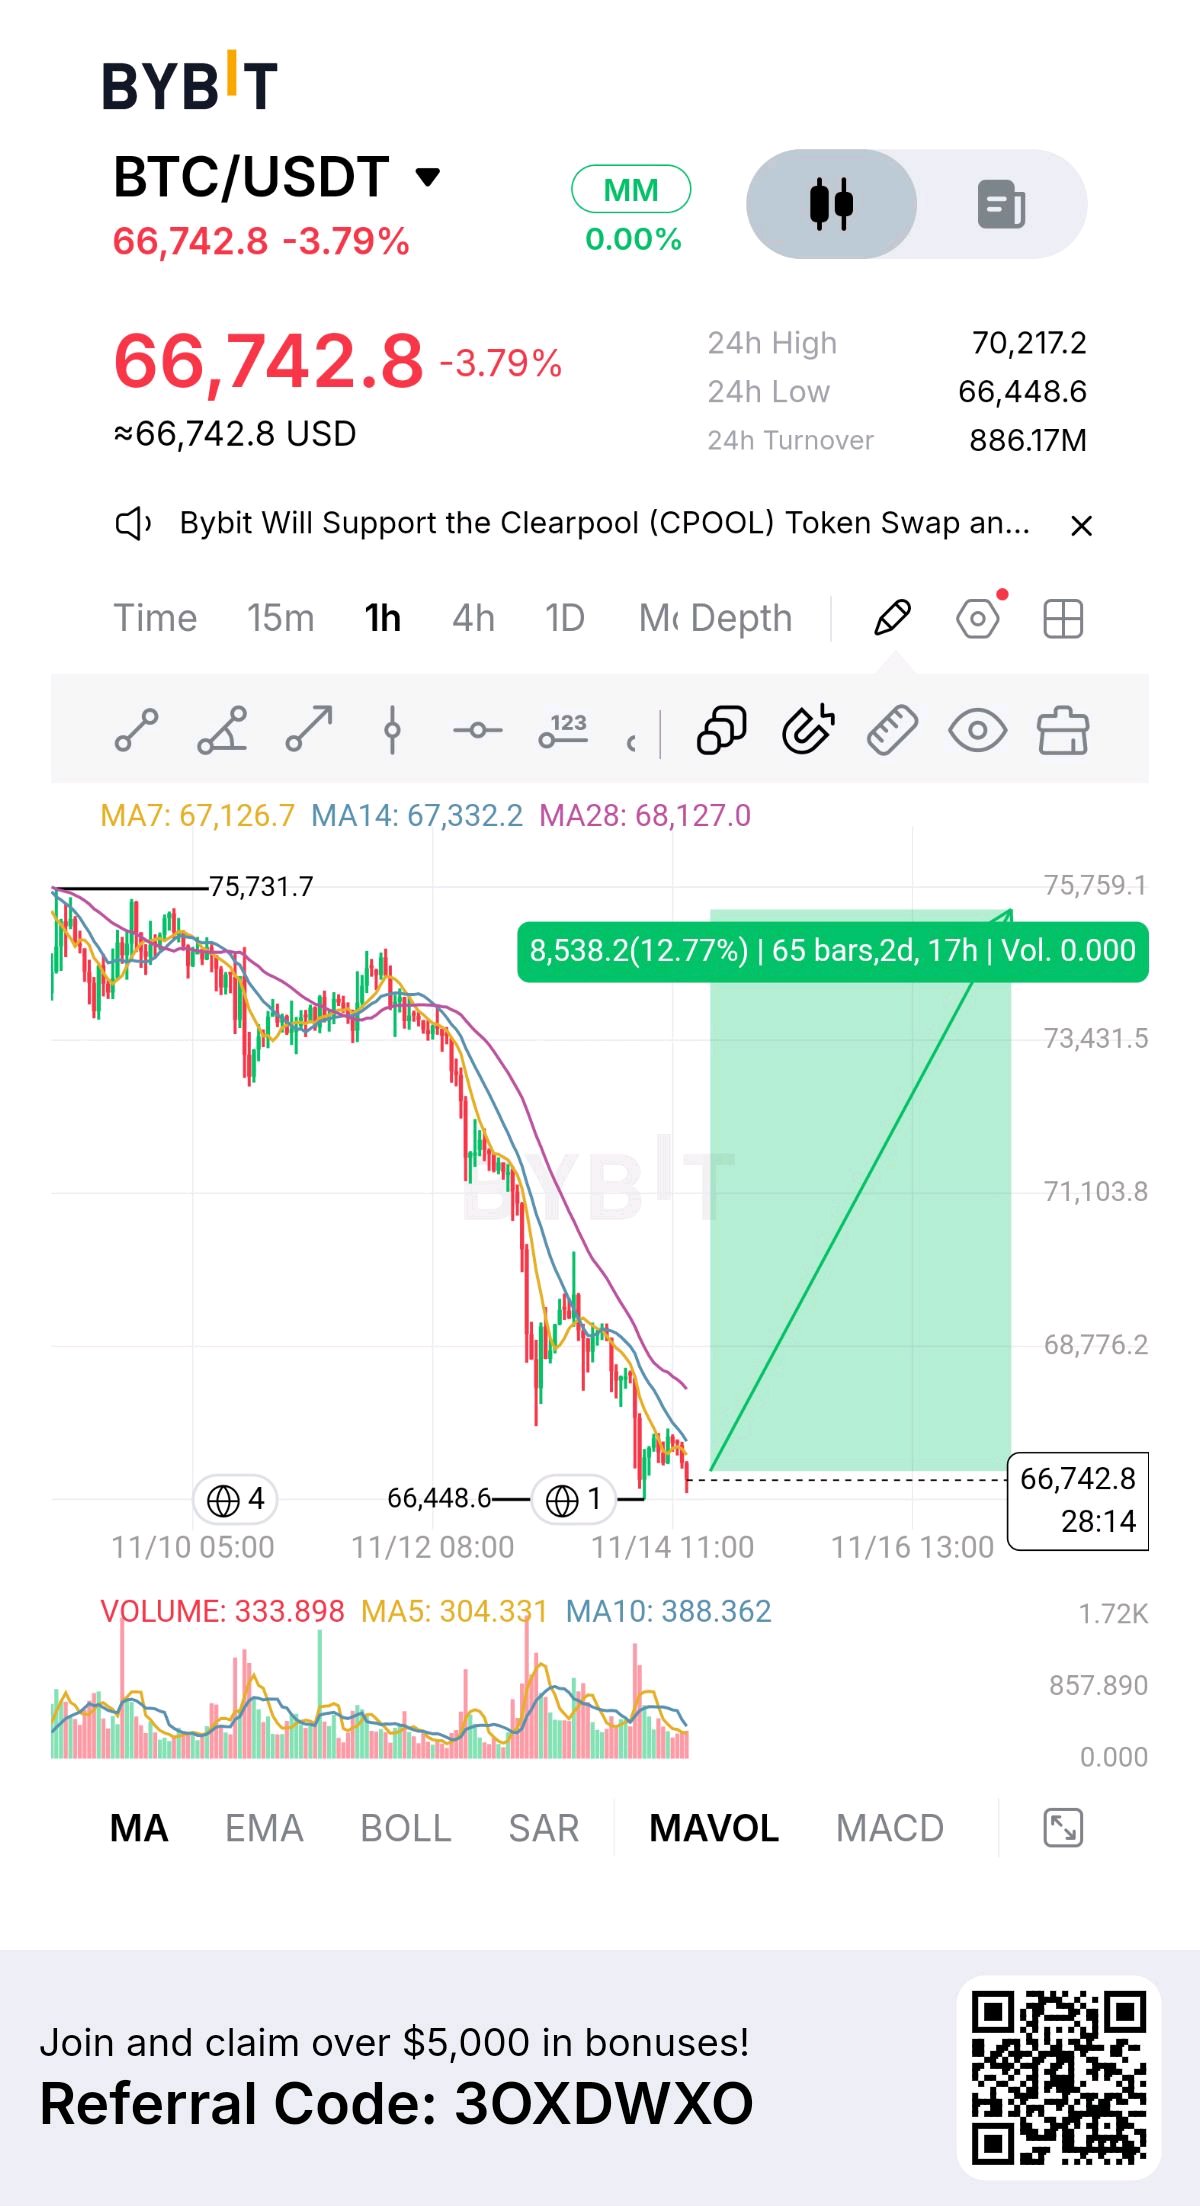
$BTCUSDT is back within 0.4% of its low, and this test decides whether 66,449 was a flush or just a pause. The drop from 75.7K cost roughly 12% in under six days. The low printed on a burst of volume. The move back toward it is quieter, with the 5-bar volume average sitting under the 10-bar. A retest on lighter volume is what you want if buyers defended that level for a reason. It isn't confirmation, it's the condition for one. The bounce after the low stalled at 70.2K, about 40% of the drop. That's the shallow end of a normal retracement, so a clean V back to 75K would mean recovering the entire leg. I'd treat 68.1K (the 28MA) and 71.1K (the 50% retrace) as the real checkpoints, with 67.3K, the 14MA, as the first rung. An hourly close under 66,449 means the retest failed and I step aside. Mark Douglas' point in Trading in the Zone applies: you don't need to know what happens next, you need to know what you'll do when it does. $BTCUSDT #ByXIMPACT
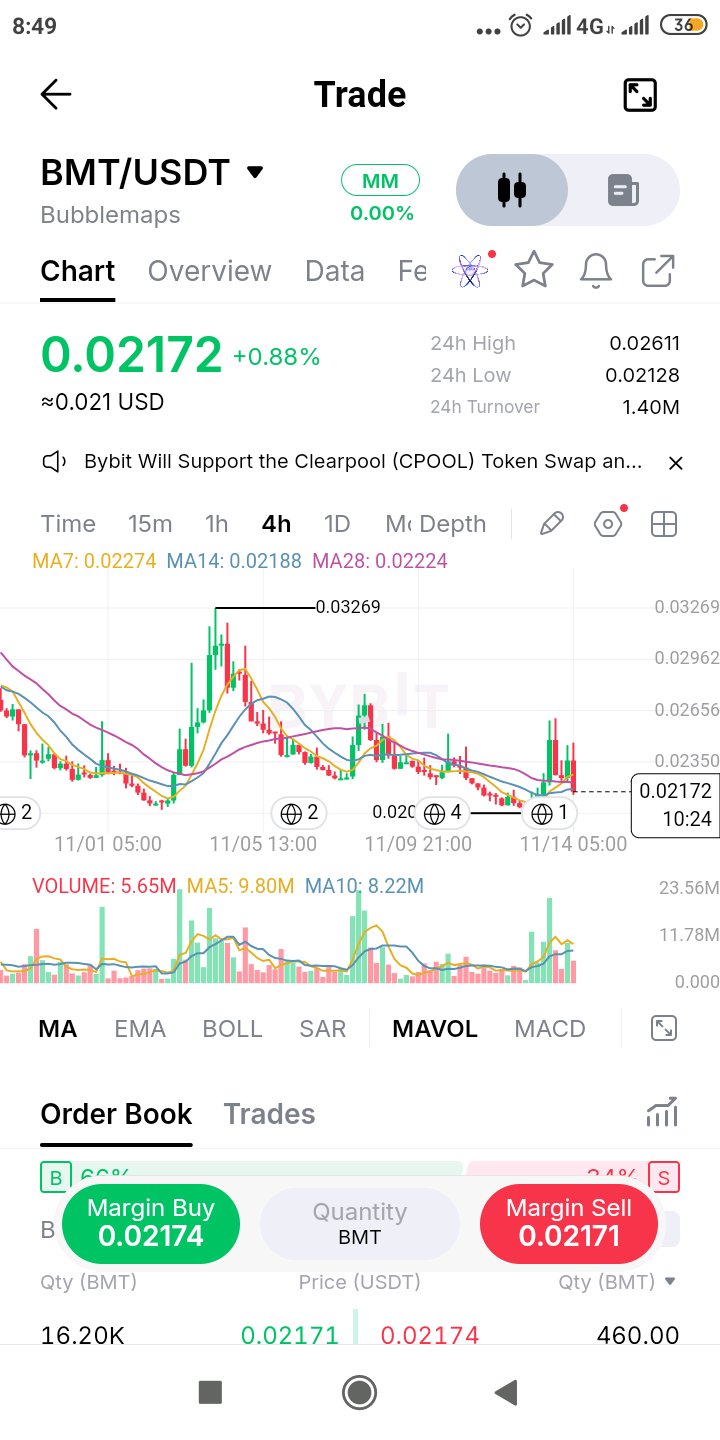
$BMTUSDT pumped 23% and handed back about 90% of it inside the same session. That's not a trend, that's a liquidity event. The surge came on volume well above average, then price dropped right back through the 7, 14 and 28 MAs, which are bunched between 0.0219 and 0.0227 and now sit overhead. Their tangled order tells you there's no trend here to lean on. It's also the second time this month: the early-November run to 0.0327 got sold all the way back too. Rallies keep getting faded, and with 24h turnover this thin, spikes are easy to fade. What keeps the structure intact is the low near 0.0201. While that holds, this is a range, not a breakdown, with the pump high at 0.0261 as the upper edge. Livermore's habit of waiting for the line of least resistance fits here. I'm not trading the middle of the range. A 4H close above 0.0261 or below 0.0201 gets my attention. Everything in between is noise. $BMTUSDT #ByXIMPACT
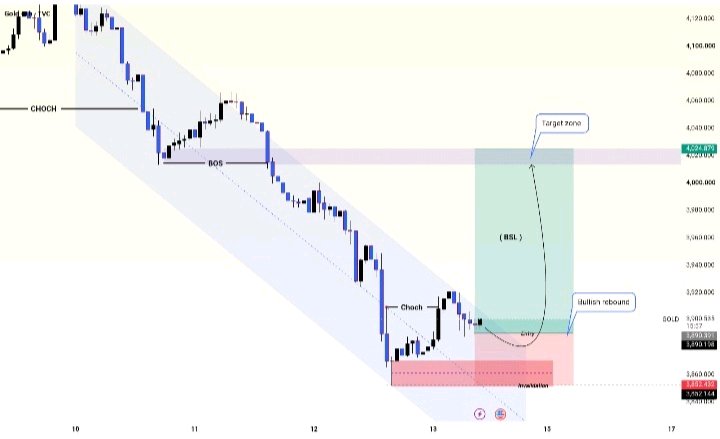
GOLD (XAUUSD) | Bullish Rebound - MDFUNDS
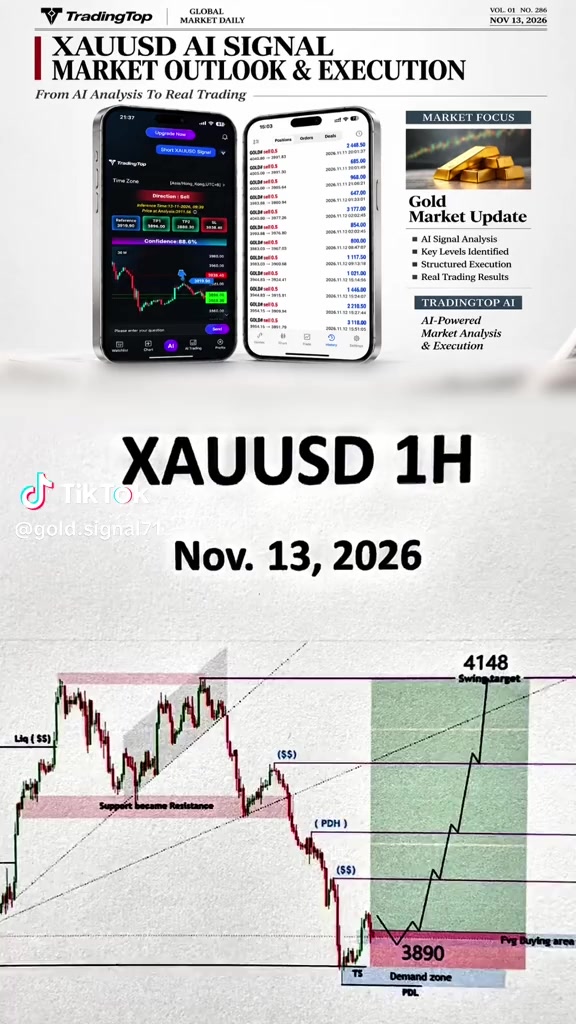
GOLD ($XAUTUSDT) | Bullish Rebound - MDFUNDS. Gold is showing signs of a potential bullish recovery after an extended bearish move within a descending channel. The recent price action has formed a bullish Change of Character (CHoCH), suggesting that selling pressure may be weakening and buyers could be attempting to regain control. Trade Setup – Potential Long - Market Bias: Bullish (Conditional) - Entry Area: Around 3,890 - Invalidation Level: 3,852 - Liquidity Target: Around 3,955 (Buy-Side Liquidity) - Final Target Zone: 4,020–4,025 Technical Outlook: The main focus is on how price reacts around the current entry area. If buyers maintain support and bullish momentum develops, Gold could attempt a recovery towards the previous liquidity area near 3,955. A sustained move above this level could open the possibility of further upside towards the 4,020–4,025 target zone. However, if price breaks below the marked invalidation level, the bullish scenario will no longer be valid. Risk Management & Disclaimer: This is a technical market analysis and a conditional trade scenario, not a guaranteed prediction or financial advice. Always manage risk carefully, use appropriate position sizing and make independent trading decisions. Wait for price confirmation before considering any entry. Follow the chart levels and respect the invalidation point. $XAUTUSDT #ByXIMPACT
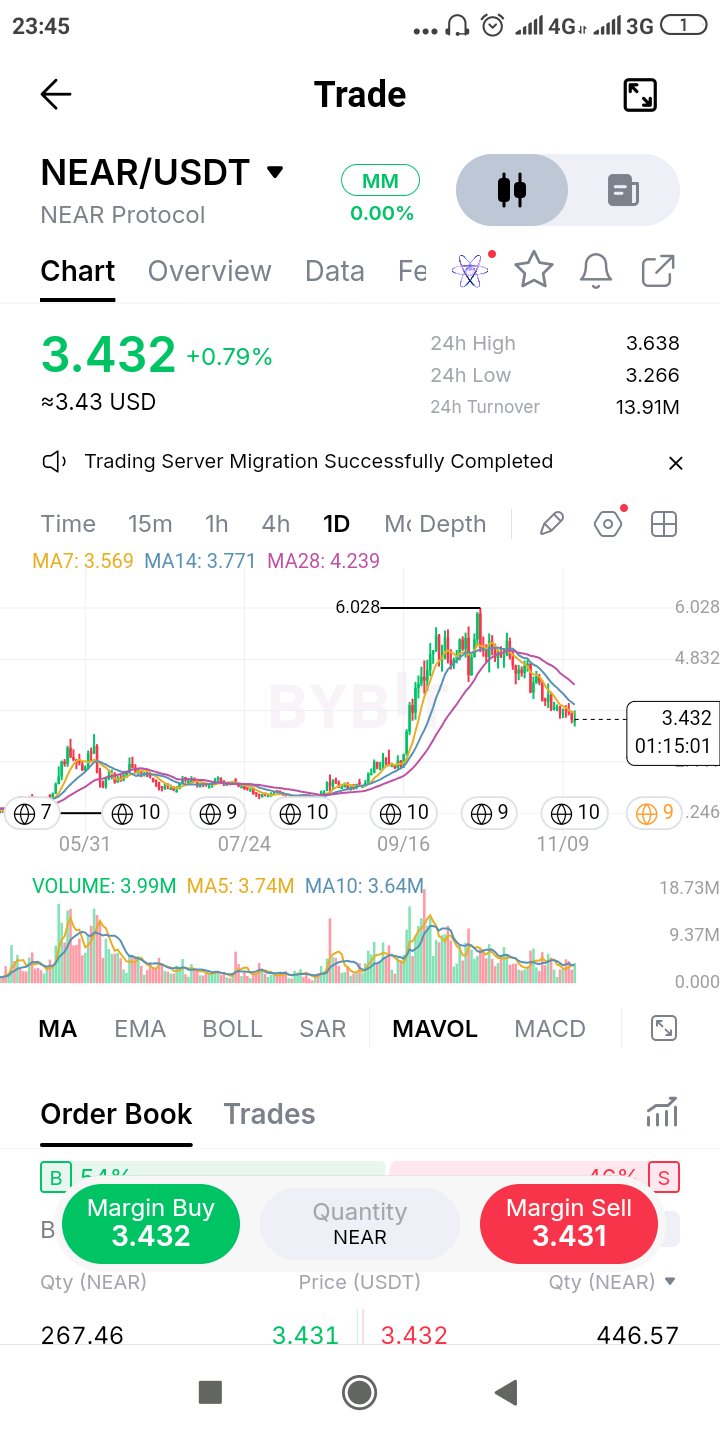
$NEARUSDT acaba de completar un ciclo de Wyckoff completo a plena vista: una base de verano, un violento repunte (markup) a 6.03, un techo a mediados de octubre y ahora una caída (markdown). El precio ha bajado un 43% desde el máximo y ha retrocedido bastante más de la mitad de todo el avance. Por qué leo esto como una caída y no como un suelo: el precio se sitúa por debajo de las medias móviles (MA) de 7, 14 y 28 (3.57, 3.77, 4.24), todas con tendencia a la baja, y la media móvil de 28 está aproximadamente un 23% por encima de donde operamos. Es mucha oferta acumulada que hay que digerir. El volumen en este tramo se mantiene cerca de su promedio, nada parecido al aumento que impulsó el rally, así que no hay capitulación que marque un final. Las últimas 24 horas oscilaron entre 3.27 y 3.64, y el máximo se desvaneció justo por encima de la media móvil de 7. Lo primero que querría ver no es una vela verde. Es un cierre diario por encima de 3.57, seguido de un mínimo más alto. Por debajo de 3.27 hay poca estructura en el gráfico hasta el área de ruptura de principios de septiembre, así que prefiero esperar a que el mercado muestre sus cartas antes que adivinar un suelo. $NEARUSDT #ByXIMPACT
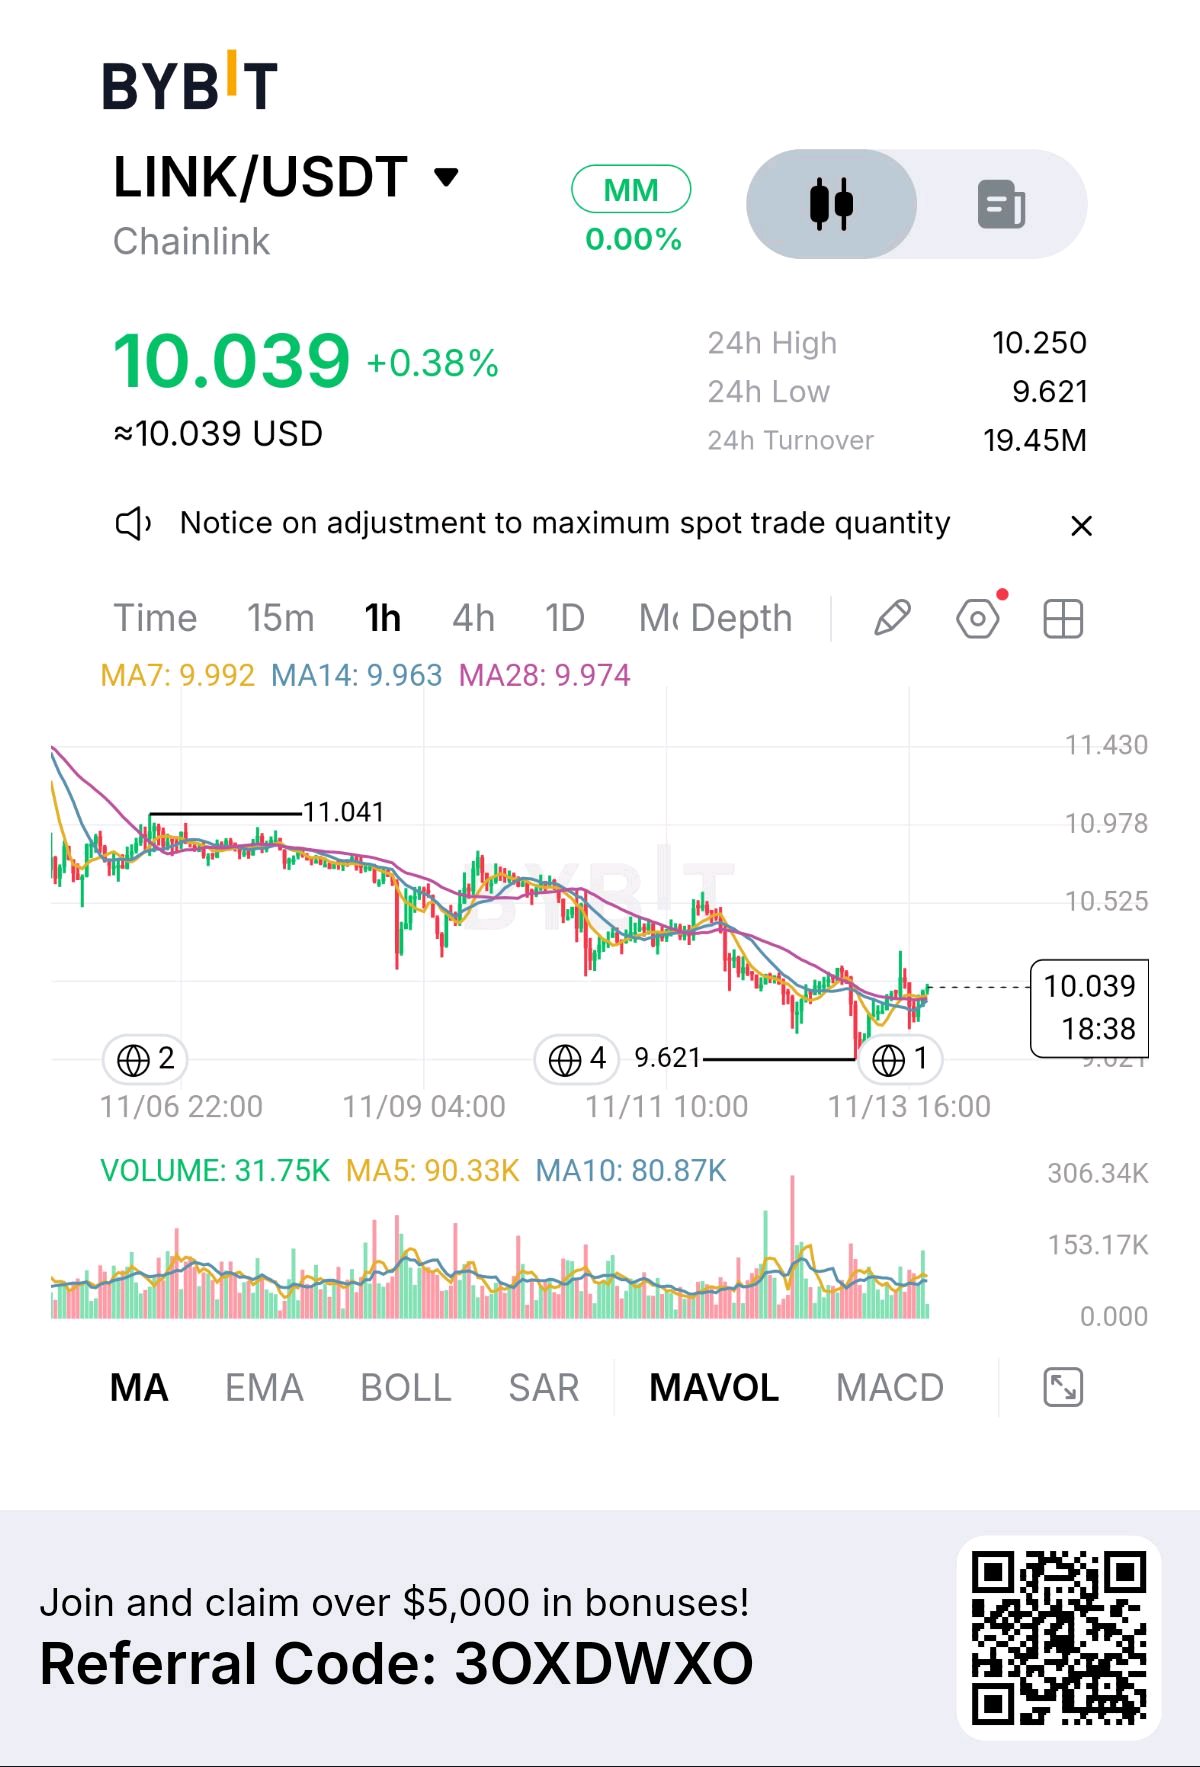
$LINKUSDT just ran the stops under its last low and couldn't stay there. The flush to 9.62 undercut the previous swing low, then price took back the whole move within hours and now sits above the 7, 14 and 28 MAs, which have flattened into one tight band around 9.96-9.99. Al Brooks' read on failed breakouts applies: the side that chased the breakdown is now trapped, and their exit becomes fuel for the move up. But keep it honest. On the hourly, every bounce has topped lower than the last, and 10.25 is the most recent of those lower highs. Until that breaks, this is a failed breakdown, not a trend change. Above 10.25 I'd look toward 10.5. Back under 9.96 and it's just another weak bounce. A close below 9.62 kills the idea outright. $LINKUSDT #ByXIMPACT
$XAUTUSDT shed almost 7% from 4,130 in about three days, and the bounce since barely deserves the name. Price recovered only to around 3,916, less than a quarter of the drop. Murphy's rule of thumb is that a healthy correction retraces at least a third before it counts as a real attempt. A third of this move sits near 3,944 and price never got close. Buyers showed up late and left early. Now it's sitting just above the 3,851 low, mostly on quiet volume, under a tight pack of 7, 14 and 28 MAs between 3,878 and 3,887. Compression right under resistance and right above support means one of those levels is about to get taken. An hourly close below 3,851 with volume turns that low into a failed floor and gives the next leg room. Reclaiming 3,887 and holding it turns the bounce into a base and puts 3,916, then 3,944, back in play. I'm not guessing which. I'm watching who defends their level first. $XAUTUSDT #ByXIMPACT
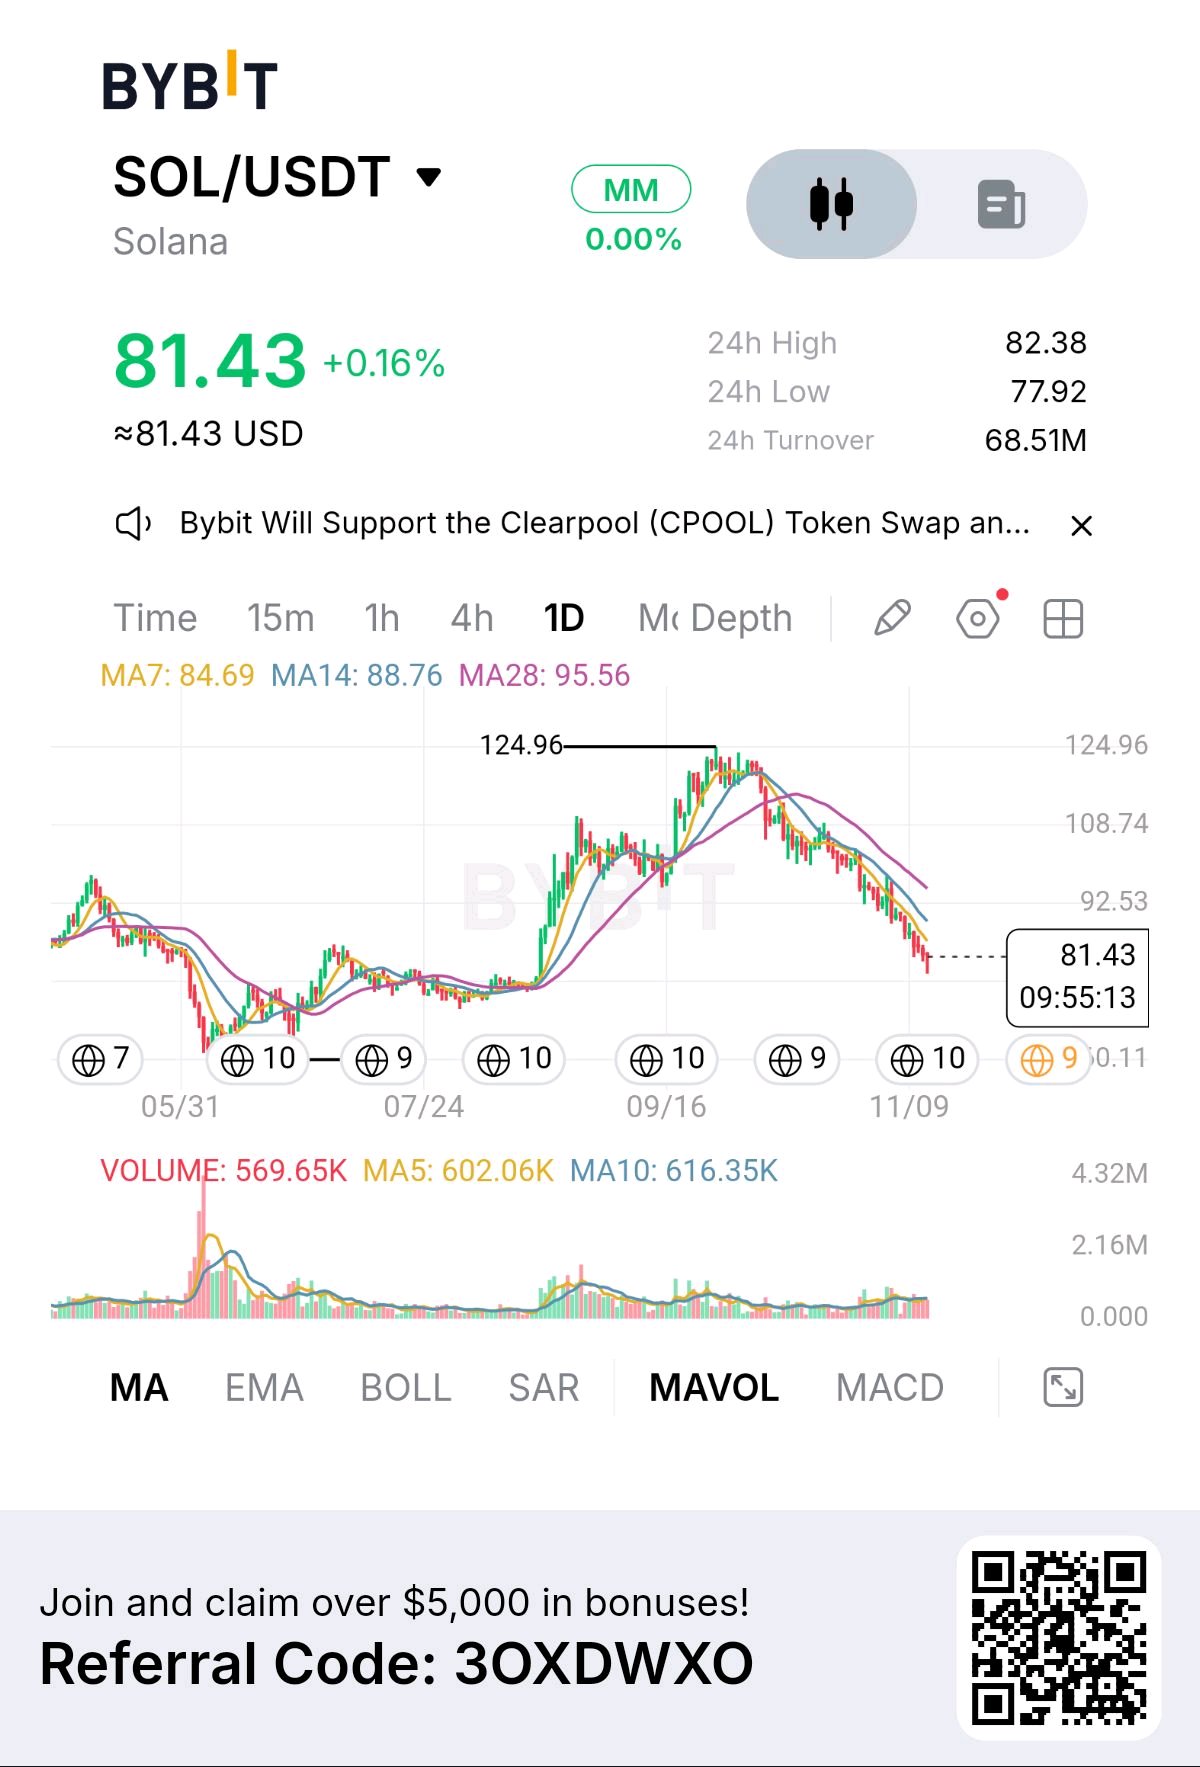
$SOLUSDTis down about 35% from 125 and the chart still hasn't shown me the one thing a real low needs. Look at how the last major low formed: a violent flush on volume many times the norm, then a base. This leg is the opposite. A slow grind lower, volume flat and fading, today's 570K sitting under both its 5 and 10-day averages. Nobody is being forced out. That's an orderly markdown, and orderly markdowns tend to keep going until someone gets squeezed out of the position. Price is also about 15% below the 28MA, so a snapback toward 85-89 can show up any day. I'd treat that as a rubber band, not a reversal. The 7MA near 84.7 is the first lid, the 28MA near 95.6 is the real one. The level that matters below is 78, today's low. A quiet bleed through it means nothing. What I'd actually respect is a break that comes with a volume surge, then a retest on lighter volume. That's capitulation, and that's where a setup starts. $SOLUSDT $BTCUSDT #ByXIMPACT
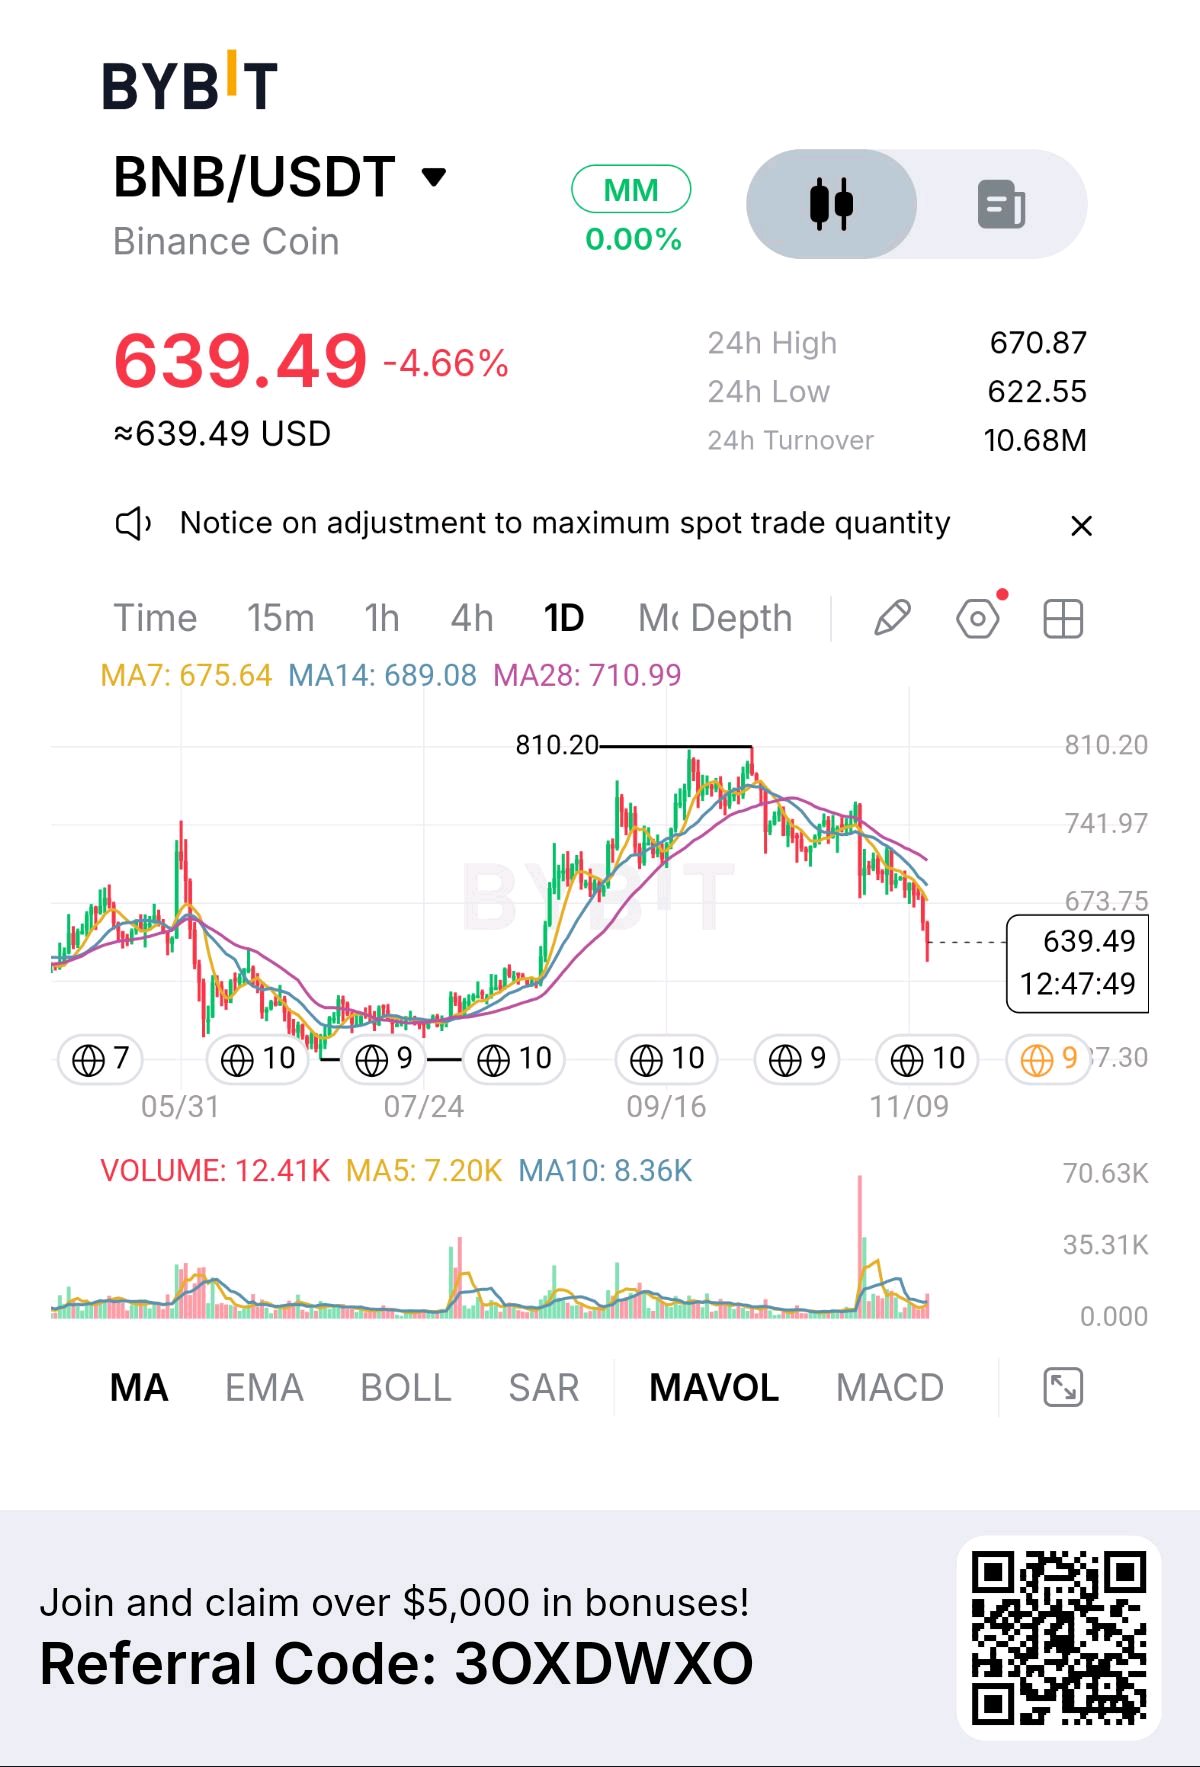
Is BNB at 640 a dip buy? Not yet, and the volume tells you why. The range gave way on a volume spike many times the normal daily average. A real selling climax gets an automatic rally and then a retest of the lows. BNB got neither. The only bounce stalled under the falling MAs and sellers stepped in at every lower high. That's a bear channel, and in Al Brooks' framework pullbacks inside one are sold, not bought, until the channel actually breaks. Today adds to it: down 4.7%, volume already running above its 5-day average, and price sitting under the 7, 14 and 28 MAs, all rolling over. Where it gets interesting: 670-676 is broken support stacked with the 7MA, so that's the first real test of any bounce. 622 is today's low. Lose it and the summer base around the mid-500s becomes the next magnet. What changes my mind is a daily close back above 676 that holds on volume. Until then, patience is the position. $BNBUSDT $ETHUSDT #ByXIMPACT
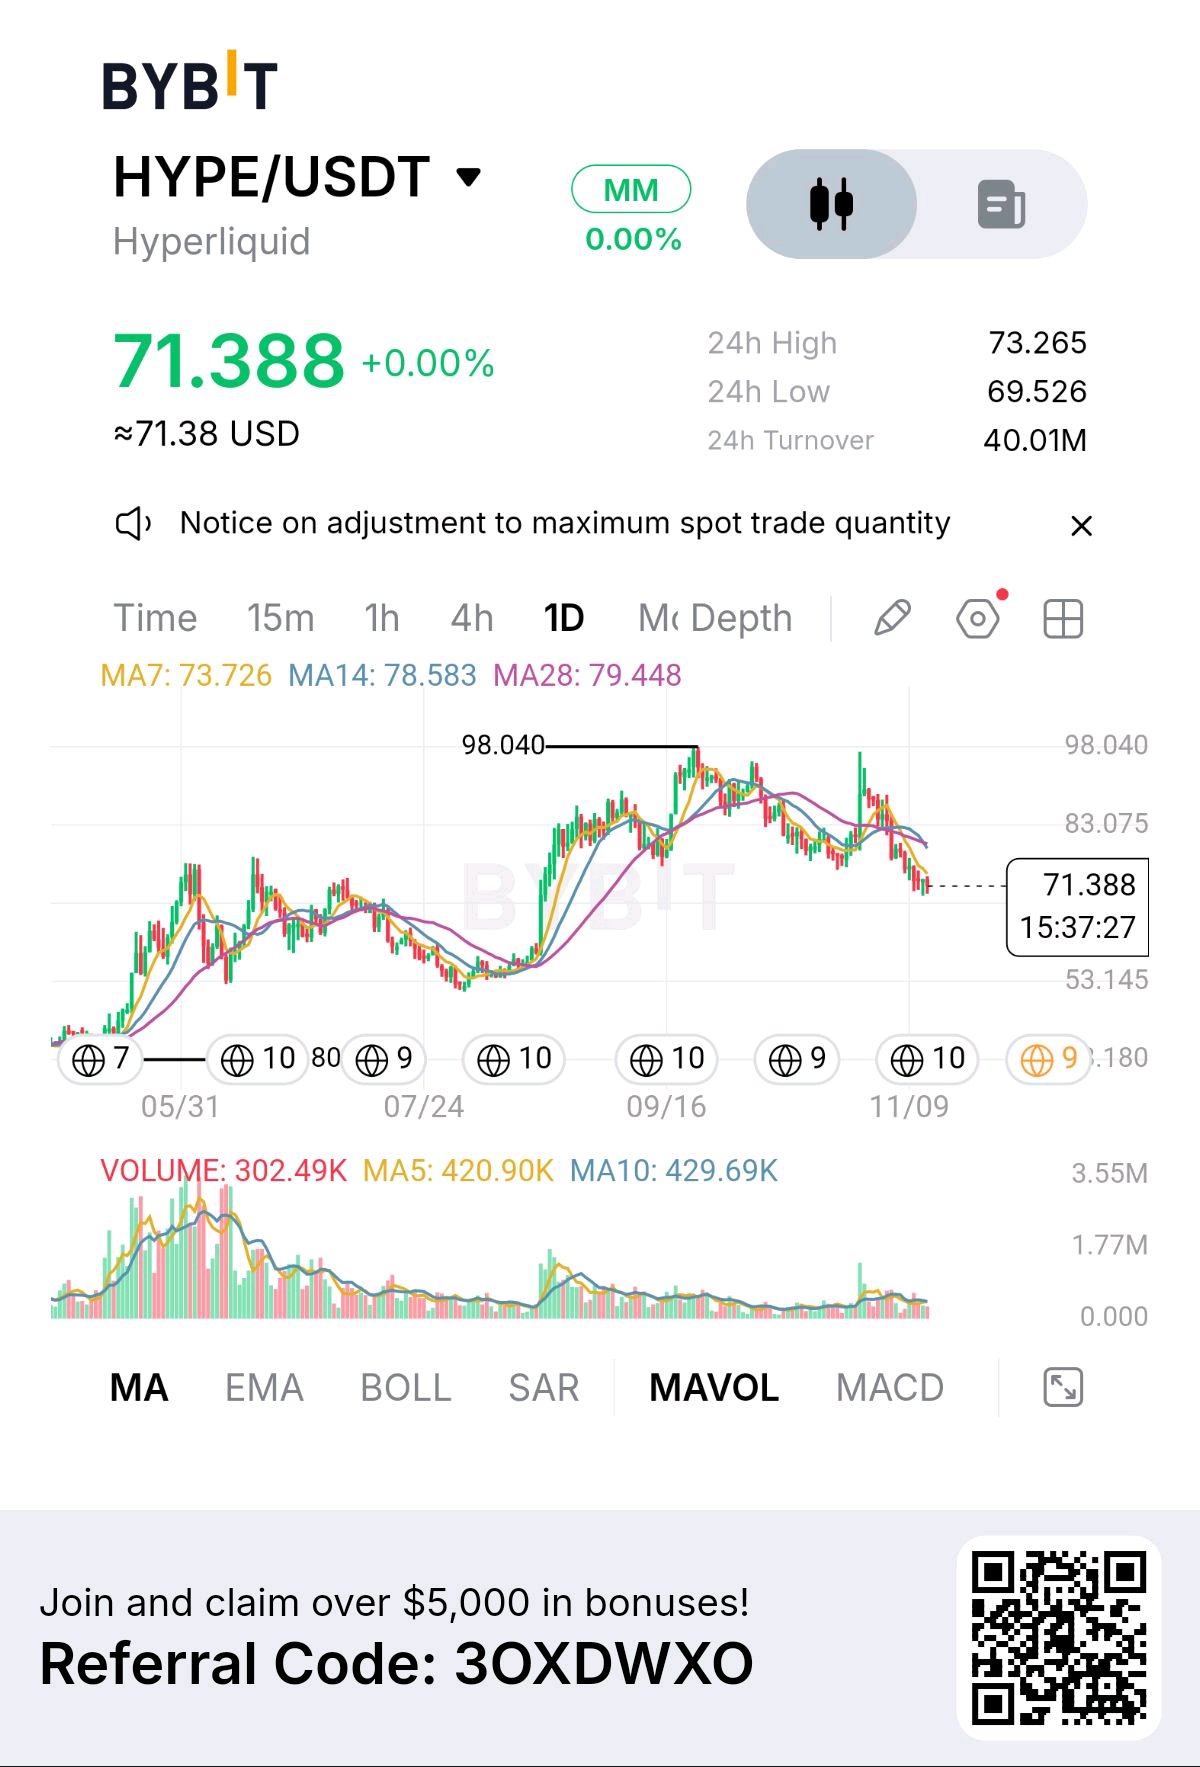
HYPE keeps getting rejected from the same ceiling. Three runs at roughly 96-98, and the latest one is the candle that matters: heavy volume, price pushed above the range, then the entire move handed back within days. That's an upthrust in Wyckoff terms. Big effort, no result, and everyone who bought the break is now trapped above. Since then the structure is plain. Daily MAs stacked 7 under 14 under 28, all pointing down, price at 71.4 below every one of them. Volume on the way down is fading, so this is a drift, not a panic. Drifts usually end at a level, not on a signal. Levels I'm watching: 73-74: the 7MA, first thing bulls must reclaim on a daily close 83: broken support, natural sell zone on any bounce 69.5: the 24h low and the immediate floor 53: the July base if 69.5 gives way My read: bounces below 83 are for selling into, not chasing, until a daily close back over the 7MA comes with real volume. Lose 69.5 and I'm not trying to catch it, I'm waiting for the base to show itself. $HYPEUSDT $BTCUSDT #ByXIMPACT
#BTC #Bitcoin #BTCUSDT #MDFUNDS
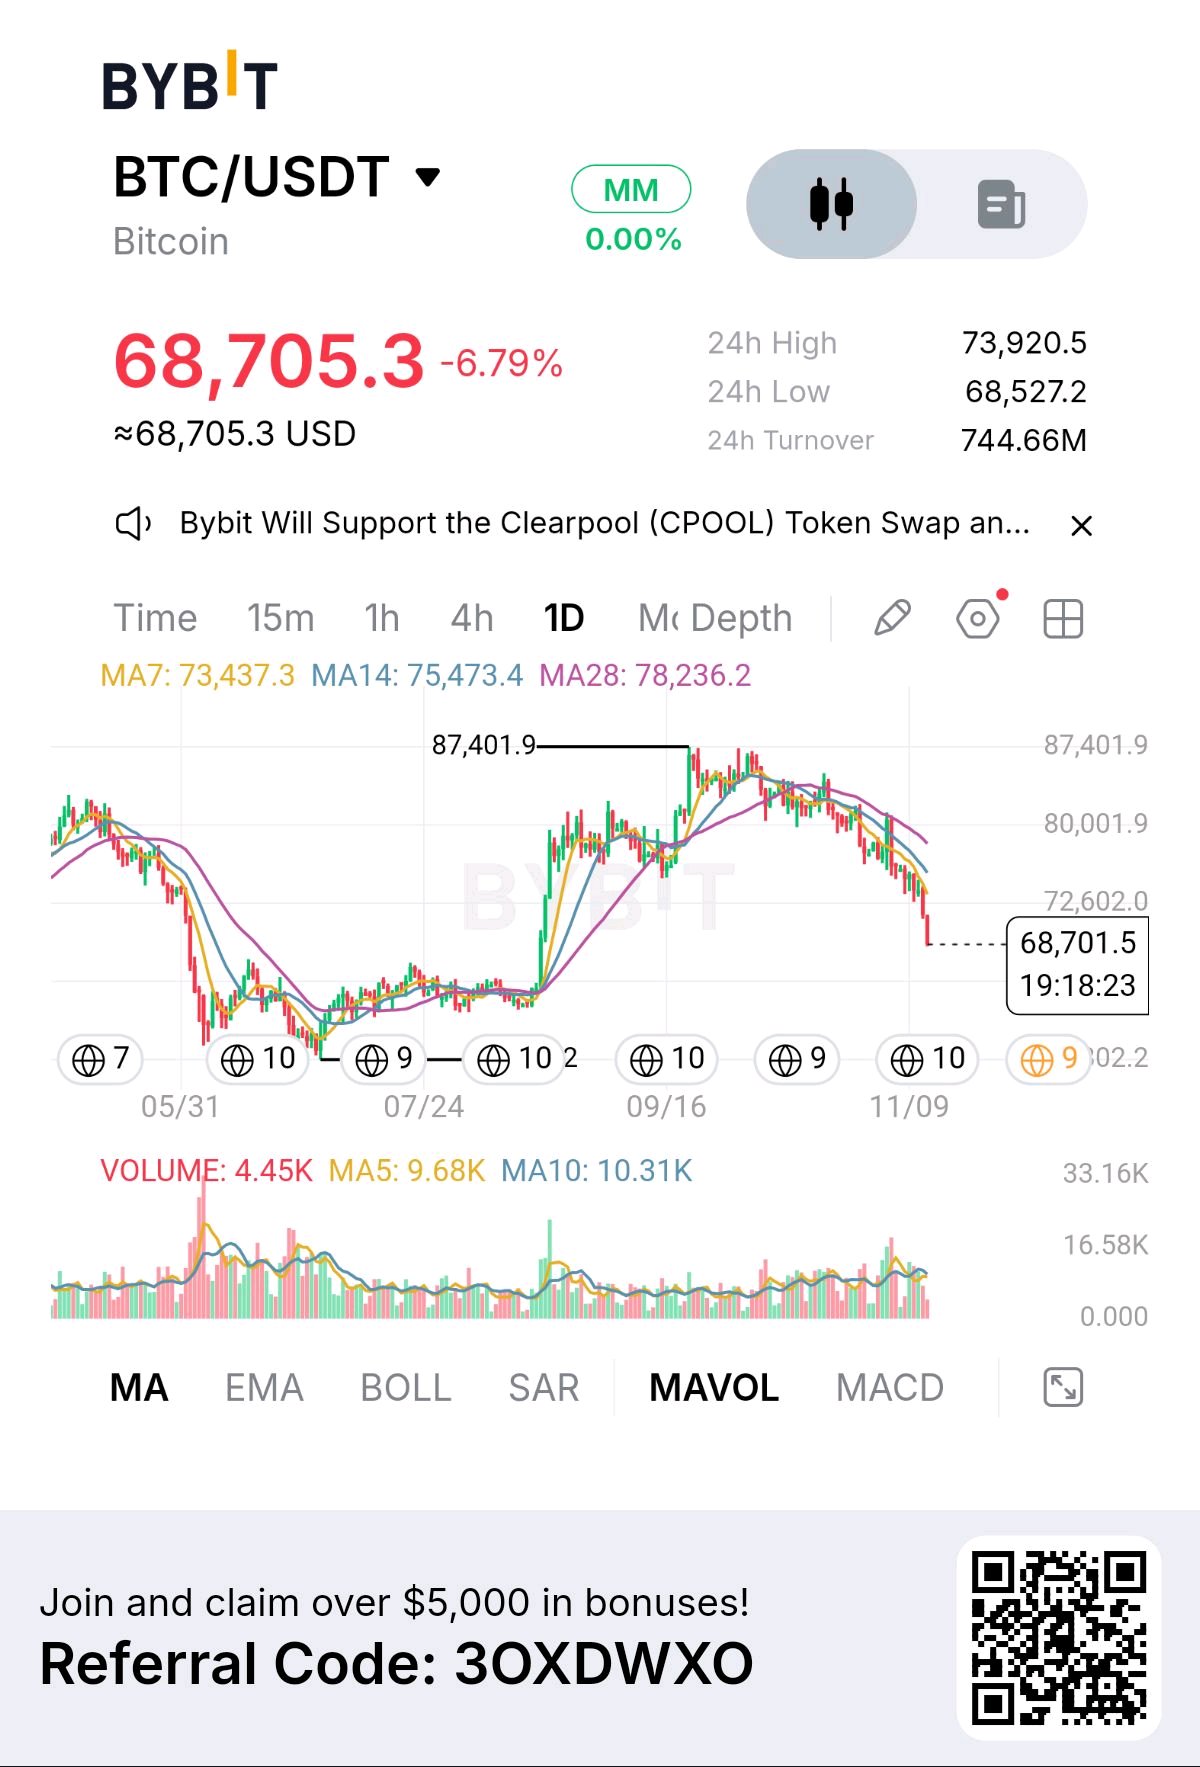
#BTCUSDT| The structure is changing Bitcoin's latest decline deserves attention, but the more revealing development is what happened before the sell-off. After reaching the $87,401 region, BTC struggled to sustain its upward progression. The recovery phase gradually lost momentum, lower highs developed, and price eventually surrendered the $72,600 area. Now trading around $68,705, Bitcoin sits below all three daily moving averages: MA7: $73,437 MA14: $75,473 MA28: $78,236 This alignment reflects a market where sellers have maintained control across multiple time horizons. One detail I wouldn't overlook is volume. The displayed volume is 4.45K against MA5 of 9.68K and MA10 of 10.31K. Since the current daily candle may still be forming, its final volume needs confirmation before drawing conclusions about selling conviction. The immediate test is around $68,500. A sustained breakdown could expose the next lower price area, while a recovery above $72,600 would be an initial attempt to reclaim lost structure. A stronger recovery would require BTC to challenge its declining moving averages. This is where the principles of Dow Theory become particularly relevant: a market should demonstrate a genuine change in its sequence of highs and lows before a trend reversal is accepted. The question isn't whether Bitcoin has fallen enough. It's whether buyers can produce evidence that the sellers are losing control. Would you consider this a developing trend breakdown, or is BTC approaching an area where a meaningful recovery could begin? #BTCUSDT$XAUTUSDT #ByXIMPACT

#QNT #Quant #TradingDeCripto
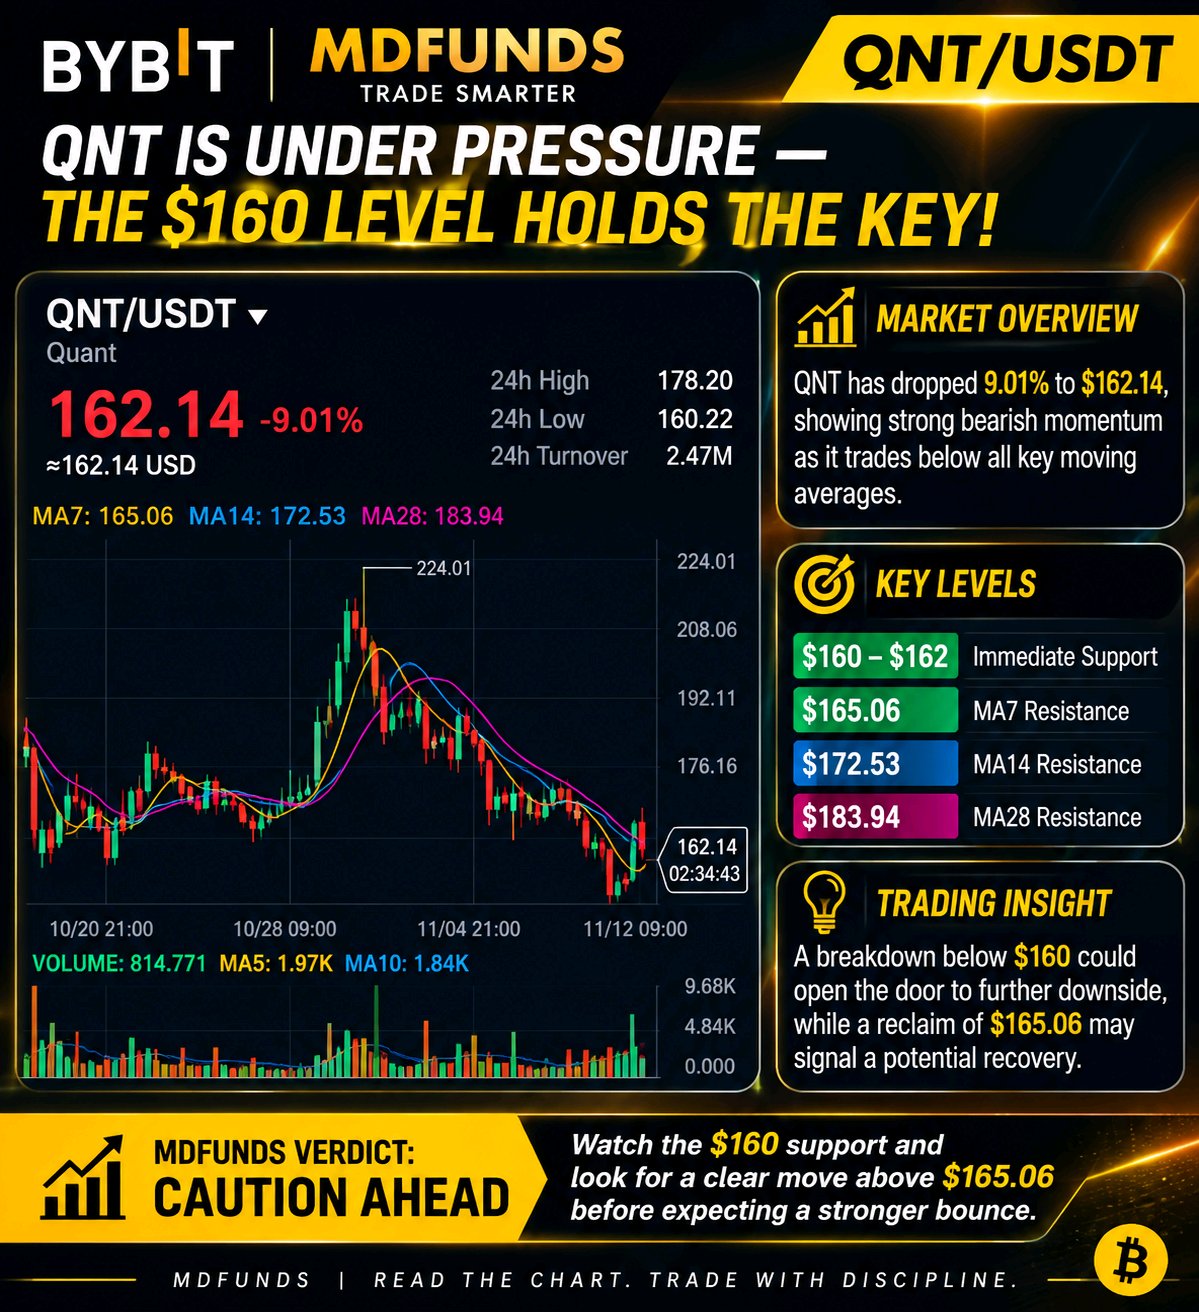
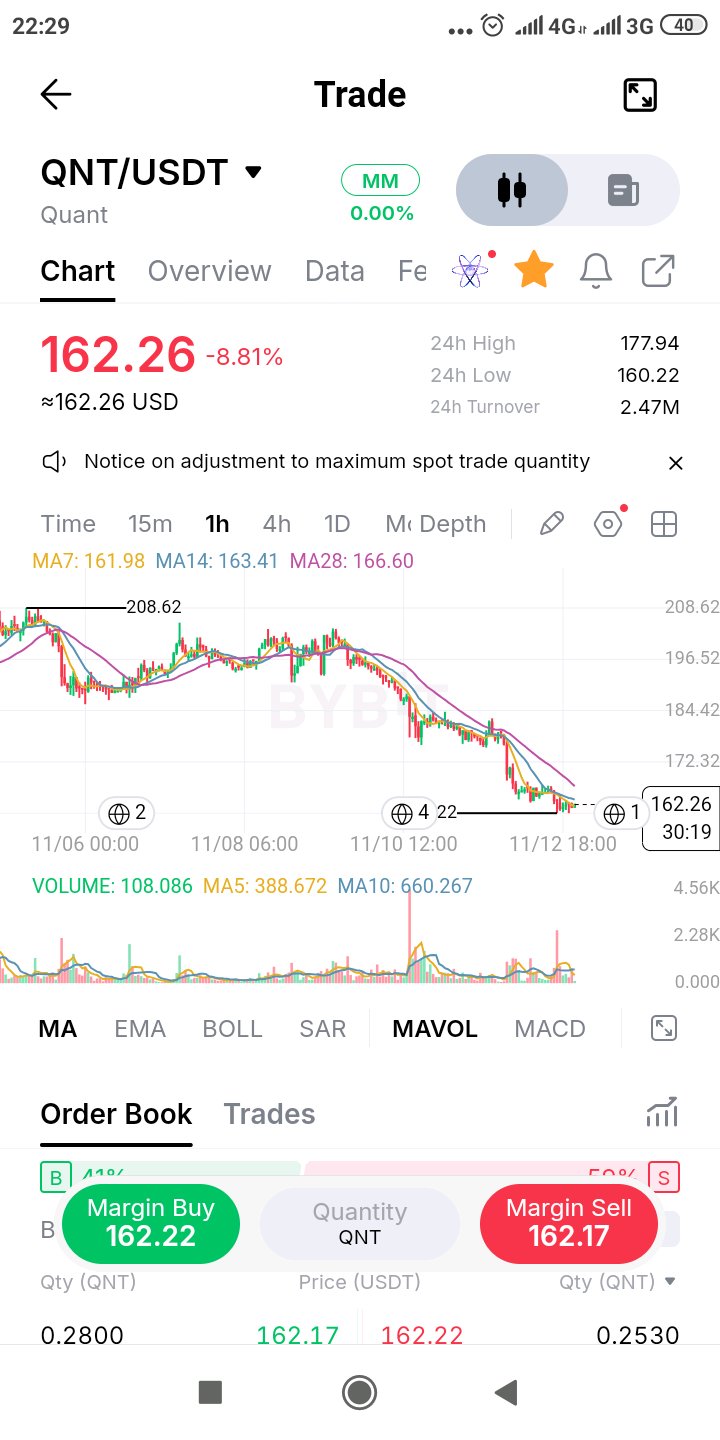
QNT/USDT — La prueba de soporte QNT se está acercando a un nivel donde el mercado necesita probar si los compradores todavía están dispuestos a defender el precio. La estructura de 4H se ha deteriorado considerablemente. El precio está operando por debajo de los tres promedios móviles, con la MA7 en 165.07, la MA14 en 172.54 y la MA28 en 183.94. Esa alineación nos dice que los vendedores actualmente tienen la ventaja estructural. Pero hay otro detalle que vale la pena observar: el precio está rondando ahora los 162, con el mínimo de 24H en 160.22. Aquí es donde podría desarrollarse la siguiente reacción importante. Si los compradores defienden la región de 160–162 y recuperan los 165, podríamos empezar a ver un intento de estabilización. Una recuperación más fuerte por encima de 172 tendría más peso. Sin embargo, una ruptura convincente en 4H por debajo de 160.22 dejaría en duda la actual defensa del soporte. No me apresuraría a cantar un suelo simplemente porque el precio ya ha caído drásticamente. Lo que más me interesa es si los compradores pueden generar una respuesta significativa en este nivel, en lugar de otro rebote temporal. ¿Se está acercando QNT a una oportunidad de demanda, o es este soporte simplemente el siguiente nivel que los vendedores se están preparando para romper? $QNTUSDT $CITYUSDT #ByXIMPACT
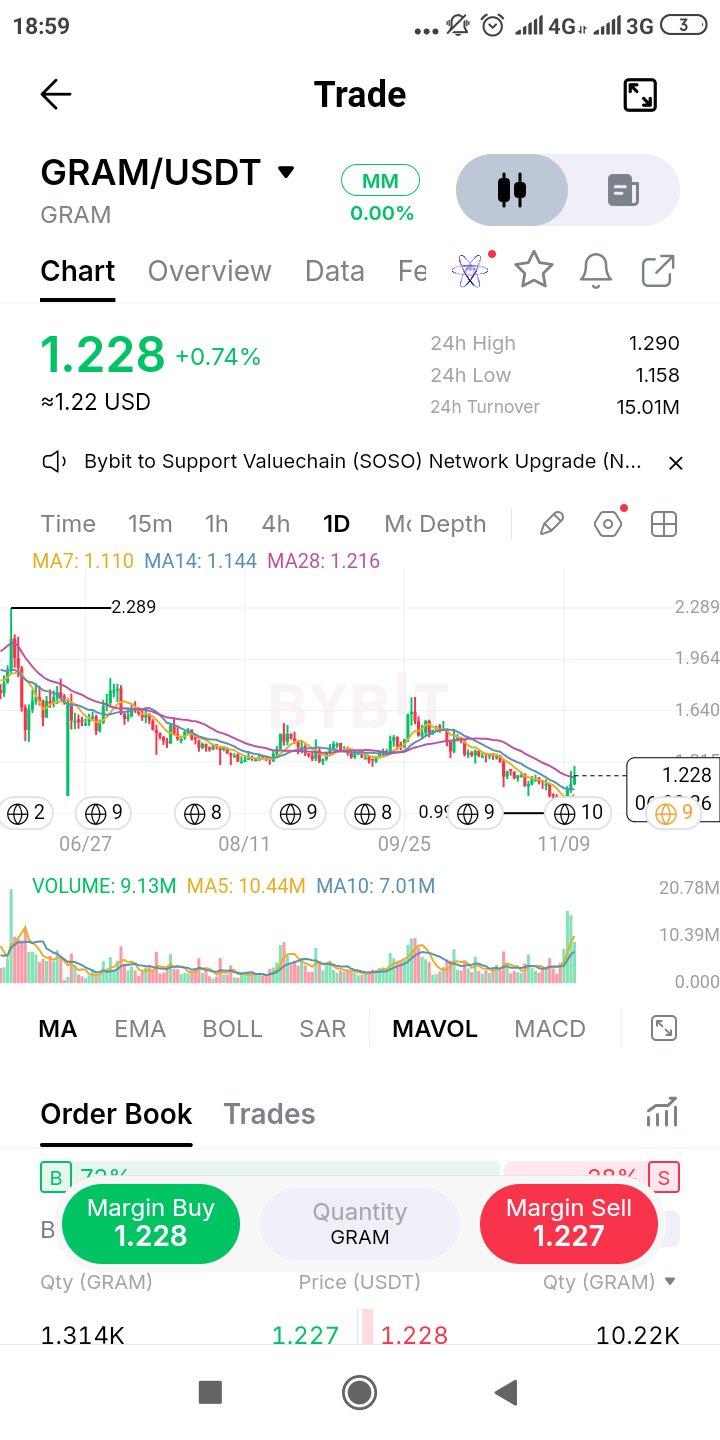
$GRAMUSDT| BULLISH REACTION GRAM IS FINALLY SHOWING SOME FIGHT — BUT IS THIS THE BEGINNING OF A REVERSAL? After an extended period of downward pressure, GRAM is attempting to change the conversation. Trading at $1.228 (+0.74%), the token has bounced from its recent lows, with the latest daily candle showing a noticeable increase in trading activity. What makes this move interesting isn't just the green percentage. It's where the recovery is happening. THE TECHNICAL DEVELOPMENT GRAM has reclaimed all three displayed moving averages: • MA7: $1.110 • MA14: $1.144 • MA28: $1.216 Price is now trading above the entire MA cluster. That's an encouraging short-term development and suggests buyers are beginning to regain some control. However, the broader chart still carries the scars of a prolonged decline from the $2.289 region. One recovery attempt doesn't automatically erase that structure. THE LEVELS I'M WATCHING • $1.216 — MA28 and immediate trend test • $1.158 — 24h low / downside reference • $1.290 — Immediate resistance • $1.40–$1.50 — Potential next recovery zone if momentum expands THE VOLUME TELLS ANOTHER STORY Current volume is 9.13M, compared with MA5 at 10.44M and MA10 at 7.01M. Activity is elevated relative to the 10-period average, supporting the idea that this bounce is attracting attention. But sustained buying participation is what will determine whether this move develops into something bigger. MDFUNDS MARKET VERDICT GRAM is showing an interesting early recovery signal. The critical test is whether buyers can keep price above $1.216 and eventually challenge $1.290. A rejection around resistance could bring another consolidation phase. A convincing breakout, supported by stronger volume, would make the bullish recovery argument considerably stronger. The interesting part isn't that GRAM is green today. It's that price has started challenging a trend that kept sellers in control for months. Watch the follow-through. MDFUNDS Spot the shift before the crowd. Trade the evidence. Analysis based on the supplied Bybit daily chart. Not financial advice. $GRAMUSDT $BTCUSDT #ByXIMPACT

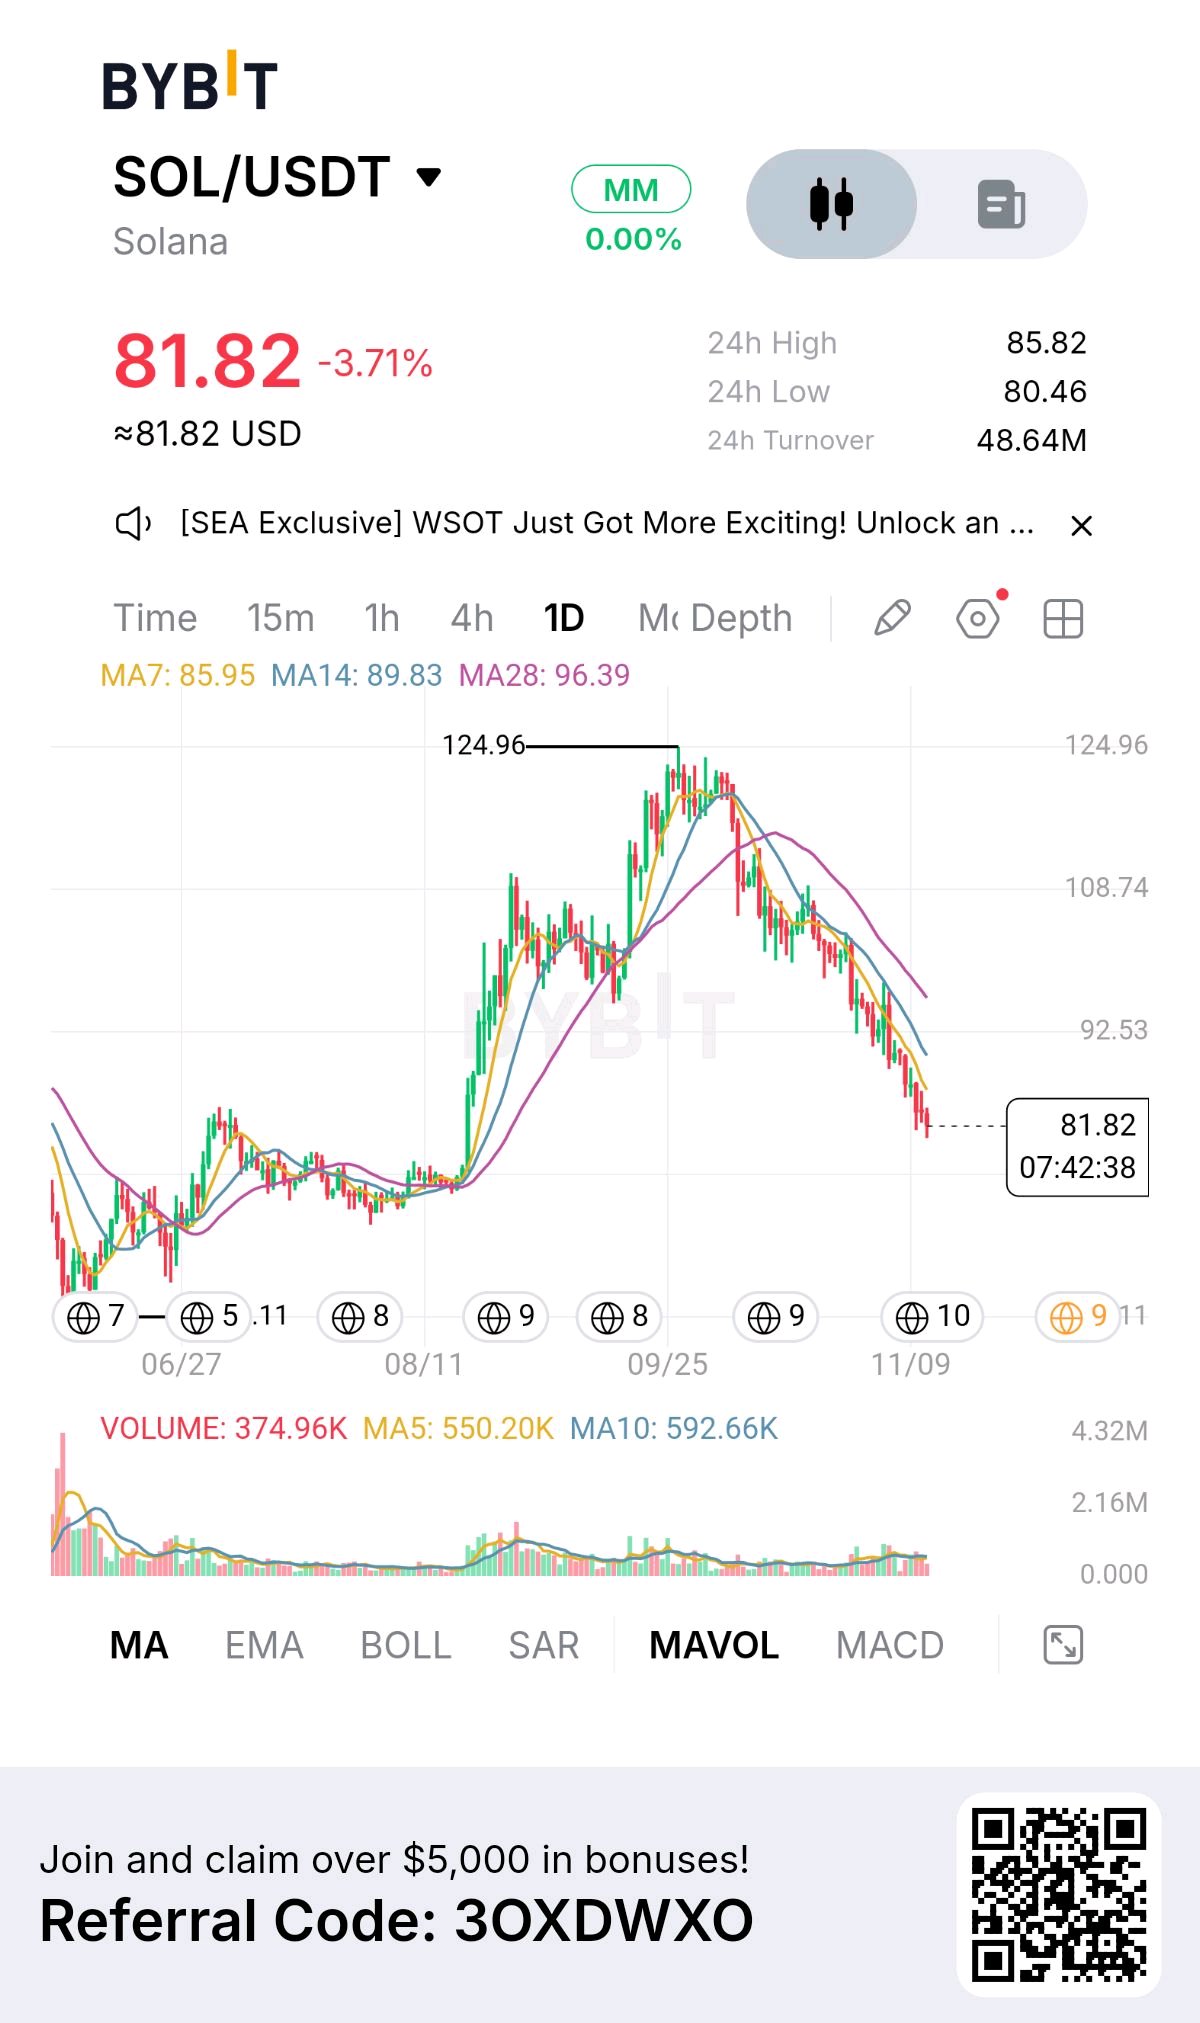
$SOLUSDT| BEARISH MOMENTUM SOLANA IS UNDER PRESSURE — AND THE SELLERS AREN'T DONE PROVING THEIR POINT. Solana is now trading around $81.82, down 3.71%, with the daily chart showing a persistent loss of bullish structure. But there's something more important here than the percentage decline: the sequence of lower highs, weakening recovery attempts and the growing distance between price and its moving averages. THE TECHNICAL PICTURE SOL has fallen below all three displayed moving averages: • MA7: $85.95 • MA14: $89.83 • MA28: $96.39 This alignment puts short-, medium- and longer-period momentum firmly under pressure. The previous rally towards $124.96 has now given way to a substantial correction. Buyers have yet to demonstrate enough strength to reverse that trend. LEVELS THAT COULD DEFINE THE NEXT MOVE • $80.46 — Immediate support / 24h low • $78–$80 — Potential downside reaction area • $85.95 — First recovery hurdle • $89.83–$96.39 — Major moving-average resistance zone WHAT DESERVES ATTENTION? Volume currently stands at 374.96K, below both MA5 (550.20K) and MA10 (592.66K). That matters. The decline is taking place without volume exceeding its recent averages, so we should distinguish between persistent bearish structure and an accelerating sell-off. MDFUNDS MARKET PERSPECTIVE I would be cautious about treating SOL's current price as an automatic buying opportunity. A sustained break below $80.46 could open the door to another leg lower. Conversely, defending that level and reclaiming $85.95 would be the first indication that buyers are attempting to regain control. The bigger challenge for SOL isn't simply bouncing. It's rebuilding a trend. Until that happens, rallies deserve scrutiny rather than blind optimism. MDFUNDS Market intelligence. Structure over speculation. Based on the supplied Bybit 1D chart. Not financial advice. $SOLUSDT $BTCUSDT #ByXIMPACT
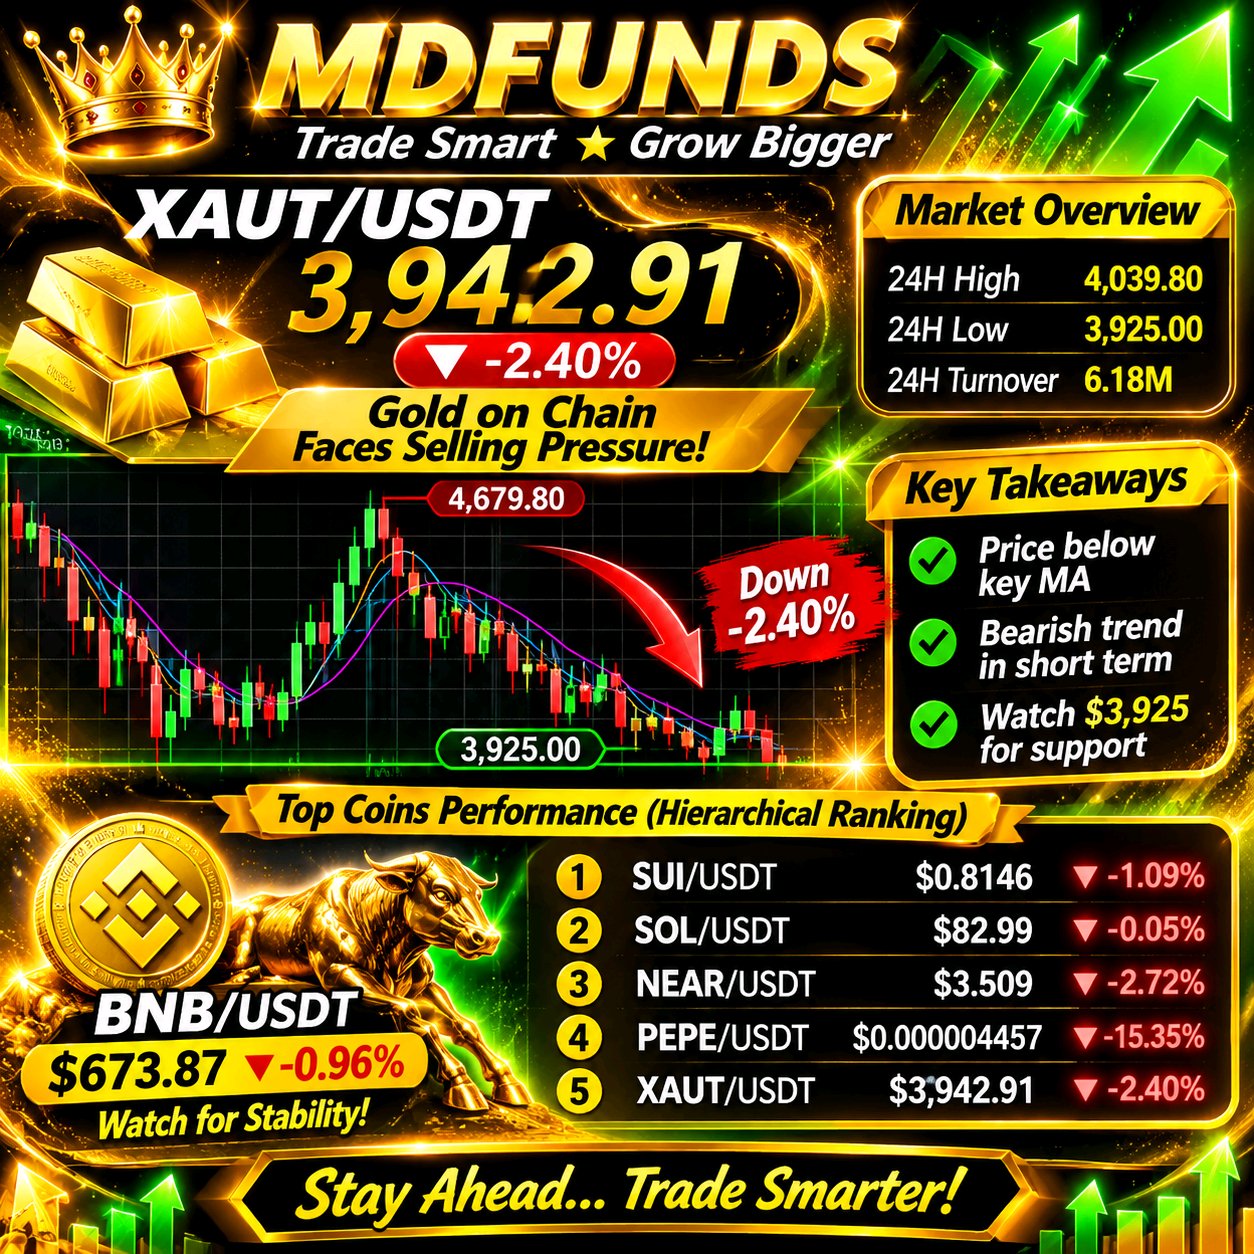
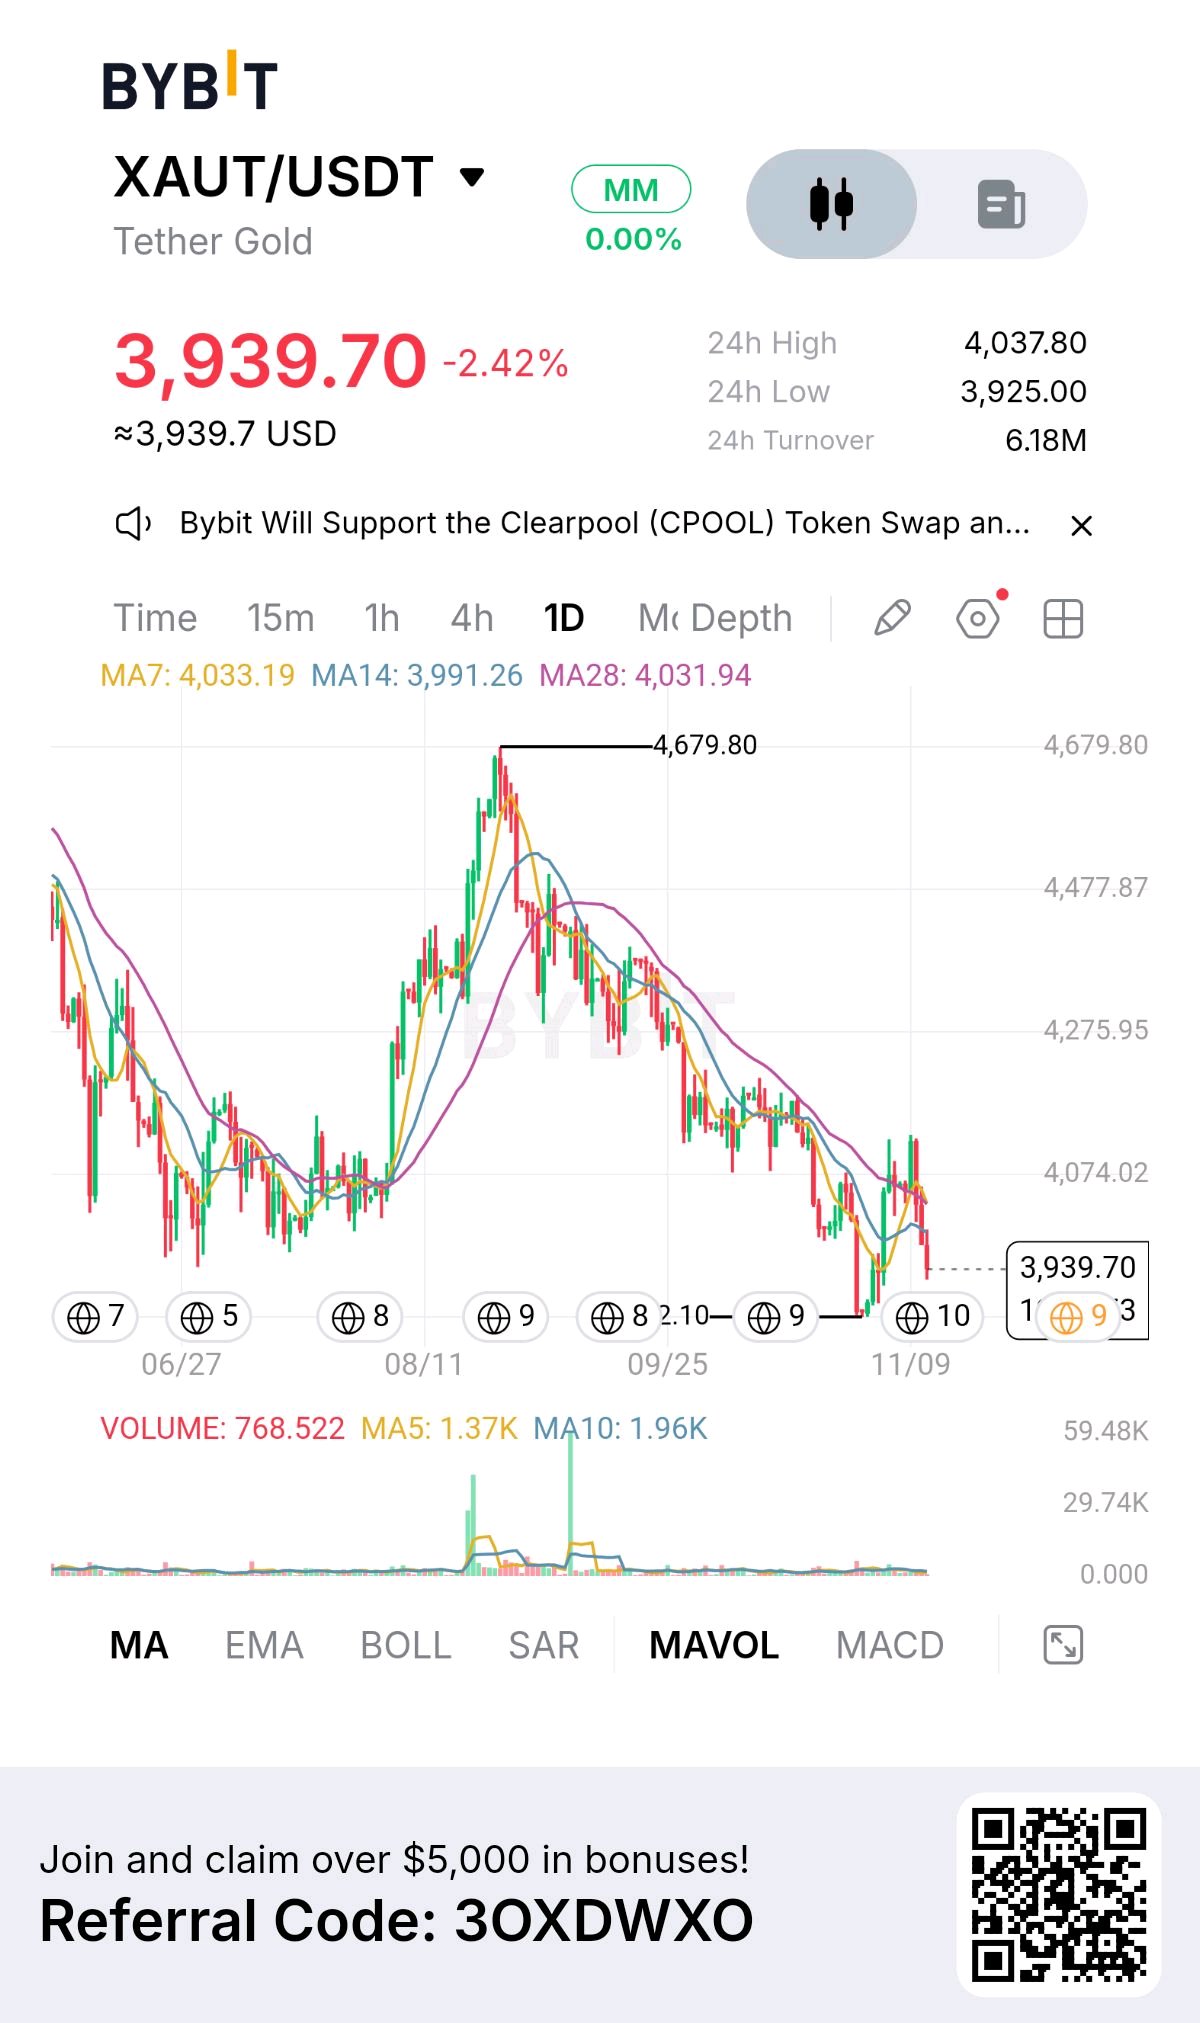
$XAUTUSDT — GOLD IS LOSING MOMENTUM. THE $3,925 LEVEL IS NOW IN FOCUS. Gold-backed crypto exposure is facing renewed selling pressure, and XAUT's daily structure is beginning to demand caution. Trading around $3,942.91 (-2.40%), Tether Gold has slipped beneath all three displayed moving averages. That is an important technical development, particularly after the rally that pushed price towards $4,679.80. WHAT THE CHART IS TELLING US This isn't simply a red candle. The broader structure shows a sequence of lower highs and weakening recovery attempts. Buyers have struggled to sustain upward momentum, while the latest decline has brought price close to its 24-hour low. THREE THINGS DESERVE ATTENTION: • $3,925 — Immediate support. A decisive breakdown could expose XAUT to further downside. • $3,991–$4,034 — Recovery barrier. Reclaiming this zone would be an important first step towards repairing the structure. • $4,039.80 — Near-term resistance. A sustained move above it would strengthen the recovery argument. THE VOLUME QUESTION Current displayed volume is 767, against MA5 at 1.37K and MA10 at 1.96K. Selling is occurring without a corresponding surge in volume. That leaves room for a stabilization attempt, but it does not yet establish buyer control. MY TRADING PERSPECTIVE I wouldn't rush to call a bottom here. If $3,925 gives way, watch for whether sellers can sustain the breakdown. If buyers defend the level and reclaim the $4,000–$4,034 region, the possibility of a short-term recovery becomes more credible. For now, XAUT needs to prove that it can attract buyers again. Patience is a position. Confirmation is an edge. Technical commentary based on the uploaded Bybit 1D chart. Not financial advice. $XAUTUSDT $BTCUSDT #ByXIMPACT