ICaty
6743Me gusta0Compartir en el chat109Aficionados11Seguir
Crypto Trader 📈 | Market Researcher 🔍 Trading market structure, liquidity & narratives. No hype — just charts, data & real setups. 🎯
Crypto Trader 📈 | Market Researcher 🔍 Trading market structure, liquidity & narratives. No hype — just charts, data & real setups. 🎯
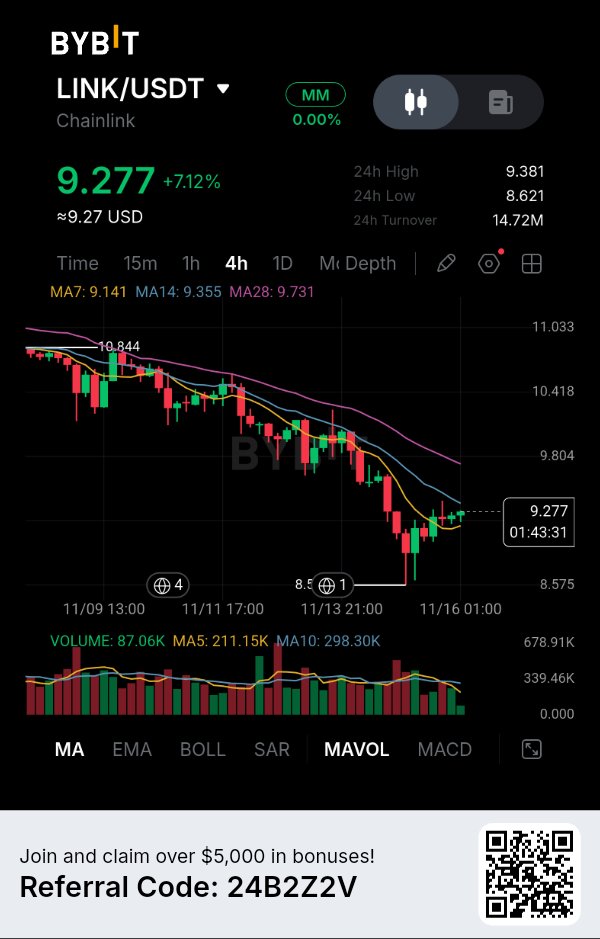
La recuperación del 7% parece interesante, pero los compradores todavía se enfrentan a una zona de resistencia importante. Chainlink está mostrando una fuerte recuperación a corto plazo, con LINK ganando un 7.12% y volviendo a situarse por encima de su MA7 de 4 horas. Sin embargo, lo que me llama la atención es que esta recuperación está ocurriendo dentro de una estructura bajista más amplia. La parte interesante es que los compradores han logrado alejar el precio del mínimo reciente de $8.62, pero ahora se están acercando a una región donde múltiples medias móviles podrían desafiar la recuperación. Quiero entender si este es el comienzo de una verdadera reversión de tendencia o simplemente un rebote de alivio antes de que regresen los vendedores. LA HISTORIA DEL MERCADO LINK cotiza actualmente alrededor de $9.277, tras recuperarse del reciente descenso hacia la zona de $8.621. El gráfico de 4H muestra que la estructura bajista anterior no ha desaparecido por completo. El precio todavía está por debajo de la MA14 y la MA28, a pesar de que se ha recuperado por encima de la MA7. Esto crea una situación técnica interesante. Los compradores están mostrando una fuerza renovada, pero todavía necesitan superar la región de resistencia de $9.35–$9.73 antes de que yo considere convincente la recuperación más amplia. Para mí, la próxima reacción en torno a esta zona importa más que la ganancia actual del 7%. DATOS Y EVIDENCIA Aquí están las cifras importantes de la captura de pantalla de Bybit suministrada: Precio actual: $9.277 Cambio en 24H: +7.12% Máximo en 24H: $9.381 Mínimo en 24H: $8.621 Volumen de operaciones en 24H: $14.72M Máximo visible anterior: $10.844 Las medias móviles revelan una diferencia importante entre el impulso a corto plazo y la tendencia más amplia: MA7: $9.141 MA14: $9.355 MA28: $9.731 LINK ha recuperado la MA7, lo que sugiere una mejora en la presión de compra a corto plazo. Sin embargo, la MA14 y la MA28 permanecen por encima del precio actual. Esto significa que la estructura más amplia de 4H todavía necesita confirmación antes de que se pueda establecer una reversión alcista. El volumen proporciona otro detalle importante: Volumen actual: 87.06K Media móvil de volumen (MA5): 211.15K Media móvil de volumen (MA10): 298.30K A pesar de la recuperación del precio del 7.12%, el volumen actual mostrado sigue estando por debajo de ambas medias. Esto es algo que no ignoraría. El precio se está recuperando, pero la participación aún no ha alcanzado los niveles promedio recientes. Una expansión de volumen más fuerte haría que la recuperación fuera más convincente. MI LECTURA Veo dos niveles importantes en la estructura actual de LINK. El primero es $9.355, donde se posiciona la MA14. El segundo es $9.731, donde la MA28 crea otra resistencia potencial. Si los compradores recuperan ambos niveles y mantienen el precio por encima de ellos, la recuperación actual podría convertirse en una reversión de tendencia más amplia. Sin embargo, si a LINK le cuesta trabajo en torno a esta zona de resistencia y produce un rechazo bajista confirmado en 4H, se hace posible otro movimiento hacia los $9.14 y potencialmente los $8.62. Mi preferencia es evitar perseguir la recuperación después de un movimiento del 7%. Prefiero observar cómo se comporta el precio alrededor de las medias móviles antes de comprometerme con una dirección. CONFIGURACIÓN DE TRADING LINK — Escenario CORTO (SHORT) Activador bajista: Rechazo desde la región de resistencia de $9.35–$9.73, seguido de una vela bajista confirmada en 4H. Zona de entrada: $9.40–$9.65 Stop Loss: $9.85 TP1 (Toma de ganancias 1): $9.14 TP2: $8.85 TP3: $8.62 Invalidación alcista: Aceptación sostenida en 4H por encima de $9.85, debilitando la configuración de continuación bajista. Los objetivos a la baja son estimaciones basadas en la estructura visible del gráfico, con el TP3 posicionado cerca del mínimo anterior de $8.621. Potencial a la baja hasta TP3: Aproximadamente 8%–10%. Relación riesgo-recompensa estimada: Alrededor de 2.5:1, dependiendo de la entrada y la ejecución. Esta configuración es condicional. Esperaría un rechazo real antes de considerar activo el CORTO. TESIS FINAL Lo que hace que Chainlink sea interesante en este momento es el contraste entre el impulso a corto plazo que mejora y una tendencia más amplia que aún no se ha recuperado. La ganancia del 7.12% muestra que los compradores han regresado, pero las medias móviles sugieren que todavía tienen una resistencia importante que superar. Para mí, la región de $9.35–$9.73 determinará si esta recuperación tiene la fuerza suficiente para desafiar la estructura bajista existente. Si los compradores la recuperan con un volumen convincente, la perspectiva cambia. Si los vendedores la defienden, la reciente recuperación podría convertirse en otro máximo más bajo dentro de la tendencia bajista más amplia. La próxima señal importante vendrá de cómo reaccione LINK cuando se encuentre con esta zona de resistencia. $LINKUSDT #ByXIMPACT

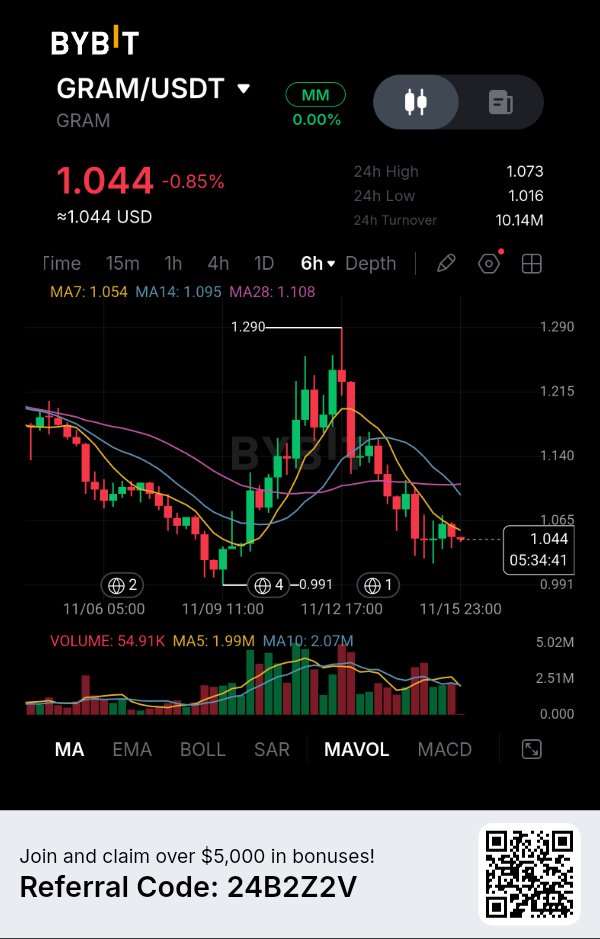
$GRAMUSDT — The recovery toward $1.29 has completely lost momentum, and the 6H chart is showing why sellers still have an advantage. GRAM is trading around $1.044, down 0.85%. What interests me is not the latest small decline, but the inability of buyers to maintain the recovery after the previous explosive rally. The market has moved from a strong upward expansion into a sequence of lower highs, suggesting that sellers are gradually regaining control. What the 6H Structure Is Revealing The moving averages are providing an important confirmation: MA7: $1.054 MA14: $1.095 MA28: $1.108 Price is trading below all three moving averages, while MA7 remains beneath MA14 and MA28. This alignment suggests that the broader short-term momentum is still bearish. Another detail deserves attention. After reaching $1.29, GRAM failed to sustain its upward momentum and gradually returned toward the $1.016 support area. The recent recovery attempts have also struggled to reclaim the moving-average cluster. For me, this suggests that buyers haven't yet demonstrated enough strength to establish a genuine trend reversal. My Market Outlook I'm leaning toward bearish continuation, particularly if price attempts another recovery toward the $1.095–$1.108 resistance zone. If sellers defend this region, another downside move could develop. My downside roadmap: $1.016 — First major support. $0.991 — Previous structural low. $0.970 — Extended projected downside objective. The $0.991 level is particularly important because it represents the previous visible swing low. My Trading Signal Direction: SHORT (conditional) Entry: $1.095–$1.108 after confirmed bearish rejection. Stop Loss: $1.130 TP1: $1.016 TP2: $0.991 TP3: $0.970 Reference Entry: $1.100 Potential downside to TP3: Approximately 11.82%. Defined risk: Approximately 2.73%. Risk-to-Reward: Approximately 4.33:1. I want to see price revisit the moving-average resistance zone and show a clear rejection before considering this setup. I won't chase the market lower at current support. What Could Invalidate My View? A sustained 6H recovery above $1.108 would be the first warning against my bearish thesis. A stronger move above $1.130 would invalidate the proposed short setup and suggest that buyers are beginning to regain control. On the other hand, a decisive breakdown below $1.016 could strengthen the bearish continuation scenario. Risk Management GRAM has already experienced significant volatility, especially during its previous rally toward $1.29. That's why I don't want to mistake a temporary bounce for a confirmed reversal. My preference is to wait for a recovery into resistance and let sellers demonstrate whether they still control the market. For now, the moving averages and lower-high structure favor sellers. The important question is whether GRAM can reclaim $1.10 or whether another failed recovery will send price back toward the $0.991 structural low. $GRAMUSDT #ByXIMPACT

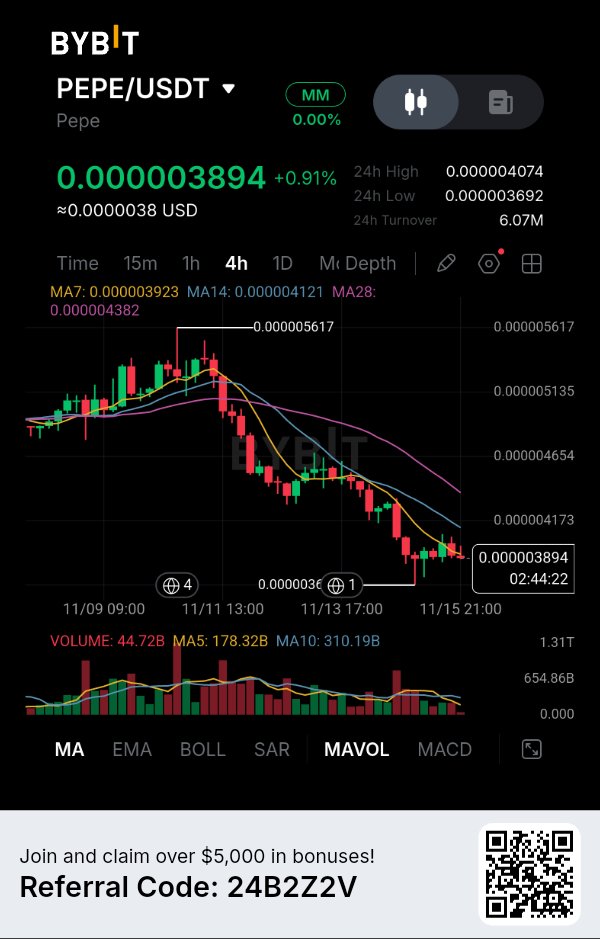
The Recovery Is Losing Momentum While Sellers Continue Controlling the 4H Structure. PEPE is showing a small positive 24H change, but the bigger picture tells a different story. What catches my attention is that despite the latest stabilization around $0.000003894, price remains below all three moving averages, and buyers have not yet demonstrated enough strength to reverse the existing downtrend. The interesting part is that PEPE is attempting to establish a floor near its recent lows, but trading activity has weakened considerably. This creates an important situation: are buyers quietly building support, or is the market simply pausing before another downward move? THE MARKET STORY PEPE is currently trading around $0.000003894, with a 24H gain of 0.91%. However, I would not interpret this small recovery as a bullish reversal. The 4H chart shows a clear sequence of lower highs and lower lows after the rejection near $0.000005617. Since then, recovery attempts have consistently struggled to regain previous resistance levels. What interests me most is the current position of price relative to the moving averages. PEPE is trading slightly below MA7 and significantly below MA14 and MA28. This suggests that the recent stabilization has not yet changed the broader bearish structure. DATA & EVIDENCE Here are the important figures from the supplied Bybit chart: Current price: $0.000003894 24H change: +0.91% 24H high: $0.000004074 24H low: $0.000003692 24H turnover: $6.07M Previous visible high: $0.000005617 The moving averages reveal the current market structure: MA7: $0.000003923 MA14: $0.000004121 MA28: $0.000004382 All three moving averages are positioned above the current price. More importantly, MA7 remains below MA14, while MA14 remains below MA28. This bearish alignment suggests that sellers continue to have the advantage on the 4H timeframe. Volume provides another important observation: Current volume: 44.72B Volume MA5: 178.32B Volume MA10: 310.19B Current displayed volume is considerably below both averages. This indicates that the latest price stabilization is happening with relatively weak trading participation. I would like to see stronger volume before considering the recovery a meaningful change in market direction. MY READ: I believe PEPE is approaching an important decision point around $0.000003692. If buyers successfully defend this level, another recovery toward $0.000003923 and potentially $0.000004121 becomes possible. However, reclaiming MA7 alone would not convince me that the trend has reversed. The more interesting scenario is a confirmed 4H breakdown below $0.000003692, followed by a failed retest. That would suggest buyers are losing their grip on the current support area and could open the door to another downward extension. I am not interested in chasing the existing decline. I want confirmation that sellers can turn the recent low into resistance. TRADING SETUP PEPE — SHORT Scenario: Bearish trigger: Confirmed 4H candle close below $0.000003692, followed by a failed retest. Entry Zone: $0.00000366–$0.00000369 Stop Loss: $0.00000388 TP1: $0.00000355 TP2: $0.00000342 TP3: $0.00000328 Bullish invalidation: PEPE reclaims $0.000004121 and establishes sustained 4H strength above this resistance. The downside targets are estimated extension levels because lower support zones are not clearly established in the supplied screenshot. Potential downside to TP3: Approximately 10%–11%. Defined risk: Approximately 5%–6%. Estimated risk-to-reward: Around 2:1. This setup remains conditional. I would not activate the SHORT position unless the $0.000003692 support breakdown is confirmed. FINAL THESIS: What makes PEPE interesting right now is the difference between its slightly positive 24H performance and its still-bearish 4H structure. A small green daily change does not necessarily mean buyers are regaining control. The moving averages, declining recovery attempts, and weaker recent volume all suggest that the market still needs stronger evidence before a trend reversal can be considered. For me, $0.000003692 is the level that deserves the most attention. A confirmed breakdown could expose lower price levels, while a successful defense followed by a reclaim of $0.000004121 would challenge the bearish thesis. The next important move will depend on whether buyers can turn this stabilization into genuine demand or whether sellers continue controlling the market structure. $PEPEUSDT #ByXIMPACT

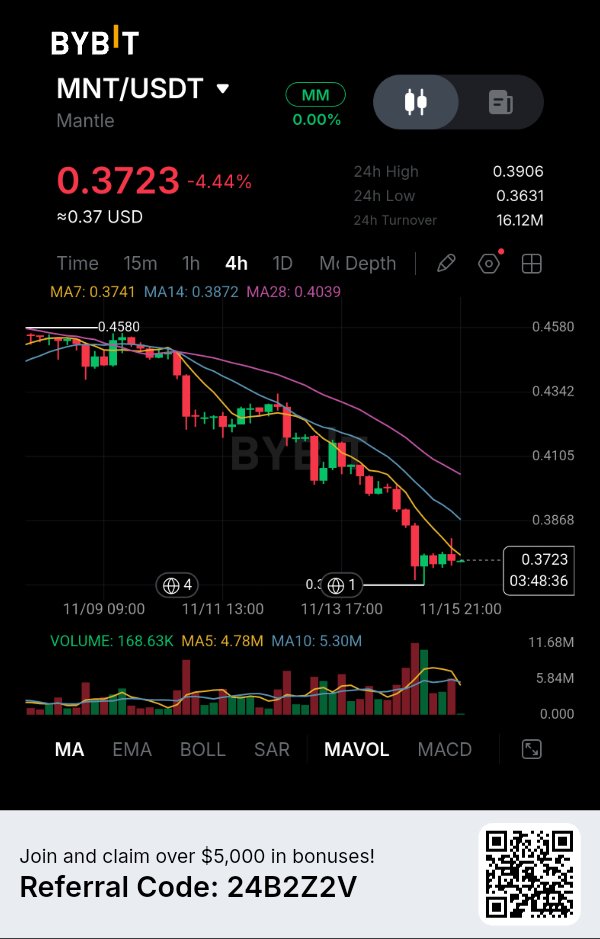
$MNTUSDT — The latest breakdown has shifted the balance further toward sellers, and I'm watching whether the next recovery attempt becomes another opportunity for downside continuation. Mantle is trading around $0.3723, down 4.44%, and the 4H chart is showing a persistent sequence of lower highs and lower lows. What caught my attention is that buyers are struggling to recover even after price reaches a nearby support area. The latest bounce remains relatively weak compared with the selling pressure that preceded it. What the 4H Structure Is Revealing The moving averages are showing a clear bearish alignment: MA7: $0.3741 MA14: $0.3872 MA28: $0.4039 Price is trading below all three averages, with the MA7 positioned beneath the MA14 and MA28. This suggests that the broader short-term momentum remains bearish. Another important observation is the rejection from the $0.4100 region. Since that rejection, sellers have gradually pushed MNT lower, eventually bringing price toward the $0.3631 area. For me, the MA14 around $0.3872 is particularly important. Unless buyers reclaim this region, the current recovery attempts remain vulnerable. My Market Outlook I'm favoring bearish continuation, but I don't want to chase the current decline. My preferred scenario is a recovery toward the $0.3820–$0.3870 resistance zone, followed by a confirmed rejection. If sellers defend that area, another downside move could develop. My downside roadmap: $0.3631 — Immediate support and first target. $0.3550 — Next projected downside level. $0.3450 — Extended downside objective. The lower two levels are estimated projections rather than confirmed support levels on the visible chart. My Trading Signal Direction: SHORT (conditional) Entry: $0.3820–$0.3870 after confirmed bearish rejection. Stop Loss: $0.4050 TP1: $0.3631 TP2: $0.3550 TP3: $0.3450 Reference Entry: $0.3850 Potential downside to TP3: Approximately 10.39%. Defined risk: Approximately 5.19%. Risk-to-Reward: Approximately 2.00:1. I want sellers to demonstrate strength around the entry zone before considering this position. If MNT continues falling without a retest, I won't chase the move. What Could Invalidate My View? A sustained 4H recovery above $0.3872 would be the first warning against my bearish thesis. A stronger reclaim of the $0.4039 MA28 would challenge the broader downward structure and suggest buyers are beginning to regain control. On the other hand, a decisive breakdown below $0.3631 could strengthen the bearish continuation scenario. Risk Management MNT is approaching an important support area, and that's exactly why entry timing matters. Selling directly into support can expose a position to an unexpected rebound. I'd rather wait for price to recover toward resistance and allow sellers to confirm their presence. For now, the moving averages and market structure favor sellers. The next important battle is around $0.3870. Can buyers reclaim the lost trend levels, or will another recovery attempt give sellers the opportunity to push Mantle toward lower prices? $MNTUSDT #ByXIMPACT

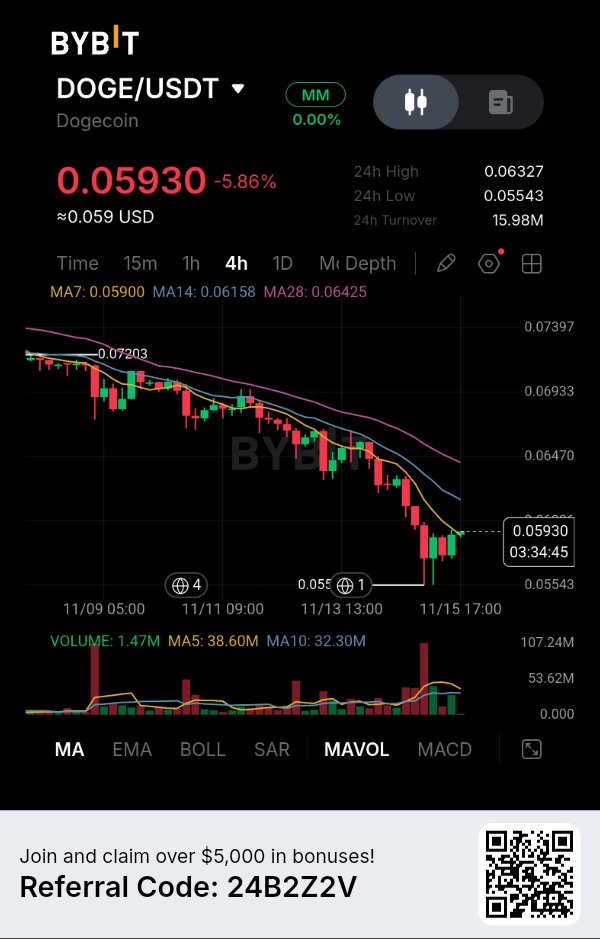
The Bounce Is Back, But Buyers Still Have Something to Prove. Dogecoin has recovered slightly from its recent low, but the interesting part is that this bounce has not yet changed the broader 4H market structure. DOGE is trading around $0.05930 after an 5.86% decline, while its two higher moving averages continue to act as overhead resistance. What catches my attention is the reaction around $0.05543. Buyers stepped in near this level, but the recovery is still relatively limited compared with the preceding decline. This creates an interesting situation: is DOGE building a temporary floor, or are sellers preparing for another attempt at the recent low? THE MARKET STORY: DOGE is currently trading near $0.05930, after declining from the visible $0.07203 region. The 4H chart shows a persistent sequence of lower highs and lower lows. However, the latest candles indicate that buyers are attempting to stabilize price after the sharp move toward $0.05543. I am particularly interested in the position of the moving averages. DOGE has managed to move slightly above MA7, but MA14 and MA28 remain considerably higher. This suggests that short-term buying interest has appeared without confirming a broader trend reversal. For me, the next important battle is around $0.06158. DATA & EVIDENCE Here are the important figures from the supplied Bybit chart: * Current price: $0.05930 * 24H change: -5.86% * 24H high: $0.06327 * 24H low: $0.05543 * 24H turnover: $15.98M * Previous visible high: $0.07203 The moving averages reveal the current market structure: * MA7: $0.05900 * MA14: $0.06158 * MA28: $0.06425 DOGE is slightly above MA7 but remains below MA14 and MA28. The positioning of these averages is still bearish, with MA7 below MA14 and MA14 below MA28. This suggests that the broader selling structure remains intact. Volume provides another interesting detail: Current volume: 1.47M Volume MA5: 38.60M Volume MA10: 32.30M The latest displayed volume is considerably below both averages. This indicates that the current recovery is not accompanied by the same level of trading activity seen during previous periods. I would like to see stronger participation before treating this bounce as a meaningful change in market direction. MY READ: I believe DOGE is approaching an important resistance test. The $0.06158 region is particularly important because it aligns with MA14. If buyers manage to reclaim this level and sustain price above it, the current bearish interpretation will begin to weaken. However, if DOGE approaches this region and sellers reject the recovery, another move toward $0.05800 and potentially $0.05543 becomes possible. I am not interested in shorting simply because DOGE has already declined. I want to see buyers lose momentum near resistance and sellers confirm their return through a bearish 4H reaction. That would provide a much more interesting trading opportunity. TRADING SETUP DOGE/USDT — SHORT Scenario Bearish trigger: Rejection from the $0.06100–$0.06158 resistance zone, confirmed by a bearish 4H candle. Entry Zone: $0.06100–$0.06150 Stop Loss: $0.06350 TP1: $0.05800 TP2: $0.05650 TP3: $0.05550 Bullish invalidation: Sustained 4H acceptance above $0.06350. The downside targets are based on estimated price projections and the visible support structure. The final target is positioned close to the previous $0.05543 low. Potential downside to TP3: Approximately 9%. Defined risk: Approximately 3.3%–4.1%. Estimated risk-to-reward: Around 2:1 or better, depending on execution. This setup remains conditional. I would wait for the resistance rejection rather than chase an entry at the current price. FINAL THESIS: What makes DOGE interesting right now is the difference between short-term stabilization and an actual recovery in market structure. Buyers have defended the recent low, but they still need to overcome the moving-average resistance before I would consider the trend meaningfully improved. For me, $0.06158 is the level that deserves the most attention. A successful reclaim could change the current outlook, while another rejection could bring $0.05543 back into focus. The next move will depend on whether buyers can turn this small recovery into sustained demand or whether sellers continue controlling the broader structure. $DOGEUSDT #ByXIMPACT

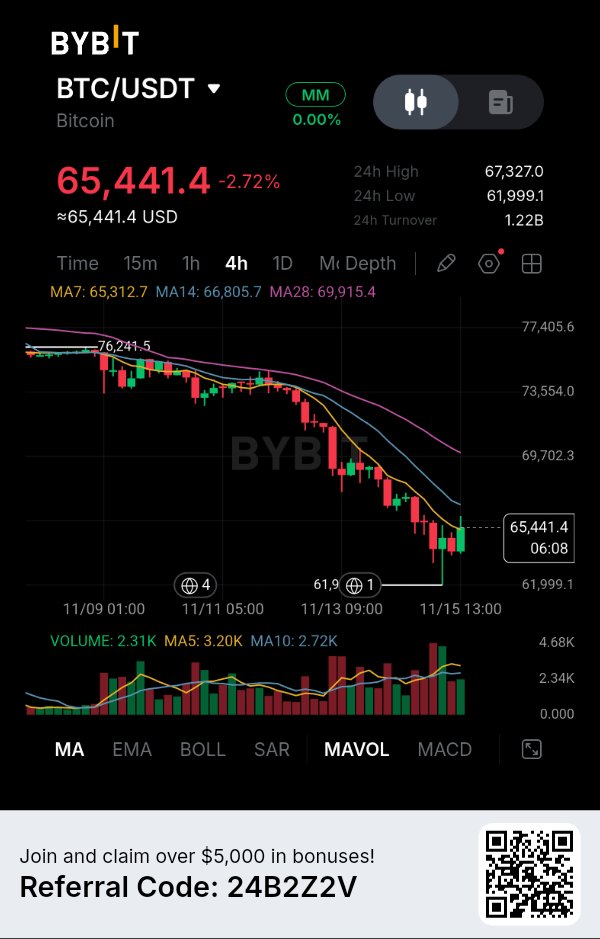
$BTCUSDT — Bitcoin's latest bounce is interesting, but I'm not convinced the market has found its bottom yet. The 4H structure still favors sellers, and the next resistance test could reveal whether this recovery has real strength. Bitcoin is trading around $65,441, down 2.72%. After falling from the $76,241 region toward $61,999, buyers have finally produced a noticeable reaction. But there's an important distinction between a relief bounce and an actual trend reversal. What the 4H Chart Is Revealing The moving averages are showing where the current pressure remains: MA7: $65,312.7 MA14: $66,805.7 MA28: $69,915.4 Price has managed to move slightly above MA7, which suggests short-term stabilization. However, BTC remains below MA14 and MA28. The wider structure is still bearish, with a clear sequence of lower highs and lower lows. What interests me most is the $66,800 region. This is where the MA14 sits, making it an important resistance area for the next recovery attempt. If buyers fail to reclaim this level, the recent bounce could become another opportunity for sellers. My Market Outlook I'm leaning toward bearish continuation unless Bitcoin can establish a stronger structure above the moving-average resistance. My downside roadmap: $61,999 — Previous major low and first downside objective. $60,500 — Next projected downside target. $58,500 — Extended downside objective. The lower two levels are projected extensions, not confirmed support levels on the visible chart. My Trading Signal Direction: SHORT (conditional) Entry: $66,000–$66,800 after confirmed bearish rejection. Stop Loss: $68,000 TP1: $61,999 TP2: $60,500 TP3: $58,500 Reference Entry: $66,400 Potential downside to TP3: Approximately 11.90%. Defined risk: Approximately 2.41%. Risk-to-Reward: Approximately 4.94:1 to TP3. I want to see sellers defend the MA14 resistance zone before considering this trade. If Bitcoin breaks above resistance with convincing momentum, I won't force a short position. What Could Invalidate My View? A sustained 4H recovery above $66,805 would be the first warning against my bearish thesis. A stronger reclaim of the $69,915 MA28 would suggest that buyers are beginning to challenge the broader downward structure. On the other hand, a rejection from $66,800 followed by a breakdown toward $61,999 would strengthen the bearish continuation scenario. Risk Management Bitcoin has already experienced a significant decline, so chasing the current move lower isn't my preferred approach. I'd rather wait for a recovery into resistance and let the market show whether sellers are still in control. For now, MA7 is providing short-term support, but MA14 and MA28 remain overhead obstacles. The next important battle is around $66,800. Bitcoin has shown that buyers can produce a bounce. Now they need to prove they can turn that bounce into a genuine change in market structure. $BTCUSDT #ByXIMPACT


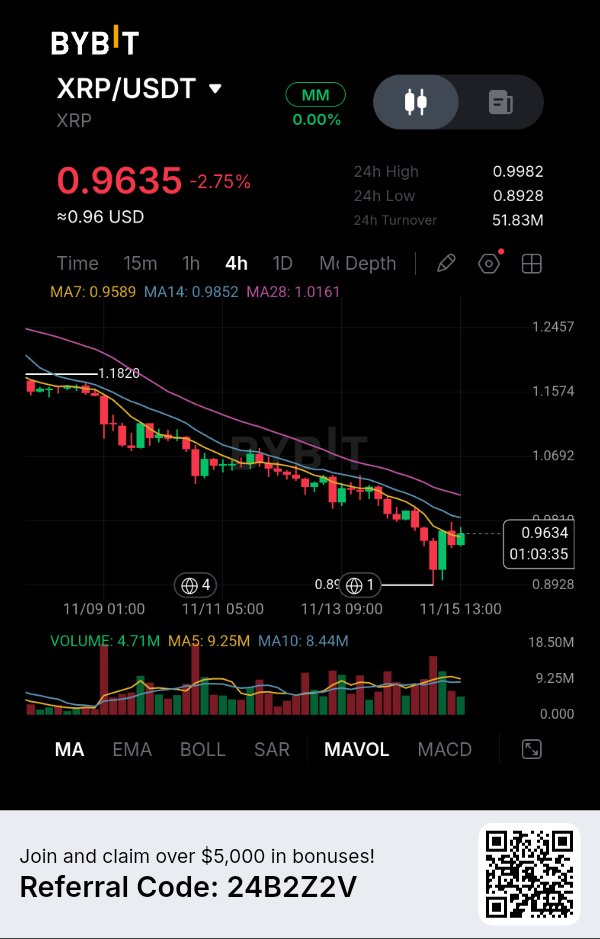
A Small Recovery Is Emerging, But the Bigger Trend Still Favors Sellers. XRP is attempting to stabilize after a prolonged 4H decline, but what catches my attention is the difference between the latest bounce and the broader market structure. Price has recovered from the $0.8928 low, yet it is still struggling to regain its major moving averages. The interesting part is that buyers have managed to push XRP back above its short-term MA7, but the MA14 and MA28 remain overhead. This creates an important question: is this the beginning of a meaningful recovery, or simply a temporary bounce inside a bearish trend? THE MARKET STORY XRP is currently trading around $0.9635, down 2.75% over 24 hours. The 4H chart shows a consistent sequence of lower highs and lower lows, indicating that sellers have maintained control throughout the recent decline. However, the latest reaction from $0.8928 deserves attention. Buyers stepped in near that level and managed to produce a recovery toward $0.9635. I am not treating this bounce as a confirmed reversal. What matters now is whether buyers can reclaim the $0.9852 resistance area or whether sellers use that region to resume the downward move. DATA & EVIDENCE Here are the important figures from the supplied Bybit screenshot: Current price: $0.9635 24H change: -2.75% 24H high: $0.9982 24H low: $0.8928 24H turnover: $51.83M Previous visible high: $1.1820 The moving averages reveal an interesting situation: MA7: $0.9589 MA14: $0.9852 MA28: $1.0161 XRP has recovered above MA7, which suggests some short-term buying interest. However, MA14 and MA28 remain above the current price, with the averages still arranged bearishly. This means the broader 4H structure has not yet changed. Volume provides another important detail: Current volume: 4.71M Volume MA5: 9.25M Volume MA10: 8.44M Current volume remains below both averages. This suggests that the latest recovery has not yet attracted participation comparable to recent trading activity. For me, this makes the current bounce less convincing as a trend reversal. MY READ I believe $0.9852 is the next important level for XRP. If buyers manage to reclaim this resistance and establish sustained 4H strength above it, the bearish interpretation will begin to weaken. But if price approaches this region and sellers reject another recovery attempt, the market could revisit the $0.9300 area before testing the previous low at $0.8928. I am particularly cautious about entering during the current bounce. A declining market can produce temporary recoveries without changing its overall direction. I want to see how XRP reacts around MA14 before considering a bearish continuation position. TRADING SETUP XRP — SHORT Scenario: Bearish trigger: Rejection around $0.9750–$0.9852, followed by a confirmed 4H bearish candle. Entry Zone: $0.9750–$0.9850 Stop Loss: $1.0050 TP1: $0.9400 TP2: $0.9150 TP3: $0.8930 Bullish invalidation: Sustained 4H acceptance above $1.0050, weakening the bearish continuation setup. The lower targets are estimated from the visible chart structure, with TP3 positioned near the previous $0.8928 low. Potential downside to TP3: Approximately 8.4%–9.3%. Defined risk: Approximately 2.0%–3.1%. Estimated risk-to-reward: Around 3:1, depending on entry and execution. This setup is conditional. I would not activate it without a confirmed rejection from the proposed entry region. FINAL THESIS: What makes XRP interesting right now is that the first signs of short-term buying interest are appearing while the broader 4H structure remains bearish. The recovery above MA7 is encouraging, but it is not enough to establish a trend reversal. For me, the next important battle is around $0.9852. If buyers reclaim that level, the bearish thesis will need reconsideration. If sellers defend it, XRP could revisit its recent lows. I am watching whether this recovery develops into genuine buying strength or becomes another lower high in the existing downtrend. $XRPUSDT #ByXIMPACT

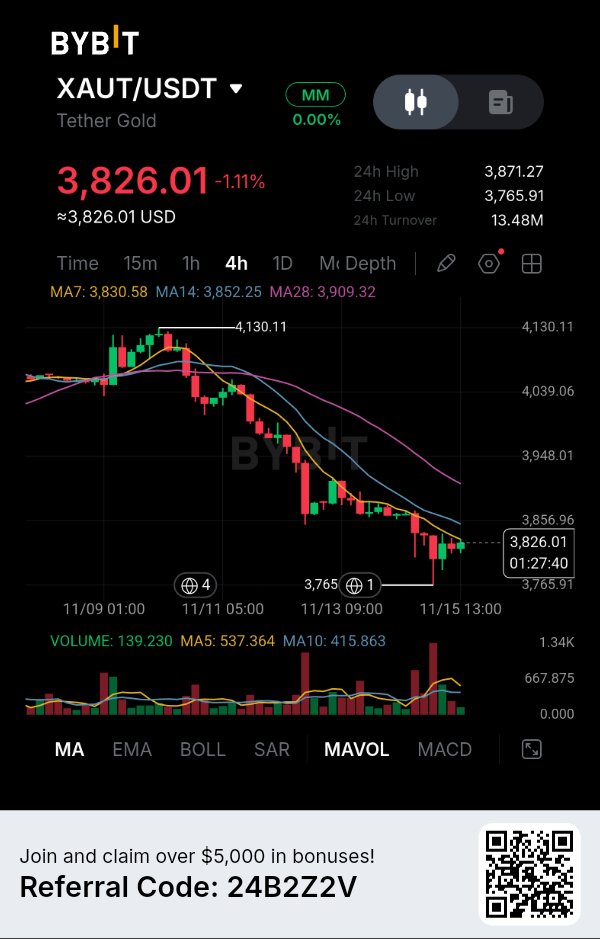
$XAUTUSDT — The bounce from $3,765 has caught my attention, but the broader 4H structure still suggests sellers are controlling the market. Tether Gold is trading around $3,826.01, down 1.11%. After falling from the $4,130 region, price has attempted to stabilize, but the recovery remains relatively weak compared with the preceding selling pressure. What interests me most is the position of price beneath the moving-average resistance cluster. What the 4H Chart Is Revealing The current moving-average readings are: MA7: $3,830.58 MA14: $3,852.25 MA28: $3,909.32 Price remains below all three moving averages. Although the latest candles show a modest recovery, the broader structure continues to produce lower highs and lower lows. There's another important detail: the recent decline toward $3,765.91 attracted some buying activity, but buyers haven't yet demonstrated enough strength to reclaim the MA14. For me, this looks more like an attempted stabilization inside a broader downtrend than a confirmed reversal. Where I'm Looking Next The $3,830–$3,852 region is my immediate resistance zone. If price revisits this area and sellers produce another rejection, I believe the market could resume its downward movement. My downside roadmap: $3,765.91 — Previous swing low and first major support. $3,735 — Next projected downside target. $3,700 — Extended downside objective. The lower two levels are estimated projections, not confirmed support levels on the visible chart. My Trading Signal Direction: SHORT (conditional) Entry: $3,835–$3,855 after confirmed bearish rejection. Stop Loss: $3,890 TP1: $3,765.91 TP2: $3,735 TP3: $3,700 Reference Entry: $3,845 Potential downside to TP3: Approximately 3.77%. Defined risk: Approximately 1.17%. Risk-to-Reward: Approximately 3.22:1. I want to see sellers defend the resistance zone before considering this setup. If price breaks above resistance with strong buying momentum, I won't force a short entry. What Could Invalidate My View? A sustained 4H recovery above $3,852 would be the first warning against my bearish outlook. A stronger reclaim above $3,909 would challenge the broader downside structure and suggest buyers are gaining control. On the other hand, a decisive breakdown below $3,765.91 could strengthen the bearish continuation scenario. Risk Management I'm not interested in selling directly into the previous low. Support can produce sharp reactions, especially after an extended decline. My preference is to let price recover toward resistance and wait for sellers to confirm their presence. For now, the moving averages continue to favor the downside, but the next resistance test will be important. The real question is whether this bounce marks the beginning of a genuine recovery or simply gives sellers another opportunity to push Tether Gold lower. $XAUTUSDT #ByXIMPACT

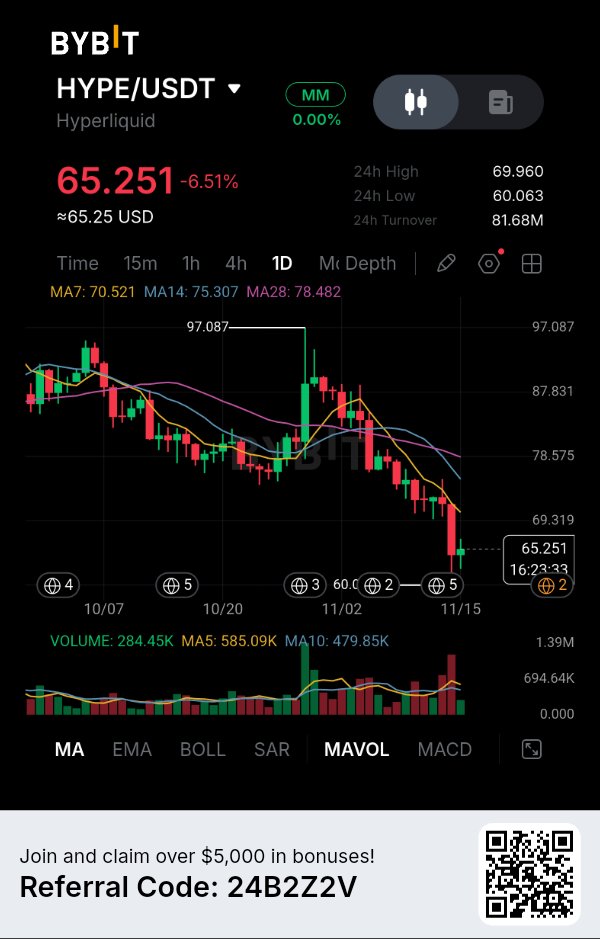
The Recovery Is Facing a Bigger Problem — Sellers Still Control the Daily Trend. Hyperliquid is down 6.51%, but what catches my attention is the distance between the current price and its major daily moving averages. HYPE has attempted to stabilize after a sharp decline toward $60, yet the latest recovery has not been strong enough to change the broader market structure. The interesting part is that buyers managed to produce a bounce from the recent low, but price remains below all three moving averages. This creates a critical situation: is this the beginning of a recovery, or simply a temporary pause in a larger downward move? THE MARKET STORY HYPE is currently trading around $65.251, after declining considerably from its visible $97.087 high. Unlike a normal pullback, the daily chart shows a sequence of lower highs and lower lows. The recent decline accelerated toward $60.063 before buyers attempted to recover. I am particularly interested in what happens next because the bounce has not yet reclaimed the important moving-average resistance levels. For me, the difference between a temporary recovery and a genuine trend reversal will depend on whether buyers can regain those levels. DATA & EVIDENCE Here are the important figures from the supplied Bybit screenshot: Current price: $65.251 24H change: -6.51% 24H high: $69.960 24H low: $60.063 24H turnover: $81.68M Previous visible high: $97.087 The daily moving averages reveal a bearish structure: MA7: $70.521 MA14: $75.307 MA28: $78.482 All three averages remain above the current price, with MA7 below MA14 and MA14 below MA28. This alignment suggests that sellers still have control over the broader daily trend. Volume provides another important detail: Current volume: 284.45K Volume MA5: 585.09K Volume MA10: 479.85K Current displayed volume is below both averages. This suggests that the recent recovery has not yet attracted participation comparable to the recent average trading activity. I would like to see stronger volume before treating the bounce as evidence of a sustainable reversal. MY READ I believe HYPE is approaching an important technical decision point. The $60.063 level is the most important visible support on this chart. If buyers successfully defend this area, HYPE could attempt another recovery toward $70.521, followed by $75.307. However, reclaiming these levels will require more than a few green candles. My concern is that price remains significantly below the moving averages, meaning the broader structure still favors sellers. I would rather wait for a confirmed breakdown than chase the current decline. TRADING SETUP HYPE — SHORT Scenario Bearish trigger: Confirmed daily candle close below $60.063, followed by a failed retest. Entry Zone: $59.50–$60.00 Stop Loss: $62.20 TP1: $57.50 TP2: $55.00 TP3: $52.50 Bullish invalidation: HYPE reclaims $70.521 and establishes sustained daily strength above this level. The downside targets are estimated extensions because lower support levels are not visible in the supplied screenshot. Potential downside to TP3: Approximately 11.8%–12.5%. Defined risk: Approximately 3.7%–4.5%. Estimated risk-to-reward: Around 2.7:1, depending on execution. This setup remains conditional. I would not consider the SHORT active unless the $60.063 breakdown is confirmed. FINAL THESIS What makes HYPE interesting right now is the difference between its short-term recovery and its broader daily structure. Buyers have demonstrated some demand near $60, but they have not yet recovered the important moving averages. That leaves the market vulnerable to another selling attempt. For me, the next major signal will come from the $60.063 support. A confirmed breakdown could expose further downside, while a stronger recovery above $70.521 would challenge the existing bearish thesis. I am watching whether Hyperliquid can turn this temporary stabilization into a genuine daily trend recovery rather than assuming the latest bounce marks the bottom. $HYPEUSDT #ByXIMPACT

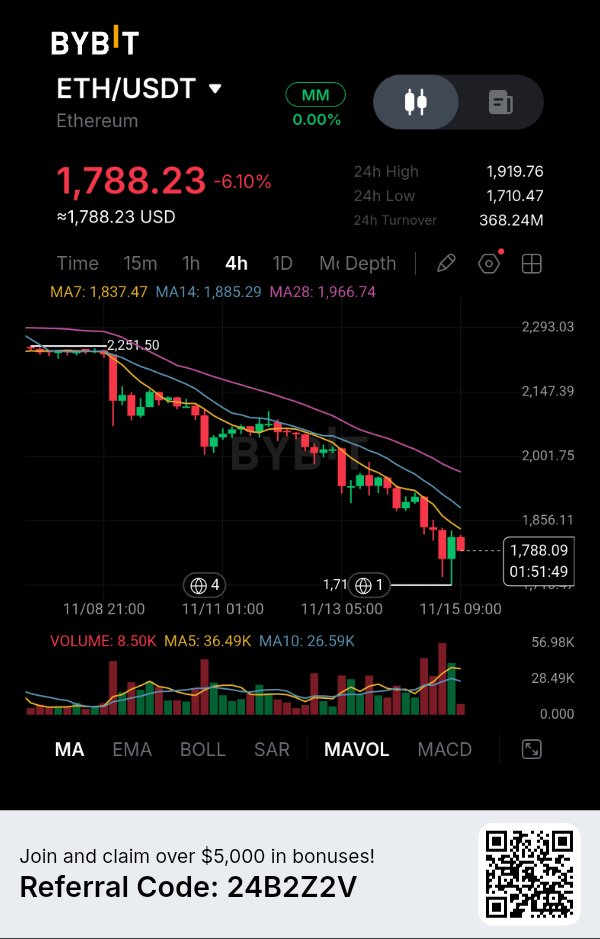
$ETHUSDT — Ethereum's latest decline has pushed price into a critical support area, but the recovery so far isn't convincing enough to change my bearish outlook. ETH is trading around $1,788.23, down 6.10%, after another aggressive selling wave on the 4H chart. What caught my attention is the structure behind this decline. Buyers have repeatedly attempted to stabilize the market, but each recovery has struggled to reclaim the previous resistance levels. The Market Structure Is Still Weak Ethereum has moved from the $2,251 region into a sequence of lower highs and lower lows. The current moving-average readings make the weakness even clearer: MA7: $1,837.47 MA14: $1,885.29 MA28: $1,966.74 Price is trading below all three averages, and the moving averages remain bearishly aligned. This tells me that the recent bounce is still happening inside a broader downward structure rather than confirming a reversal. Another level I'm watching closely is $1,710.47, the visible 24-hour low. If sellers break this area with strong momentum, Ethereum could face another downside expansion. Where I See the Next Opportunity I'm particularly interested in the $1,837–$1,885 resistance region. This area contains the MA7 and MA14, making it an important zone for the next recovery attempt. If ETH rallies into this region and sellers reject the move, I believe bearish continuation becomes a stronger possibility. My downside roadmap: $1,710 — Immediate support. $1,680 — First projected downside extension. $1,640 — Deeper downside objective. The lower targets are projections rather than confirmed support levels visible in the screenshot. My Trading Signal Direction: SHORT (conditional) Entry: $1,840–$1,885 after confirmed bearish rejection. Stop Loss: $1,925 TP1: $1,710 TP2: $1,680 TP3: $1,640 Reference Entry: $1,855 Potential downside to TP3: Approximately 11.59%. Defined risk: Approximately 3.77%. Risk-to-Reward: Approximately 3.07:1. I want to see a recovery into resistance followed by a clear rejection before considering this position. I won't chase ETH lower after an already significant decline. What Could Invalidate My View? A sustained 4H recovery above $1,885 would be the first warning against my bearish thesis. If buyers reclaim the MA14 and subsequently challenge the $1,925 region, the current selling structure could begin losing strength. On the other hand, a decisive breakdown below $1,710 would strengthen the bearish continuation scenario. Risk Management Ethereum is approaching an important support area, and a temporary bounce wouldn't surprise me. That's exactly why I prefer waiting for a resistance retest instead of opening a short position directly into support. My focus remains on the $1,837–$1,885 zone and how sellers respond when price reaches it. For now, the moving averages and market structure favor sellers. The real question is whether Ethereum can turn this latest bounce into a genuine recovery or whether the next resistance test will become another opportunity for sellers. $ETHUSDT #ByXIMPACT

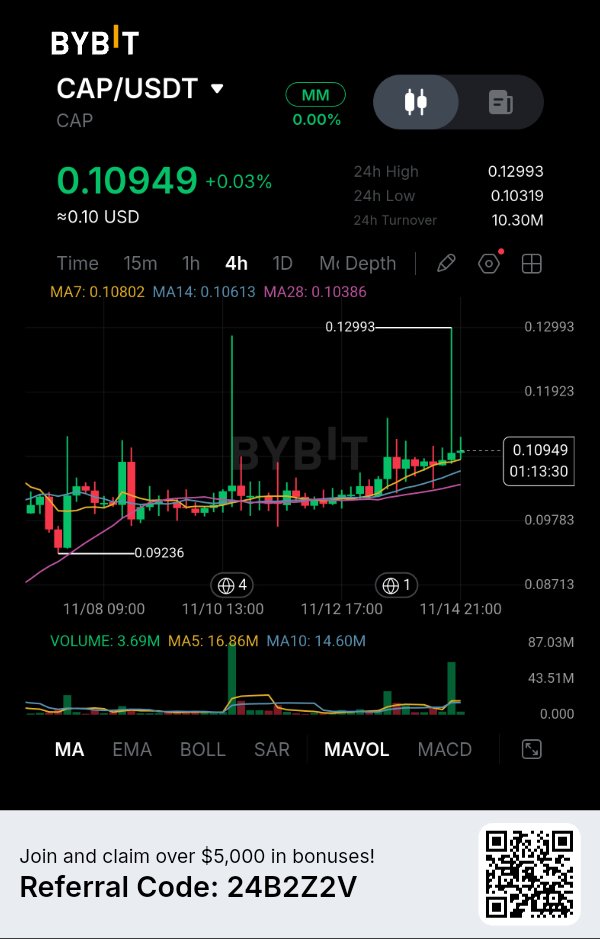
Buyers Are Slowly Regaining Control, But One Resistance Could Change the Entire Setup. CAP is showing a different market structure compared with several other declining altcoins. What catches my attention is that despite the recent volatility, price has managed to recover above all three visible moving averages and is now consolidating near $0.10949. The interesting part is that buyers are gradually improving the short-term structure, but trading activity has not yet confirmed a strong breakout. This creates an important question: is CAP preparing for another upward move, or is the current recovery simply losing momentum beneath resistance? THE MARKET STORY CAP is currently trading at $0.10949, with a nearly unchanged 24H performance of +0.03%. Unlike a market experiencing continuous lower lows, the latest 4H candles show a relatively stable consolidation followed by a gradual recovery. What interests me most is the positioning of the moving averages. The price is now trading above MA7, MA14, and MA28, suggesting that short-term buyers have started gaining an advantage. However, the chart also shows a previous sharp upward wick toward $0.12993. That move indicates significant volatility around higher prices and makes the previous high an important reference for evaluating future upside potential. DATA & EVIDENCE Here are the important figures from the supplied Bybit chart: Current price: $0.10949 24H change: +0.03% 24H high: $0.12993 24H low: $0.10319 24H turnover: $10.30M Previous visible low: $0.09236 The moving averages show a developing bullish alignment: MA7: $0.10802 MA14: $0.10613 MA28: $0.10386 All three averages are below the current price, with MA7 above MA14 and MA14 above MA28. This is an encouraging technical development because it suggests that the shorter-term trend is improving. However, volume tells a slightly different story: Current volume: 3.69M Volume MA5: 16.86M Volume MA10: 14.60M Current displayed volume remains considerably below both averages. This is important because a price recovery without strong participation may struggle to develop into a sustained breakout. MY READ: I see a potentially interesting setup developing in CAP. The strongest argument for buyers is the bullish moving-average alignment and the ability of price to remain above the $0.106–$0.108 region. However, I do not consider the recovery fully confirmed. The next important resistance is around $0.11293, based on the visible chart scale and recent price action. If buyers secure a 4H close above this region with improving volume, I would become more interested in a continuation toward higher levels. On the other hand, failure to reclaim resistance could keep CAP trapped in its current consolidation range. I would rather wait for a confirmed breakout than enter simply because the moving averages look positive. TRADING SETUP CAP — LONG Scenario: Bullish trigger: Confirmed 4H candle close above $0.11293 with stronger buying volume. Entry Zone: $0.1130–$0.1140 Stop Loss: $0.1080 TP1: $0.11923 TP2: $0.12400 TP3: $0.12993 Bearish invalidation: Failure to hold $0.1080 after the breakout attempt, weakening the bullish setup. The higher targets are estimated projections based on the visible chart structure, with $0.12993 representing the previous visible spike high. Potential upside to TP3: Approximately 14.0%–15.0%. Defined risk: Approximately 4.4%–5.3%. Estimated risk-to-reward: Around 2.7:1, depending on execution. This setup is conditional. I would not consider the LONG active until resistance is successfully reclaimed. FINAL THESIS: What makes CAP interesting is the gradual improvement in its 4H structure while price remains relatively stable. The bullish moving-average alignment provides an encouraging signal, but the lack of strong volume participation is something I would not ignore. For me, the next important development is whether buyers can turn $0.11293 into support after a confirmed breakout. If that happens, the previous $0.12993 high becomes an important upside reference. Until then, CAP remains a developing recovery setup rather than a confirmed breakout. $CAPUSDT #ByXIMPACT

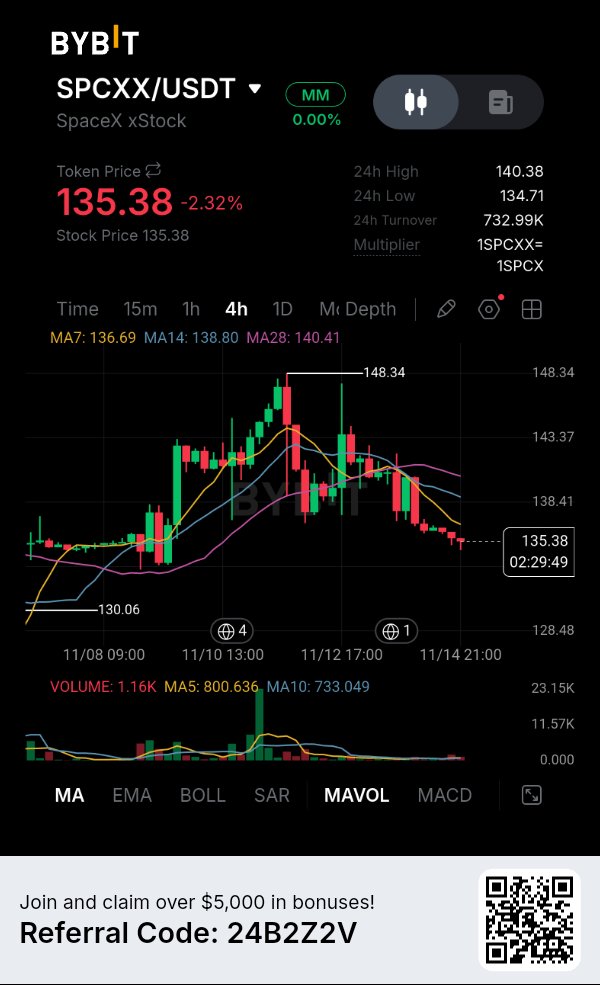
$SPCXXUSDT — The recovery has lost momentum, and sellers are gradually pushing SpaceX xStock back toward an important demand area. What caught my attention on the 4H chart is that price is no longer holding its previous recovery structure. After reaching $148.34, SPCX started forming lower highs, and the latest candles show buyers struggling to defend higher levels. Currently trading around $135.38, the token is down 2.32%, with the $134.71 area acting as immediate support. What the 4H Structure Is Revealing The moving averages are showing a clear shift in momentum: MA7: $136.69 MA14: $138.80 MA28: $140.41 Price is trading below all three moving averages, and their positioning reflects increasing short-term weakness. Another important detail is the rejection from the $143–$148 region. Buyers previously managed to push price higher, but they couldn't sustain that recovery. Now the market is approaching a critical area where another decision could emerge. My Market Outlook I'm leaning toward bearish continuation, but I don't want to chase price directly into support. The $136.69–$140.41 region is the resistance zone I'm watching. If SPCX attempts a recovery into this area and sellers reject it, another downside move becomes possible. My downside roadmap: $134.71 — Immediate support. $132.50 — Next projected downside target. $130.06 — Major structural support and final objective. The $130.06 level is particularly important because it represents the previous visible chart low. My Trading Signal Direction: SHORT (conditional) Entry: $137.00–$138.50 after confirmed bearish rejection. Stop Loss: $141.00 TP1: $134.71 TP2: $132.50 TP3: $130.06 Reference Entry: $137.75 Potential downside to TP3: Approximately 5.58%. Defined risk: Approximately 2.36%. Risk-to-Reward: Approximately 2.36:1. I want sellers to confirm their presence around the entry zone before considering this trade. If price continues falling without a retest, I won't chase the move. What Could Invalidate My View? A strong 4H recovery above $140.41 would be the first warning against my bearish thesis. If buyers reclaim the moving-average cluster and establish higher highs, the current weakness could turn into another recovery attempt. On the downside, a decisive breakdown below $134.71 could strengthen the bearish continuation scenario. Risk Management I'm not ignoring the possibility of a bounce from the current support area. The market has already experienced a meaningful decline, and short positions opened too late can face sudden reversals. My preference is to wait for a recovery toward resistance and let sellers confirm the next move. For now, the moving averages favor sellers, but the $134.71 support remains an important level to monitor. The bigger question is whether SPCX can recover its lost momentum or whether sellers will push price toward the $130 demand region again. $SPCXXUSDT #ByXIMPACT

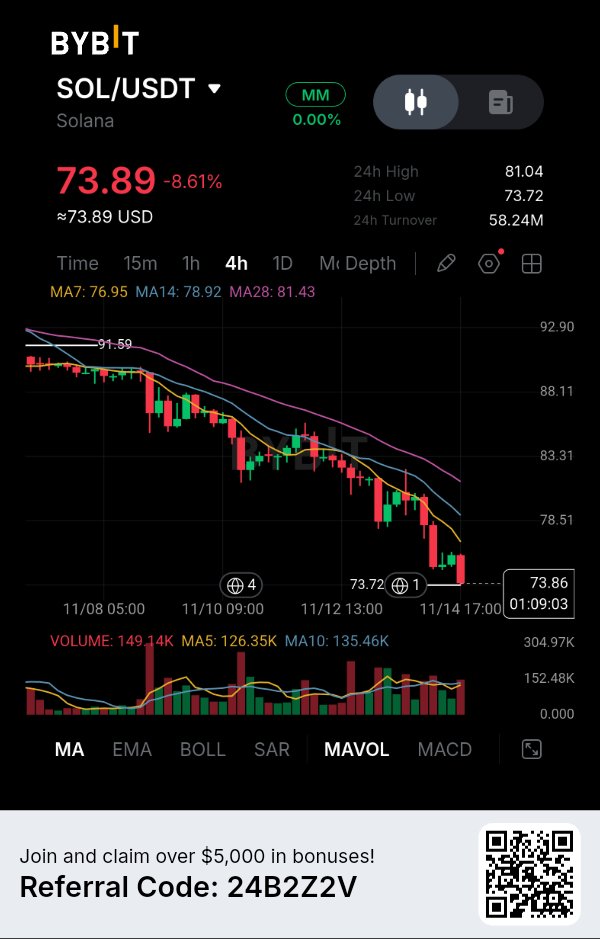
Sellers Are Pushing Solana Toward a Critical Support Breakdown. Solana is down 8.61%, but what catches my attention is how consistently sellers have controlled the 4H structure. Every recovery attempt has struggled to gain momentum, and the latest decline has brought SOL dangerously close to its visible $73.72 support. The interesting part is that price is now trading below all three major moving averages while selling activity remains elevated. This creates an important situation: buyers need to defend the current support, otherwise another downward extension could develop. THE MARKET STORY SOL is currently trading around $73.89 after declining from the visible $91.59 region. What makes this chart interesting is the consistency of the lower-high structure. Each recovery has encountered resistance before buyers could establish a meaningful trend reversal. I am particularly focused on the $73.72 level because it represents the visible 24H low and the nearest important support. If sellers break this level with a convincing 4H candle close, the existing bearish structure could gain further momentum. However, if buyers defend this area, a temporary recovery toward the moving averages remains possible. DATA & EVIDENCE Here are the important figures from the supplied Bybit screenshot: * Current price: $73.89 * 24H change: -8.61% * 24H high: $81.04 * 24H low: $73.72 * 24H turnover: $58.24M * Previous visible high: $91.59 The moving averages reveal a clear bearish alignment: * MA7: $76.95 * MA14: $78.92 * MA28: $81.43 All three averages remain above the current price. More importantly, MA7 is below MA14, while MA14 is below MA28. This positioning indicates that the short-term market structure continues to favor sellers. Volume provides another important observation: * Current volume: 149.14K * Volume MA5: 126.35K * Volume MA10: 135.46K Current displayed volume is above both averages. This suggests that trading activity remains elevated during the decline. I would not automatically interpret this as continued aggressive selling, but combined with the bearish price structure, it deserves attention. MY READ I believe SOL is approaching a critical technical decision point. The $73.72 support is the level I am watching most closely. If buyers defend this area, SOL could attempt a recovery toward $76.95, followed by $78.92. However, these moving averages may create resistance during any rebound. On the other hand, a confirmed 4H breakdown below $73.72, followed by a failed retest, would strengthen the bearish continuation scenario. I am not interested in chasing the decline at current prices. I want confirmation that sellers can actually turn the existing support into resistance. TRADING SETUP SOL — SHORT Scenario Bearish trigger: Confirmed 4H candle close below $73.72, followed by a failed retest. Entry Zone: $73.40–$73.70 Stop Loss: $76.20 TP1: $72.00 TP2: $70.00 TP3: $68.00 Bullish invalidation: SOL reclaims $78.92 and establishes sustained 4H strength above this resistance. The downside targets are estimated projections because these lower support levels are not visible in the supplied screenshot. Potential downside to TP3: Approximately 7.4%–7.7%. Defined risk: Approximately 3.4%–3.8%. Estimated risk-to-reward: Around 2:1. This setup remains conditional and becomes relevant only after the support breakdown is confirmed. FINAL THESIS: What makes Solana interesting right now is the combination of persistent lower highs, bearish moving-average alignment, and increased trading activity during the decline. The next important development will come from the reaction around $73.72. If buyers successfully defend this level, a recovery attempt could challenge the nearby moving averages. But if sellers establish a confirmed breakdown, the market could open the door to another leg lower. For now, I am watching whether SOL can maintain its support or whether sellers will establish a new lower trading range. The next 4H confirmation could provide the clearest indication of which side is gaining control. $SOLUSDT #ByXIMPACT

$BBSOLUSDT — Sellers have pushed price into a critical support area, but I'm more interested in what happens during the next recovery attempt. BybitSOL is trading around $88.42, down 8.60%, after an extended decline from the $107 region. The 4H chart is showing persistent selling pressure, and buyers have struggled to produce a meaningful recovery. What stands out to me is the separation between price and the moving averages. The market is trading significantly below its trend indicators, suggesting that sellers still have control. What the 4H Structure Is Revealing The current moving-average readings are: MA7: $90.79 MA14: $92.94 MA28: $95.75 All three averages are positioned above the current price, with a bearish alignment. Another important observation is the recent selling-volume expansion during the decline. This suggests increased trading activity as BBSOL moved lower. Price is now approaching the $88.14 area, which represents the visible 24-hour low. For me, this is an important decision zone. A temporary bounce is possible, but the broader structure hasn't shown convincing reversal confirmation yet. My Market Outlook I'm favoring bearish continuation, particularly if price recovers toward the moving-average resistance area and sellers defend it again. The $92.94–$95.75 region is particularly important because it contains the MA14 and MA28 resistance levels. My downside roadmap: $88.14 — Immediate support. $86.50 — First projected downside extension. $84.50 — Extended downside objective. The lower targets are estimated projections, not confirmed support levels from the visible chart. My Trading Signal Direction: SHORT (conditional) Entry: $92.80–$94.00 after confirmed bearish rejection. Stop Loss: $96.90 TP1: $88.14 TP2: $86.50 TP3: $84.50 Reference Entry: $93.40 Potential downside to TP3: Approximately 9.53%. Defined risk: Approximately 3.75%. Risk-to-Reward: Approximately 2.54:1. I want to see price recover into the entry zone and demonstrate that sellers are still defending resistance. If price continues falling without a retest, I won't chase the move. What Could Invalidate My View? A sustained recovery above $95.75 would be an important warning against my bearish thesis. If buyers reclaim the MA28 and establish higher highs on the 4H chart, the current downward structure could begin to weaken. On the other hand, a decisive breakdown below $88.14 could strengthen the bearish continuation scenario. Risk Management BBSOL has already experienced a substantial decline, so chasing the current price carries additional risk. I would rather wait for a recovery toward resistance than enter directly above an important support level. My focus is on the $92.80–$94.00 region and how price behaves when it gets there. For now, the moving averages favor sellers, but the next recovery attempt will reveal whether buyers have enough strength to challenge the prevailing trend. The important question is no longer how far BBSOL has fallen. It's whether buyers can finally stop sellers from controlling every recovery attempt. $BBSOLUSDT #ByXIMPACT
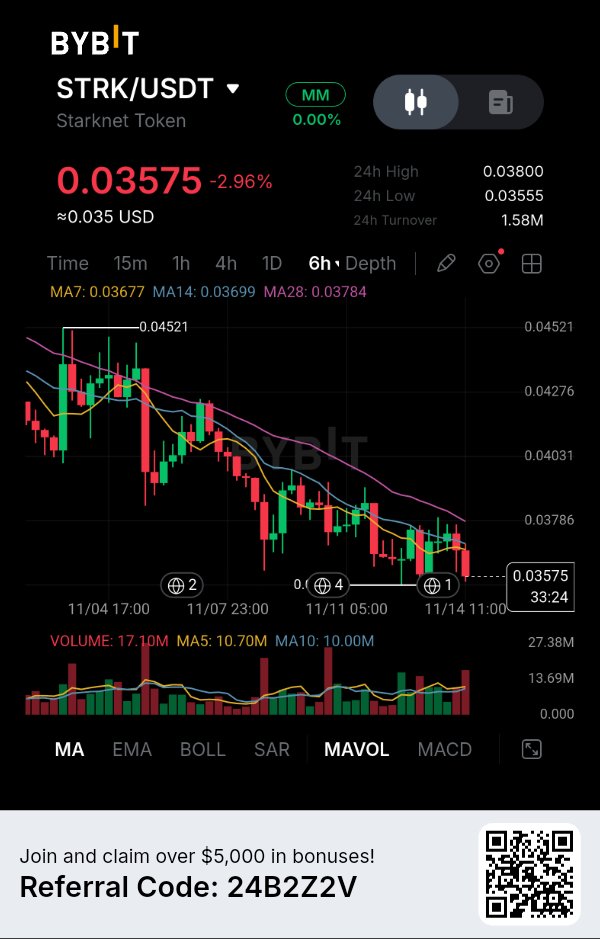
$STRKUSDT — Sellers are maintaining control, and the latest 6H candles suggest the recovery attempts are still struggling to gain traction. Starknet is trading around $0.03575, down 2.96%, and what concerns me most is the consistent sequence of lower highs forming across the chart. This isn't just a single red candle. The broader structure is showing persistent selling pressure. What the Chart Is Revealing Looking at the 6H timeframe, STRK has continued to lose ground after its rejection near the $0.04521 region. The moving averages are providing another important clue: MA7: $0.03677 MA14: $0.03699 MA28: $0.03784 Price is trading below all three averages, with MA7 beneath MA14 and MA28. This alignment suggests that sellers still have control over the current trend. Another detail worth watching is the $0.03555 area, which is close to the current price and represents the visible 24-hour low. If sellers break this support convincingly, another downside expansion could follow. My Market Outlook I'm leaning toward bearish continuation rather than an immediate reversal. However, I don't want to chase STRK at current support. My preferred opportunity would be a recovery into the moving-average resistance zone followed by a clear rejection. My downside roadmap: $0.03555 — First support target. $0.03480 — Next projected downside level. $0.03400 — Extended downside objective. The lower two targets are projections rather than confirmed support levels visible on the screenshot. My Trading Signal Direction: SHORT (conditional) Entry: $0.03690–$0.03740 after bearish rejection. Stop Loss: $0.03820 TP1: $0.03555 TP2: $0.03480 TP3: $0.03400 Reference Entry: $0.03715 Potential downside to TP3: Approximately 8.48%. Defined risk: Approximately 2.83%. Risk-to-Reward: Approximately 3.00:1. I want to see sellers defend the resistance zone before considering an entry. If price continues falling without a retest, I won't chase the move. What Could Invalidate My View? A sustained recovery above $0.03784 would be the first meaningful warning against my bearish thesis. If buyers reclaim the MA28 and establish higher highs, the current downward structure could begin losing strength. On the other hand, a decisive breakdown below $0.03555 would strengthen the continuation scenario. Risk Management STRK is approaching an important support area, so timing matters. Selling directly into support could expose a position to an unexpected rebound. I'd rather wait for a recovery and let the market confirm whether sellers are still defending the trend. For now, the moving averages and lower-high structure favor sellers. The important question is whether buyers can finally reclaim $0.03784 or whether another failed recovery will open the door to lower prices. $STRKUSDT #ByXIMPACT

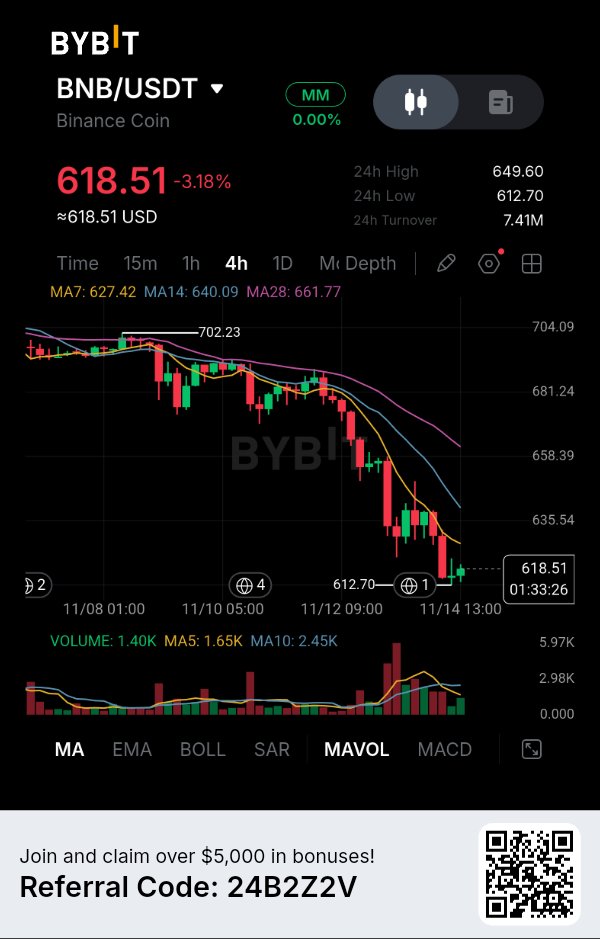
The $612 Support Is Becoming the Most Important Level on the Chart. BNB is down 3.18%, but what catches my attention is how consistently sellers have maintained control throughout the latest 4H decline. Every recovery attempt has struggled to regain momentum, while the moving averages continue pointing toward a weaker market structure. The interesting part is that BNB is now trading close to $612.70, its visible 24H low. This puts the market near an important decision point: either buyers defend this area or sellers gain another opportunity to extend the decline. THE MARKET STORY BNB is currently trading at $618.51, considerably below its three visible moving averages. What makes this situation interesting is the distance between the current price and the MA28 at $661.77. This shows how far price has moved away from its longer-term moving average on the displayed timeframe. I am particularly interested in whether the $612.70 support can survive another selling attempt. If it breaks, the market could enter another downward expansion. If buyers defend it, a temporary recovery toward the moving averages becomes possible. DATA & EVIDENCE Here are the important figures from the supplied Bybit chart: Current price: $618.51 24H change: -3.18% 24H high: $649.60 24H low: $612.70 24H turnover: $7.41M Previous visible high: $702.23 The moving averages reveal the current trend structure: MA7: $627.42 MA14: $640.09 MA28: $661.77 All three averages are positioned above the current price, with MA7 below MA14 and MA14 below MA28. This bearish alignment suggests that buyers have not yet established enough strength to reverse the prevailing 4H structure. Volume adds another detail: Current volume: 1.40K Volume MA5: 1.65K Volume MA10: 2.45K Current volume is below both averages. This means I would like to see stronger participation before treating a potential support breakdown as a convincing continuation signal. MY READ: I believe the most important level to watch is $612.70. BNB has already experienced a substantial decline from the visible $702.23 region, but the current chart does not yet show a convincing reversal structure. My concern for buyers is that price remains below all three moving averages. Even if BNB produces a short-term bounce, the $627–$640 region could become an important resistance area. I would not enter a SHORT position simply because the market is falling. I want to see a confirmed 4H breakdown below $612.70, followed by a failed attempt to reclaim that level. That would provide a more structured opportunity. TRADING SETUP BNB — SHORT Scenario: Bearish trigger: Confirmed 4H candle close below $612.70, followed by a failed retest. Entry Zone: $610–$613 Stop Loss: $628 TP1: $600 TP2: $588 TP3: $575 Bullish invalidation: BNB reclaims $640.09 and establishes sustained strength above this resistance. The downside targets are estimated projections because these support levels are not established on the visible portion of the chart. Potential downside to TP3: Approximately 5.7%–6.2%. Defined risk: Approximately 2.5%–2.9%. Estimated risk-to-reward: Around 2:1, depending on entry and execution. This setup remains conditional. If BNB holds $612.70, I would avoid chasing the downside. FINAL THESIS: What makes BNB interesting right now is the combination of bearish moving-average alignment and an approaching support test. The next meaningful signal will come from the reaction around $612.70. A confirmed breakdown could expose lower price levels, while a successful defense could force sellers to reconsider their positions. For now, I am more interested in whether sellers can convert this support into resistance than in predicting how low BNB might eventually go. $BNBUSDT #ByXIMPACT

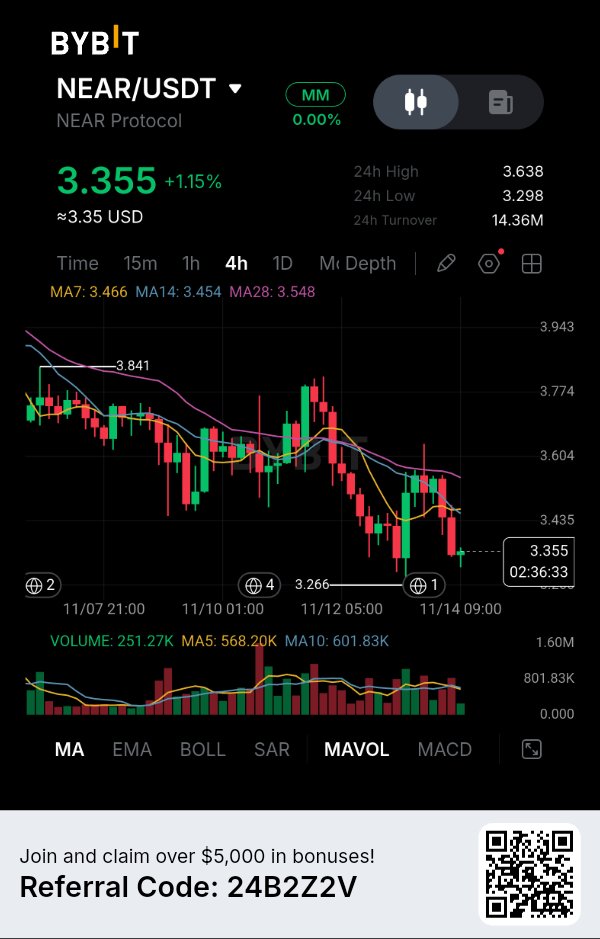
$NEARUSDT — Buyers are attempting to stabilize the price, but the 4H structure still shows sellers controlling the bigger picture. NEAR Protocol is trading around $3.355, up 1.15%, yet this small recovery hasn't changed the underlying technical structure. What interests me is the repeated failure to sustain moves above the moving-average cluster. The Market Structure I'm Watching NEAR has been forming lower highs after reaching the $3.84 region. Each recovery attempt has struggled to establish a stronger upward structure. The latest rejection near $3.60 has pushed price back toward the $3.35 area. Current moving-average readings: MA7: $3.466 MA14: $3.454 MA28: $3.548 Price is trading below all three averages. More importantly, the MA28 remains above the shorter averages, suggesting that the broader 4H momentum is still under pressure. There are two nearby support levels worth watching: $3.298 — Immediate support. $3.266 — Recent structural low. For me, the important detail is that buyers haven't yet demonstrated enough strength to reclaim the $3.45–$3.55 resistance region. My Market Outlook I'm leaning toward another downside test, provided sellers defend the moving-average resistance zone. A recovery into $3.45–$3.55 followed by a clear rejection could create an opportunity for bearish continuation. My downside roadmap: $3.298 — First support target. $3.266 — Previous structural low. $3.180 — Extended projected downside target. The $3.266 level is particularly important. If sellers break it convincingly, the market could start exploring lower prices. My Trading Signal Direction: SHORT (conditional) Entry: $3.46–$3.54 after bearish rejection. Stop Loss: $3.65 TP1: $3.298 TP2: $3.266 TP3: $3.180 Reference Entry: $3.50 Potential downside to TP3: Approximately 9.14%. Defined risk: Approximately 4.29%. Risk-to-Reward: Approximately 2.13:1. The entry requires a confirmed rejection from resistance. I don't want to chase the current price while it is already approaching support. What Could Invalidate My View? A strong 4H recovery above $3.548 would be the first warning against my bearish outlook. If buyers reclaim $3.60 and establish higher highs, the current selling structure could begin to weaken. On the other hand, a decisive breakdown below $3.266 would strengthen the bearish continuation scenario. Risk Management I'm watching NEAR carefully because the distance between current price and nearby support is relatively small. Selling directly into support would not offer the same opportunity as waiting for a resistance retest. My preference is to let price recover, watch how sellers respond, and execute only if the rejection is confirmed. For now, NEAR needs to prove that buyers can reclaim the moving-average cluster before I reconsider the broader bearish structure. The next important battle is around $3.45–$3.55. Will buyers finally reclaim control, or will another recovery attempt become an opportunity for sellers? $NEARUSDT #ByXIMPACT

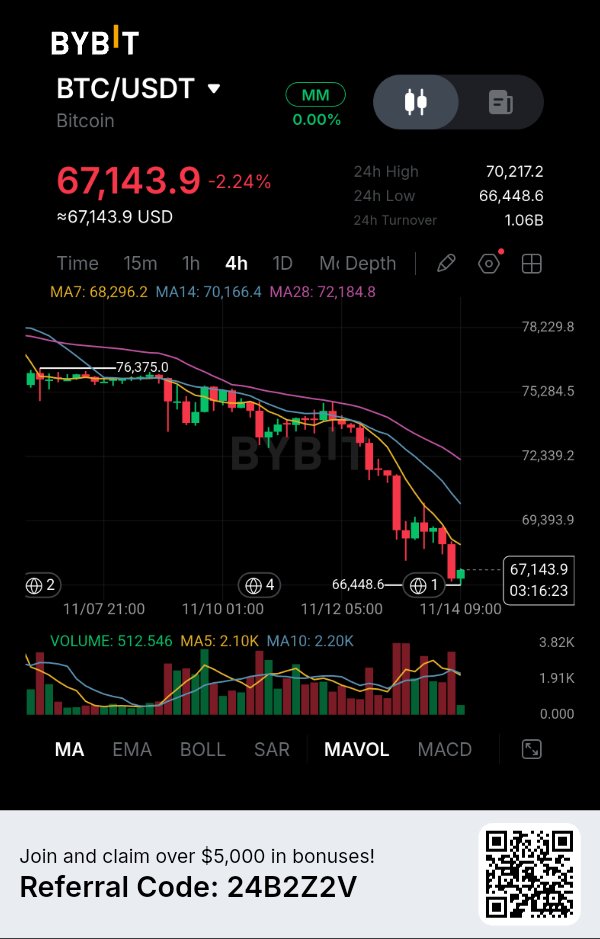
Bitcoin Is Approaching a Critical Support Zone, But Buyers Have Yet to Prove Their Strength. Bitcoin's latest 4H movement is showing something I don't want to overlook: price has continued making lower highs and lower lows, while every recovery attempt has struggled to regain meaningful resistance. What makes this situation interesting is that BTC is now trading close to $66,448, its visible 24H low. Buyers have attempted a small recovery, but the larger technical structure remains firmly under pressure. For me, this is not yet a convincing bottom formation. It is a market approaching an important decision point.# WHY IT MATTERS BTC is currently trading at $67,143.9, down 2.24%. The interesting part is the distance between the current price and its moving averages. Bitcoin is trading below all three displayed averages, suggesting that sellers continue to control the 4H structure. When price remains below multiple moving averages during a sequence of lower highs, I become cautious about treating small green candles as genuine reversals. The $66,448.6 area is therefore particularly important. If sellers break this support and successfully turn it into resistance, another downward expansion could develop. DATA & EVIDENCE Here are the important figures visible in the Bybit screenshot: Current price: $67,143.9 24H change: -2.24% 24H high: $70,217.2 24H low: $66,448.6 24H turnover: $1.06B Moving average structure: MA7: $68,296.2 MA14: $70,166.4 MA28: $72,184.8 All three moving averages are positioned above the current price. There is also a clear bearish alignment: MA7 is below MA14, while MA14 is below MA28. This arrangement reflects persistent downward momentum rather than an established recovery. The volume panel provides another detail: Displayed volume: 512.546 Volume MA5: 2.10K Volume MA10: 2.20K The latest displayed volume is below both averages. This means the small recovery visible in the latest candles has not yet demonstrated strong participation relative to recent volume averages.# MY READ I am focusing on $66,448.6 because this is the nearest important support visible in the screenshot. A clean 4H breakdown below this level, followed by a failed retest, would provide stronger evidence that sellers are preparing another downward move. However, I would not blindly SHORT directly into support. If buyers successfully defend $66,448 and reclaim $68,296, the bearish setup would become less attractive. My preference is to wait for confirmation rather than anticipate a breakdown that has not happened yet. TRADING SETUP BTC — Conditional SHORT: Bearish trigger: Confirmed 4H candle close below $66,448.6, followed by a failed retest. Entry zone: $66,300–$66,400 Stop Loss: $67,250 TP1: $65,500 TP2: $64,500 TP3: $63,500 Invalidation: BTC reclaims $67,250 and establishes sustained 4H strength above that level. TP2 and TP3 are estimated downside extension targets, not confirmed chart support levels. Approximate risk-to-reward to TP3 is around 2.9:1, depending on execution. The SHORT setup is conditional and is not active at the current price. FINAL THESIS: Bitcoin's current structure is telling me that the market has not yet finished dealing with selling pressure. The moving averages remain bearish, recovery attempts have been relatively weak, and $66,448.6 is now an important level to monitor. I am not interested in chasing every red candle. I want to see whether sellers can convert this support into resistance. If that happens, BTC could open the door toward lower price levels. If buyers defend the region and reclaim the short-term moving averages, the downside thesis will need reassessment. For now, the most important development is whether Bitcoin can hold its latest visible support or whether sellers force another breakdown. $BTCUSDT #ByXIMPACT

$LITUSDT — The recovery is losing momentum near a critical moving-average cluster, and I'm watching whether sellers can turn this area into another rejection point. Lighter is trading around $3.2271, up 1.56%, but the latest 4H structure tells a more interesting story than the daily percentage gain. Price previously recovered from the $3.0031 low and rallied toward the $3.40 region. However, buyers have struggled to maintain that momentum, and the latest candles suggest the recovery is facing resistance. What the 4H Chart Is Revealing The current moving-average readings are: MA7: $3.2305 MA14: $3.2429 MA28: $3.2614 Price is currently trading below all three moving averages, with the shorter average also positioned beneath the longer ones. This alignment suggests that short-term momentum is still under pressure. Another important detail is the recent rejection near $3.40. Buyers attempted to push higher, but the market failed to sustain that move. I'm particularly interested in the $3.24–$3.27 region. If price revisits this area and sellers defend it, another downside move becomes possible. My Market Outlook The immediate support is around $3.1440. A breakdown below this level could expose the $3.0800 area, followed by the previous structural low near $3.0031. My downside roadmap: $3.1440 — First support target. $3.0800 — Second downside target. $3.0031 — Major structural low. For me, the key question is whether buyers can reclaim the moving-average cluster or whether sellers will use the next recovery attempt to regain control. My Trading Signal Direction: SHORT (conditional) Entry: $3.2400–$3.2600 after confirmed bearish rejection. Stop Loss: $3.4100 TP1: $3.1440 TP2: $3.0800 TP3: $3.0031 Reference entry: $3.2500 Potential downside to TP3: Approximately 7.60%. Defined risk: Approximately 4.92%. Risk-to-Reward: Approximately 1.55:1. I want to see sellers confirm their presence around the entry zone before considering this setup. I won't chase price if it drops directly into support. What Could Invalidate My View? A strong 4H recovery above $3.2614 would be the first warning against my bearish outlook. If buyers reclaim the $3.28–$3.40 region and establish higher highs, the current short-term weakness could turn into another recovery attempt. On the downside, a decisive break below $3.1440 would strengthen the bearish continuation scenario. Risk Management LIT is trading near an important decision area, so I don't want to confuse a temporary bounce with a confirmed trend reversal. My preference is to wait for a resistance retest and a clear rejection before entering. For now, the moving averages favor sellers, but the next reaction will matter more than the current price movement. The real battle is taking place around $3.25. Can buyers reclaim this zone, or will sellers turn another recovery attempt into a lower move? $LITUSDT #ByXIMPACT
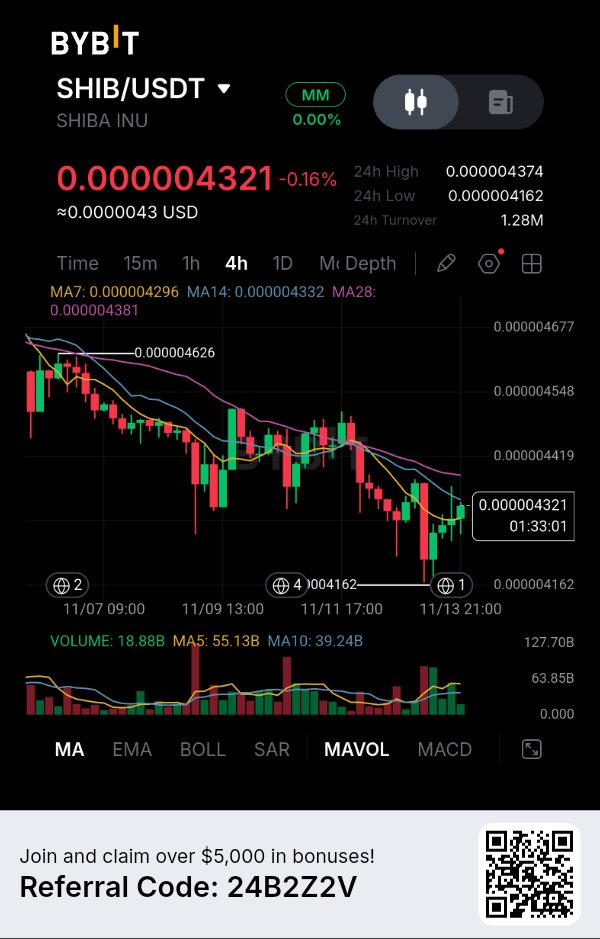
$SHIBUSDT: Is This Recovery the Beginning of a Reversal or Just Another Temporary Bounce? SHIB has managed to recover from its recent low, but the bigger picture is still presenting a challenge for buyers. What makes this setup interesting is that price has climbed back above the 7-period moving average while remaining below the 14-period and 28-period averages. I see an early attempt at stabilization, but not yet a confirmed change in trend. WHY THIS MOVE MATTERS The 4H chart shows that SHIB has been struggling with persistent selling pressure. Several recovery attempts have failed to establish a sustained upward structure. Now buyers are defending the $0.000004162 area and pushing price toward $0.000004374. The important question is whether this recovery can attract enough buying pressure to overcome the moving-average resistance above the current price. If it does, the market could begin developing a stronger recovery structure. If it fails, the recent bounce could become another lower high. MARKET DATA & EVIDENCE Here is what I can confirm from the supplied chart: * Current price: $0.000004321 * 24H change: -0.16% * 24H high: $0.000004374 * 24H low: $0.000004162 * 24H turnover: $1.28M * Volume: 18.88B Moving average structure: * MA7: $0.000004296 * MA14: $0.000004332 * MA28: $0.000004381 There are two details I find particularly important. First, SHIB has recovered above MA7, indicating some improvement in short-term price positioning. Second, MA14 and MA28 are still overhead. This means buyers have not yet reclaimed the resistance structure needed to establish a convincing reversal. Volume also requires attention. The displayed volume of 18.88B is below MA5 at 55.13B and MA10 at 39.24B. Therefore, the recovery has not yet demonstrated strong participation relative to those averages. MY READ I am focusing on the $0.000004381 resistance area. A successful 4H breakout above this region, followed by a defended retest, would give buyers a better opportunity to challenge the next visible resistance levels. However, I would not consider the current price sufficient confirmation for a LONG position. On the downside, $0.000004162 remains the critical support reference. Losing that level could expose SHIB to another downward expansion. My approach is to let the market confirm its direction before committing to a trade. TRADING SETUP SHIB — Conditional LONG Bullish trigger: A confirmed 4H close above $0.000004381, followed by a successful retest. Entry: $0.000004385–$0.000004405 Stop Loss: $0.000004330 TP1: $0.000004548 TP2: $0.000004626 TP3: $0.000004677 Bearish trigger: A confirmed 4H breakdown below $0.000004162. Bullish invalidation: Failure to hold the reclaimed $0.000004381 region. Targets are based on visible chart resistance levels. Approximate risk-to-reward to TP3 is around 2.7:1, depending on entry and execution. The setup is conditional and is not active at the current price. FINAL THESIS: I believe SHIB is approaching an important decision point. The recovery above MA7 shows that buyers are attempting to regain short-term control, but the remaining moving-average resistance makes this an incomplete recovery. For me, the real signal will come when SHIB can reclaim $0.000004381 with convincing buying participation. Until then, I would treat this movement as an early recovery attempt rather than a confirmed bullish reversal. The next 4H reaction around resistance could determine whether SHIB has enough strength to change its current market structure. $SHIBUSDT #ByXIMPACT