Goma Goma
7023Me gusta0Compartir en el chat211Aficionados85Seguir
crypto analyst
crypto analyst
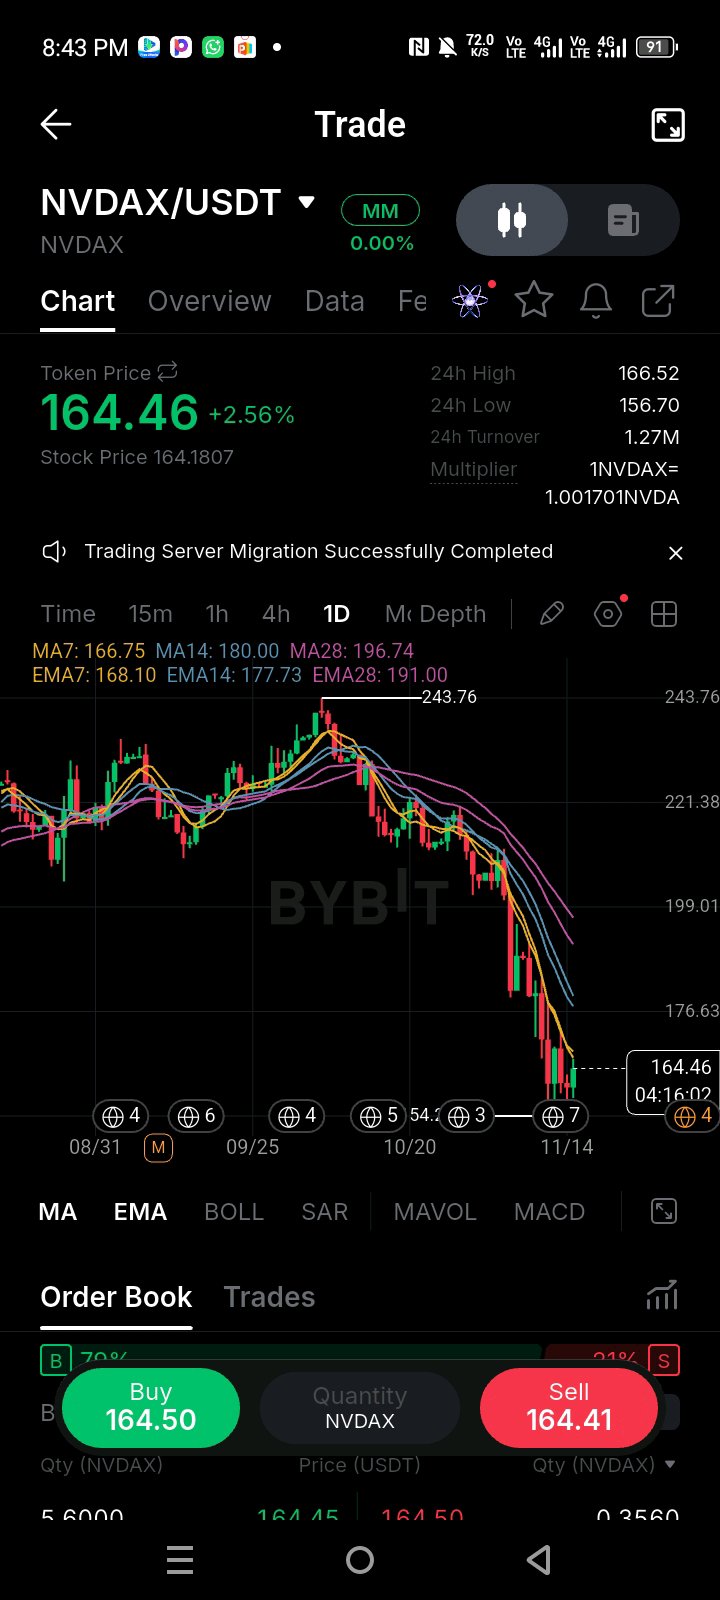
$NVDAXUSDT is trying to find a base after that brutal drop from 243, but the daily chart is flashing a warning sign. What caught my attention is the current price action: we are bouncing to 164.46, but we are running straight into the 7 EMA at 166.75. Look at the order book—there’s 70% buy pressure, yet the price is stalling. That’s a classic sign of absorption. My read here is that this is a weak relief bounce inside a heavy downtrend. The price is completely trapped below the 14 and 28 EMAs, which are sloping down hard. The 70% buy wall might look bullish on paper, but if it can't push price through the 7 EMA, the sellers will eventually eat through it. Key Levels: Resistance: 166.75 (7 EMA), 177.73 (14 EMA) Support: 156.70 (recent daily low) My Trade Plan: Bias: SHORT (Conditional) Entry: $165.00 – $168.00 (Fading the bounce right into the 7 EMA) Confirmation: I want to see a rejection wick or a bearish engulfing candle on the 4H chart right at this 166 level. If buyers step in and close a daily candle above 170 with volume, I step aside. Invalidation: $177.50 (A clean daily break above the 14 EMA kills the immediate bearish momentum). TP1: $156.70 (Retest of the recent low) TP2: $145.00 (Next major liquidity void) R:R: ~1:2.4 based on the stated levels. Why I'm taking this setup: Bounces into the first moving average after a steep drop are often the safest short entries. The buy pressure is trapped, and the trend is still firmly down. Selling this resistance gives us a tight stop and a clear path back to the lows. What would change my mind? If price reclaims 170 and flips the 7 EMA into support, the short thesis is dead. I’d wait for a higher low to form and look for a reversal trade. Until then, the bounce is just a setup for the next leg down. Are you fading this bounce at the 7 EMA, or waiting to see if 156 holds for a spot entry? #ByXIMPACT #WSOT2026 $BTCUSDT
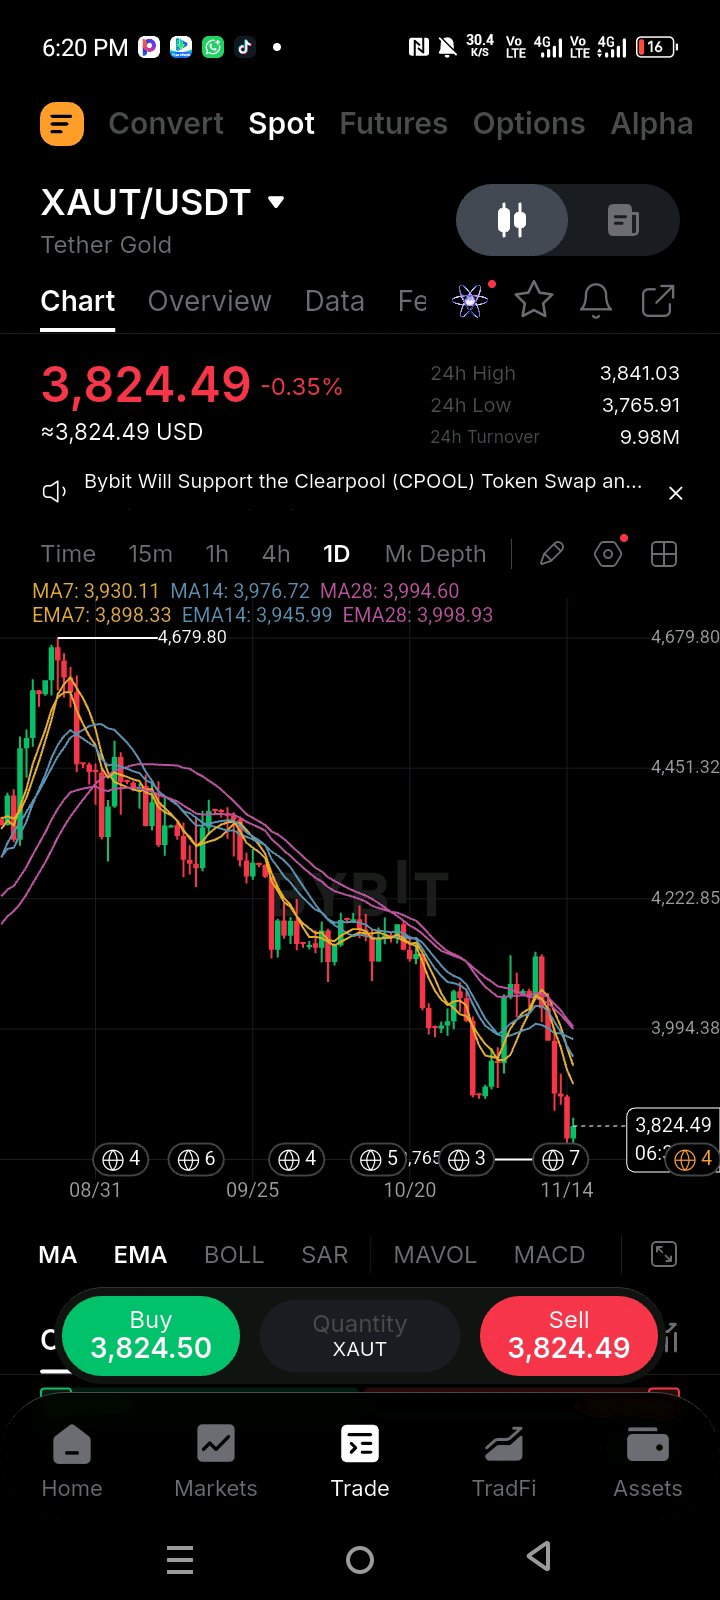
Gold is at 3,824, down about 18% from the 4,679.80 high, but the day's candle is what I'm watching. Price swept to 3,765.91, then recovered roughly 78% of the day's 75-point range. Every average is still overhead and falling: EMA7 at 3,898, MA7 at 3,930, EMA14 at 3,946 and MA14 at 3,977. Price is about 4.4% under the MA28. My read: a buyer showed up at the low, and that's all I can say so far. It isn't a trend change. A market this stretched under its averages often snaps back toward the nearest one, but then it usually rolls over again. I'm treating this as a short bounce trade, not a bottom call, and I'd size it small because it goes against the trend. Key Levels: Resistance: 3,841 (24h high), ~3,850 (former floor), 3,898 (EMA7), 3,930 (MA7) Support: 3,766 (24h low), 3,700 (round number) My Trade Plan: Bias: LONG (Conditional, countertrend) Entry: 3,800 – 3,830 (a dip that holds above the flush low) Confirmation: today's daily candle closes above 3,810, and the next dip holds above 3,790 with no new low Invalidation: 3,755 (a daily close below the flush low means the bounce failed) TP1: 3,898 TP2: 3,977 R:R: ~1:1.4 to TP1 and ~1:2.7 to TP2, based on a 3,815 entry. TP1 is mainly for de-risking, since this trade pays at TP2. Why I'm taking this setup: The risk is defined by a clear low, so my stop is only about 60 points away. The targets are averages the market already respects, so I'm not asking for a reversal, only a move back to the mean. If price loses 3,755 I'm out quickly and the loss is small. What would change my mind? A daily close under 3,755. Or a bounce that stalls below 3,850 and rolls over: then I'd stop looking for longs and go back to selling rallies into the 7-day average. Do you trade bounces inside a downtrend, or do you only trade once the trend actually turns? #ByXIMPACT #WSOT2026 $XAUTUSDT
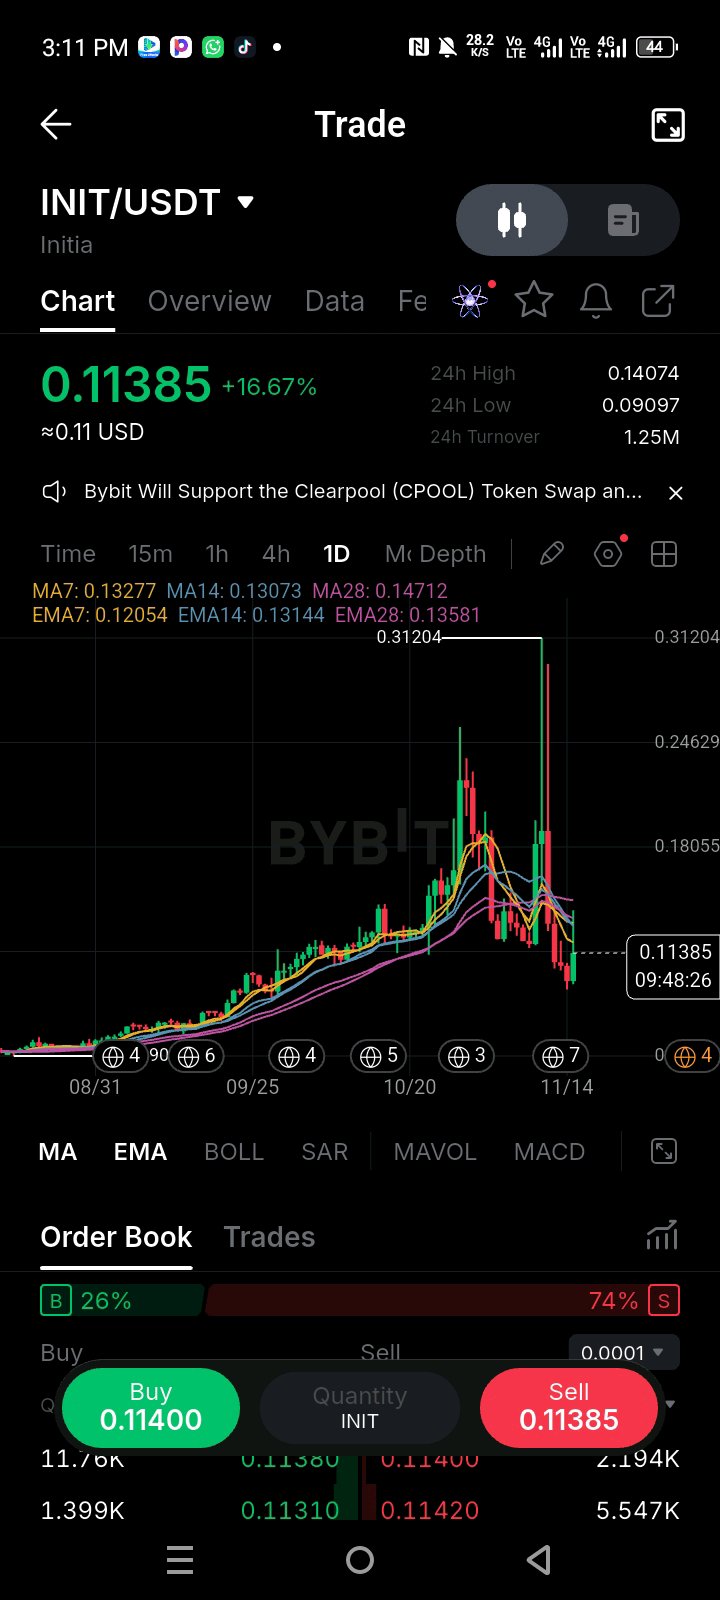
$INITUSDT just printed a massive fakeout, spiking to 0.3120 before completely collapsing back down to 0.1138. What caught my attention isn't just the 16% bounce today, but the sheer damage done to the chart structure. The order book is flashing a heavy 74% sell pressure, meaning the market is stacked against this bounce. My read here is that this is a classic pump-and-dump retracement. The price is currently trapped below the daily EMAs (the 14 EMA at 0.1314 is acting as immediate resistance), and the recent massive upper wick at the top proves sellers are aggressively defending higher prices. The short-term bounce looks like a dead-cat drop, and the overall structure remains extremely vulnerable. Key Levels: Resistance: 0.1314 (14 EMA), 0.1358 (28 EMA) Support: 0.0909 (the recent capitulation low) My Trade Plan: Bias: SHORT (Conditional) Entry: $0.1200 – $0.1280 (Looking for a weak rejection in this zone) Confirmation: I want to see the 4H chart print a lower high. If price pushes into 0.125 and gets slapped down with a bearish engulfing candle, I’m taking the short. Invalidation: $0.1350 (A clean daily close above the 28 EMA means the bears lost control). TP1: $0.1000 (Psychological level) TP2: $0.0909 (Retest of the recent low) R:R: ~1:2.3 based on the stated levels. Why I'm taking this setup: That massive wick to 0.31 followed by a brutal drop means a ton of late buyers are trapped underwater. Every bounce from here is likely to be met with heavy selling as those trapped traders look to break even. The 74% sell pressure in the order book confirms the bearish bias. What would change my mind? If price reclaims the 14 EMA (0.1314) with high volume and the buy side of the order book flips to green, I’m stepping aside. That would mean the market has absorbed the selling, and I’d wait for a new structure to form before shorting again. Are you shorting this bounce into the MAs, or waiting to see if 0.0909 gets swept before looking for a long? #ByXIMPACT #WSOT2026
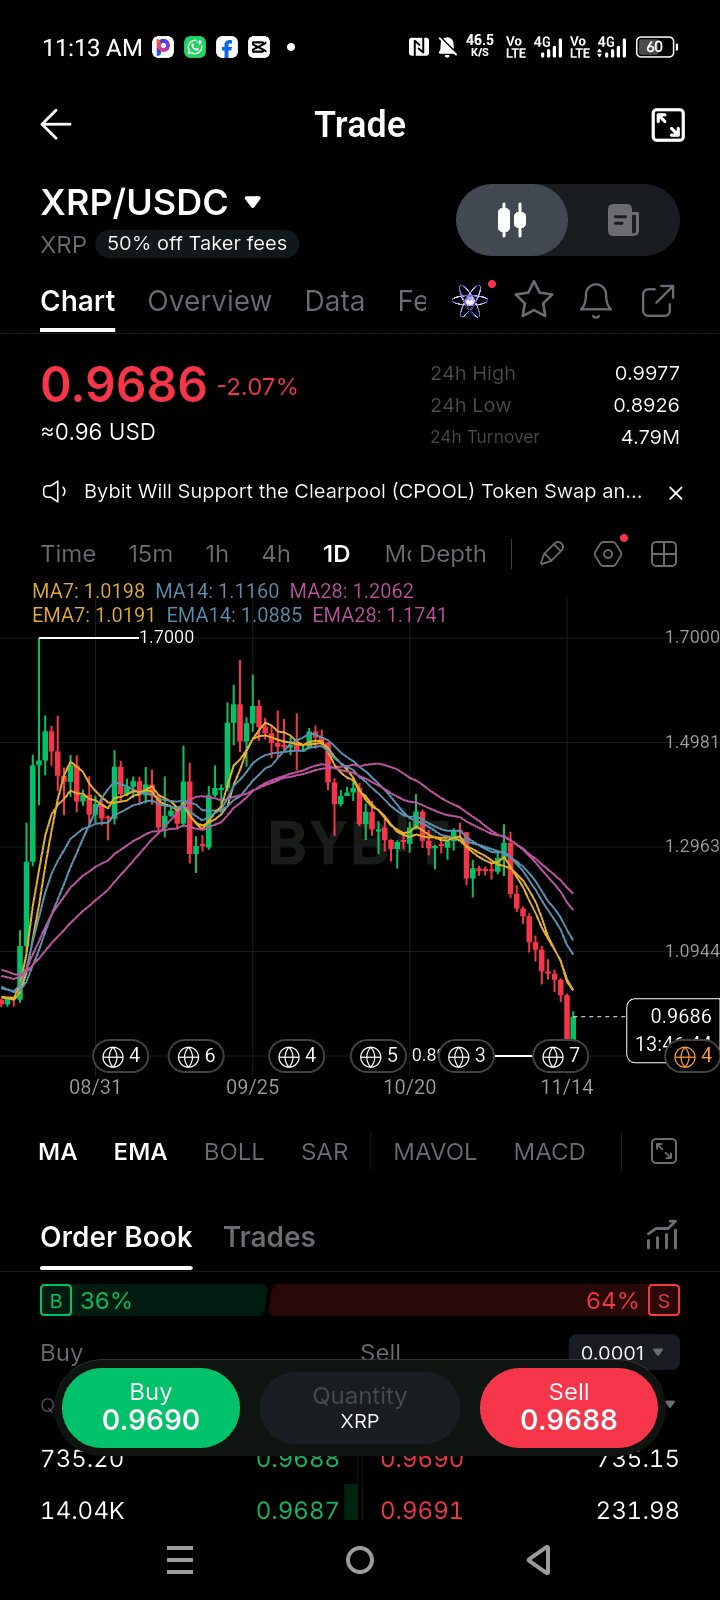
$XRPUSDT is at 0.9686 and sits about 43% below its 1.70 high. The detail that stands out is the last 24 hours. Price swept down to 0.8926, snapped back, and then stalled at 0.9977, just under the round $1 mark. That makes a roughly 12% range with a rejection at a number every trader is watching. The MA7 (1.0198) and EMA7 (1.0191) sit right above it, so the ceiling is stacked: $1 first, then the 7-day averages. My read: the 0.8926 low got bought, but a bounce that can't pass $1 is still a bounce in a downtrend. The averages are lined up bearish (MA7 1.0198, MA14 1.1160, MA28 1.2062) and price is about 20% under the MA28. I'm not guessing the bottom. I want proof that $1 and the 7-day zone have flipped from resistance to support. Key Levels: Resistance: 0.9977 (24h high, just under $1), 1.0191–1.0198 (EMA7/MA7), 1.0885 (EMA14), 1.1160 (MA14) Support: 0.9500 (round number), 0.8926 (24h low) My Trade Plan: Bias: LONG (Conditional, reclaim only) Entry: 1.0000 – 1.0200 (a retest of the $1 / 7-day zone after it breaks) Confirmation: a daily close above 1.0200, then a pullback that holds above 1.0000. If it can't hold $1, there's no trade. Invalidation: 0.9700 (a daily close below it, which puts price back under the level it just reclaimed) TP1: 1.0885 TP2: 1.1160 R:R: ~1:2.0 to TP1 and ~1:2.7 to TP2, based on a 1.0100 entry Why I'm taking this setup: Buying 0.9686 means buying under every average with nothing confirmed. Waiting for the reclaim costs me a few cents of the move, but it puts my stop under a level the market just proved it respects. Both targets are averages that rejected price on the way down, so they're realistic places for the bounce to run into supply. What would change my mind? A daily close below 0.8926. That means the sweep low failed, and I'd stop looking for longs until a new base forms. A hard rejection at 1.02 that prints a lower high also tells me this was a relief bounce, and I'd wait. Does $1 mean anything to you on XRP, or is it just a number? What do you need to see before you buy? #ByXIMPACT #WSOT2026
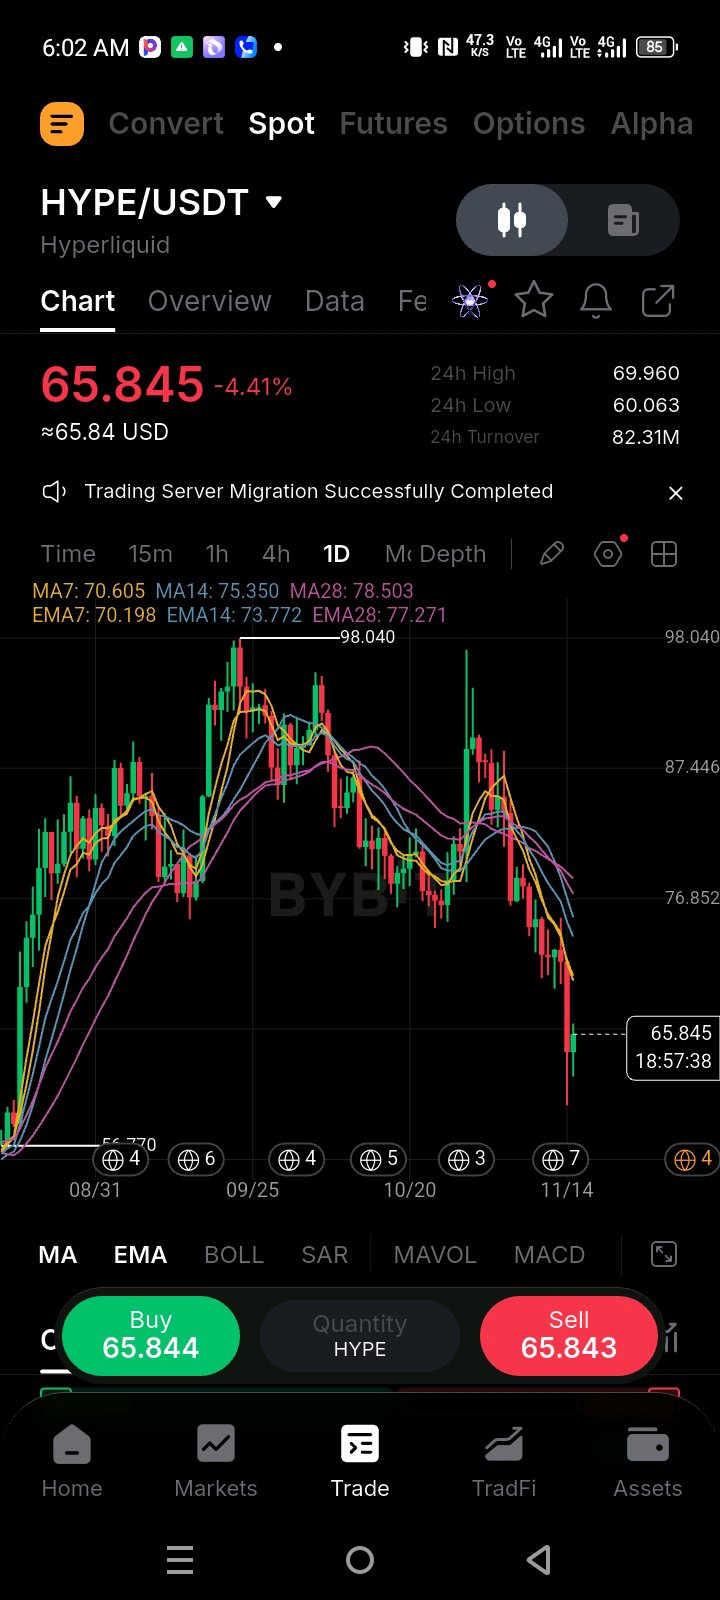
$HYPEUSDT acaba de imprimir una vela diaria fea, cayendo desde el máximo de 69.96 directo hacia abajo para barrer los 60.06 antes de rebotar a 65.84. Lo que me llamó la atención es la velocidad pura de esa descarga y la larga mecha inferior que dejó atrás. El precio está completamente separado de las medias móviles diarias ahora mismo; la EMA de 7 está muy arriba en 70.19 y la EMA de 28 está en 77.27. Mi lectura aquí es que este es un movimiento de capitulación violento. Cuando un activo de alta beta como HYPE se desploma tan fuerte en una sola sesión, usualmente dispara una ola de liquidaciones forzadas. La estructura sigue técnicamente rota porque estamos a kilómetros debajo de las MAs, pero esa mecha en 60 me dice que hay compradores esperando en las profundidades. No estoy persiguiendo este rebote a ciegas, pero la configuración para un trade de alivio está tomando forma. Niveles Clave: Resistencia: 70.19 (EMA de 7), 73.77 (EMA de 14) Soporte: 60.06 (el mínimo de la mecha de capitulación) Mi Plan de Trading: Sesgo: LARGO (Scalp contra tendencia / Condicional) Entrada: $63.00 – $65.00 (Buscando atrapar un mínimo más alto formándose sobre la mecha) Confirmación: Necesito ver que el gráfico de 4H imprima una fuerte vela envolvente alcista o una estructura clara de doble suelo por encima de 60. Si el precio solo se mueve lateralmente y se desangra, me mantengo fuera. Invalidación: $59.50 (Un cierre diario limpio debajo de este nivel significa que la capitulación falló y nos dirigimos mucho más abajo). TP1: $70.19 (Retesteo de la EMA de 7) TP2: $73.77 (EMA de 14) R:R: ~1:2.6 basado en los niveles establecidos. Por qué estoy tomando esta configuración: Una mecha inferior masiva después de una venta fuerte es una señal clásica de agotamiento. El riesgo/recompensa es asimétrico aquí porque nuestro stop es muy ajustado, justo debajo del nivel psicológico de 60. Si los creadores de mercado han terminado de barrer la liquidez, este rebote de alivio podría ser agresivo. ¿Qué cambiaría mi opinión? Si el precio pierde los 60.06 con alto volumen, significa que las instituciones todavía están distribuyendo y el suelo no se ha tocado. Me apartaría inmediatamente y esperaría a que una base completamente nueva se forme más abajo. ¿Estás tratando de atrapar este rebote desde la mecha de 60, o esperando a que HYPE reclame la EMA de 70 antes de tocarlo? #ByXIMPACT
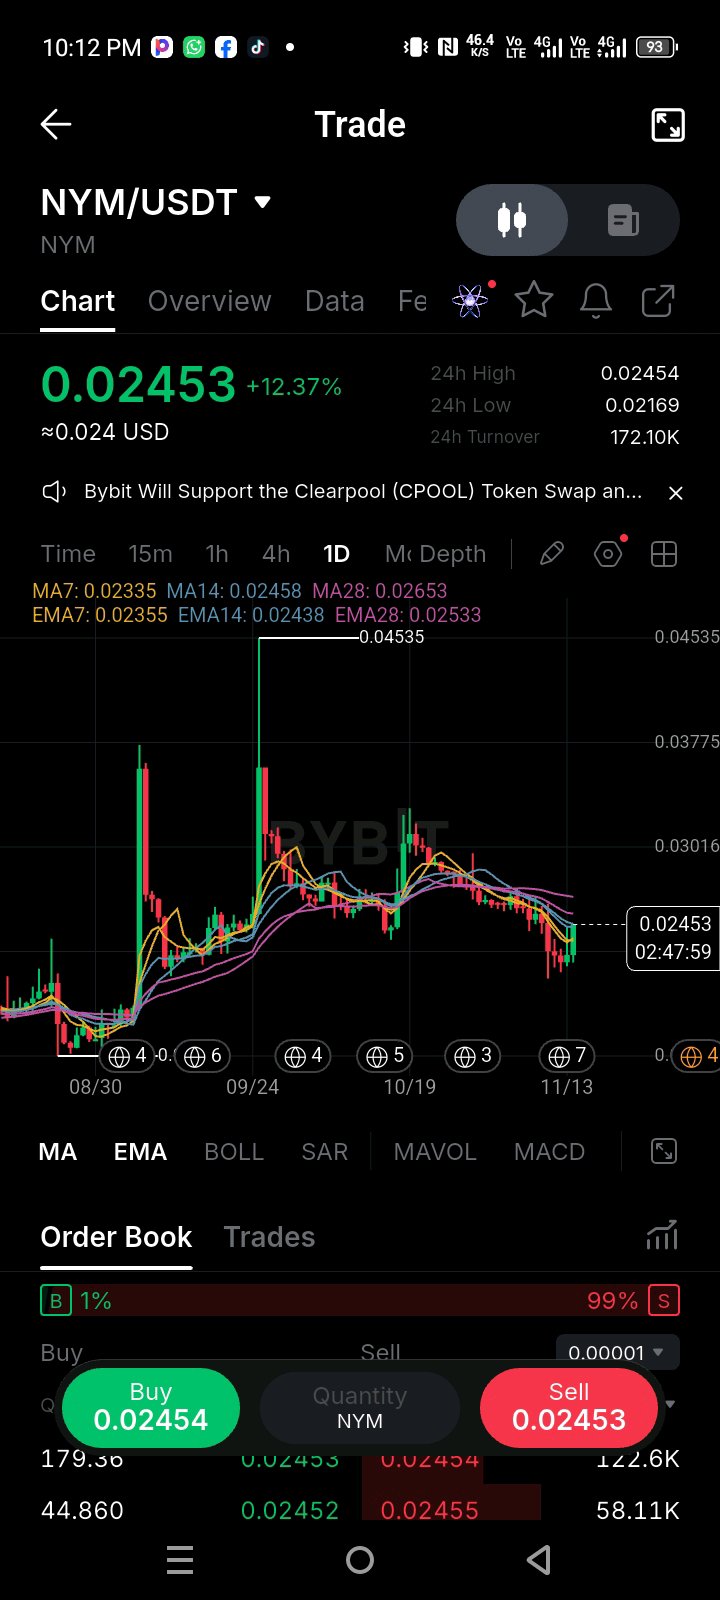
$NYMUSDT está en 0.02453 después de un día de +12.4%, casi exactamente en la MA14 en 0.02458. Ese es el detalle que no puedo ignorar. La vela salió de un mínimo de 0.02169, recuperó la MA7 (0.02335), la EMA7 (0.02355) y la EMA14 (0.02438), y ahora está empujando hacia el primer promedio que realmente importa. La MA28 (0.02653) y la EMA28 (0.02533) siguen estando por encima y cayendo, así que la tendencia aún no está definida. Mi lectura: esta es una reacción fuerte, pero una reacción no es una reversión. El volumen de negociación es de solo 172K y el libro de órdenes está fuertemente cargado hacia el lado de venta, por lo que una moneda con poca liquidez puede marcar un día de +12% sin mucho detrás. No persigo la vela. Necesito el cierre por encima de 0.02458, y luego que se mantenga ahí. Niveles clave: Resistencia: 0.02533 (EMA28), 0.02653 (MA28), 0.0300 (el rango alto de octubre, justo por debajo de la línea de cuadrícula de 0.03016) Soporte: 0.02438 (EMA14), 0.02335–0.02355 (MA7/EMA7), 0.02169 (mínimo de hoy) Mi plan de trading: Sesgo: LARGO (Condicional) Entrada: 0.0246 – 0.0250 (un retesteo de la MA14 desde arriba después del cierre) Confirmación: un cierre diario por encima de 0.02458, luego un retroceso que lo mantenga. Sin cierre, no hay trade. Invalidación: 0.0230 (un cierre diario por debajo de la zona MA7/EMA7, donde el cuerpo de esta vela está dividido a la mitad) TP1: 0.02653 TP2: 0.0300 R:R: ~1:1.0 al TP1 y ~1:2.9 al TP2, basado en una entrada de 0.0248. El TP1 es un punto para asegurar ganancias y seguir la tendencia, porque esta configuración paga en el TP2. Por qué tomo esta configuración: Los promedios están apilados de forma bajista, pero el precio acaba de eliminar tres de ellos en una sola vela, y la MA14 se sitúa exactamente en el lugar donde esto tiene que probarse a sí mismo. Si se mantiene como soporte, voy en largo en una recuperación con un stop debajo del punto medio de la vela, y si no, salgo con una pequeña pérdida. En una moneda con tan poca liquidez usaría órdenes límite y mantendría mi tamaño pequeño, porque el libro puede moverse con unas pocas órdenes. ¿Qué me haría cambiar de opinión? Un cierre diario de vuelta por debajo de 0.02438 significa que la MA14 rechazó el rebote y hoy fue un pico hacia la resistencia. También me echaría atrás si la siguiente vela diaria muestra una larga mecha superior con muy poco volumen detrás. ¿Confías en un día de +12% con poco volumen, o esperas a un segundo cierre en verde antes de tocarla? #ByXIMPACT #WSOT2026
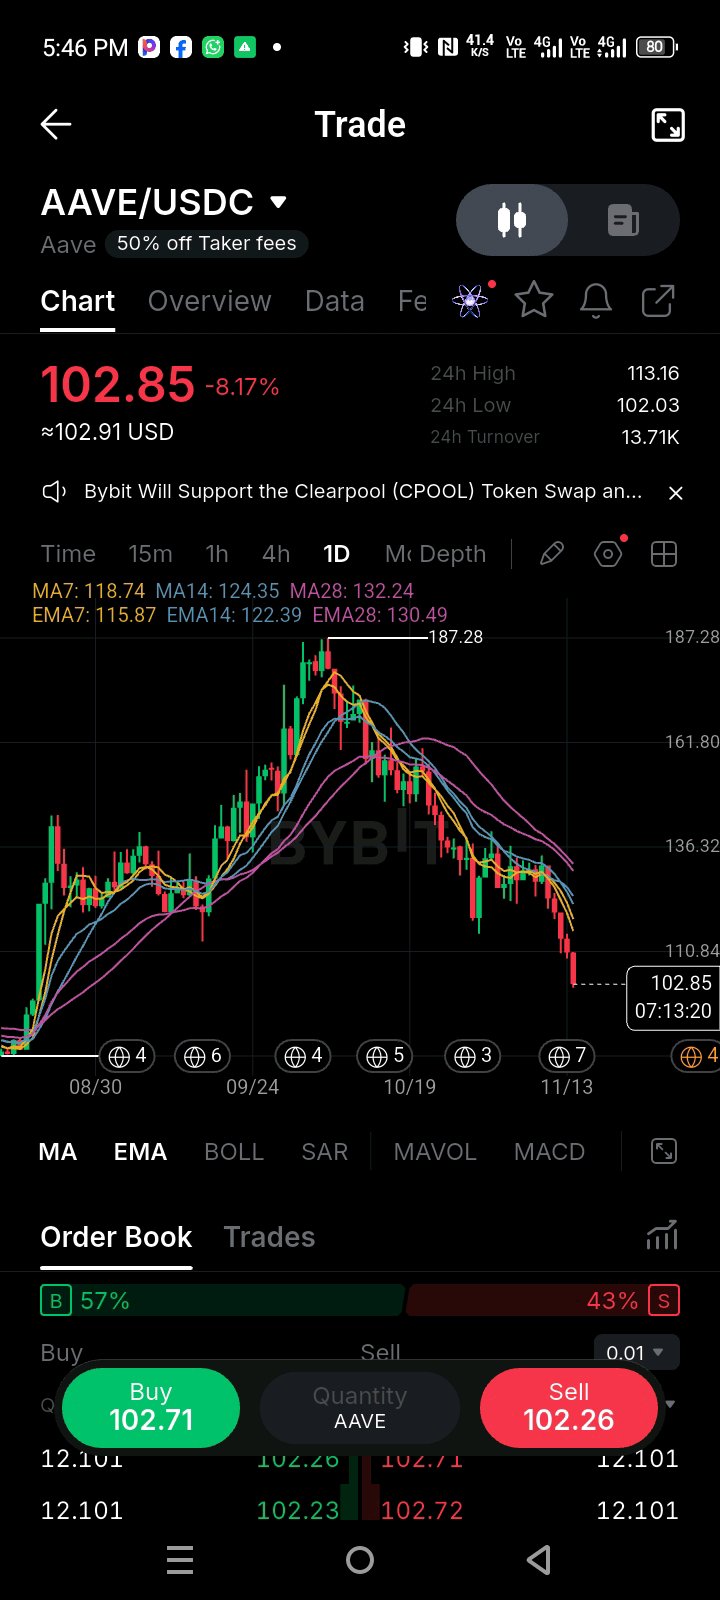
$AAVEUSDT is currently printing an aggressive macro leg down, sliding from the 187.28 cycle peak down to test the 102.85 handle with a -8.17% markdown on the session. Looking closely at the daily moving average structure, the separation is wide and heavy: the MA7 (118.74) and MA14 (124.35) are sloping sharply downward, acting as an active dynamic ceiling, while price tests the critical psychological and structural floor around the 102.00 zone. My read here is that the asset is undergoing an accelerated flush, shaking out remaining late longs. While the momentum is undeniably heavy, severe deviations from the moving average cluster often preface an aggressive consolidation base or a sharp relief mean-reversion, though stepping in without a confirmed structural shift is high-risk. Key Levels: Resistance: $118.74 (MA7 Dynamic Ceiling), $132.24 (MA28 Trend Barrier) Support: $102.03 (24h Low / Immediate Structural Floor), $95.00 (Macro Demand Base) My Trade Plan: Bias: LONG (Conditional Counter-Trend Rebound) Entry: $101.50 – $103.50 (On a confirmed defense and lower-wick absorption of the 102 level) Confirmation: I want to see a high-volume 4H reclaim of the 108.00 pivot or a sharp rejection wick off the 102 floor before scaling any capital in. Invalidation: $101.00 (A clean daily close below this baseline invalidates the support thesis entirely). TP1: $118.74 (MA7 Dynamic Revisit) TP2: $128.50 (Mid-Range Structural Supply) R:R: ~1:2.4 based on the stated levels. Why I'm taking this setup: The intensity of the recent sell-off has pushed price into extreme statistical deviation relative to its daily moving averages, increasing the probability of a corrective bounce as short-term traders take profits near key horizontal support. What would change my mind? If selling volume expands aggressively and price slices through 101.00 on strong momentum, I am stepping completely aside. No catching falling knives in a confirmed trend breakdown. Are you looking to scale into this support retest on AAVE, or waiting for a confirmed daily close back above the moving averages first? #ByXIMPACT #WSOT2026 $BTCUSDT
$XAUTUSDT is at 3,863, about 17.5% below the 4,679.80 high. It is only about $12 above the low it set roughly two weeks ago, near 3,851. The bounce between those two lows topped around 4,120 and then rolled over, and the averages are still stacked bearish: MA7 3,971, MA14 3,986, MA28 4,009, with EMA28 at 4,016. Today's candle is small, so sellers haven't pushed through the floor yet. My read: this is a retest of support inside a downtrend, not a reversal. A floor tested twice in two weeks usually decides one way or the other, and I don't want to guess which. So I'm not buying the support or shorting into it. I wait for the daily close. Key Levels: Resistance: 3,898 (today's high), 3,938–3,973 (EMA7/EMA14), 4,009–4,016 (MA28/EMA28), ~4,120 (bounce high) Support: 3,859 (24h low), ~3,851 (prior low) My Trade Plan: Bias: SHORT (Conditional, break and retest only) Entry: $3,830 – $3,850 (a retest of 3,851 from below after it breaks) Confirmation: a daily close under 3,851, then a failed reclaim, meaning price comes back to the level and gets rejected Invalidation: $3,900 (a daily close above today's high kills the short) TP1: $3,720 TP2: $3,585 R:R: ~1:2 to TP1 and ~1:4.3 to TP2, based on a 3,840 entry. Both targets are measured-move projections of the 3,851–4,120 range, since there's no chart level below the low. Why I'm taking this setup: Selling a retest of broken support puts the stop above a level the market has just defended, so I'm not guessing the break in advance. The trend and the averages are already pointing down, and the failed bounce toward 4,120 shows buyers couldn't hold higher prices. If the floor holds, I lose nothing, because I never entered. What would change my mind? A daily close above 3,900, or a sweep below 3,851 that closes back above it. That's a failed breakdown, and I'd flip my attention to a bounce toward the 3,970 averages instead. Does a floor that gets tested a second time within two weeks look stronger or weaker to you? #ByXIMPACT #WSOT2026
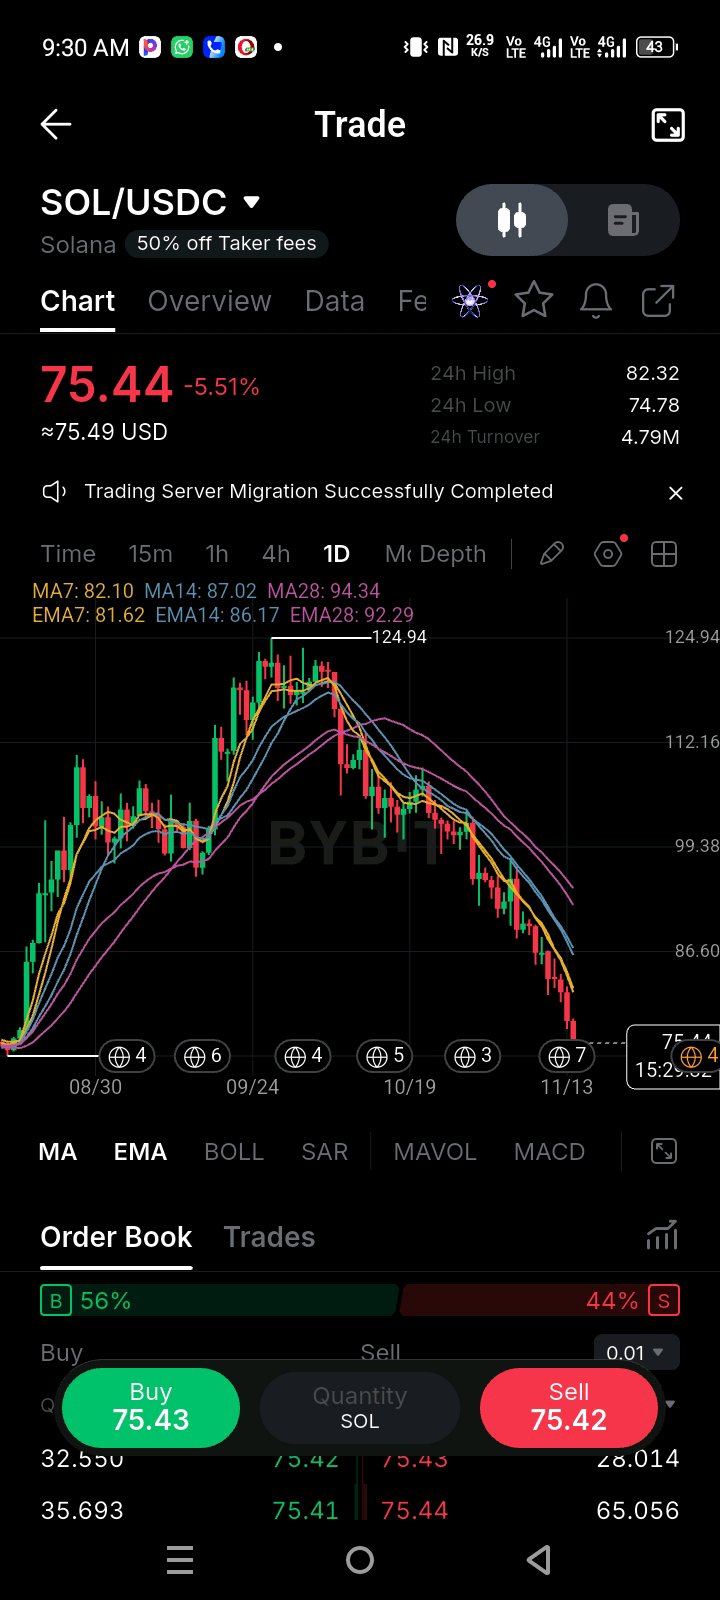
$SOLUSDT has been in a relentless downtrend since the 124.94 peak, and the daily chart is showing zero signs of a real reversal. What caught my attention is the recent price action: we are currently at 75.44, completely rejected by the short-term moving averages. The 7 and 14 EMAs are crossing down hard at 82.10 and 86.17, acting as heavy overhead resistance. The order book is showing 56% buy pressure, but it's failing to hold the price up. My read here is that this is a clear continuation setup. That 56% buy pressure is likely just retail trying to catch a falling knife—it isn't translating into actual price appreciation. The structure remains deeply bearish while we are trading below 82, and I am absolutely not trying to front-run a trend this heavy. Key Levels: Resistance: 82.10 (7 EMA), 92.29 (28 EMA) Support: 74.78 (24h low), 68.00 (next major psychological zone) My Trade Plan: Bias: SHORT (Conditional) Entry: $79.50 – $81.50 (On a weak bounce into the 7 EMA) Confirmation: I want to see a lower high form on the 4H chart. If price pushes up but fails to reclaim 82 and prints a bearish rejection candle, I'm taking the short. Invalidation: $86.20 (A clean daily close above the 14 EMA kills the immediate bearish momentum). TP1: $74.78 (Retest of the recent low) TP2: $68.00 R:R: ~1:2.4 based on the stated levels. Why I'm taking this setup: When a major altcoin like SOL breaks down after a blow-off top, the first relief bounces are almost always sold. The 80–82 zone is where old support flipped to resistance. Selling the retest gives us a tight stop with a clear path down. What would change my mind? If we sweep 74.78 and immediately print a massive bullish engulfing candle with heavy volume, that’s a liquidity grab. In that scenario, I’d cut the short and wait for a higher low to confirm a reversal. Until then, the path of least resistance is down. Are you shorting this bounce into 80, or are you waiting for a daily close above 86 to flip bullish? #ByXIMPACT #WSOT2026 $BTCUSDT
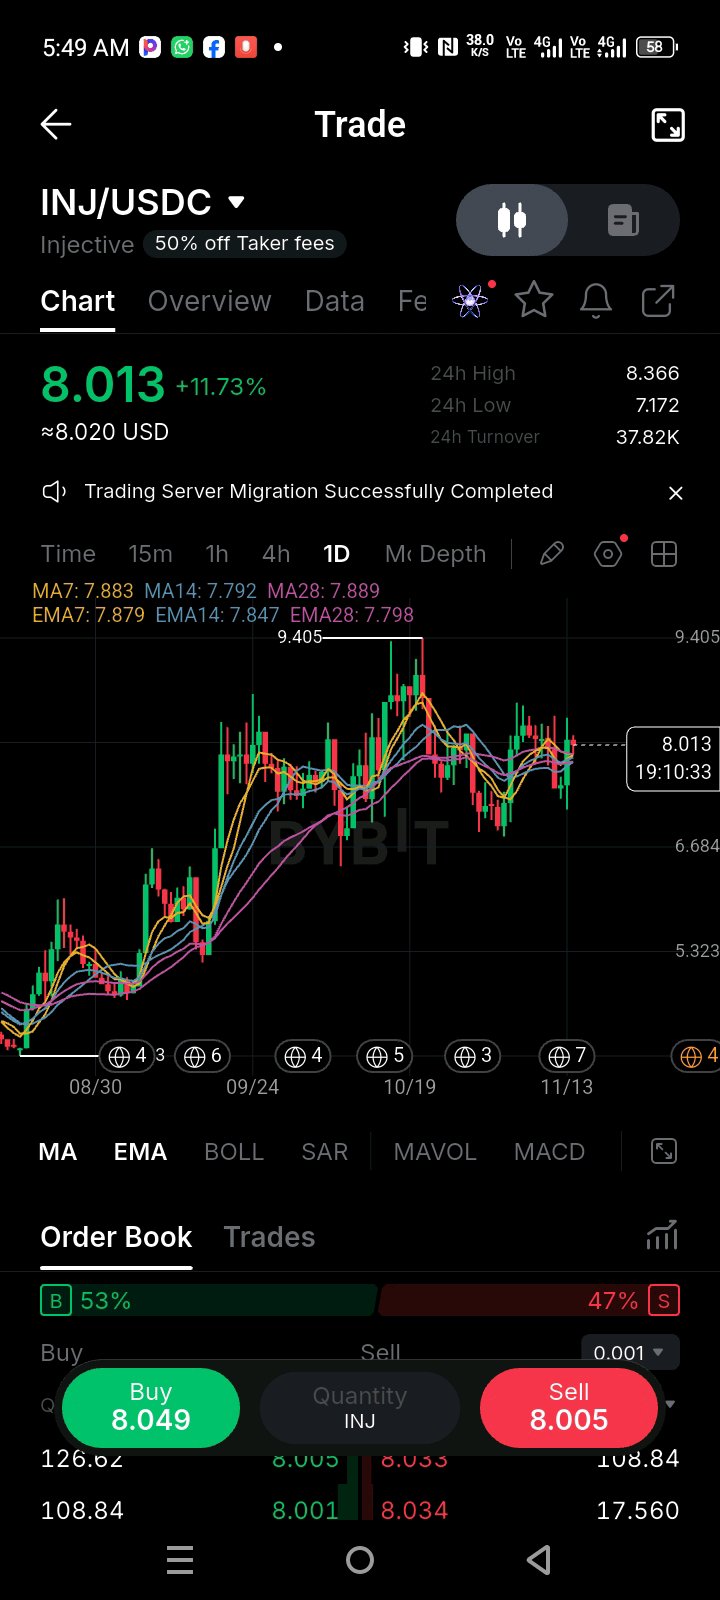
$INJUSDT spent weeks coiling, and every average I track is now stacked inside a band about $0.10 wide: MA14 at 7.79, EMA28 at 7.80, EMA14 at 7.85, EMA7 at 7.88, MA7 at 7.88 and MA28 at 7.89. Today's +11.7% candle ripped from 7.17 to 8.37 and is sitting at 8.01, above the whole cluster. When the averages are this tangled, they mark where the market has been in agreement, and price just left that area. My read: this looks like a push out of balance, but I'm not trusting it yet. The 9.405 peak is still far above, and price at 8.01 is mid-range, which is a bad place to buy. What I care about is whether the cluster flips from a ceiling into a floor. Key Levels: Resistance: 8.37 (today's high), ~9.00 (the zone under the 9.405 peak), 9.405 (range high) Support: 7.80 – 7.89 (the braided averages), 7.17 (today's low) My Trade Plan: Bias: LONG (Conditional) Entry: $7.80 – $7.95 (a pullback into the cluster) Confirmation: a daily candle that dips into the zone and closes back above 7.88 with a lower wick. Without that, I stay out. Invalidation: $7.60 (a daily close below it. That's under the whole cluster and under the midpoint of today's candle.) TP1: $8.37 TP2: $9.00 R:R: ~1:1.8 to TP1 and ~1:4 to TP2, based on a 7.88 entry Why I'm taking this setup: The cluster is where price spent weeks, so a retest that holds makes it support. My stop sits beneath all six averages, so if it's hit, the breakout idea is simply wrong. And today's move is big enough that a hold above 7.88 would show real buyers, not just a one-day spike. What would change my mind? A daily close below 7.60. That puts price back inside the old range with nothing proven, and I'd wait for a new base. If price instead races to 8.37 and rejects hard without ever retesting the cluster, I also skip it and don't chase. Is this a real breakout or a pop in the middle of a range? What would you need to see on the next daily candle to believe it? #ByXIMPACT
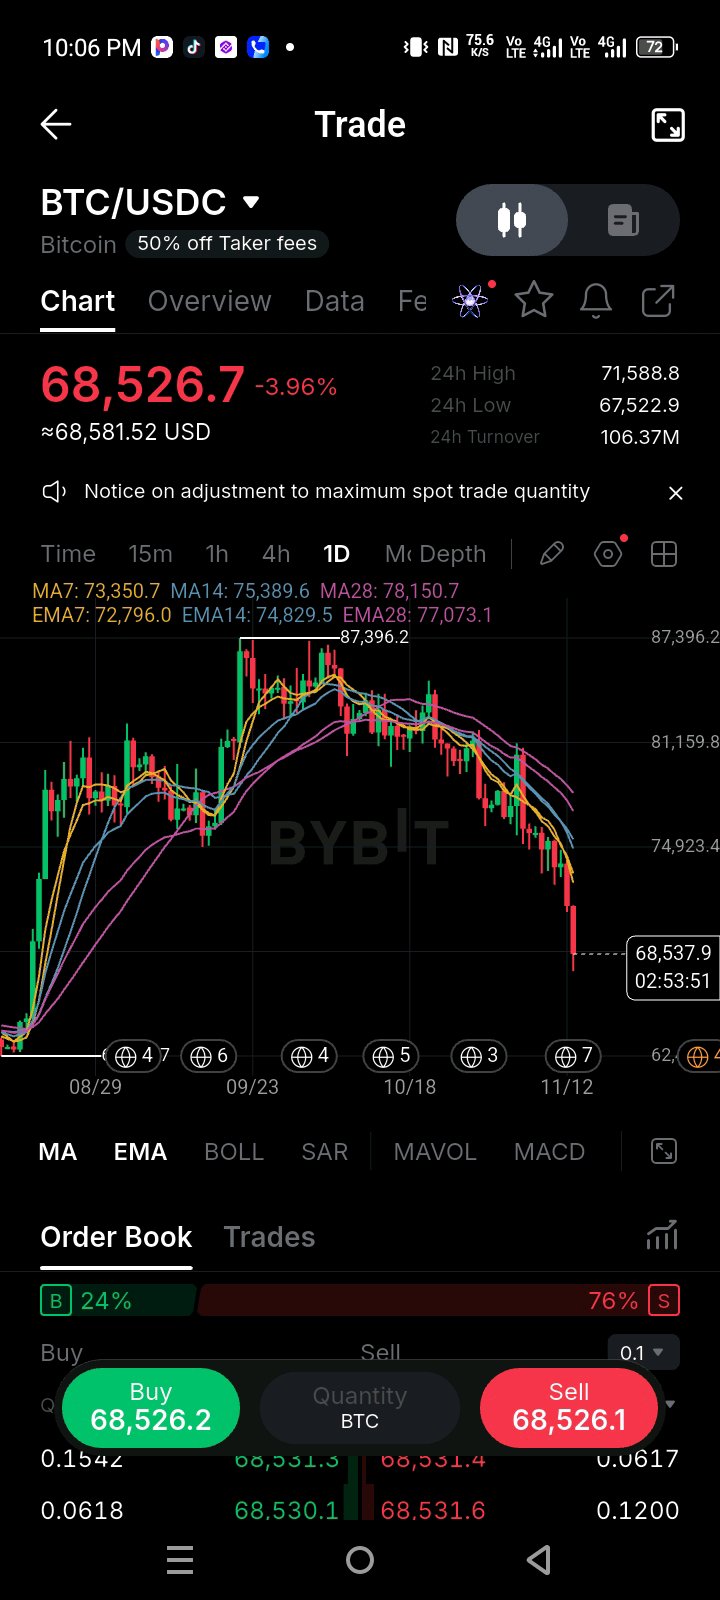
$BTCUSDT cayó desde el máximo de 87,396 a 68,526, alrededor de un 21.6% en unas pocas semanas, y la vela de hoy es un cuerpo largo rojo casi sin mecha inferior. Eso es lo que destaca. El precio está por debajo de todas las medias móviles y la pila está alineada de forma bajista: MA7 en 73,351, MA14 en 75,390 y MA28 en 78,151, todas curvándose hacia abajo. Mi lectura: esto es un movimiento de tendencia, no una caída para aprovechar. Un mercado tan lejos por debajo de sus promedios puede rebotar fuerte, pero un rebote hacia promedios que están cayendo suele ser un lugar para vender, no un suelo. No voy a entrar en corto en la caída misma. La ventaja está en el retesteo. Niveles clave: Resistencia: 71,589 (máximo de hoy), 72,796–73,351 (EMA7/MA7), 74,830–75,390 (EMA14/MA14) Soporte: 67,523 (mínimo de hoy), luego ~62,500 (la base anterior a la izquierda del gráfico) Mi plan de trading: Sesgo: CORTO (Condicional, solo en un rebote) Entrada: $72,000 – $73,300 (un retesteo de la zona EMA7/MA7) Confirmación: una mecha de rechazo o un cierre diario bajista por debajo de 72,800 después de que el precio toque esta zona. Sin vela, no hay operación. Invalidación: $75,500 (un cierre diario por encima de la MA14 significa que el rebote se está convirtiendo en algo más grande) TP1: 67,500 TP2: 62,500 R:R (Relación riesgo/beneficio): ~1:1.8 para TP1 y ~1:3.6 para TP2, basado en una entrada en 72,650 Por qué tomo esta configuración: Los promedios están apilados y cayendo, y el precio está lo suficientemente lejos por debajo de ellos como para que el primer rebote real tenga que toparse con oferta. Esperar el retesteo pone mi stop por encima de un nivel que el mercado ya respeta, así que no estoy adivinando el techo. El libro de órdenes estaba inclinado cerca de un 76% hacia el lado vendedor cuando tomé esta captura, pero eso cambia minuto a minuto, así que lo trato como una nota al pie y no como una señal. ¿Qué me haría cambiar de opinión? Un cierre diario por encima de 75,500, o varios días en los que el precio se mantenga por encima de 71.6k sin rechazo. Cualquiera de las dos cosas significa que los vendedores están perdiendo el control, y yo... $ByXIMPACT
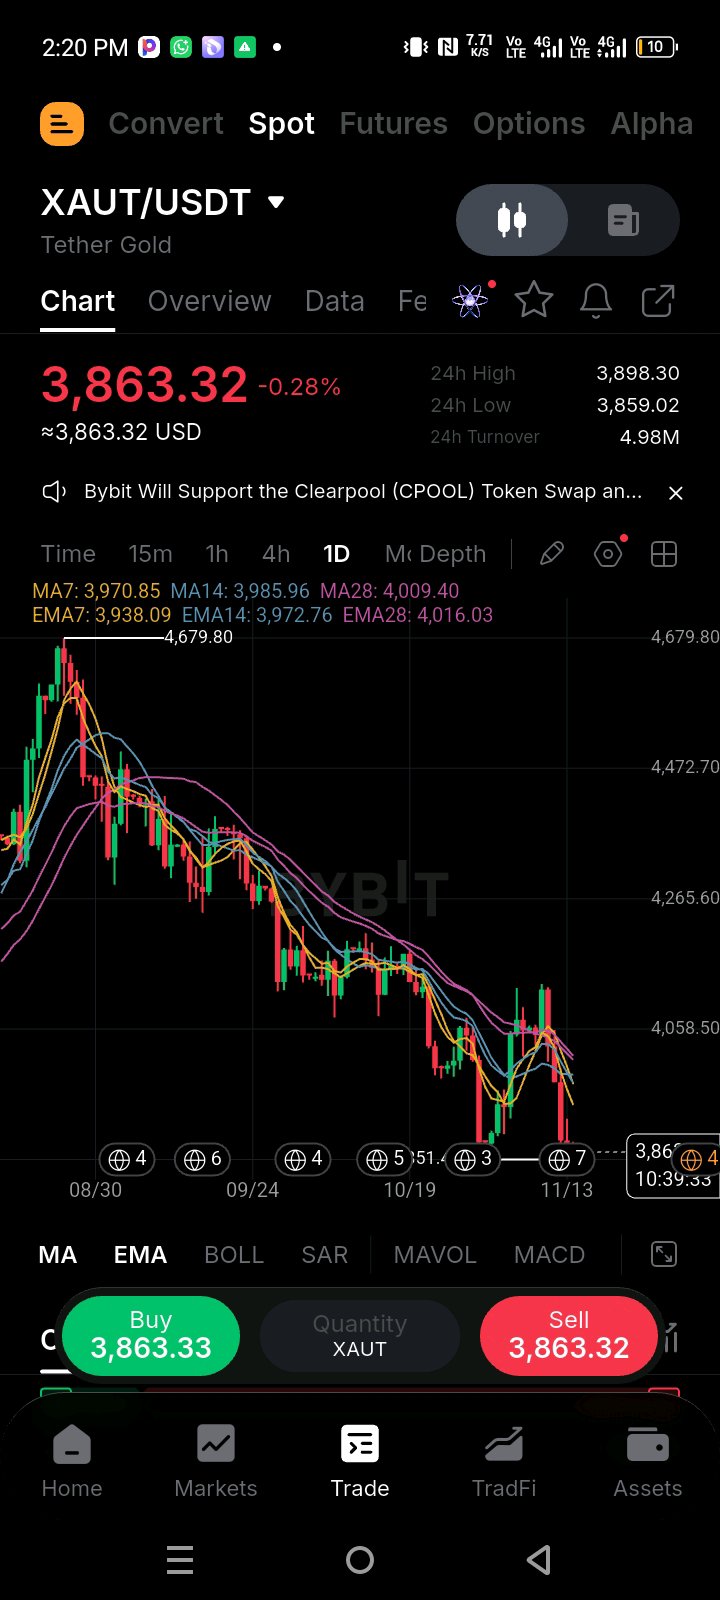
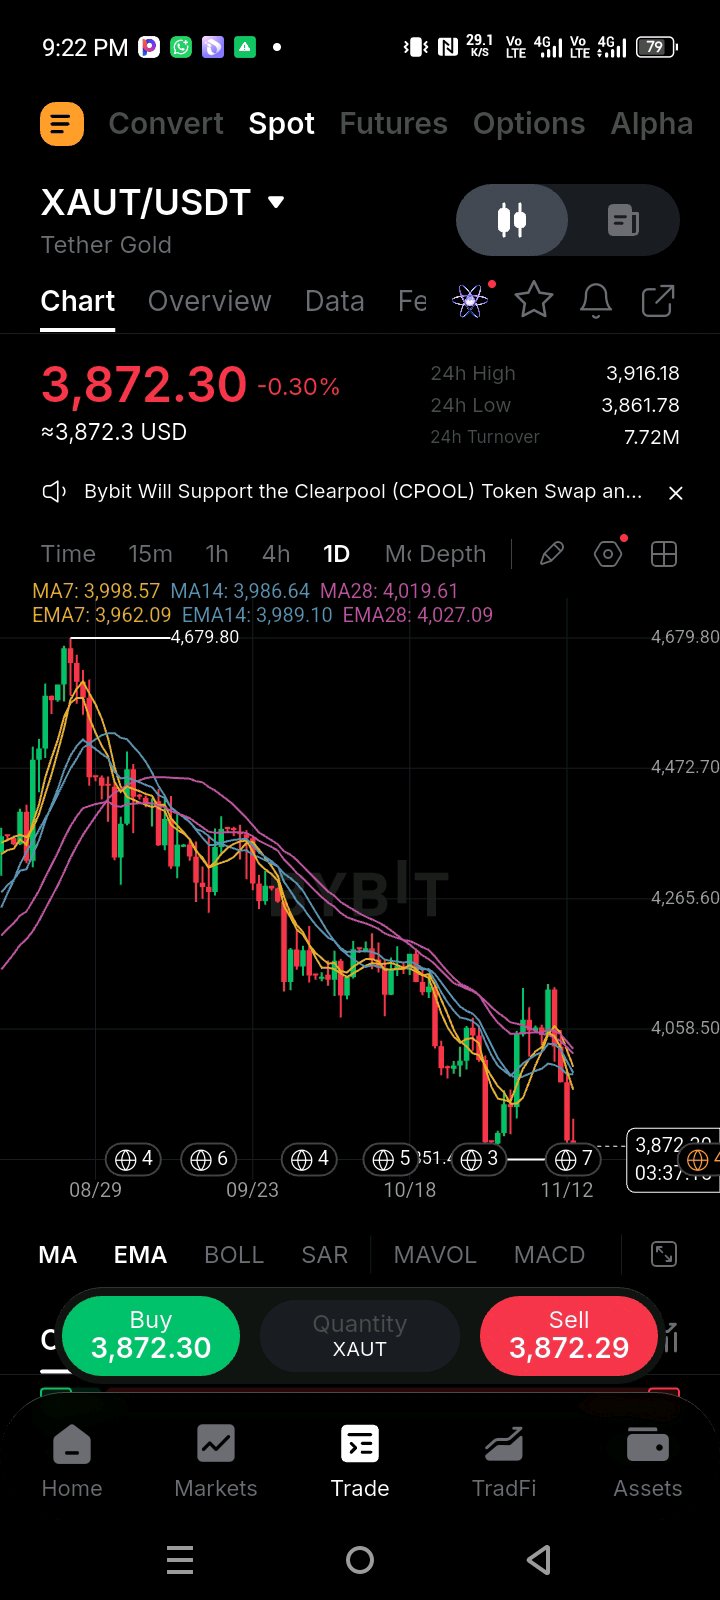
$XAUTUSDT ha experimentado una severa fase de markdown macro, deslizándose fuertemente desde el máximo del ciclo de 4,679.80 hasta probar el actual nivel de soporte de demanda en 3,872.30. La acción del precio permanece profundamente reprimida por debajo del clúster de medias móviles diarias (MA7 en ~3,998, MA14 en ~3,986 y MA28 en ~4,019), mostrando que los vendedores han mantenido el control absoluto sobre la estructura de tendencia a mediano plazo. Mi lectura aquí es que, si bien la tendencia general es innegablemente bajista, la magnitud de la reciente caída hacia la línea base de 3,860 está estirando el agotamiento de los vendedores. Nos estamos acercando a un punto de inflexión crítico donde podría materializarse una reversión a la media de alivio, pero intentar agarrar un cuchillo cayendo sin confirmación es una trampa. Niveles Clave: Resistencia: $3,998.57 (Techo Dinámico MA7), $4,019.61 (Barrera de Tendencia MA28) Soporte: $3,860.00 (Mínimo Estructural Local), $3,750.00 (Suelo de Demanda Macro Profunda) Mi Plan de Trading: Sesgo: LARGO (Alivio Condicional contra la Tendencia) Entrada: $3,850.00 – $3,875.00 (Tras una defensa confirmada del suelo psicológico local) Confirmación: Necesito ver un rechazo con mecha inferior y alto volumen en el marco de tiempo diario o una recuperación estructural limpia en 4H del pivote de 3,920 antes de escalar cualquier capital. Invalidación: $3,840.00 (Una ruptura decisiva por debajo de este soporte invalida la tesis de alivio). TP1: $3,998.00 (Revisita a MA7) TP2: $4,150.00 (Pivote de Oferta de Rango Medio) R:R: ~1:2.5 basado en los niveles establecidos. Por qué tomo esta configuración: Las salidas extendidas de la nube de medias móviles diarias frecuentemente invitan a rebotes de reversión a la media bruscos y agresivos cuando los suelos estructurales macro son defendidos por los participantes del mercado. ¿Qué cambiaría mi opinión? Si el volumen de ventas se expande agresivamente y el precio corta el nivel de 3,840 al cierre, me retiro por completo. Nada de apuestas heroicas contra la continuación de una tendencia acelerada. ¿Estás buscando escalar en esta prueba de soporte en el oro tokenizado, o esperando un cambio estructural por encima de las medias móviles primero? #ByXIMPACT #WSOT2026
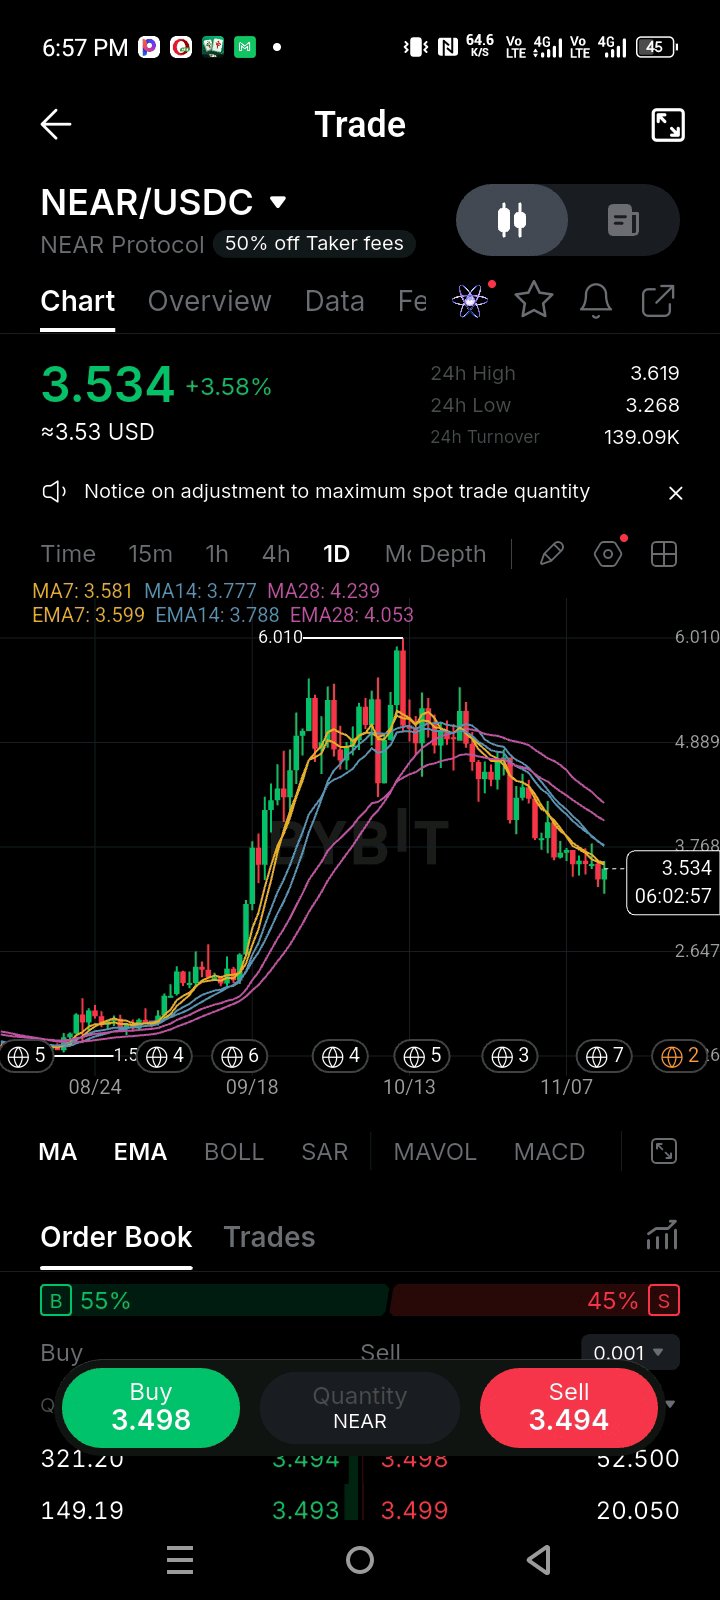
$NEARUSDT is down about 41% from the 6.01 peak, and the daily MAs are still stacked bearish: MA7 at 3.58, MA14 at 3.78, MA28 at 4.24 and still falling. What caught my eye today is the candle itself. Price wicked down to 3.268 and got bought back up to 3.53, so someone defended that low. My read: this is a relief bounce until proven otherwise. Price is still under every average, so one green candle doesn't change the trend for me. At 3.53 I'm sitting mid-range, which is a poor place to enter, so I'm not chasing. Key Levels: Resistance: 3.62 (today's high, MA7/EMA7 zone), 3.78 (MA14/EMA14 cluster), 4.05 (EMA28) Support: 3.27 (today's wick low), then the base where the September impulse started, around 2.6 My Trade Plan: Bias: LONG (Conditional, bounce only) Entry: $3.38 – $3.46 (on a pullback that holds above the 3.27 wick) Confirmation: a rejection wick or a green daily close holding above 3.40 as price tests this zone Invalidation: $3.22 (a daily close below today's low kills the idea) TP1: $3.78 TP2: $4.05 R:R: ~1:1.8 to TP1 and ~1:3.1 to TP2, based on a 3.42 entry Why I'm taking this setup: The sell-off is stretched and today's wick shows real demand at 3.27. That gives me a tight stop under a clear low instead of guessing the bottom. The first target is the 3.78 cluster, the first place this bounce has to prove itself. What would change my mind? A daily close below 3.22. That means the 3.27 defense failed, and I'd step aside and wait for a new base instead of averaging down. A rejection at 3.78 that prints a lower high would also tell me this was only a bounce. Is 3.27 your line in the sand on NEAR, or are you waiting for a daily close above 3.78 before touching it? #ByXIMPACT #WSOT2026
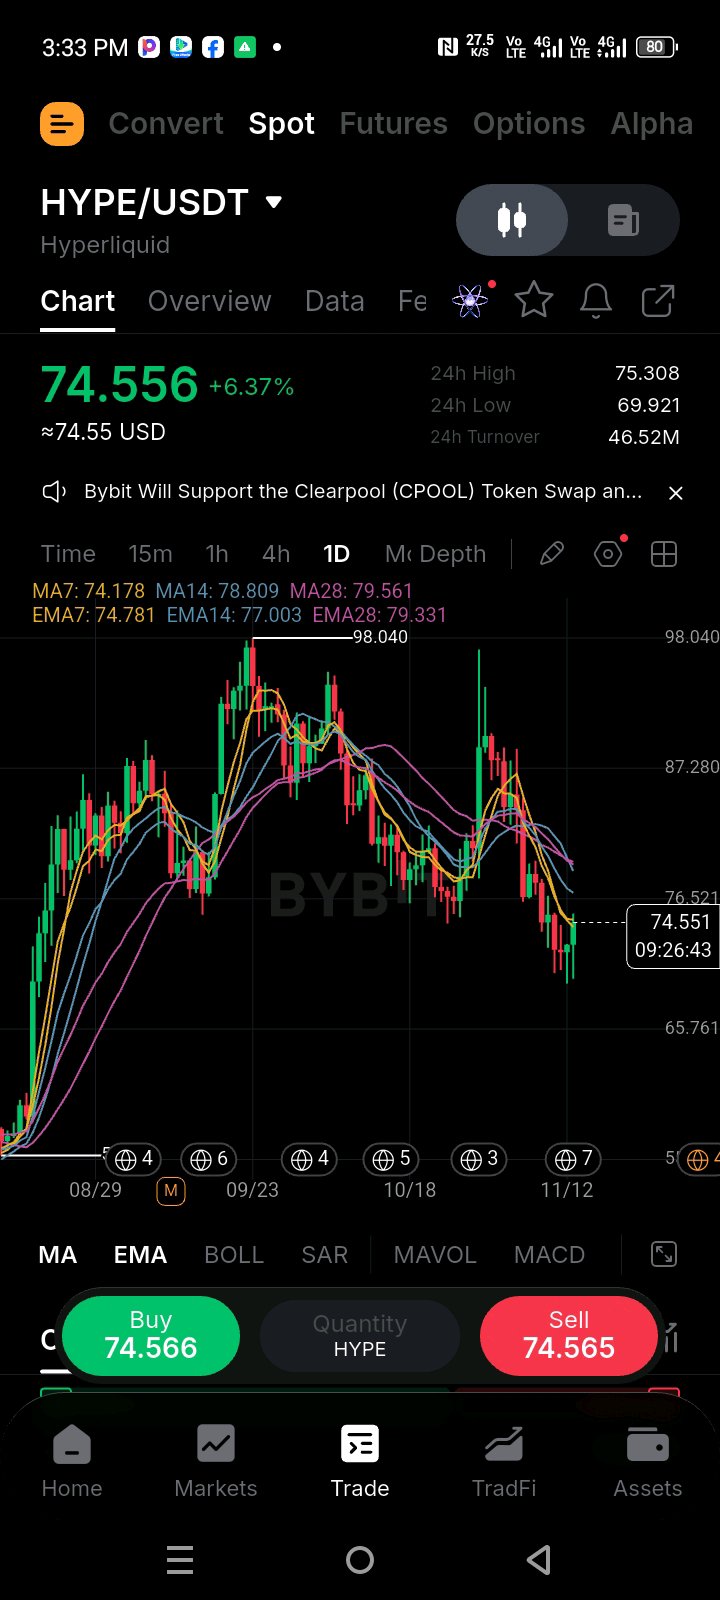
$HYPEUSDT carved out a sharp correction from the 98.04 high down to a local flush near 69.92, but the current daily session is showing a strong reactive recovery of +6.37% up to 74.556. What stands out on the daily chart is how price is interacting with the moving averages—climbing back above the MA7 (74.17), while the MA14 (78.80) and MA28 (79.56) sit overhead as the next major dynamic resistance cluster. My read here is that the asset is attempting a relief bounce and structural stabilization after a heavy cooling-off phase, but it needs to clear the overhead moving average cloud before we can call for a full trend continuation. Key Levels: Resistance: $78.80 (MA14 / Dynamic Supply), $98.04 (Macro High) Support: $74.17 (MA7 Pivot), $69.90 (Local Demand Low) My Trade Plan: Bias: LONG (Conditional Relief Play) Entry: $73.50 – $74.50 (On a minor intraday pullback testing the MA7 support) Confirmation: I want to see a sustained hold above the 74.00 handle with stable volume backing the intraday retests before scaling in. Invalidation: $69.50 (A clean daily break below the local swing low invalidates the recovery thesis). TP1: $78.80 (MA14 Resistance) TP2: $84.50 (Mid-Range Supply Node) R:R: ~1:2.3 based on the stated levels. Why I'm taking this setup: Downside selling pressure has visibly dried up near the 70 psychological and structural floor, and a mean-reversion move back toward the daily moving average cluster offers a clean risk-to-reward window for swing positioning. What would change my mind? If volume completely vanishes and price slips back below 72.00 with impulsive red candles, the buyers have failed to defend the pivot, and I am stepping aside. Are you fading this relief bounce into the moving average overhead, or positioning for a sustained rotation back toward the 80 handle? #ByXIMPACT #WSOT2026
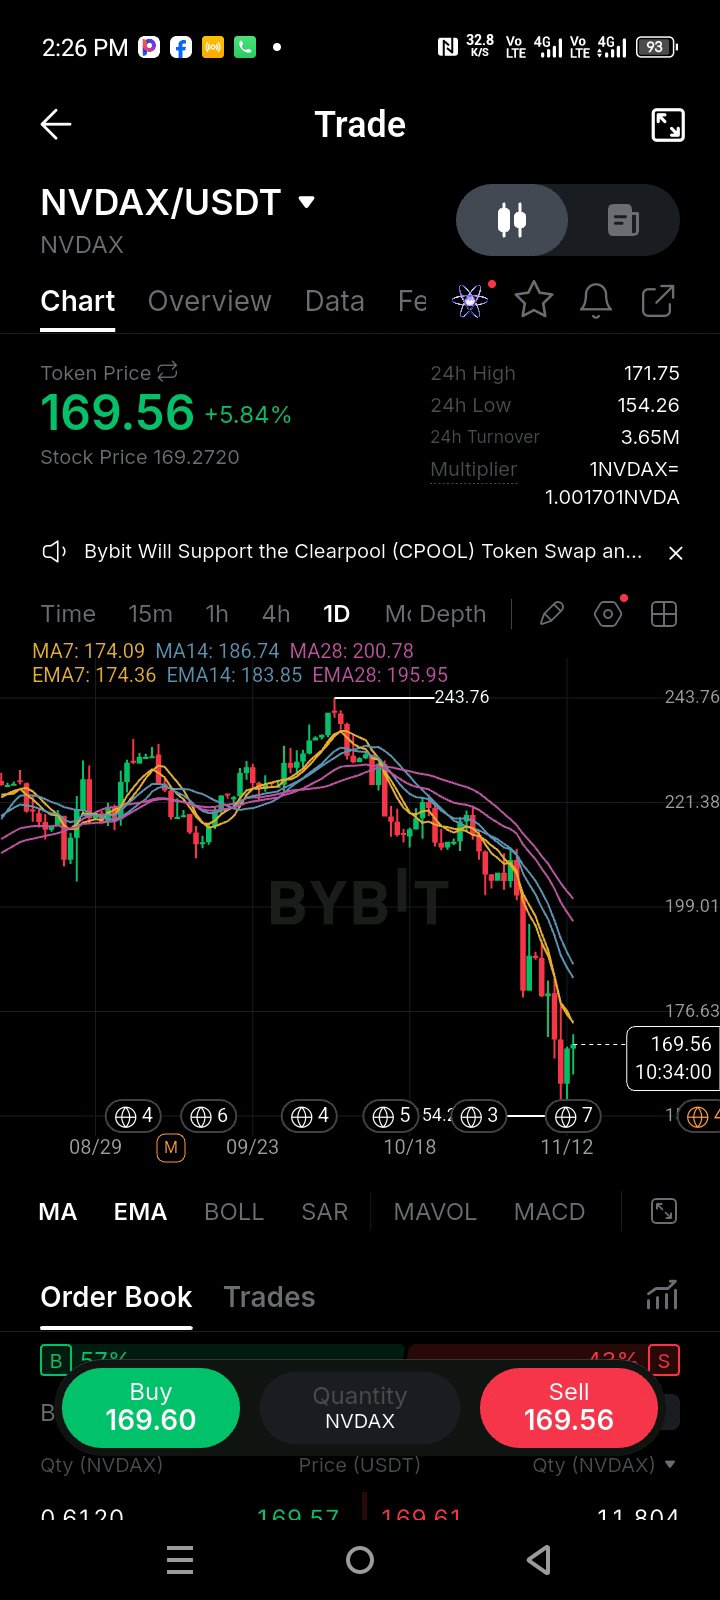
$NVDAXUSDT has been in absolute freefall since the 243 peak, but the daily chart just printed something interesting. What caught my attention is the massive lower wick on the most recent daily candle, bouncing hard from the 154 low to reclaim 169.56. The price got completely destroyed below the 28 EMA (currently way up at 195), but the order book is now showing 57% buy pressure. My read here is that we are seeing a violent short-term capitulation followed by aggressive dip buying. The structure is still technically bearish because we are miles below the moving averages, but that long wick suggests sellers are exhausted for now. I’m not trying to short the bottom of a bloodbath, and I’m not blindly longing a falling knife. Key Levels: Resistance: 174.09 (7 MA), 183.85 (14 EMA) Support: 154.26 (the capitulation wick low) My Trade Plan: Bias: LONG (Counter-trend scalp / Conditional) Entry: $165.00 – $168.00 (On a minor pullback to build a higher low) Confirmation: I need to see the 4H chart print a higher low above 160, followed by a bullish engulfing candle. I want to see the 57% buy pressure hold up and push price back above the 174 local resistance. Invalidation: $154.00 (If we lose the wick low, the capitulation failed and the bleeding continues). TP1: $183.85 (14 EMA retest) TP2: $195.00 (28 EMA) R:R: ~1:2.8 based on the stated levels. Why I'm taking this setup: When a heavy sell-off prints a massive rejection wick into a local low, it often marks a short-term bottom. The risk/reward here is excellent because our invalidation is so tight (just below the wick). If buyers are truly stepping in, they will defend this new base. What would change my mind? If price chops around and forms a weak flag below 165, that’s a bearish continuation pattern. I’d step aside. If we lose 154 with high volume, the bottom is in the rearview mirror and I’ll wait for a completely new structure. Are you playing the bounce off the 154 wick, or waiting for the trend to actually flip above 195? #ByXIMPACT #WSOT2026
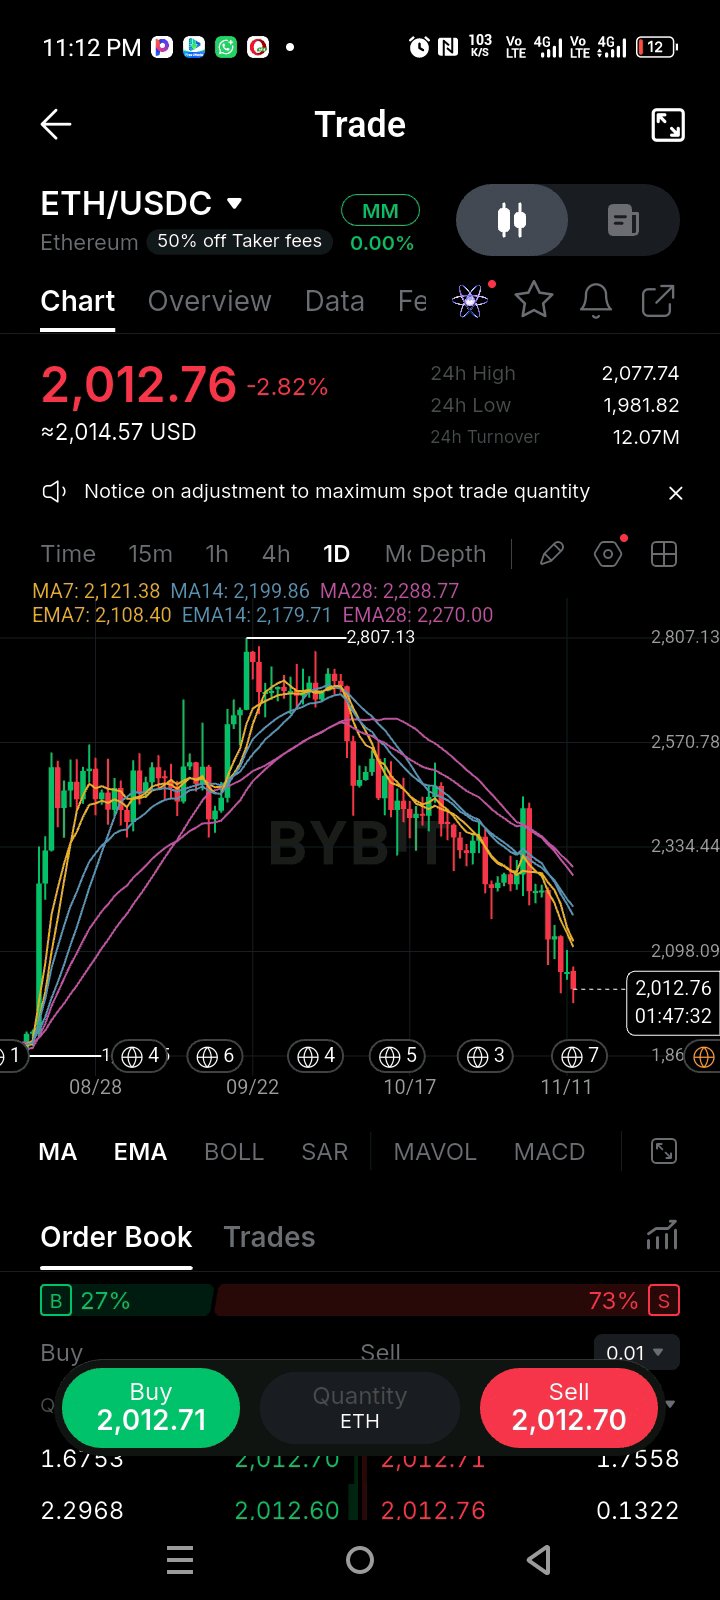
$ETHUSDT ha estado en una fuerte tendencia bajista desde el pico de 2,807, y la gráfica diaria finalmente está probando un piso psicológico importante. Lo que me llamó la atención es la acción del precio actual: estamos sangrando directamente a través de los 2,012, sin nada de soporte de las medias móviles. Las EMA de 7 y 14 están inclinándose agresivamente hacia abajo en 2,121 y 2,199, actuando como un techo pesado. Mi lectura aquí es que la estructura del mercado es profundamente bajista. Esto no es un retroceso saludable; es una venta masiva sostenida. El libro de órdenes lo confirma con un 73% de presión vendedora dominando la liquidez visible. No estoy tratando de atrapar un cuchillo cayendo aquí hasta que veamos que se forma una base clara. Niveles Clave: Resistencia: 2,121 (EMA 7), 2,270 (EMA 28) Soporte: 1,981 (mínimo de 24h), 1,860 (siguiente zona importante) Mi Plan de Trading: Sesgo: CORTO (Condicional) / Esperar recuperación para Largo Entrada (Corto): $2,080 – $2,120 (En un rebote de alivio hacia la EMA 7) Confirmación: Quiero ver una mecha de rechazo débil o una vela envolvente bajista en la gráfica de 4H mientras el precio prueba esta zona. Si el precio recupera los 2,200 con volumen, me hago a un lado. Invalidación: $2,270 (Una ruptura diaria limpia por encima de la EMA 28 invalida la continuación bajista). TP1: $1,981 (Retest del mínimo reciente) TP2: $1,860 (Siguiente zona de liquidez importante) R:R: ~1:2.3 basado en los niveles establecidos. Por qué estoy tomando esta configuración: Cuando un activo importante como ETH rompe por debajo de un nivel psicológico como los 2k, el primer rebote generalmente se vende. La zona de 2,100 es donde se rompió el soporte anterior, así que espero que los vendedores lo defiendan. Vender el retest ofrece una invalidación ajustada con un camino claro hacia abajo. ¿Qué cambiaría mi opinión? Si el precio barre los 1,981 e inmediatamente imprime una vela envolvente alcista masiva con alto volumen, eso es una toma de liquidez. Cerraría el corto y esperaría a que se forme un mínimo más alto antes de considerar un largo. Hasta entonces, la tendencia es a la baja. ¿Vas a ponerte en corto en este rebote hacia los 2.1k, o esperas a ver si los 1,981 aguantan para una entrada al contado? #ByXIMPACT #WSOT2026
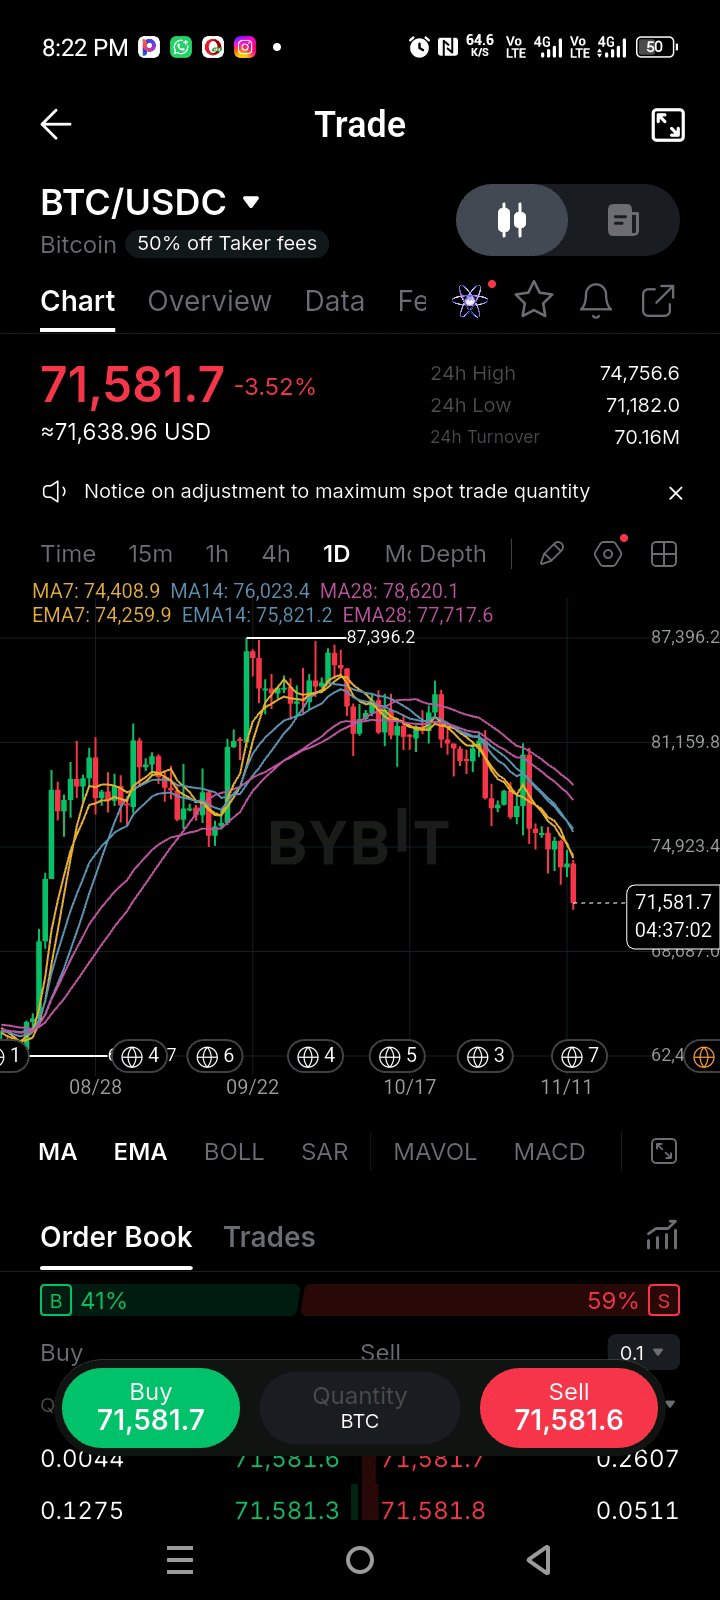
$BTCUSDT ha estado en una caída brutal desde el pico de 87,396, y el gráfico diario finalmente está probando un piso psicológico importante. Lo que me llamó la atención es cómo está reaccionando el precio en este momento: estamos situados en 71,581, totalmente rechazados por las medias móviles de corto plazo. Las EMA de 7 y 14 se están cruzando a la baja con fuerza en 74.4k y 75.9k, actuando como un techo pesado. Mi lectura aquí es que la estructura macro está gravemente dañada. Esta no es una caída superficial; el mercado está buscando una nueva base. El libro de órdenes muestra un 59% de presión vendedora, lo que significa que los vendedores siguen dominando. Definitivamente no voy a intentar agarrar este cuchillo cayendo hasta que veamos un cambio estructural claro. Niveles Clave: Resistencia: 74,409 (EMA 7), 77,717 (EMA 28) Soporte: 71,182 (mínimo de 24h), 68,000 (psicológico / siguiente zona importante) Mi Plan de Trading: Sesgo: SHORT (Condicional) / Esperar a recuperar en largo Entrada (Short): $73,500 – $74,400 (En un rebote de alivio hacia la EMA de 7) Confirmación: Quiero ver una mecha de rechazo débil o una vela envolvente bajista en el gráfico de 4H mientras el precio prueba esta zona. Si el precio recupera los 75k con volumen, me hago a un lado. Invalidación: $77,700 (Una ruptura diaria clara por encima de la EMA de 28 invalida la continuación bajista). TP1: $71,182 (Retesteo del mínimo reciente) TP2: $68,000 (Siguiente zona de liquidez importante) R:R: ~1:2.5 basado en los niveles establecidos. Por qué tomo esta configuración: Cuando un activo importante como BTC rompe por debajo de todas las medias móviles diarias principales después de un máximo, el primer rebote generalmente es vendido. La zona de 74.4k es donde el soporte anterior se rompió, así que espero que los vendedores la defiendan. Vender el retesteo ofrece una invalidación ajustada con un camino claro a la baja. ¿Qué cambiaría mi opinión? Si el precio barre los 71,182 e imprime inmediatamente una vela envolvente alcista masiva con alto volumen, eso es una toma de liquidez. Cerraría el short y esperaría a que se forme un mínimo más alto antes de considerar un largo. Hasta entonces, la tendencia es bajista. ¿Estás operando en corto este rebote hacia los 74k, o esperando a ver si los 71k aguantan para una entrada al contado? #ByXIMPACT #WSOT2026
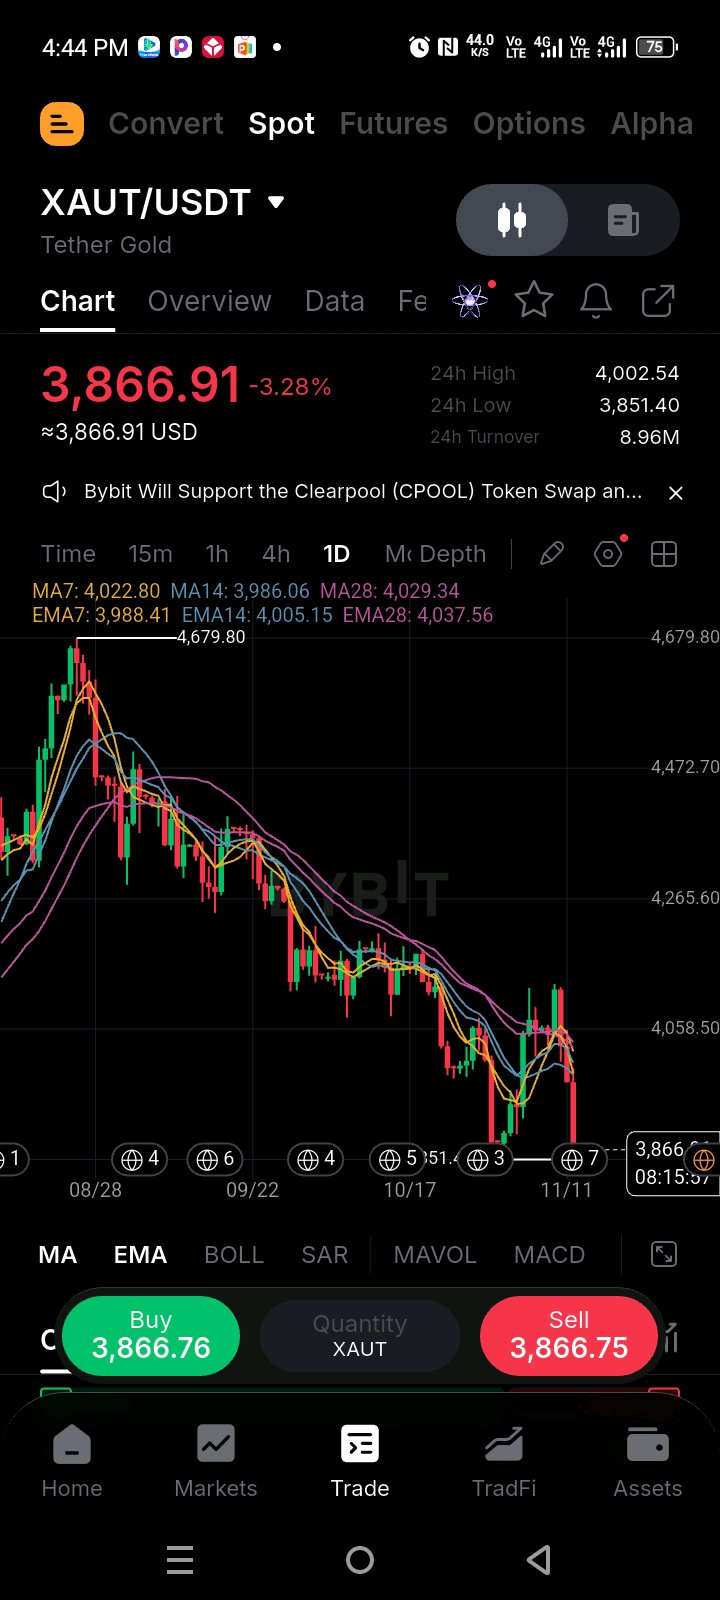
$XAUTUSDT has been in a relentless downtrend since the 4,679 peak, and the daily chart is showing zero signs of a real reversal. What caught my attention is the recent price action: we tried to bounce off the 3,851 lows, but the MA7 and MA14 are crossing down sharply and pushing price back toward the 3,866 level. The 28 EMA is way up at 4,037, acting as a heavy ceiling. My read here is that this is a continuation setup. The recent green candles were just a relief bounce, not a trend change. The structure remains deeply bearish while we are trading below 4,029, and I’m definitely not trying to catch a falling knife on a heavy asset like gold. Key Levels: Resistance: 4,029 (28 EMA), 4,058 (local swing high) Support: 3,851 (recent daily low) My Trade Plan: Bias: SHORT (Conditional) Entry: $3,950 – $4,000 (On a retest of the broken moving averages) Confirmation: I want to see a bearish rejection wick or a lower-high formation on the 4H chart as price tests this zone. I’d also accept a breakdown and retest of 3,850 if the bounce loses momentum. Invalidation: $4,060 (A clean daily break above this level invalidates the bearish thesis). TP1: $3,851 TP2: $3,700 R:R: ~1:2.2 based on the stated levels. Why I'm taking this setup: The trend is clearly down. Pullbacks into the descending moving averages in a strong downtrend usually provide favorable risk/reward. The 3,950–4,000 zone is where the previous support broke down, so I expect sellers to defend it. What would change my mind? If price reclaims 4,060 with high volume and the MA7 crosses back above the MA14, I’m stepping aside. That would signal the sellers are exhausted, and I’d wait for a higher low to form before looking for longs. Are you shorting this bounce into the MAs, or waiting to see if 3,851 holds for a spot entry? #ByXIMPACT
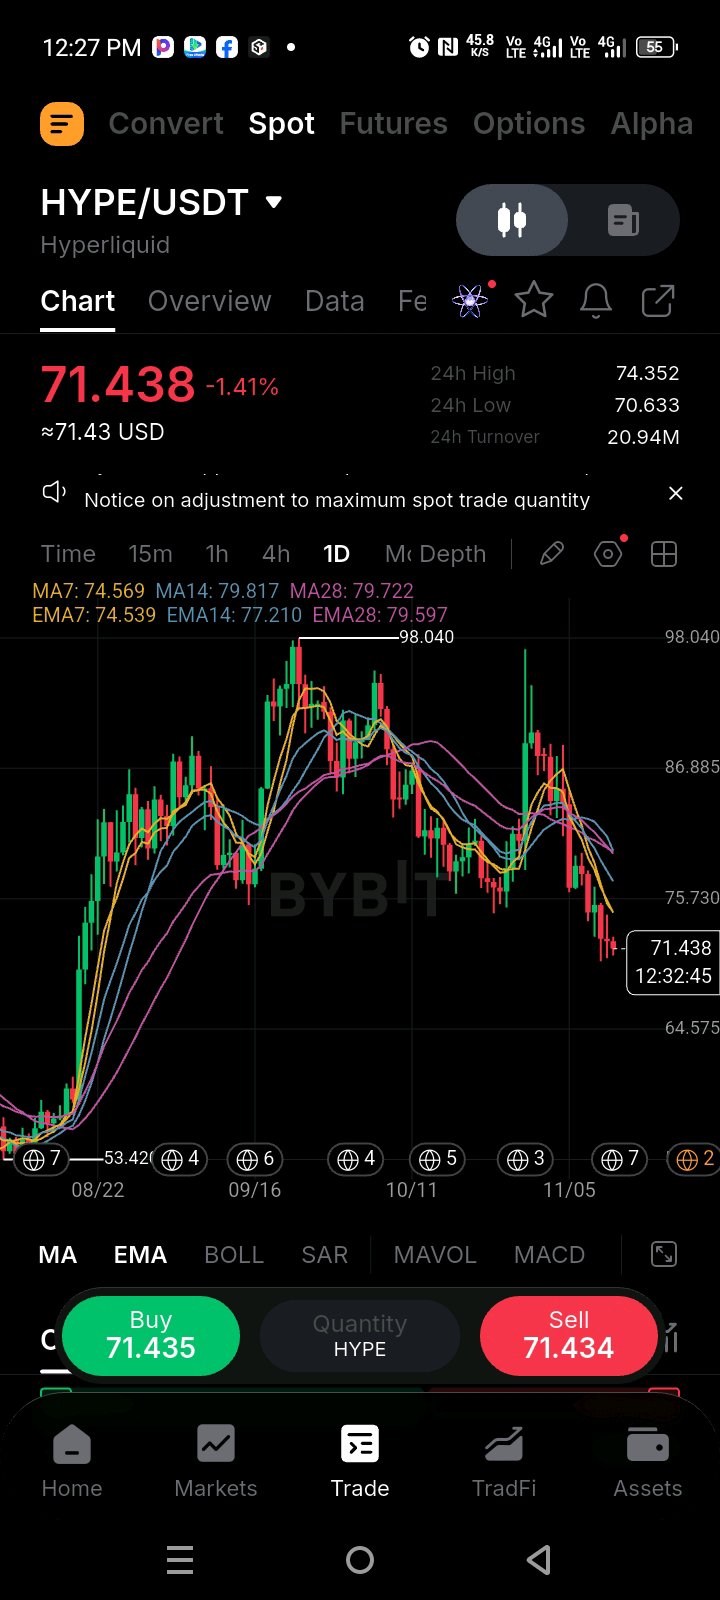
$HYPEUSDT tuvo una subida masiva hasta 98, pero las velas diarias recientes muestran una distribución fuerte. Lo que me llamó la atención es la ruptura más reciente: el precio atravesó directamente las EMA diarias y actualmente se encuentra en 71.43. Las MA7 y MA14 están cruzando hacia abajo con fuerza, y la EMA 28 en 79.59 ahora actúa como una fuerte resistencia. Mi lectura aquí es que la tendencia a corto plazo se ha vuelto bajista. Esto ya no es un retroceso menor; el mercado está buscando una nueva base. La estructura sigue siendo débil mientras operemos por debajo de 75.70, y definitivamente no voy a intentar atrapar este cuchillo cayendo. Niveles Clave: Resistencia: 75.73 (soporte anterior convertido en resistencia), 79.59 (EMA 28) Soporte: 70.63 (mínimo reciente) Mi Plan de Trading: Sesgo: SHORT (Condicional) / Esperar recuperación para Long Entrada (Short): $73.50 – $75.00 (En un rebote de gato muerto hacia el soporte roto) Confirmación: Quiero ver una mecha de rechazo débil o una vela envolvente bajista en el gráfico de 4H mientras el precio prueba esta zona. Si el precio recupera 76 con volumen, me hago a un lado. Invalidación: $79.50 (Una ruptura diaria clara por encima de la EMA 28 invalida la continuación bajista). TP1: $70.63 (Retesteo del mínimo reciente) TP2: $65.00 (Siguiente zona de liquidez importante) R:R: ~1:2.3 basado en los niveles establecidos. Por qué estoy tomando esta configuración: Cuando un activo que ha subido mucho como HYPE rompe por debajo de las medias móviles diarias importantes después de un techo parabólico, el primer rebote generalmente se vende. La zona de 75.70 es un nivel clásico de cambio (antiguo soporte convirtiéndose en nueva resistencia). Vender el retesteo ofrece una invalidación ajustada con un camino claro hacia los mínimos recientes. ¿Qué cambiaría mi opinión? Si el precio barre los 70.63 e imprime inmediatamente una vela envolvente alcista masiva con alto volumen, eso es una toma de liquidez. Cerraría el short y esperaría a que se forme un mínimo más alto antes de considerar un long. Hasta entonces, la tendencia es bajista. ¿Vas a poner en corto este rebote hacia los 75, o esperarás a ver si los 70.63 aguantan para una entrada en spot? #ByXIMPACT #WSOT2026
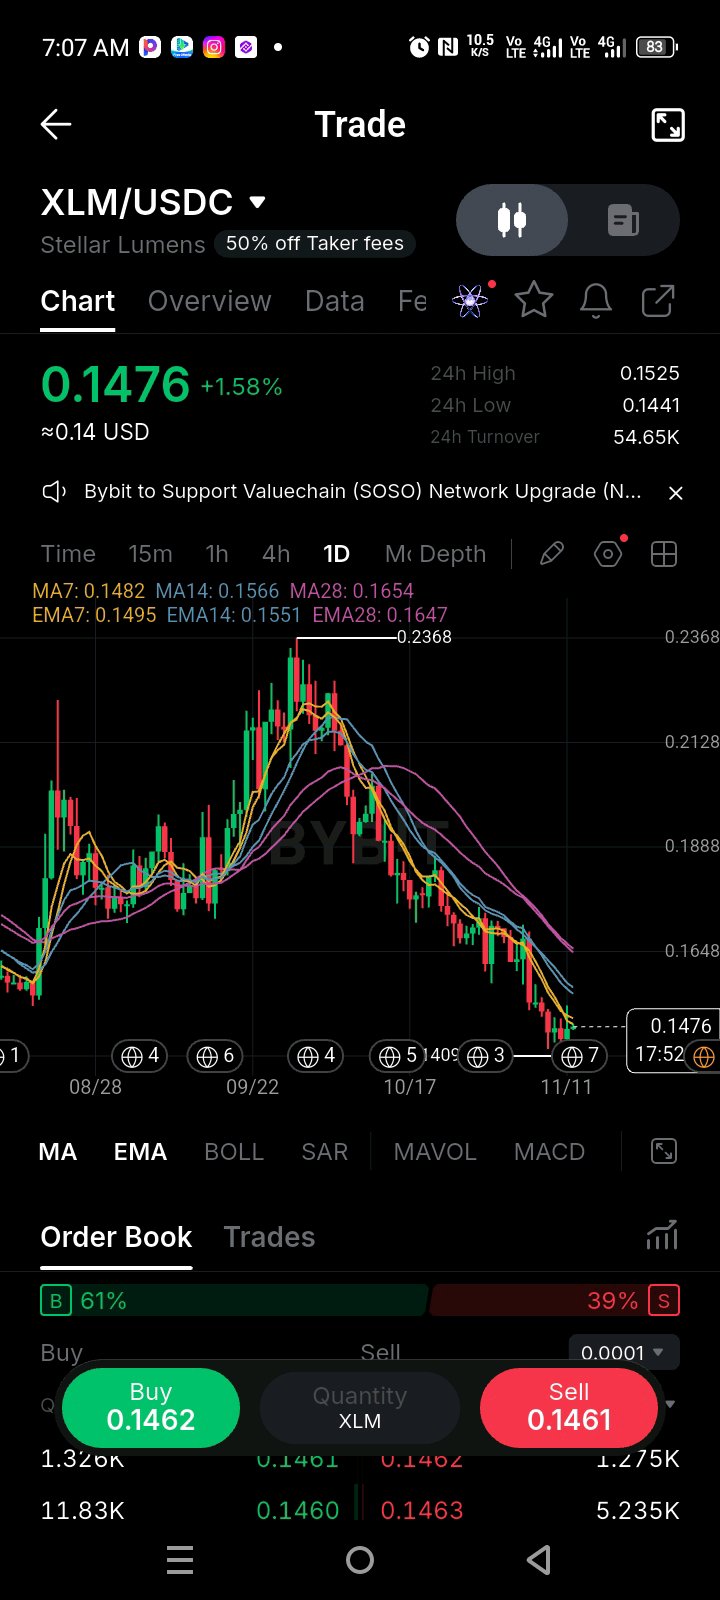
$XLMUSDT is at 0.1476 (+1.58%), about 38% below the 0.2368 peak. Price is 10% under the EMA28 (0.1647) and about 5% under the EMA14 (0.1551), and the gap between the averages has been widening for weeks. That means the trend is still firmly down, and today’s bounce is only a small move inside it. What I’m watching is the EMA7 (0.1495) just above. Price is below it, and so is the MA7 (0.1482). Until the daily closes above that level, I treat every green candle as a bounce, not a reversal. Key Levels: Resistance: 0.1495 (EMA7), 0.1525 (24h high), 0.1551 (EMA14), 0.1647 (EMA28) Support: 0.1441 (24h low), ~0.1409 (swing low) My Trade Plan: Bias: LONG (Conditional, counter-trend, small size) Confirmation: 0.1441 holds and price prints a higher low on the 4H Entry: 0.1445 – 0.1485 Invalidation: daily close below 0.1405 TP1: 0.1551 TP2: 0.1647 R:R: ~1:1.4 to TP1 and ~1:3.0 to TP2, from a 0.1465 entry Why I’m watching this setup: The stop sits just under the swing low, so the risk is small compared with the distance back to the averages. I’m trading a mean-reversion bounce, not calling the downtrend over. What would change my mind? A daily close below 0.1405 means the low has given way, and I step aside until a new base forms. If price instead closes above 0.1495, I’d reassess for a proper reclaim trade. Do you buy a bounce this far below the averages, or wait for a close above the EMA7 first? #ByXIMPACT #WSOT2026