JV™
35148Me gusta0Compartir en el chat398Aficionados15Seguir
Learn & Earn 🥂
Learn & Earn 🥂
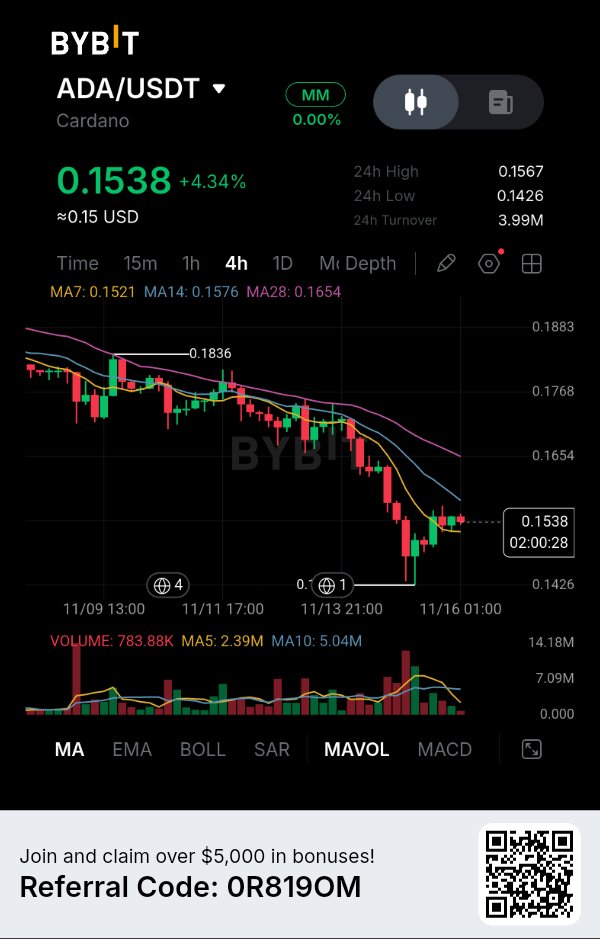
$ADAUSDT — CARDANO HAS REBOUNDED 4.34%, BUT THE REAL TEST IS WHETHER BUYERS CAN RECLAIM $0.1576. I'M NOT CONFUSING A RELIEF BOUNCE WITH A TREND REVERSAL. ADA is finally showing some buying interest after an extended decline. Price has recovered from the $0.1426 region and is now trading around $0.1538. The reaction is encouraging, but one important detail keeps me cautious: buyers have recovered the shortest moving average, yet the larger resistance structure remains overhead. THE TECHNICAL PICTURE The 4H moving averages are telling an interesting story: MA7: $0.1521 MA14: $0.1576 MA28: $0.1654 ADA has reclaimed MA7, showing short-term improvement. However, MA14 and MA28 remain above the current price. The broader structure still favors sellers until buyers demonstrate a stronger recovery. THE DETAIL I'M WATCHING The $0.1426 level is where the latest selling pressure attracted a buying response. But the recovery has one weakness I don't want to ignore. Current volume is approximately 783.88K, compared with MA5 at 2.39M and MA10 at 5.04M. Buying participation remains relatively weak compared with both volume averages. This makes the $0.1576 resistance particularly important. I want to see whether buyers can reclaim it with stronger participation or whether sellers defend it again. MY EXECUTION STRATEGY I'm watching ONE conditional SHORT opportunity. Entry zone: $0.1575–$0.1600 Confirmation: 4H bearish rejection from this region. Stop Loss: $0.1665 TP1: $0.1500 TP2: $0.1426 TP3: $0.1380 (projected extension) I'm not entering immediately after the recovery. I want price to approach resistance and show clear selling pressure before considering this setup. WHAT COULD INVALIDATE MY IDEA? A convincing 4H breakout above $0.1654 would weaken my bearish continuation thesis. If ADA establishes sustained acceptance above $0.1665, I would invalidate this short setup and reassess the market. MY PERSPECTIVE What interests me about ADA is the battle between improving short-term momentum and the still-unrecovered larger trend. Buyers have defended $0.1426, but now they need to prove they can overcome the resistance above them. I'm watching $0.1576 as the next important decision point. I would rather miss an entry than chase a recovery without confirmation. Would you trust this ADA bounce and look for a breakout above $0.1576, or wait for sellers to confirm another rejection? $ADAUSDT #ByXIMPACT

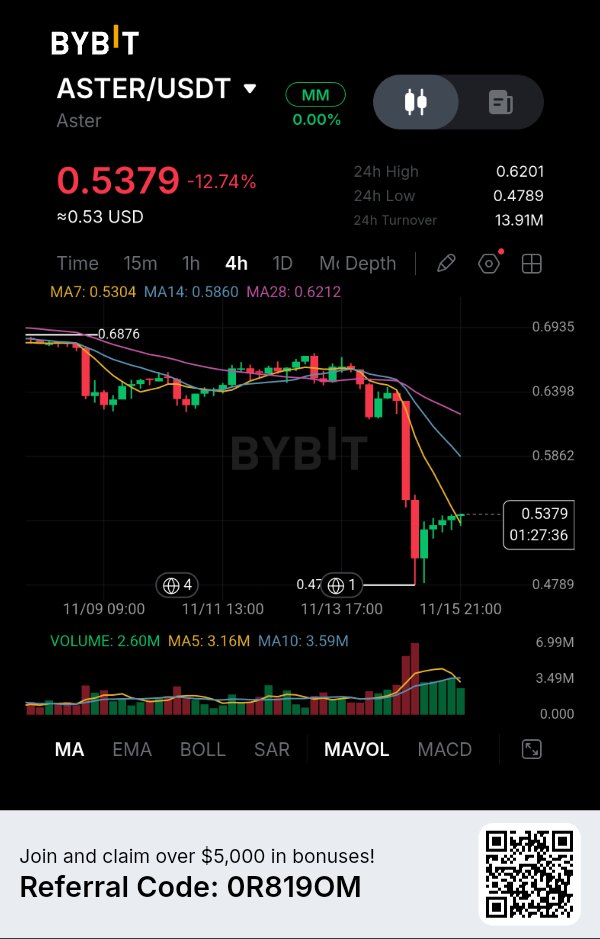
$ASTER — One brutal sell-off has changed the entire market structure, but the reaction from $0.4789 deserves closer attention. What interests me about ASTER right now is the difference between the speed of the decline and the strength of the recovery attempt. Sellers aggressively pushed price out of its previous consolidation, wiping out several support levels in a relatively short move. Now buyers are attempting to stabilize the damage, but I am not convinced they have enough strength to reverse the trend. ASTER is trading around $0.5379, down 12.74%, on the 4-hour chart. The important detail is that price has bounced from $0.4789 but remains below the two major moving averages that could determine its next direction. The real battle is happening above the current price. The moving-average structure is still unfavorable for buyers. MA7 sits at $0.5304, MA14 at $0.5860 and MA28 at $0.6212. Price has recovered above the short-term average, but the distance from MA14 and MA28 shows how much resistance remains overhead. The Recovery Question: The $0.5860 area is my first major point of interest. If buyers manage to reclaim it, the recovery could extend toward $0.6212. However, failure to establish acceptance above this region could turn the current bounce into another lower high. The Volume Warning: Current displayed volume is 2.60M, compared with MA5 at 3.16M and MA10 at 3.59M. The initial sell-off attracted substantial activity, but the recovery needs stronger participation before I consider it sustainable. The Level I Am Watching: $0.4789 is the recent swing low and the most important downside reference. If sellers regain control and price breaks this level, another downward extension becomes possible. My Trading Strategy — Looking for a SHORT Opportunity I am not interested in chasing ASTER after such an aggressive decline. My preferred approach is to wait for a recovery into the moving-average resistance zone and look for evidence that sellers are returning. Direction: SHORT Entry Zone: $0.5860–$0.6212 Confirmation: 4H bearish rejection from this zone. Stop Loss: $0.6450 TP1: $0.5200 TP2: $0.5000 TP3: $0.4789 These are conditional projections, not an instruction to enter immediately. I want an actual rejection before considering execution. What Would Change My Mind? A sustained reclaim of $0.6212 would weaken the bearish continuation thesis. A convincing move above $0.6450 would invalidate this proposed short setup. I am particularly interested in whether ASTER can recover its lost moving averages or whether every attempt to move higher becomes an opportunity for sellers. The market has already demonstrated how quickly ASTER can move when selling pressure accelerates. I don't want to underestimate that volatility. My focus is not on predicting the next red candle. It's on identifying where buyers might run out of strength and sellers regain control. Is ASTER preparing for a meaningful recovery, or are we watching a temporary pause before another downward move? $ASTERUSDT #ByXIMPACT

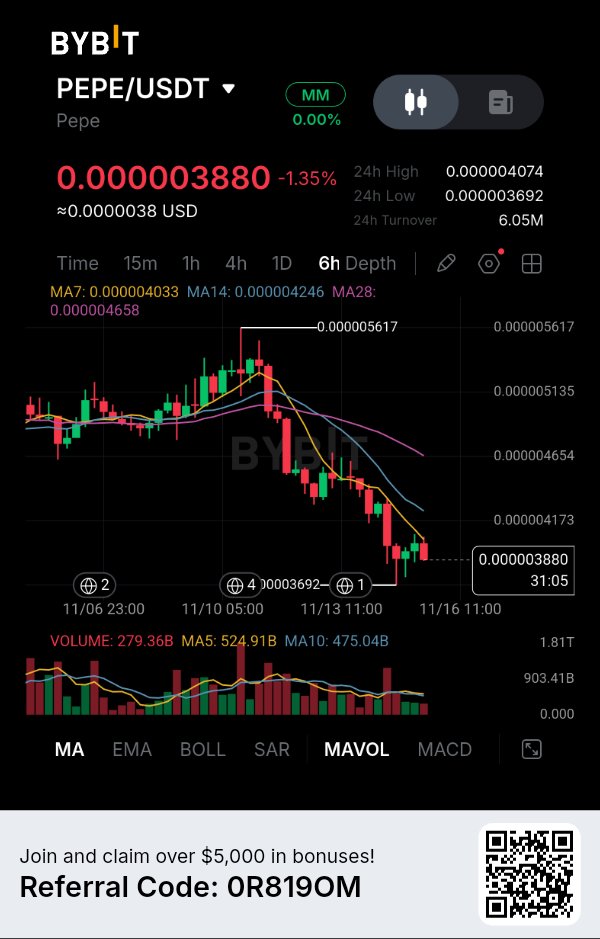
$PEPEUSDT — THE RECOVERY IS STRUGGLING TO GAIN TRACTION. I'M WATCHING THE $0.00000403–$0.00000425 REGION FOR A POSSIBLE SELLER RE-ENTRY. PEPE has experienced a significant correction after reaching approximately $0.000005617. Since then, the 6H chart has continued to print lower highs, with buyers struggling to rebuild the previous upward structure. Currently trading around $0.000003880, PEPE is showing a small stabilization attempt near its recent lows. But there's something important here: price is still trading below all three moving averages, meaning buyers have not yet reclaimed control. THE TECHNICAL PICTURE The 6H moving averages tell an interesting story: MA7: $0.000004033 MA14: $0.000004246 MA28: $0.000004658 All three averages remain above the current price and are arranged in bearish order. The MA7 is the first recovery obstacle, while MA14 creates another resistance level. This gives me a clear area to monitor rather than guessing where the next move begins. THE DETAIL I'M WATCHING PEPE recently approached $0.000003692 before attempting to stabilize. That level is important because it represents the visible recent low and immediate support reference. However, the latest volume reading is approximately 279.36B, compared with MA5 at 524.91B and MA10 at 475.04B. Buying participation remains relatively weak compared with both volume averages. I want to see whether buyers can recover toward the moving averages or whether sellers use that opportunity to regain control. MY EXECUTION STRATEGY I'm focusing on ONE conditional SHORT setup. Entry zone: $0.00000403–$0.00000425 Confirmation: 6H bearish rejection from the resistance region. Stop Loss: $0.00000442 TP1: $0.00000380 TP2: $0.000003692 TP3: $0.000003500 (projected extension) I'm deliberately avoiding an immediate entry near support. My preference is to let PEPE recover first and then evaluate whether sellers are still defending the downward structure. WHAT COULD INVALIDATE MY IDEA? A convincing 6H recovery above $0.00000425 would weaken my bearish continuation thesis. If price establishes acceptance above $0.00000442, I would invalidate this short setup and reassess the market. MY PERSPECTIVE What interests me about PEPE right now is the difference between a temporary stabilization and a genuine trend reversal. The recent low has attracted some buying interest, but the moving averages and declining price structure still favor sellers. For me, the next important test is the $0.00000403–$0.00000425 region. I want to see how price reacts there before committing capital. No chasing, no forced entries. Would you wait for PEPE to retest $0.00000425 before considering a short, or do you think buyers can defend $0.000003692 and start a recovery? $PEPEUSDT #ByXIMPACT

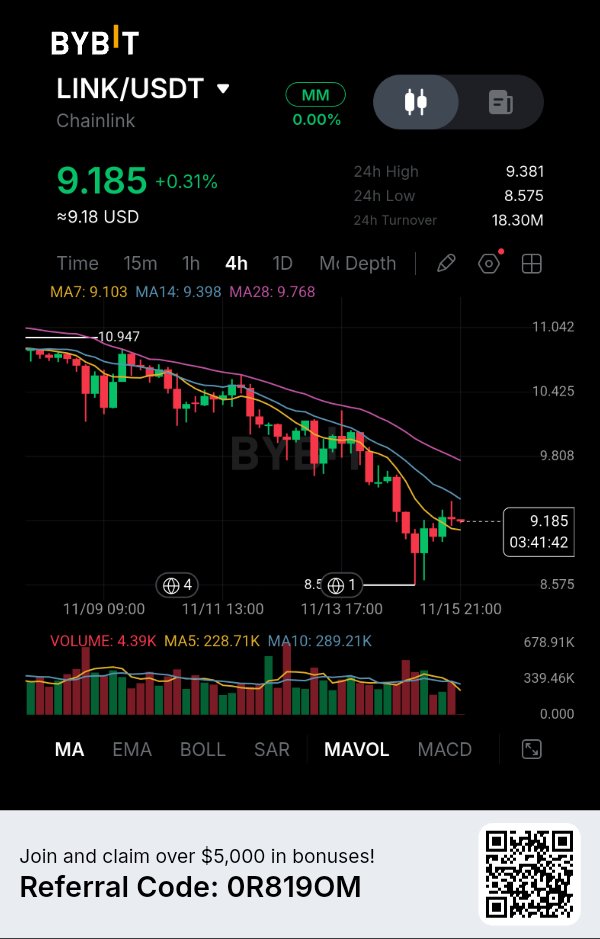
$LINK — The recovery has started, but buyers are still trapped beneath a declining resistance structure. Chainlink is showing its first signs of stabilization after an extended 4-hour decline, but I am paying more attention to what price has NOT reclaimed than to the small green recovery currently appearing on the chart. LINK is trading around $9.185 after finding buyers near $8.575. That reaction matters. Sellers were able to push price through several support areas, but the latest move suggests that buyers are finally attempting to defend the lower range. However, a bounce from support and a genuine trend reversal are two very different things. Here is what caught my attention: The Moving Average Trap: LINK has recovered above MA7 at $9.103, but MA14 at $9.398 and MA28 at $9.768 remain overhead. The averages are arranged bearishly, showing that the broader recovery still faces considerable resistance. The First Important Battle: The $9.398 level is where I want to see how buyers respond. If LINK fails to establish acceptance above MA14, another lower high could develop. Beyond that, $9.768 is the next major resistance to watch. The Volume Concern: The displayed volume is 4.39K, compared with MA5 at 228.71K and MA10 at 289.21K. The current candle is still forming, so this is not a final volume reading. Nevertheless, I want stronger participation before treating this recovery as convincing. The Critical Support: The $8.575 swing low is the level I refuse to ignore. If sellers return and price loses this area, the recent recovery could quickly disappear. My Trading Strategy — Waiting for a SHORT Opportunity I am not interested in selling LINK at $9.185 simply because the larger trend is bearish. I want price to recover into resistance first and show a clear rejection. Direction: SHORT Entry Zone: $9.40–$9.76 Confirmation: 4H bearish rejection from the resistance zone. Stop Loss: $9.95 TP1: $9.10 TP2: $8.85 TP3: $8.575 My first objective is a return toward the short-term moving average. If selling pressure increases, I will watch the $8.85 area, followed by a possible retest of the recent $8.575 low. These are conditional projections, not an active trade or guaranteed targets. What Would Change My Mind? A sustained reclaim of $9.768 would seriously weaken my bearish outlook. Strong acceptance above $9.95 would invalidate this proposed short setup. I am not dismissing the buyers' attempt to recover. In fact, the reaction from $8.575 deserves attention. But until LINK reclaims its declining moving-average structure, I see more evidence of a relief rally than a confirmed reversal. My focus is on the $9.40–$9.76 resistance region. I want sellers to prove they are still in control before committing capital. Is Chainlink building a foundation for recovery, or is this another bounce before the downtrend resumes? $LINKUSDT #ByXIMPACT

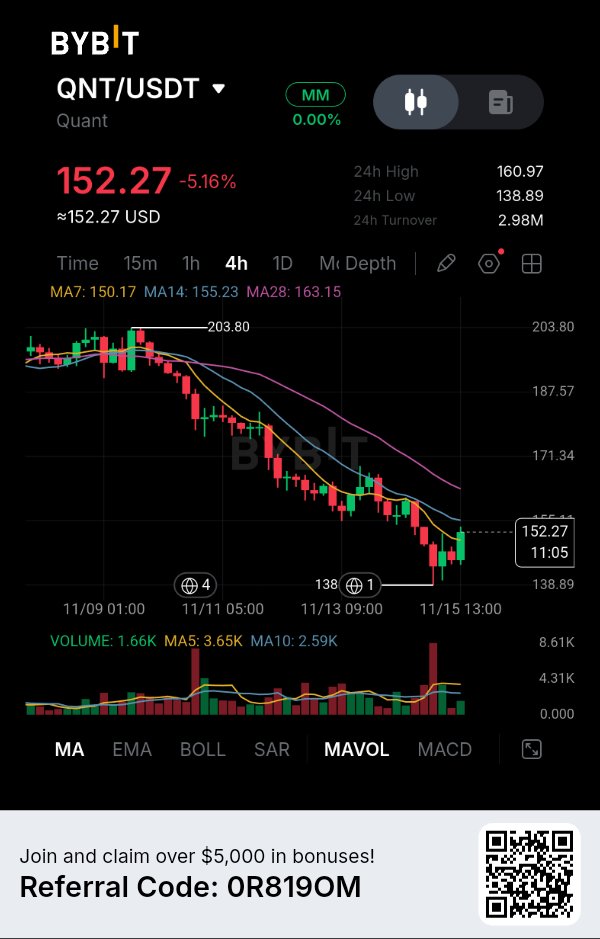
$QNTUSDT — THE BOUNCE FROM $138.89 HAS BROUGHT BUYERS BACK INTO THE PICTURE, BUT THE $155–$163 RESISTANCE ZONE IS THEIR REAL TEST. Quant has recovered from a significant sell-off, but I'm not ready to call this a trend reversal. What catches my attention is the sharp reaction from $138.89. Buyers have pushed price back toward $152.27, yet the broader 4H structure remains bearish. The important question now is whether this recovery can reclaim the moving-average cluster or whether sellers will use the bounce to re-enter. THE TECHNICAL PICTURE The moving averages show where the market stands: * MA7: $150.17 * MA14: $155.23 * MA28: $163.15 Price has recovered above MA7, which is an encouraging short-term development. However, MA14 and MA28 remain overhead. The broader structure still shows lower highs and lower lows. The $155–$163 region is therefore an important resistance area. THE DETAIL I'M WATCHING The $138.89 level is the key reference from the latest decline. Buyers defended this area and produced a noticeable recovery, but volume hasn't confirmed a powerful reversal yet. Current volume is approximately 1.66K, compared with MA5 at 3.65K and MA10 at 2.59K. That tells me the latest recovery is happening with relatively weak participation. I want to see whether buyers can reclaim $155.23 with stronger volume before changing my outlook. MY EXECUTION STRATEGY I'm focusing on ONE conditional SHORT opportunity. Entry zone: $155.20–$163.15 Confirmation: 4H bearish rejection from this resistance region. Stop Loss: $166.50 TP1: $145.00 TP2: $138.89 TP3: $132.00 (projected extension) I prefer waiting for a recovery into resistance rather than chasing the current bounce. WHAT COULD INVALIDATE MY IDEA? A convincing 4H breakout above $163.15 would weaken my bearish continuation thesis. If buyers reclaim $166.50 and establish sustained upward momentum, I would abandon this short setup and reassess the structure. MY PERSPECTIVE QNT is approaching an interesting decision point. The reaction from $138.89 shows that buyers are still willing to defend lower prices, but the larger trend hasn't changed yet. For me, the next important battle is around $155–$163. If sellers defend this region, another move toward the recent low becomes possible. I'm not interested in chasing candles. I want confirmation, controlled risk and a setup with a clear invalidation level. Would you trust this QNT recovery and look for a breakout above $163, or wait for a rejection near $155 before considering a short? $QNTUSDT #ByXIMPACT

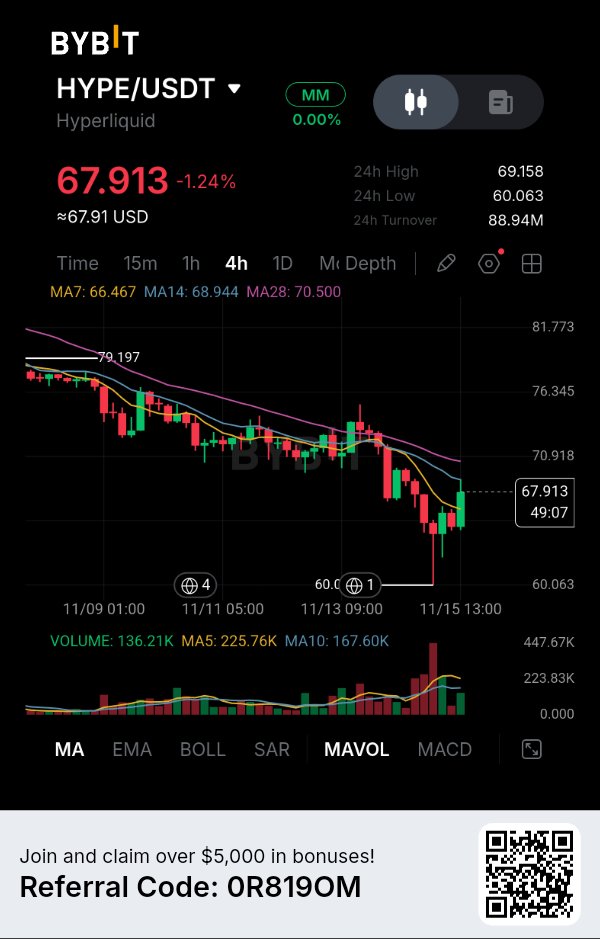
$HYPE — The rebound from $60 is gaining attention, but sellers haven't surrendered control of the bigger trend. What interests me most about HYPE right now isn't the latest green candle. It's the reaction around $60.063. After a prolonged decline from the $79.197 region, buyers finally stepped in aggressively, producing a recovery toward $67.913. But there is an important distinction between defending a low and reversing a trend. HYPE has demonstrated the first. It still needs to prove the second. Here is what I am watching on the 4H chart: The Trend Structure: HYPE is trading below MA14 at $68.944 and MA28 at $70.500. Although price has recovered above MA7 at $66.467, the broader moving-average structure remains bearish. Buyers need to reclaim the higher averages before I consider this a meaningful recovery. The Resistance Battle: The $68.944–$70.500 region is becoming an important decision zone. If price rallies into this area and fails to sustain the move, sellers could establish another lower high. The Volume Signal: Current volume is 136.21K, compared with MA5 at 225.76K and MA10 at 167.60K. The rebound is encouraging, but participation remains below both volume averages. I want to see stronger buying activity before trusting the recovery. The Critical Support: The $60.063 low remains the most important downside reference. Losing this level could expose HYPE to another wave of selling pressure. My Trading Strategy — Waiting for a Short Setup I am not interested in shorting directly into a recovery candle. I want price to approach the moving-average resistance cluster and show a clear rejection. Direction: SHORT Entry Zone: $68.90–$70.50 Confirmation: 4H bearish rejection from the resistance zone. Stop Loss: $71.80 TP1: $65.00 TP2: $62.50 TP3: $60.063 These are conditional levels, not an active entry. The setup requires a confirmed rejection before execution. What Would Change My Mind? A sustained reclaim of $70.50 would weaken my bearish outlook. A stronger recovery above $71.80 would invalidate this proposed short setup. I am paying close attention to how HYPE behaves during its next encounter with the EMA resistance cluster. If buyers cannot reclaim those levels, this recovery could become another opportunity for sellers. The $60.063 defense has given HYPE some breathing room, but the real test is still ahead. I would rather trade a confirmed rejection than chase a prediction. Is HYPE building the foundation for a genuine reversal, or are buyers simply preparing the next lower high? $HYPEUSDT #ByXIMPACT

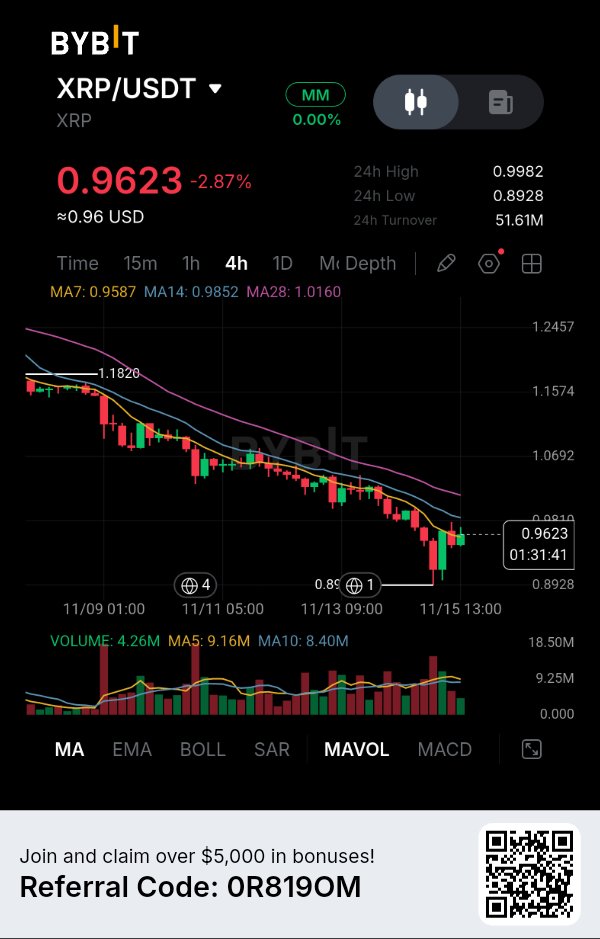
$XRP — The bounce is bringing buyers back, but the bigger trend is still fighting against them. What caught my attention on this 4H chart is the reaction around $0.8928. After an extended sequence of lower highs and lower lows, XRP finally attracted buyers near its recent low and pushed back toward $0.9623. But I am not treating this recovery as a confirmed reversal. The price has managed to reclaim the short-term moving average, yet two important resistance levels are still sitting directly above it. Here is where the real battle begins. The first thing I am watching is the moving-average structure. MA7 is at $0.9587, MA14 at $0.9852 and MA28 at $1.0160. XRP is trading above MA7 but remains below MA14 and MA28. That tells me something important: buyers have managed to slow the immediate decline, but they haven't repaired the broader bearish structure. The Resistance Problem: The $0.9852–$0.9982 region is the first major area I want to see tested. If XRP approaches this zone and fails to hold its recovery, sellers could establish another lower high. The Volume Question: Current volume stands at 4.26M, compared with MA5 at 9.16M and MA10 at 8.40M. The rebound is happening without volume exceeding either average. I want stronger participation before considering this recovery sustainable. The Critical Support: $0.8928 is the level that matters most on the downside. A confirmed breakdown below this recent low could open the door to another leg lower. My Trading Strategy — Looking for a SHORT Opportunity I am not interested in chasing XRP after its initial recovery. I would rather let price approach resistance and wait for sellers to reveal themselves. * Direction: SHORT * Entry Zone: $0.9850–$0.9980 * Confirmation: 4H bearish rejection from the resistance zone. * Stop Loss: $1.0250 * TP1: $0.9300 * TP2: $0.8928 * TP3: $0.8600 (estimated extension) My first objective is a return toward $0.9300. If selling pressure accelerates and the recent low gives way, $0.8600 becomes a possible deeper downside target. What Would Change My Mind? A sustained reclaim of $0.9982 would weaken the immediate bearish argument. A convincing move above the MA28 at $1.0160 would further challenge the broader downside thesis and invalidate this proposed short setup if followed by the required stop. I don't want to mistake a temporary recovery for a trend reversal. XRP has shown that buyers are willing to defend lower prices, but the next test will reveal whether they can actually reclaim control. For now, my attention remains on the $0.9852–$0.9982 resistance zone. I want to see the market confirm its next move before committing capital. Is XRP preparing for a genuine recovery, or is this simply another lower high forming inside the downtrend? $XRPUSDT #ByXIMPACT

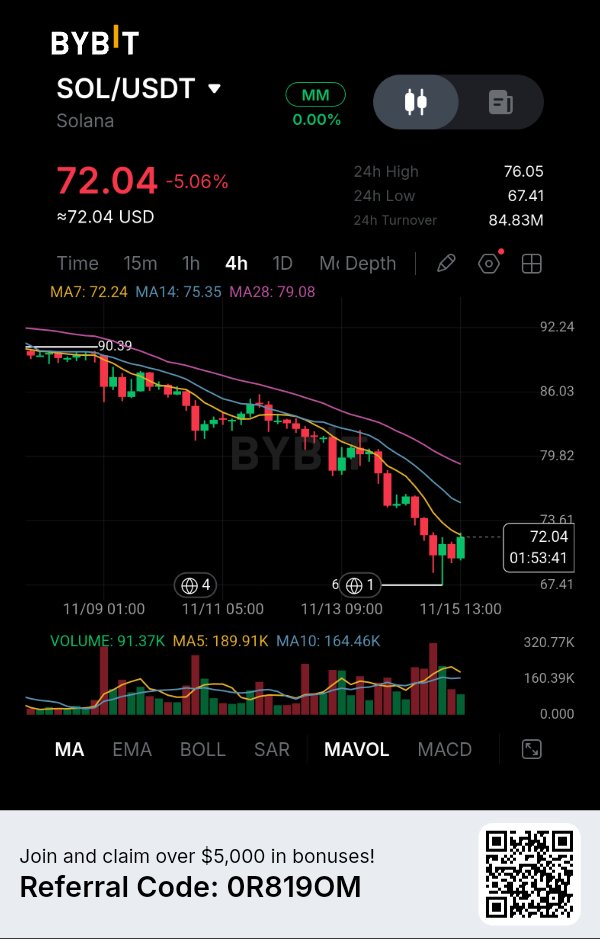
$SOLUSDT — SOLANA HAS LOST ANOTHER IMPORTANT SUPPORT AREA. I'M WATCHING THE $75–$76 RECOVERY ZONE FOR A POTENTIAL SELLER RE-ENTRY. Solana is attempting to stabilize after another significant decline, but I don't see enough evidence yet to suggest that buyers have regained control. What stands out to me is the consistency of the selling structure. SOL has continued printing lower highs and lower lows, and every meaningful recovery has struggled to overcome the overhead moving averages. SOL is currently trading around $72.04, down approximately 5.06%. The recent reaction from $67.41 deserves attention, but the bigger question is whether this bounce can develop into something stronger. THE TECHNICAL PICTURE The 4H moving averages are still showing a bearish alignment: MA7: $72.24 MA14: $75.35 MA28: $79.08 Price is trading below all three averages. The MA7 is acting as immediate resistance, while the MA14 around $75.35 represents the next important recovery obstacle. The MA28 near $79.08 shows how far SOL remains from reclaiming its previous trend structure. THE DETAIL I'M WATCHING SOL recently tested $67.41 before producing a recovery attempt. This is important because buyers have finally shown a reaction near the recent low. However, volume isn't providing strong confirmation yet. Current volume is approximately 91.37K, compared with MA5 at 189.91K and MA10 at 164.46K. The latest volume reading remains below both averages. My interpretation is that the recovery still needs stronger participation before I consider a meaningful trend reversal. MY EXECUTION STRATEGY I'm focusing on ONE conditional SHORT opportunity. Entry zone: $75.00–$76.00 Confirmation: 4H bearish rejection from this resistance region. Stop Loss: $77.20 TP1: $70.00 TP2: $67.41 TP3: $65.50 (projected extension) I don't want to chase SOL after an extended decline. I'd rather let price recover toward resistance and wait for sellers to demonstrate that they are still active. WHAT COULD INVALIDATE MY IDEA? A convincing 4H recovery above $76.05 would weaken my immediate bearish setup. If SOL reclaims $77.20 and establishes sustained buying strength, I would abandon this short idea and reassess the market. The $67.41 region also deserves attention because another successful defense could produce a stronger relief rally. MY PERSPECTIVE SOL is showing a small recovery, but the larger 4H structure hasn't changed yet. For me, the next important battle is around $75–$76. If buyers cannot reclaim that region, another move toward $67.41 becomes a possibility. I'm not interested in predicting the exact bottom or selling every green candle. I want the market to give me a confirmed rejection, a defined invalidation level and a reasonable opportunity. Would you wait for SOL to retest $75–$76 before considering a SHORT, or do you think buyers can turn the $67.41 reaction into a stronger recovery? $SOLUSDT #ByXIMPACT

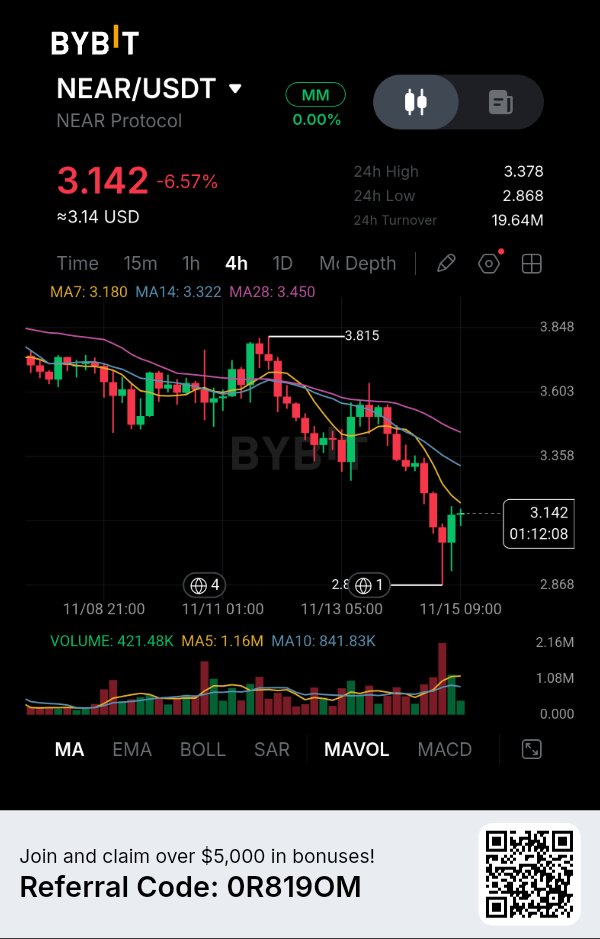
$NEAR — Buyers finally stepped in, but the recovery is approaching its first serious test. The most interesting part of NEAR's latest 4H candle isn't the rebound itself. It's where that rebound started. After an extended decline, sellers pushed price down to $2.868 before buyers aggressively stepped in. NEAR has recovered toward $3.142, but I am watching this move carefully because the broader structure still favors sellers. What makes this recovery difficult is that buyers are now trying to reclaim a market structure that has been consistently rejecting higher prices. Here is what I am seeing on the chart: The Trend: NEAR is trading below all three moving averages. MA7 is at $3.180, MA14 at $3.322 and MA28 at $3.450. Their positioning tells me that the market has not established a meaningful bullish reversal yet. The First Resistance: The $3.180 area is the immediate test. A rejection around this level could create another lower high and give sellers an opportunity to regain control. Above that, $3.322 becomes the next important recovery barrier. The Buyers' Attempt: The reaction from $2.868 is worth respecting. However, one strong recovery candle does not automatically mean the selling pressure is over. I want to see whether buyers can sustain this momentum rather than simply produce a temporary bounce. Volume Raises Another Question: Current displayed volume is 421.48K, while MA5 stands at 1.16M and MA10 at 841.83K. The recovery still needs stronger participation to convince me that demand is returning. My Trading Strategy — Looking for a SHORT Opportunity I am not interested in selling directly into the recent low. Instead, I want price to recover toward resistance and show me that buyers are struggling again. Direction: SHORT Entry Zone: $3.180–$3.220 Confirmation: 4H rejection and failure to hold above the entry zone. Stop Loss: $3.380 TP1: $3.000 TP2: $2.868 TP3: $2.750 (projected extension) My first objective is a return toward the $3.000 psychological level. If sellers manage to break the recent $2.868 low, the deeper $2.750 extension becomes a possible continuation target. What Would Change My Mind? A sustained recovery above $3.322 would weaken this bearish setup. Strong acceptance above $3.380 would invalidate my proposed short trade. I don't want to confuse a relief rally with a genuine trend reversal. NEAR has shown that buyers are willing to defend lower prices, but now they need to prove they can reclaim resistance. My focus remains on the $3.180–$3.220 reaction. I would rather miss an early move than enter without confirmation. Is this just a temporary bounce before another leg down, or are NEAR buyers preparing to take control? $NEARUSDT #ByXIMPACT

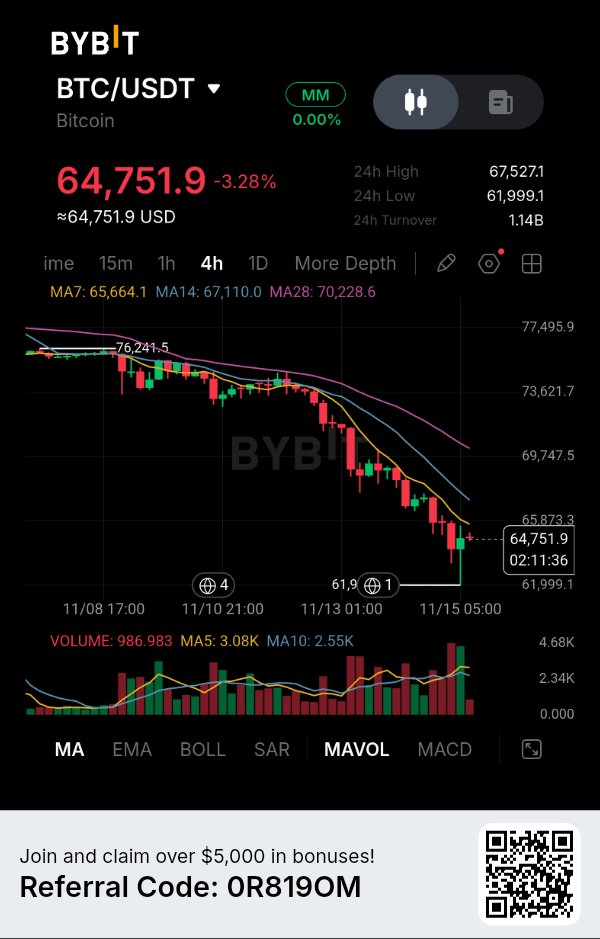
$BTCUSDT — BITCOIN HAS BOUNCED FROM $62K, BUT THE 4H STRUCTURE IS STILL BEARISH. I'M WATCHING THE NEXT RECOVERY TOWARD $65.6K–$67.1K FOR A POTENTIAL SHORT. Bitcoin is showing a reaction after a sharp decline, but I'm not ready to interpret this bounce as a trend reversal. What catches my attention is the distance between the current price and the major moving averages. Buyers have managed to defend the $62K region, yet the broader structure continues to favor sellers. BTC is currently trading around $64,751.9, down approximately 3.28%. The next recovery attempt could reveal whether buyers have enough strength to reclaim lost ground or whether sellers are simply waiting for better prices to enter again. THE TECHNICAL PICTURE The 4H moving averages are showing a clear bearish alignment: MA7: $65,664.1 MA14: $67,110.0 MA28: $70,228.6 All three averages are above the current price. More importantly, the MA7 remains below MA14, while MA28 is significantly higher. This tells me that the broader selling structure has not been reversed. The first resistance sits around $65,664, followed by the $67,110 region. THE DETAIL I'M WATCHING Bitcoin recently approached $61,999, where buyers managed to produce a noticeable reaction. That recovery deserves attention, but there is another detail I don't want to ignore. Current volume is approximately 986.98, compared with MA5 at 3.08K and MA10 at 2.55K. The latest volume reading is below both averages, suggesting that the recovery has not yet demonstrated convincing buying participation. For me, the important question is whether BTC can reclaim $65.6K–$67.1K with stronger volume. MY EXECUTION STRATEGY I'm focusing on ONE conditional SHORT setup. Entry zone: $65,650–$67,100 Confirmation: 4H bearish rejection from the resistance region. Stop Loss: $68,000 TP1: $62,000 TP2: $60,500 TP3: $58,800 (projected extension) I don't want to chase Bitcoin after an extended decline. My preferred approach is to let price recover toward resistance and look for sellers to confirm their presence before entering. WHAT COULD INVALIDATE MY IDEA? A strong 4H recovery above $67,110 would weaken my bearish continuation thesis. If BTC reclaims $68,000 and establishes sustained buying strength, I would abandon this short setup and reassess the market. The $61,999 region also remains important because buyers have already demonstrated a reaction there. MY PERSPECTIVE Bitcoin is at an interesting point. The recent bounce shows that buyers are still defending lower prices, but the moving averages suggest that sellers retain control of the larger 4H structure. I'm not trying to predict the exact bottom or chase another red candle. I want to see how BTC behaves when it approaches resistance again. That reaction could provide a much clearer trading opportunity. Would you wait for Bitcoin to reclaim $67K before considering a recovery, or use a rejection near $66K as an opportunity to enter SHORT? $BTCUSDT #ByXIMPACT


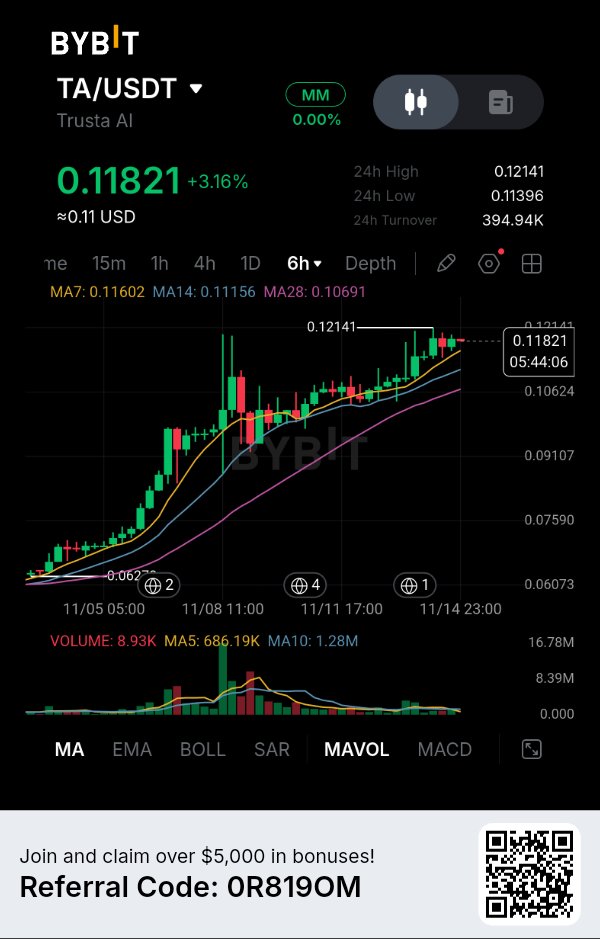
$TAUSDT — THE UPTREND IS STILL INTACT, BUT I'M NOT CHASING PRICE JUST BECAUSE BUYERS HAVE PUSHED IT ABOVE $0.118. Trusta AI is showing an impressive recovery on the 6H chart. What interests me most is not simply the 3.16% gain, but the structure behind this move. TA has climbed from approximately $0.0627 and continues to establish higher highs and higher lows. Now price is approaching its recent high at $0.12141. This is where I want to see whether buyers can generate enough strength for another breakout. THE TECHNICAL PICTURE The moving averages are showing a healthy bullish alignment: * MA7: $0.11602 * MA14: $0.11156 * MA28: $0.10691 Price is trading above all three averages, and the shorter averages remain above the longer ones. This is an encouraging trend structure. The MA7 is currently acting as the first dynamic support reference, while MA14 provides a deeper area to monitor if the market experiences a correction. THE DETAIL I'M WATCHING There is an interesting difference between the price structure and volume. TA is trading near its recent high of $0.12141, but current volume is approximately 8.93K, compared with MA5 at 686.19K and MA10 at 1.28M. The latest volume reading is relatively weak. I don't want to assume that another breakout is guaranteed without stronger participation. For me, the next move needs confirmation: either buyers defend the moving averages during a pullback or volume expands during a breakout. MY EXECUTION STRATEGY I'm favoring ONE conditional LONG setup. * Entry zone: $0.1160–$0.1170 * Confirmation: 6H bullish rejection from the entry zone. * Stop Loss: $0.1095 * TP1: $0.12141 * TP2: $0.12500 * TP3: $0.13000 (projected extension) I prefer buying a confirmed pullback rather than entering directly below resistance. WHAT COULD INVALIDATE MY IDEA? A sustained breakdown below the MA14 region around $0.11156 would weaken my bullish continuation thesis. A move below $0.1095 would invalidate this particular setup. If buyers lose momentum and fail to defend the rising moving averages, I would rather step aside than force a LONG. MY PERSPECTIVE TA has built a promising upward structure, and I don't want to overlook that strength. But the difference between a healthy trend and an overheated entry is important. The $0.12141 resistance is the immediate challenge. A convincing breakout with stronger volume could open the door toward $0.125 and potentially $0.130. Until then, I'm letting price come to my preferred entry zone. Would you buy the TA pullback near $0.116, or wait for a confirmed breakout above $0.12141 before entering? $TAUSDT #ByXIMPACT

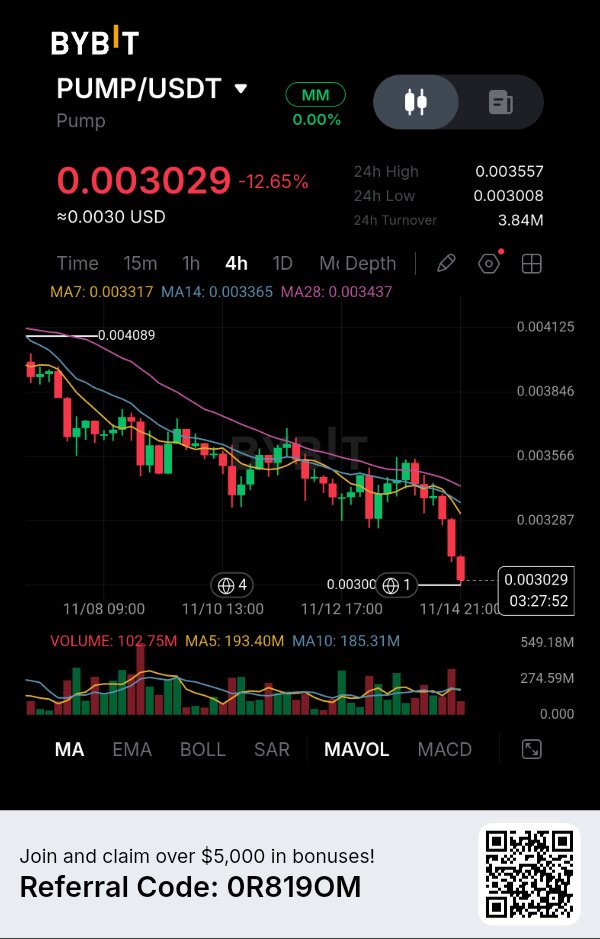
$PUMPUSDT — THE 12.65% DROP HAS PUSHED PRICE INTO A CRITICAL SUPPORT TEST. I'M WATCHING FOR A RELIEF BOUNCE BEFORE CONSIDERING ANOTHER SHORT. PUMP is showing renewed weakness on the 4H chart, and the latest selling pressure has pushed price toward the $0.003008 area. What catches my attention is that this decline comes after several unsuccessful recovery attempts. Buyers have struggled to establish higher highs, while the moving averages continue to slope downward. PUMP is currently trading around $0.003029, down approximately 12.65%. The next reaction around support could determine whether sellers have enough strength to extend this decline. THE TECHNICAL PICTURE The moving averages reveal a clear bearish structure: * MA7: $0.003317 * MA14: $0.003365 * MA28: $0.003437 Price is trading below all three averages, and their bearish alignment suggests that sellers remain in control of the 4H trend. The first recovery obstacle is around $0.003317–$0.003365, followed by the stronger $0.003437 resistance. THE DETAIL I'M WATCHING The immediate decision point is $0.003008. PUMP is approaching its visible 24-hour low, and I want to see whether buyers can defend this region. Volume currently stands around 102.75M, compared with MA5 at 193.40M and MA10 at 185.31M. Despite the sharp decline, the latest volume reading is below both averages. I want to see whether another selling wave receives stronger participation or whether buyers begin absorbing the pressure. MY EXECUTION STRATEGY I'm focusing on ONE conditional SHORT setup. * Entry zone: $0.003317–$0.003365 * Confirmation: 4H bearish rejection from this resistance region. * Stop Loss: $0.003480 * TP1: $0.003100 * TP2: $0.003008 * TP3: $0.002900 (projected extension) I don't want to chase PUMP after a 12% decline. My preferred approach is to wait for a recovery toward resistance and look for sellers to regain control. WHAT COULD INVALIDATE MY IDEA? A strong 4H recovery above $0.003437 would weaken my bearish continuation thesis. If buyers reclaim $0.003480 and establish sustained upward momentum, I would abandon this short setup and reassess the structure. MY PERSPECTIVE PUMP is approaching a critical decision point. The broader trend remains bearish, but the $0.003008 support deserves attention. If buyers fail to defend it, another downside move could develop. However, after such an extended decline, a relief rally is also possible. I'm choosing patience over chasing candles. I want a confirmed rejection, a defined invalidation level and a reasonable trading opportunity. Would you wait for PUMP to retest $0.00335 before considering a short, or do you think buyers can defend $0.003008 and trigger a recovery? $PUMPUSDT #ByXIMPACT

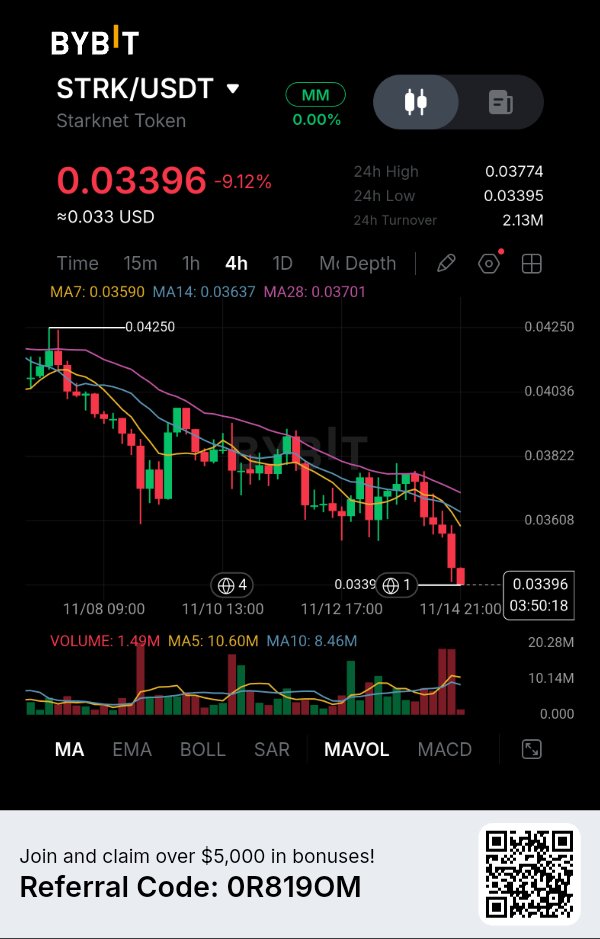
$STRKUSDT — THE 4H BREAKDOWN HAS PUT $0.03395 UNDER PRESSURE. I'M WATCHING FOR A RELIEF BOUNCE BEFORE LOOKING FOR ANOTHER SHORT OPPORTUNITY. Starknet has lost another important part of its price structure, and the latest decline has brought price dangerously close to its visible support. STRK is currently trading around $0.03396, down approximately 9.12%. What catches my attention is the consistent sequence of lower highs and lower lows. Buyers have repeatedly struggled to sustain recoveries, and the latest candles show renewed downside pressure. THE TECHNICAL PICTURE The moving averages remain firmly bearish: MA7: $0.03590 MA14: $0.03637 MA28: $0.03701 All three averages are above the current price. Even more importantly, they remain aligned in bearish order, suggesting that the broader 4H structure has not recovered. The $0.03590–$0.03701 region is now an important resistance cluster. THE DETAIL I'M WATCHING The immediate battle is around $0.03395. This is the visible recent low, and price is currently testing that region. There is another detail worth watching: volume. Current volume is approximately 1.49M, compared with MA5 at 10.60M and MA10 at 8.46M. Although the recent selling candles have been significant, the latest volume reading is below both averages. I want to see whether another breakdown receives stronger participation or whether buyers manage to defend this support. MY EXECUTION STRATEGY I'm focusing on ONE conditional SHORT setup. Entry zone: $0.03590–$0.03637 Confirmation: 4H bearish rejection from this resistance region. Stop Loss: $0.03750 TP1: $0.03395 TP2: $0.03280 TP3: $0.03150 (projected extension) I don't want to chase STRK directly into support after such a sharp decline. My preferred approach is to wait for a recovery toward the moving averages and evaluate whether sellers defend that area. WHAT COULD INVALIDATE MY IDEA? A strong 4H recovery above $0.03701 would weaken my bearish continuation thesis. A sustained move above $0.03750 would invalidate this short setup, and I would reassess rather than force a position. MY PERSPECTIVE STRK is approaching an important decision point. The broader trend remains bearish, but the $0.03395 support area deserves attention. A breakdown without meaningful buying resistance could open the door to another leg lower. However, I don't want to mistake an extended decline for an automatic short opportunity. I'm waiting for a proper retest, clear rejection and defined risk before committing capital. Would you wait for STRK to retest $0.0360 before considering a short, or do you think buyers can defend $0.03395 and trigger a recovery? $STRKUSDT #ByXIMPACT

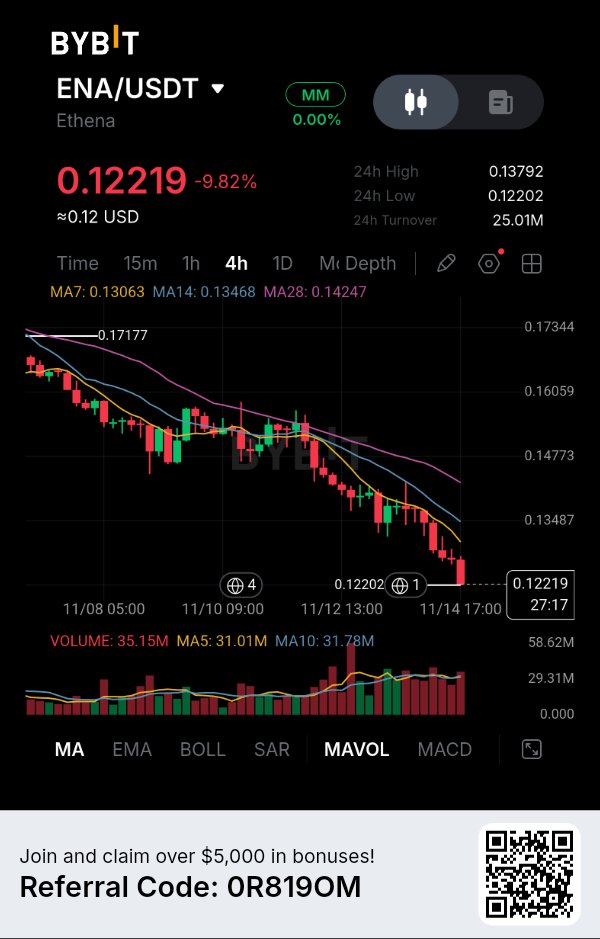
$ENAUSDT — THE 4H SELL-OFF IS ACCELERATING, AND BUYERS ARE NOW FACING A CRITICAL TEST AROUND $0.1220. Ethena is showing significant weakness, and what concerns me most is that sellers are continuing to push price lower without allowing buyers to establish a meaningful recovery. ENA is currently trading around $0.12219, down approximately 9.82%. The latest decline has brought price directly toward its recent low. This is where I want to pay close attention because the next reaction could determine whether the selling pressure continues. THE TECHNICAL PICTURE The moving averages show a clearly bearish structure: * MA7: $0.13063 * MA14: $0.13468 * MA28: $0.14247 All three averages are positioned above the current price. Even more importantly, they remain in bearish alignment, with the shorter average below the longer ones. This tells me the broader 4H trend is still under considerable selling pressure. THE DETAIL I'M WATCHING The $0.12202 region is the immediate decision point. ENA has approached this level after a prolonged decline, and buyers need to demonstrate that they can defend it. Volume is also worth examining. Current volume stands around 35.15M, compared with MA5 at 31.01M and MA10 at 31.78M. Selling activity is elevated relative to both volume averages. For me, this makes the current decline more significant than an ordinary low-volume pullback. MY EXECUTION STRATEGY I'm focusing on ONE conditional SHORT opportunity. * Entry zone: $0.13060–$0.13470 * Confirmation: 4H bearish rejection from this resistance region. * Stop Loss: $0.13850 * TP1: $0.12202 * TP2: $0.11800 * TP3: $0.11400 (projected extension) I don't want to chase ENA after a nearly 10% decline. My preferred approach is to wait for a recovery toward resistance and look for sellers to regain control. WHAT COULD INVALIDATE MY IDEA? A strong 4H recovery above $0.13468 would weaken my bearish continuation thesis. If buyers reclaim this region and push above $0.13850, I would consider the short setup invalidated. MY PERSPECTIVE ENA is approaching a critical moment. The moving averages remain bearish, selling volume has increased, and price is testing its recent low. However, I don't want to assume that every breakdown will automatically produce another decline. The $0.12202 level is where buyers need to respond. If it fails and price later retests it as resistance, another downside opportunity could develop. I'm prioritizing confirmation over chasing momentum. Would you wait for ENA to recover toward $0.130 before considering a short, or do you think buyers can defend $0.122 and trigger a recovery? $ENAUSDT #ByXIMPACT

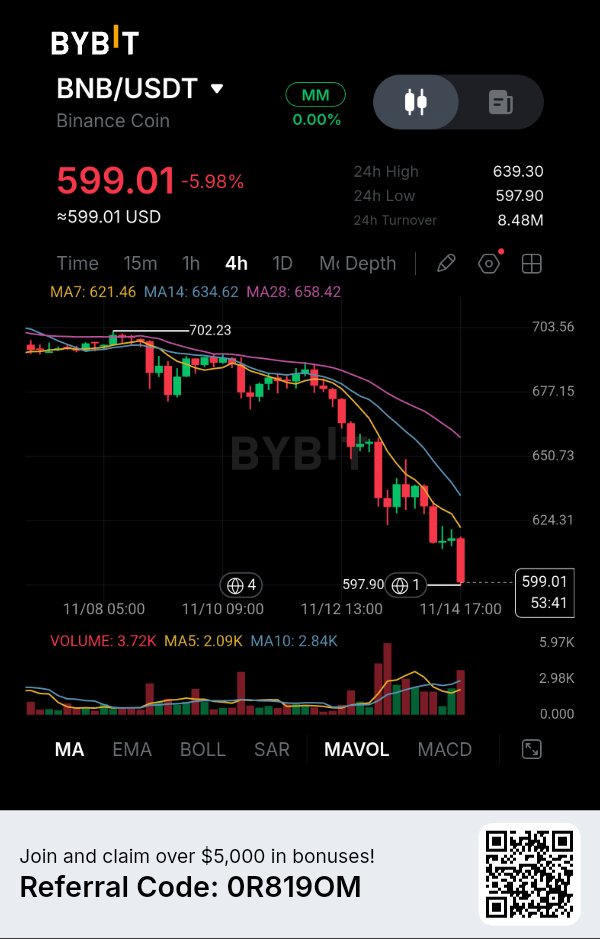
$BNBUSDT — THE $600 LEVEL IS UNDER PRESSURE, AND SELLERS ARE SHOWING NO CLEAR SIGN OF RELINQUISHING CONTROL. BNB has experienced a sharp 4H breakdown, falling from the $680–$700 region toward $599.01. What catches my attention isn't just the 5.98% decline. It's the acceleration in selling pressure as price moves below every major moving average. The market is approaching an important decision point, and I don't want to confuse a temporary bounce with a genuine recovery. THE TECHNICAL PICTURE The moving averages show a strongly bearish structure: * MA7: $621.46 * MA14: $634.62 * MA28: $658.42 BNB is trading below all three averages, and they remain aligned in bearish order. The first recovery obstacle is around $621–$635. Beyond that, $658 becomes a much stronger structural resistance. THE DETAIL I'M WATCHING BNB has reached $597.90, which is also the visible 24-hour low. This is the immediate support area I want to monitor. There is another important detail: current volume is approximately 3.72K, compared with MA5 at 2.09K and MA10 at 2.84K. Selling activity has expanded relative to both volume averages. That makes me cautious about expecting an immediate recovery without stronger buying confirmation. MY EXECUTION STRATEGY I'm looking for ONE conditional SHORT opportunity. * Entry zone: $621–$634 * Confirmation: 4H bearish rejection from this resistance region. * Stop Loss: $642 * TP1: $610 * TP2: $597.90 * TP3: $585 (projected extension) I don't want to chase BNB after such a significant decline. My preferred approach is to wait for a relief rally and evaluate whether sellers defend the broken structure. WHAT COULD INVALIDATE MY IDEA? A strong 4H recovery above $634.62 would weaken my immediate bearish outlook. If BNB reclaims $642 and establishes sustained buying momentum, I would abandon this short setup and reassess. MY PERSPECTIVE BNB is approaching a critical area where buyers must demonstrate that they can finally slow the decline. The $597.90 level is the immediate reference, while $621–$634 is the recovery zone I'm watching. I would rather wait for a confirmed rejection than sell emotionally into an extended red candle. Capital protection comes first. The opportunity comes second. Would you wait for BNB to recover toward $630 before considering a short, or do you think buyers can defend $598 and start a recovery? $BNBUSDT #ByXIMPACT

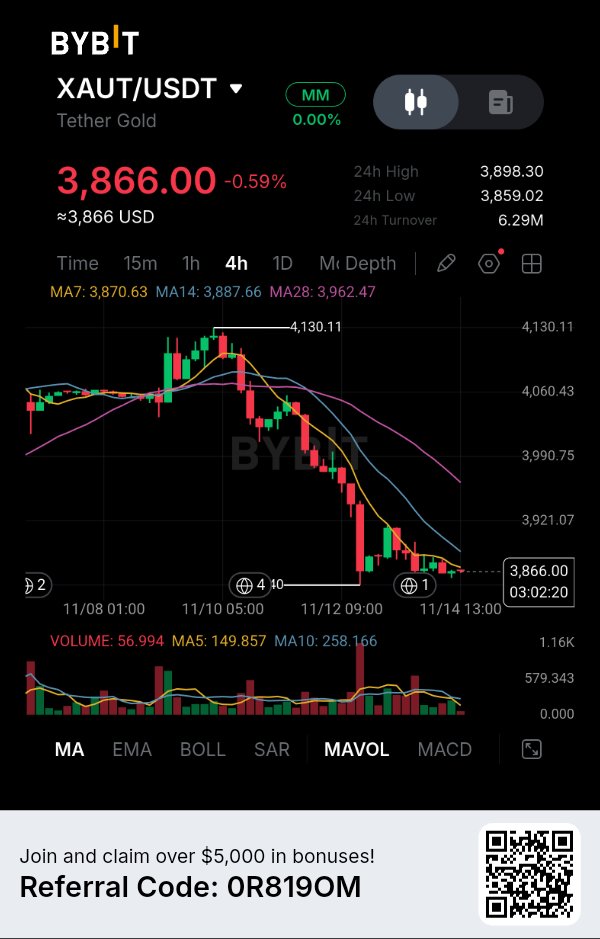
$XAUTUSDT — GOLD HAS LOST ITS SHORT-TERM MOMENTUM, AND THE $3,859 SUPPORT ZONE IS NOW THE LEVEL I'M WATCHING CLOSELY. What interests me about XAUT is how quickly the market shifted from trading above $4,100 to consolidating near $3,860. This isn't just a small pullback. The 4H chart shows a clear sequence of lower highs and lower lows, with sellers maintaining pressure on every recovery attempt. XAUT is currently trading around $3,866, down 0.59%. THE TECHNICAL PICTURE The moving averages show how much the structure has weakened: MA7: $3,870.63 MA14: $3,887.66 MA28: $3,962.47 Price is trading below all three averages. More importantly, the MA7 is below MA14, while MA28 remains considerably higher. This alignment suggests that the broader 4H momentum still favors sellers. The first resistance area is $3,870–$3,888, followed by the stronger $3,962 region. THE DETAIL I'M WATCHING XAUT recently approached the $3,859 support area and is now moving sideways. But the recovery hasn't demonstrated convincing buying participation. Current volume is approximately 56.994K, compared with MA5 at 149.857K and MA10 at 258.166K. This tells me the latest consolidation is happening with relatively weak volume. I want to see whether buyers can defend $3,859 or whether sellers eventually force another breakdown. MY EXECUTION STRATEGY I'm focusing on ONE conditional SHORT setup. Entry zone: $3,870–$3,888 Confirmation: 4H bearish rejection from this resistance region. Stop Loss: $3,925 TP1: $3,859 TP2: $3,830 TP3: $3,800 (projected extension) I prefer waiting for a recovery into resistance rather than opening a short directly above support. WHAT COULD INVALIDATE MY IDEA? A convincing 4H recovery above $3,888 would weaken my immediate bearish setup. If buyers reclaim $3,925 and establish stronger upward momentum, I would reconsider the short rather than force an entry. MY PERSPECTIVE The interesting part of this chart is that XAUT is consolidating near its recent low without showing a convincing recovery in volume. For me, the next move depends on whether buyers can defend $3,859 or sellers turn this consolidation into another breakdown. I'm not interested in predicting the exact bottom. I want confirmation, a defined risk level and a trade with a reasonable reward potential. Would you consider shorting XAUT on a rejection near $3,888, or do you think buyers will defend $3,859 and trigger a recovery? $XAUTUSDT #ByXIMPACT

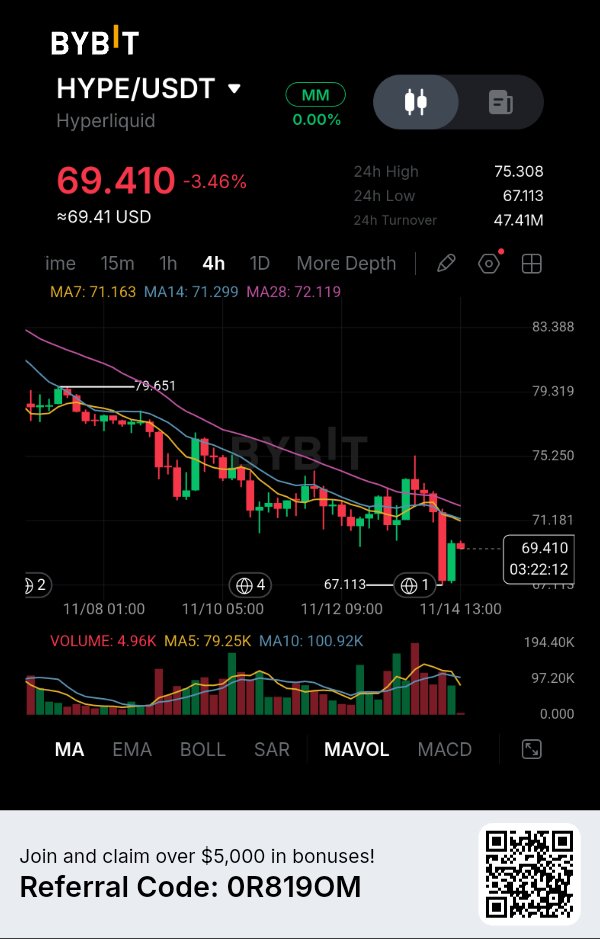
$HYPEUSDT — THE BREAKDOWN BELOW $71 HAS CHANGED THE SHORT-TERM STRUCTURE. I'M WATCHING WHETHER $67.11 BECOMES THE NEXT BATTLE BETWEEN BUYERS AND SELLERS. Hyperliquid is facing renewed selling pressure on the 4H chart. What caught my attention is the sharp move below the moving averages, followed by a small recovery from $67.113. HYPE is currently trading around $69.410, down 3.46%. The important question is whether this latest bounce can recover the lost support structure or whether sellers are preparing another move lower. THE TECHNICAL PICTURE The moving averages show that sellers still have the advantage: MA7: $71.163 MA14: $71.299 MA28: $72.119 Price is trading below all three averages. The MA7 and MA14 are also positioned very close together, creating an immediate resistance region around $71.16–$71.30. Until HYPE reclaims this area, I remain cautious about expecting a sustained recovery. THE DETAIL I'M WATCHING The $67.113 level is particularly important. Price experienced a sharp decline toward this region before producing a recovery candle. However, current volume is approximately 4.96K, compared with MA5 at 79.25K and MA10 at 100.92K. This is a significant difference, suggesting that the latest bounce has not yet demonstrated strong buying participation. I want to see whether buyers can defend the recent low while sellers continue to control the overhead resistance. MY EXECUTION STRATEGY I'm focusing on ONE conditional SHORT setup. Entry zone: $71.16–$72.12 Confirmation: 4H bearish rejection from this resistance region. Stop Loss: $73.00 TP1: $69.00 TP2: $67.113 TP3: $65.50 (projected extension) I prefer waiting for a recovery into resistance rather than selling directly after such a sharp decline. WHAT COULD INVALIDATE MY IDEA? A convincing 4H recovery above $72.12 would weaken my bearish thesis. If HYPE reclaims the MA28 and establishes acceptance above $73.00, I would invalidate this short setup and reassess the structure. The $67.113 support also deserves attention because another successful defense could trigger a stronger recovery. MY PERSPECTIVE HYPE is at an interesting point. The previous recovery structure has weakened, sellers have pushed price below all three moving averages, and buyers now need to demonstrate that $67.11 can hold. I'm not interested in chasing the decline. I want to see how price behaves when it approaches resistance again. That's where the next meaningful trading opportunity could develop. Would you wait for HYPE to retest $71.30–$72.12 before considering a short, or do you think buyers can defend $67.11 and reverse the trend? $HYPEUSDT #ByXIMPACT

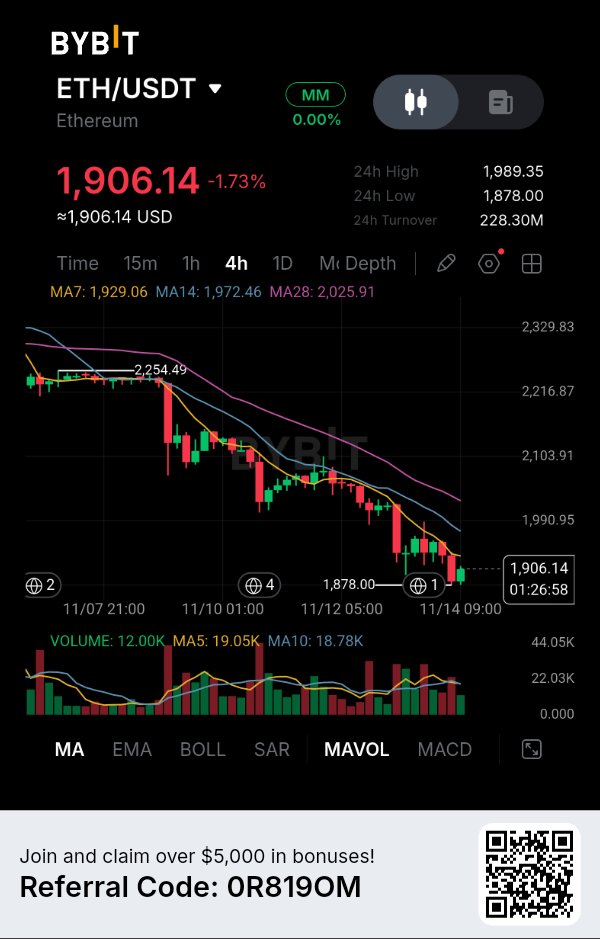
$ETHUSDT — ETH KEEPS PRINTING LOWER HIGHS, AND THE $1,930–$1,972 REGION COULD BECOME THE NEXT SELLER DEFENSE ZONE. Ethereum is struggling to find sustainable buying strength after an extended decline. What interests me is that every recovery attempt on this 4H chart has faced selling pressure, while the moving averages continue to slope downward. ETH is currently trading around $1,906.14, down 1.73%. Buyers have reacted near $1,878, but I don't see enough evidence yet to call this a meaningful trend reversal. THE TECHNICAL PICTURE The moving averages reveal the current imbalance: MA7: $1,929.06 MA14: $1,972.46 MA28: $2,025.91 All three averages are above the current price. This bearish alignment suggests that ETH needs to reclaim several resistance levels before its 4H structure can meaningfully improve. THE DETAIL I'M WATCHING The $1,878 region is particularly important. ETH recently tested this level and produced a small recovery, but the bounce remains limited. Current volume is approximately 12.00K, below MA5 at 19.05K and MA10 at 18.78K. That tells me the latest recovery has not yet demonstrated convincing buying participation. I want to see how price reacts around the MA7 and MA14 resistance areas. MY EXECUTION STRATEGY I'm focusing on ONE conditional SHORT setup. Entry zone: $1,929–$1,972 Confirmation: 4H bearish rejection within this resistance region. Stop Loss: $2,010 TP1: $1,878 TP2: $1,850 TP3: $1,820 (projected extension) My preference is to let ETH recover into resistance before looking for another downside opportunity. I don't want to chase the current red candles. WHAT COULD INVALIDATE MY IDEA? A strong 4H recovery above $1,972, followed by acceptance above $2,010, would invalidate my immediate bearish setup. If buyers reclaim the MA14 and establish higher lows, I would reassess the market rather than force a short position. MY PERSPECTIVE ETH is approaching an important decision point. The broader 4H structure still favors sellers, but the reaction around $1,878 shows that buyers haven't completely stepped aside. For me, the next meaningful opportunity depends on whether ETH can recover toward $1,930–$1,972 or breaks its recent support first. I'm choosing patience over chasing momentum. Would you consider shorting ETH on a rejection near $1,970, or do you think buyers can defend $1,878 and start a stronger recovery? $ETHUSDT #ByXIMPACT

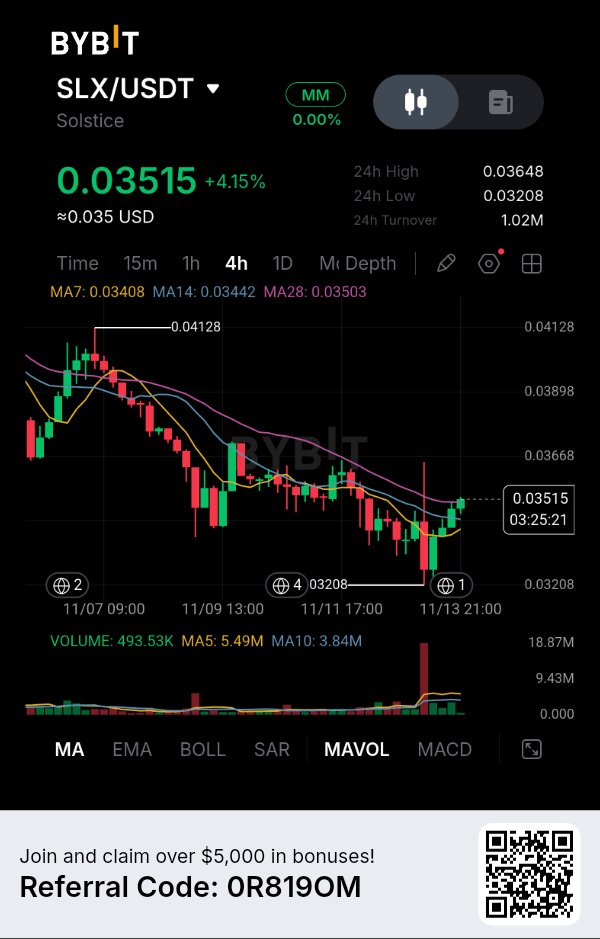
$SLXUSDT — A 4.15% RECOVERY HAS BROUGHT PRICE BACK ABOVE THE MOVING AVERAGES, BUT I'M WATCHING $0.03648 BEFORE TRUSTING THIS REVERSAL. Solstice is finally showing some buying interest after an extended decline. Price has recovered from the $0.03208 area and is now trading around $0.03515. At first glance, the recovery looks encouraging. But there's one detail I don't want to overlook: the broader moving-average structure is still bearish. THE TECHNICAL PICTURE On the 4H chart, the moving averages are positioned as follows: * MA7: $0.03408 * MA14: $0.03442 * MA28: $0.03503 Price has moved above all three averages, which is an encouraging short-term development. However, the averages themselves remain in bearish alignment: MA7 below MA14, and MA14 below MA28. This means buyers have recovered some ground, but they haven't fully changed the underlying trend structure. THE DETAIL THAT MATTERS The recent reaction from $0.03208 is worth watching. Buyers have pushed price toward $0.03515, but the next challenge is the $0.03648 resistance area. Volume also deserves attention. Current volume is approximately 493.53K, compared with MA5 at 5.49M and MA10 at 3.84M. The recovery needs stronger and sustained participation before I consider it a convincing reversal. MY EXECUTION STRATEGY I'm watching for a conditional SHORT if sellers reject the recent recovery near resistance. Entry zone: $0.03550–$0.03640 Confirmation: 4H bearish rejection from this region. Stop Loss: $0.03710 TP1: $0.03442 TP2: $0.03208 TP3: $0.03080 (projected extension) I don't want to short blindly while buyers are recovering. I need to see actual selling pressure at resistance before entering. WHAT COULD INVALIDATE MY IDEA? A convincing 4H breakout above $0.03648, followed by acceptance above $0.03710, would invalidate my immediate bearish setup. If buyers maintain momentum and turn the previous resistance into support, I would reconsider the short. MY PERSPECTIVE SLX is approaching an interesting decision point. The recovery from $0.03208 shows that buyers are still active, but one strong move doesn't automatically erase the previous downtrend. For me, $0.03648 is the level to watch. I want to see whether buyers can finally break the resistance structure or whether sellers use this recovery as another opportunity to regain control. Would you trust this SLX recovery and look for a breakout above $0.03648, or wait for sellers to confirm a rejection first? $SLXUSDT #ByXIMPACT

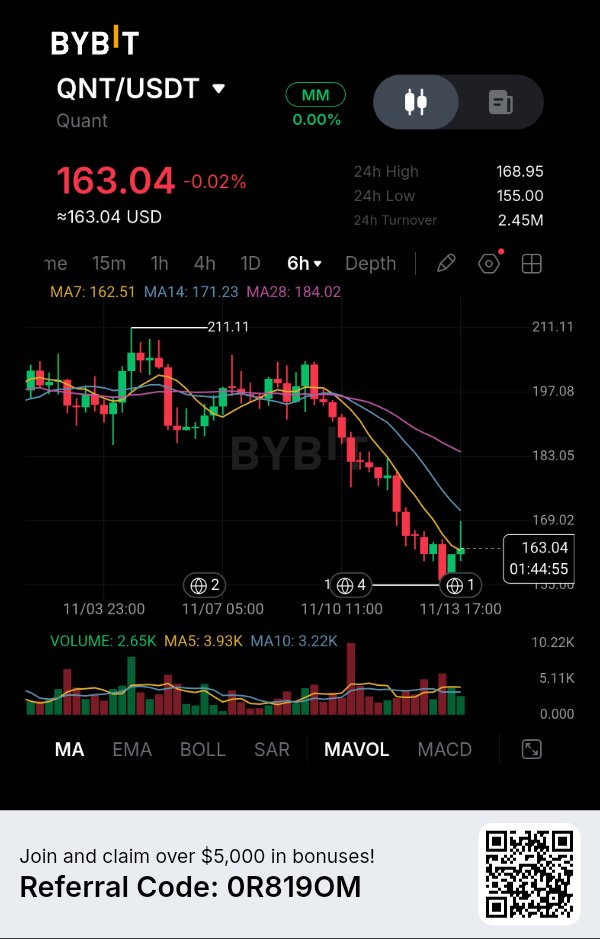
$QNTUSDT — THE SELL-OFF HAS FINALLY PRODUCED A RECOVERY ATTEMPT, BUT I'M NOT CONVINCED THE BUYERS HAVE TAKEN CONTROL YET. QNT has experienced a significant decline, falling from the $197–$200 region toward $155. Now price is attempting to recover, but the bigger question is whether this is the beginning of a reversal or simply a temporary bounce inside a bearish trend. I'm paying particular attention to the $169–$171 resistance area. Here's why. THE TECHNICAL PICTURE On the 6H chart, QNT is trading around $163.04. The moving averages reveal the current market structure: MA7: $162.51 MA14: $171.23 MA28: $184.02 Price has recovered slightly above MA7, but MA14 and MA28 remain significantly higher. This tells me short-term stabilization is developing, while the broader trend remains bearish. THE DETAIL THAT CAUGHT MY ATTENTION QNT recently approached the $155 support region before producing a recovery candle. That's an important reaction, but I don't want to confuse a bounce with a confirmed trend reversal. Current volume is approximately 2.65K, compared with MA5 at 3.93K and MA10 at 3.22K. Buying participation has not yet exceeded either volume average. For me, the $168.95–$171.23 region is the next important test. It combines the visible 24-hour high with the MA14 resistance. MY EXECUTION STRATEGY I'm watching for a potential SHORT if the recovery reaches resistance and sellers confirm their presence. Entry zone: $168.95–$171.23 Confirmation: 6H bearish rejection from the resistance zone. Stop Loss: $175.50 TP1: $160.00 TP2: $155.00 TP3: $150.00 (projected extension) I don't want to enter simply because QNT has been falling. I want to see an actual rejection before committing capital. WHAT COULD INVALIDATE MY IDEA? A strong 6H breakout above $171.23 would weaken my bearish thesis. If buyers reclaim this level and establish acceptance above $175.50, I would consider the short setup invalidated. A stronger recovery could then bring the MA28 region near $184 back into focus. MY PERSPECTIVE What interests me about QNT right now is the battle between a developing recovery and an established downtrend. Buyers have defended the recent low, but they still need to overcome several layers of resistance. I'm not chasing the current green candle, and I'm not assuming the bottom is already in. I want the market to show its next move before I commit. Would you trust this QNT recovery, or wait for a rejection near $171 before considering a short position? $QNTUSDT #ByXIMPACT