Pantauan Pasar Pemilu Paruh Waktu
Pemilu paruh waktu AS 2026 semakin mendekat. Bagaimana perubahan ekspektasi kebijakan, sentimen pasar, dan sinyal makroekonomi dapat memengaruhi BTC, ETH, dan aset berisiko lainnya? Bagikan pandangan pasar Anda, indikator kunci, skenario trading, dan bukti yang mendasari pandangan Anda. Perspektif beragam. Insight nyata. Diskusi pasar yang lebih baik.

Goldman menambahkan kenaikan suku bunga di bulan Maret. Cek prediksi emas mereka.
Goldman Sachs kini memperkirakan dua kenaikan suku bunga Fed lagi sebesar 25 basis poin. Satu di bulan Desember. Satu di bulan Maret 2027. Kepala ekonom AS David Mericle menulisnya setelah data CPI yang tinggi. Itu akan membawa total kenaikan siklus ini menjadi tiga, termasuk kenaikan di bulan September. Langkah di bulan Maret bisa saja terjadi lebih awal di bulan Januari. Dan Goldman menunda perkiraan pemangkasan suku bunga pertamanya satu kuartal, ke Desember 2027. Dua detail pertama. Ini adalah sebuah pembalikan. Pada akhir Oktober, Goldman telah menghapus kenaikan Maret dari asumsi dasarnya. Tiga data CPI yang tinggi kemudian, kenaikan itu kembali lagi, menurut investingLive. Mereka masih melihat Desember sebesar 25 bps. Bukan 50 bps seperti yang dilontarkan Waller. Dalam dot plot Desember Fed, yaitu proyeksi kuartalan ke mana suku bunga akan menuju, Goldman memperkirakan sebagian besar anggota FOMC akan mengisyaratkan kenaikan ketiga. Presiden Fed Dallas Logan, yang melihat setidaknya dua kenaikan 25 basis poin lagi, memiliki pandangan serupa. Sekarang bagian yang membuat saya terus berpikir. Tim emas Goldman memangkas target mereka pada 5 November. $4.150 untuk akhir 2026. $4.800 untuk akhir 2027. Dalam catatan yang sama, mereka mencantumkan kenaikan Maret 2027, penundaan pemangkasan, atau tingkat terminal (terminal rate) yang lebih tinggi sebagai risiko penurunan. Dalam kasus itu, emas berakhir di tahun 2027 di dekat $4.660. Bukan $4.800. Lima hari kemudian, ekonom mereka memasukkan dua dari tiga pemicu tersebut, yaitu kenaikan Maret dan pemangkasan yang lebih lambat, ke dalam asumsi dasar mereka. Saya belum melihat pembaruan prakiraan emas tersebut. Apakah itu sebuah kontradiksi? Tidak juga. Ini adalah tim yang berbeda. Catatan emas tersebut mungkin sudah mengasumsikan Desember yang hawkish. Dan celahnya kecil. $4.660 itu 2,9% di bawah $4.800 (menurut perhitungan saya). Dihitung dari $4.055, tempat harga emas spot diperdagangkan setelah rilis CPI pada 10 November menurut Kitco, bahkan kasus penurunan pun menyiratkan kenaikan sekitar 15%. Kasus dasar, sekitar 18% (menurut perhitungan saya). Harga telah bergerak sejak saat itu. Jadi pandangan Goldman terbaca seperti ini: datar dalam jangka pendek, terbantu nantinya oleh pembelian bank sentral. Bagi pasar, "lebih tinggi untuk lebih lama" (higher for longer) kini menjadi asumsi dasar. Bitcoin dan emas keduanya diperdagangkan berdasarkan kemungkinan kenaikan minggu ini. Saya memperhatikan tiga hal. Apakah tim emas Goldman akan merevisi. PCE Oktober pada 25 November. Dan apakah data inflasi November dan Desember benar-benar berjalan moderat seperti yang diharapkan Goldman. Jika ya, kenaikan Maret mungkin bisa batal lagi. #WSOT2026 #Oracle20BFundingPlanTestsTheAITrade #Pantauan Pasar Pemilu Paruh Waktu #AnthropicIPOValuationTest #Keputusan Suku Bunga BOE



After unlock, $FHE did NOT dip. That is the real story today. Bitcoin fell to near $73,750. Ethereum fell to near $2,042. Solana, XRP, Dogecoin, Cardano — almost all altcoins are in red. Market fear is at 29, CPI was hot, liquidations crossed $718 million. Everything is under pressure. But $FHE held its ground. Even after millions of tokens unlocked, price did not collapse. No panic dump. No weak hands crash. That means sellers are done, and holders are strong. In crypto, coins that survive unlock + BTC dip together are usually the first to move when market turns green. I am holding 9,000+ $FHE. My view: if BTC just stabilizes above $73,500, $FHE has a clean path to $0.03, then $0.05. This is not financial advice. Just my observation — strength in fear is rare. And rare strength often gets rewarded. Are you watching FHE too? Drop your target below. #AnthropicIPOTestsTheAIBoom #Oracle20BFundingPlanTestsTheAITrade #MidtermsMarketWatch #BybitAIEvolving #OilVolatilityTracksIranPeaceTalks $SOLUSDT $FHEUSDT
🔥 THE SILENT GIANT NO ONE IS WATCHING — YET Read this before you sell $FHE. While other coins tweet 10x a day, post memes, and beg for attention, $FHE team has been silent since August. No hype. No noise. No fake announcements. And still — it did NOT die. It survived unlock. It survived BTC crash to $73,750. It survived Fear at 29. That is not weakness. That is strength. Why? Because $FHE is not a meme. It is infrastructure. Fully Homomorphic Encryption for AI agents, private data, quantum-resistant future. Real tech. Real partnerships. Clean tokenomics with limited supply pressure after unlock. Look at history: $ZEC pumped 300%+ when privacy narrative returned. $XMR held strong in bear markets. Privacy never dies. It waits. Then it explodes. $FHE is that same story, but for AI era. One real update — one partnership, one mainnet news, one Binance push — and this silent coin can wake up fast. From $0.016, even $1 is not fantasy, it is math + narrative + patience. I hold 9,000+ $FHE. I am not selling silence. I am buying it. Not financial advice. Conviction. #BybitAIEvolving #BOERateDecision #OilVolatilityTracksIranPeaceTalks #MidtermsMarketWatch #AnthropicIPOTestsTheAIBoom $MNTUSDT $FHEUSDT

Selamat Pagi 🌞 | Pembaruan BTC, ETH & SOL
$BTCUSDT : ~74.000 (-1,28%) 📉 · Terendah 24j: 73.748 | Tertinggi: 75.431 · Merah selama 5 minggu ini, sedang menguji support 73K. $ETHUSDT : ~2.044 (-3,90%) 📉 · Support $2.000 sudah sangat dekat. · Likuidasi short besar-besaran telah terjadi. SOL: ~82,9 (-4,54%) 📉 · Bertahan di support $83,5. · *Bounce* bisa terjadi jika ditutup di atas $84,4. Portofolio Saya: Total: 697,14 PKR ✅ PnL 6B: +Rs16.163,40 (+1.526,41%) 🚀 Pasar sedang merah, tapi portofolio jangka panjang tetap kuat. Apa yang kamu pegang hari ini? 👇 #Pantauan IHK AS November #Oracle20BFundingPlanTestsTheAITrade #Pantauan Pasar Pemilu Paruh Waktu #AnthropicIPOValuationTest #BybitAIEvolving

🏭 Siapa yang Kabarnya Sedang Berinvestasi?**
⚠️ **Daftar Pendukung IPO Anthropic Terlihat Seperti Daftar Periksa Rantai Pasokan AI** 🤖 Rencana IPO Anthropic menarik perhatian, dan bukan hanya karena besarnya penawaran tersebut. Daftar pendukung yang dilaporkan mencakup hampir setiap lapisan tumpukan AI. 📊 **🏭 Siapa yang Dikabarkan Berinvestasi?** Menurut laporan, Google, Nvidia, AMD, Broadcom, Micron, Microsoft, dan TSMC berencana untuk menginvestasikan total $26 miliar melalui penempatan pribadi pada harga IPO. 💰 Hal itu menempatkan produsen chip, pemasok memori, penyedia cloud, dan pabrik pengecoran terkemuka di tabel kapitalisasi yang sama. 🧩 **🔗 Lebih dari Sekadar Taruhan pada Claude** Perusahaan-perusahaan ini tidak hanya mendukung suatu produk. Mereka mendukung seorang pelanggan. 🛒 Seiring pertumbuhan Anthropic, mereka membutuhkan lebih banyak dari semua yang dijual oleh para pemasok ini: - 🧠 **Chip:** GPU dan akselerator khusus untuk melatih serta menjalankan model - 💾 **Memori:** Memori bandwidth tinggi untuk beban kerja AI - ☁️ **Kapasitas Cloud:** Ruang pusat data dan komputasi dalam skala besar - 🏗️ **Manufaktur:** Fabrikasi chip canggih Bagi para pemasok, ekuitas di Anthropic sebagian merupakan cara untuk mengamankan permintaan jangka panjang bagi produk mereka sendiri. 🔄 **💵 Pertanyaan Tentang Valuasi** Anthropic dilaporkan menargetkan valuasi IPO sekitar $1T, atau $1,4T secara fully diluted. 🚀 Itu adalah angka yang sangat besar, dan menimbulkan pertanyaan kunci bagi investor publik: seberapa besar pertumbuhan yang sudah diperhitungkan dalam harga tersebut? 🤔 **⚖️ Siapa Mendapat Apa?** - 🏢 **Pemasok** mendapatkan ekuitas dan saham pada pelanggan yang tumbuh pesat. - 🧪 **Anthropic** mendapatkan pendanaan untuk memperluas komputasi dan kapasitasnya. - 📈 **Investor publik** dapat memutuskan seberapa berharga hubungan ini. **⚠️ Risiko yang Perlu Dipertimbangkan** Pembiayaan sirkular adalah kekhawatiran yang nyata. 🔁 Ketika pemasok berinvestasi pada pelanggan yang kemudian membelanjakan uang itu kembali kepada mereka, permintaan dapat terlihat lebih kuat dari kenyataannya. Investor juga harus memperhatikan komitmen belanja, persaingan, dan bagaimana pasar bereaksi terhadap valuasi yang begitu besar. 🔍 **🎯 Kesimpulan Akhir** IPO ini adalah ujian tentang bagaimana pasar menilai rantai pasokan AI secara keseluruhan, bukan hanya satu perusahaan. Perlakukan angka yang dilaporkan dengan hati-hati sampai pengajuan resmi mengonfirmasinya. 📑 *Ini bukan nasihat keuangan. Selalu lakukan riset Anda sendiri.* 🙏 **:** #AnthropicIPO 🚀 #SahamAI 🤖 #Nvidia 💚 #InvestasiTeknologi 📊 #BeritaIPO 🔔 --- #Pantauan IHK AS November #Oracle20BFundingPlanTestsTheAITrade #Pantauan Pasar Pemilu Paruh Waktu #AnthropicIPOValuationTest #Keputusan Suku Bunga BOE


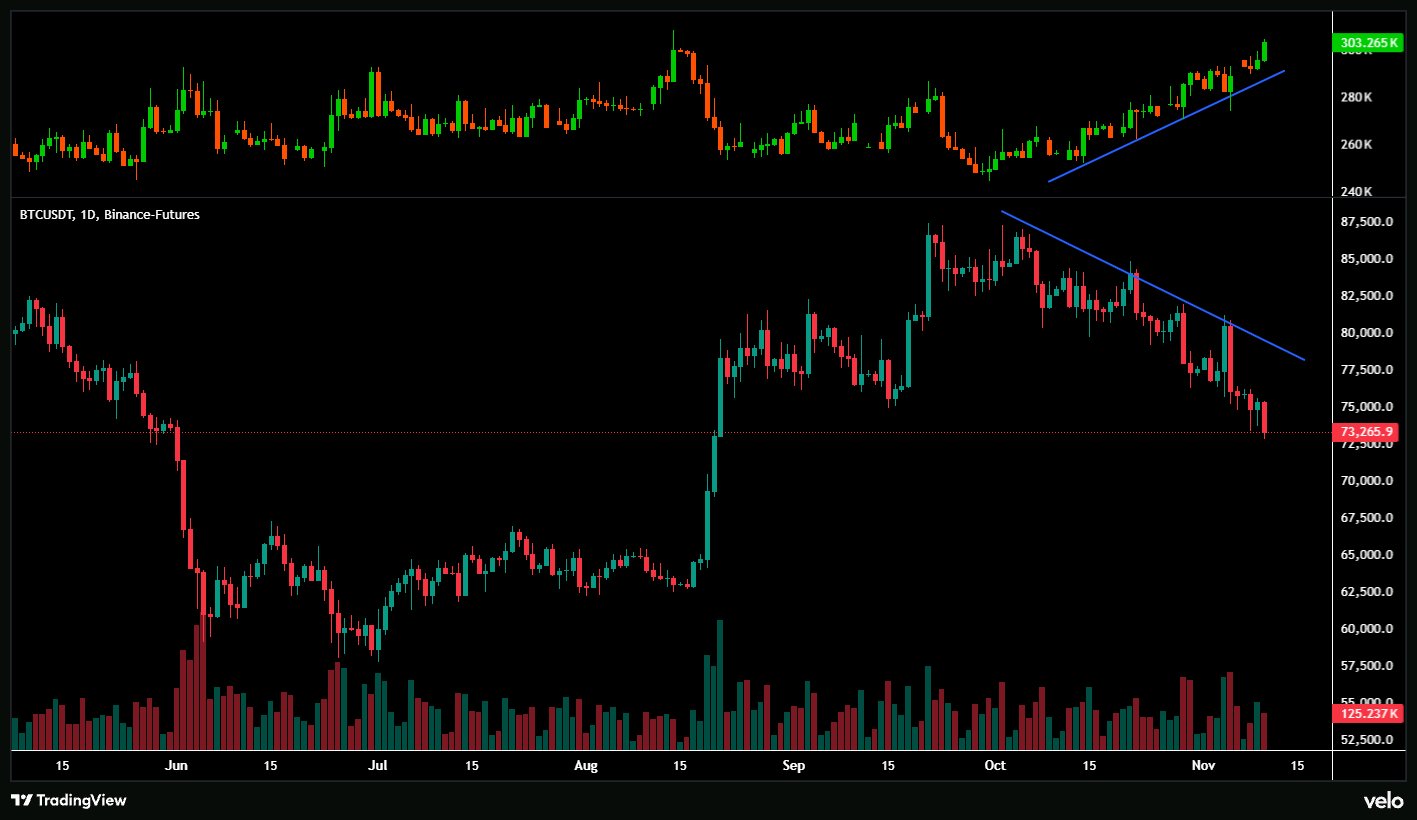
$BTCUSDT sedang turun, tapi Open Interest justru naik. Kombinasi yang tidak biasa. Alih-alih leverage keluar dari pasar, lebih banyak posisi yang terbentuk saat Bitcoin mencetak level terendah baru. Ini bisa menjadi persiapan sempurna untuk peristiwa likuidasi besar-besaran. Sesuatu yang besar mungkin sedang terjadi. 👀 #Pantauan Pasar Pemilu Paruh Waktu

https://www.bybit.com/press/community/6341068275339510360 #BybitAIEvolving #BOERateDecision #AnthropicIPOTestsTheAIBoom #MidtermsMarketWatch

🚨 $TRUMP at All-Time Lows: Squeeze or Trap? 📉
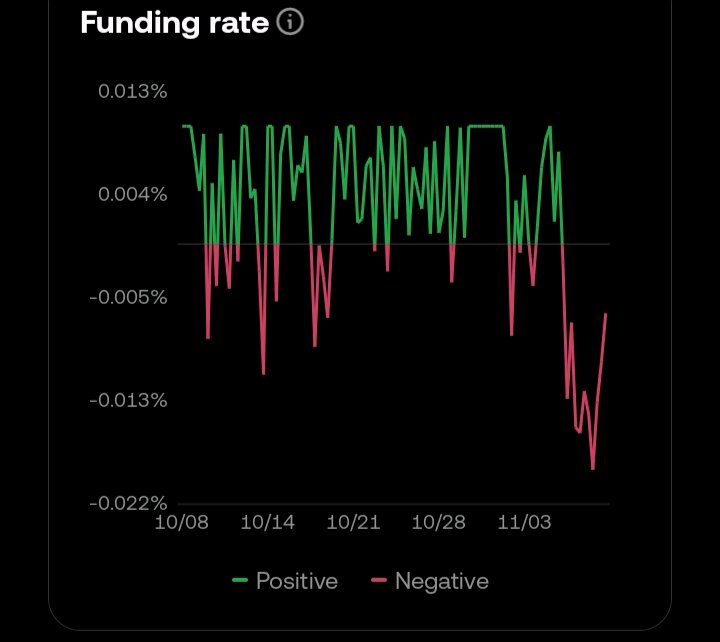
The tension on $TRUMP has reached a boiling point as the token tests its macro floor while derivatives data paints an aggressive divergence. Trading around $1.132 following a sharp rejection from $1.152, price action is hovering dangerously close to the historical low support near $1.102. This isn’t a standard dip—it is a critical test of whether spot buyers will defend the base or allow price discovery to the downside. 🔍 Derivatives Divergence vs. Spot Pressure: * Aggressive Short Stacking: Futures Open Interest climbed over 6% to ~$155.7M even as spot price continued bleeding, while 8-hour funding flipped negative to -0.0103%. This setup confirms aggressive short-side momentum, not organic spot accumulation. * Liquidation Asymmetry: Over 82% of recent liquidations came from leveraged longs. With futures volume (~$238.6M) dwarfing spot turnover (~$29.8M) by roughly 8x, leveraged speculation is driving the entire tape. * Structural Dilution: Only 281.9M tokens are in circulation out of the 1B maximum supply. The gap between current market cap ($315M) and FDV ($1.12B) keeps traders cautious regarding future unlock overhang. 🎯 Critical Technical Roadmap ($TRUMPUSDT): 🔴 Bearish Invalidation ($1.100 – $1.102): A decisive 1H/4H breakdown beneath $1.102 with rising OI removes the last visible support floor, exposing the chart to an aggressive liquidation cascade into uncharted territory. 🟢 Bullish Reversal & Short Squeeze: To invalidate the downward channel, bulls must reclaim the $1.137–$1.153 resistance band on real spot volume. Negative funding creates high fuel for a violent short squeeze, but sustained upside requires genuine spot absorption, not just covering rallies. Political sentiment volatility and Senate regulatory inquiries continue to test narrative-driven tokens. Protect capital, respect your stops, and avoid overleveraging. Are you bidding the $1.10 historical floor for a squeeze bounce, or waiting for a breakdown flush? Share your thesis below! 👇 $TRUMPUSDT #ByXIMPACT
https://www.bybit.com/press/community/7205759403794315717 #BOERateDecision #AnthropicIPOTestsTheAIBoom #MidtermsMarketWatch #Oracle20BFundingPlanTestsTheAITrade #OilVolatilityTracksIranPeaceTalks $SOLUSDT $DOGEUSDT @

https://www.bybit.com/press/community/8070450532248647485 #Data Penggajian AS dan Keputusan Suku Bunga Mendorong Pekan Makro #Oracle20BFundingPlanTestsTheAITrade #Pantauan Pasar Pemilu Paruh Waktu #AnthropicIPOValuationTest #BybitAIEvolving $SOLUSDT @$DOGEUSDT

Bom dia pessoal alguém pode me ajuda com lucro bybit

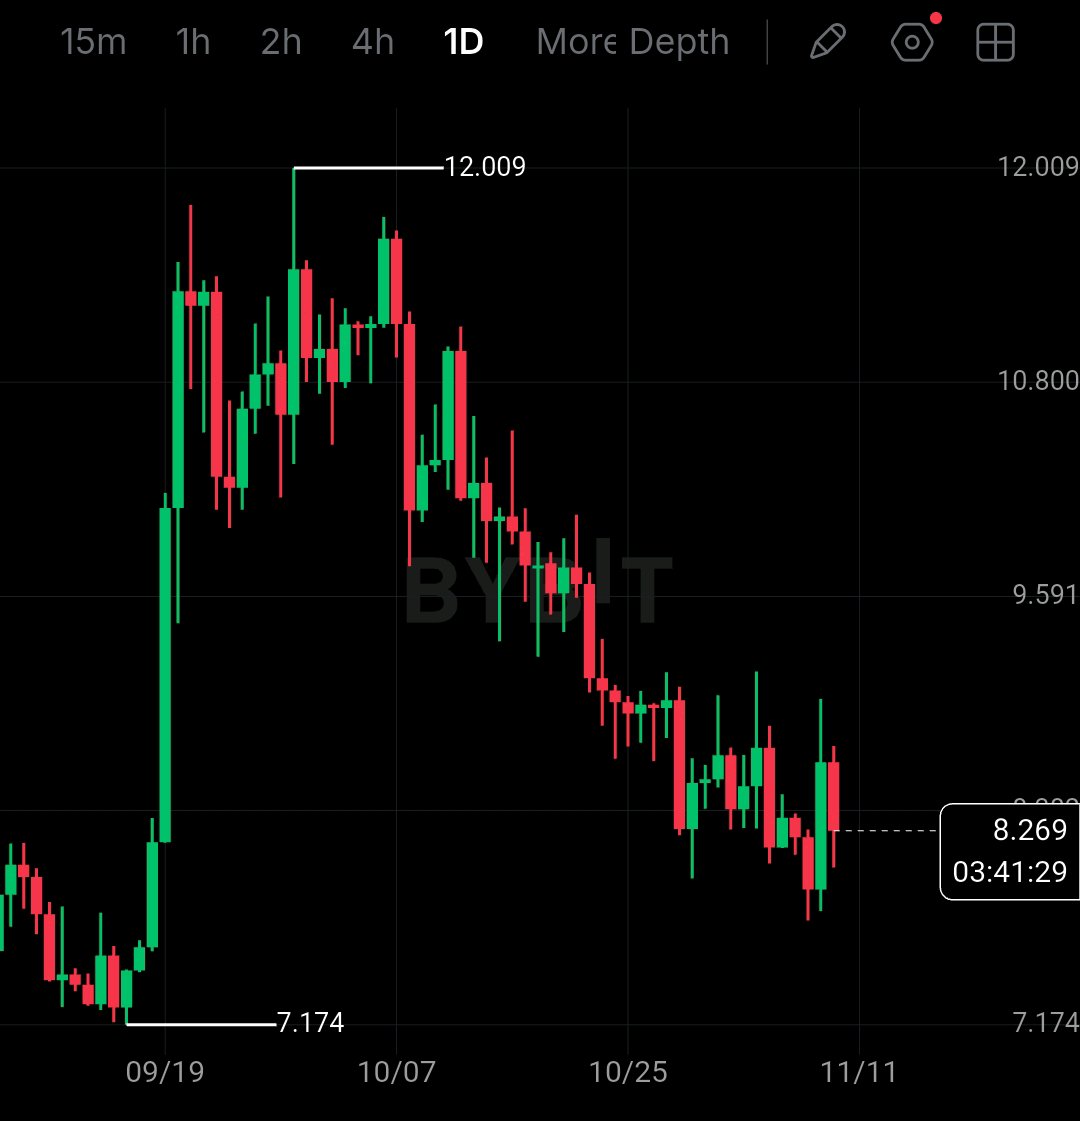
$AVAXUSDT just lost $8.54 and now $8.06 is all that is left, AVAX fell from $12.009 to $8.26. It is not bouncing. It is bleeding slow. The chart tells the real story. Price is stuck below EMA200 at $9.117. It also lost Fib $8.549. That was the last support to hold. RSI is near 41, not oversold, just weak. MACD is flat at 0.008, no momentum at all. If $8.062 breaks with a close below, the next leg down opens to $7.763 then $7.528. If $8.549 reclaims with volume, the breakdown fails and $9.117 opens. My plan is simple. I am not buying the middle. Short below $8.062, stop above $8.549, target $7.763 and $7.528. Long only if $8.549 reclaims. Risk 1 to 2%, 5x to 10x isolated max. Tell me, does $8.062 break or $8.549 reclaim? Comment DOWN if $8.062 breaks, UP if $8.549 reclaims. Tap $AVAXUSDT to trade this $8.062 test, trade on this same coin @BybitX @Bybit Learn @PRADO @JonyDong 509 @Jiji715 @Annnn #Oracle20BFundingPlanTestsTheAITrade #MidtermsMarketWatch #AnthropicIPOTestsTheAIBoom #BOERateDecision #BybitAIEvolving

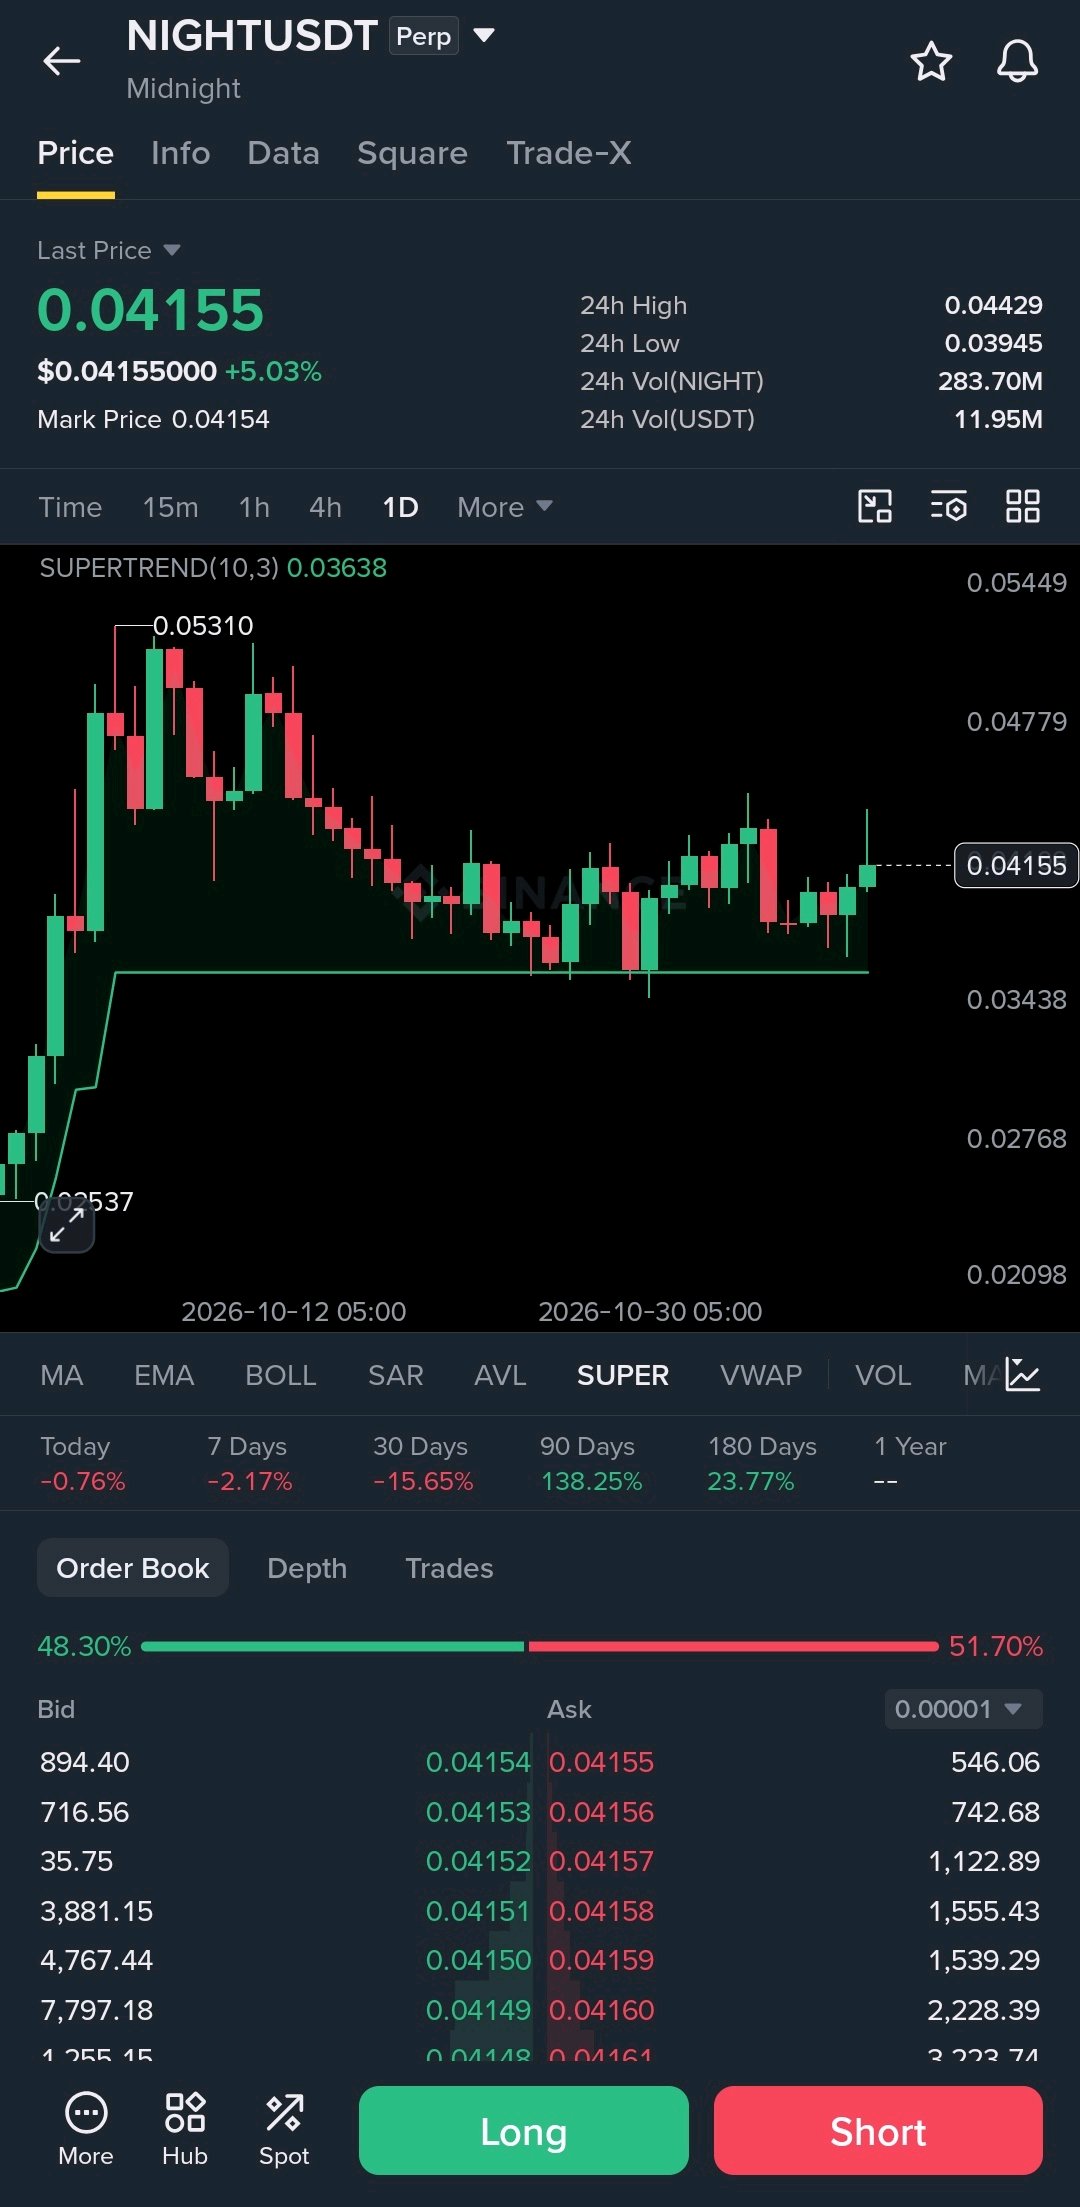
Something interesting is happening with $NIGHTUSDT , and the key level is getting closer. After pulling back from $0.0531, Midnight has started building a decent base around $0.04. Price is holding above the daily Supertrend at $0.03638, which keeps the recovery setup looking constructive. Levels I'm watching: Support: $0.0395 to $0.0364 Resistance: $0.0443 Breakout zone: $0.0478 Major level: $0.0531 A convincing move above $0.0443 could give buyers room to push higher. Losing $0.0364 would put this structure under pressure. Credit where it's due, NIGHT is showing resilience after the pullback. Now a clean breakout would be the next step. #MidtermsMarketWatch #AnthropicIPOTestsTheAIBoom
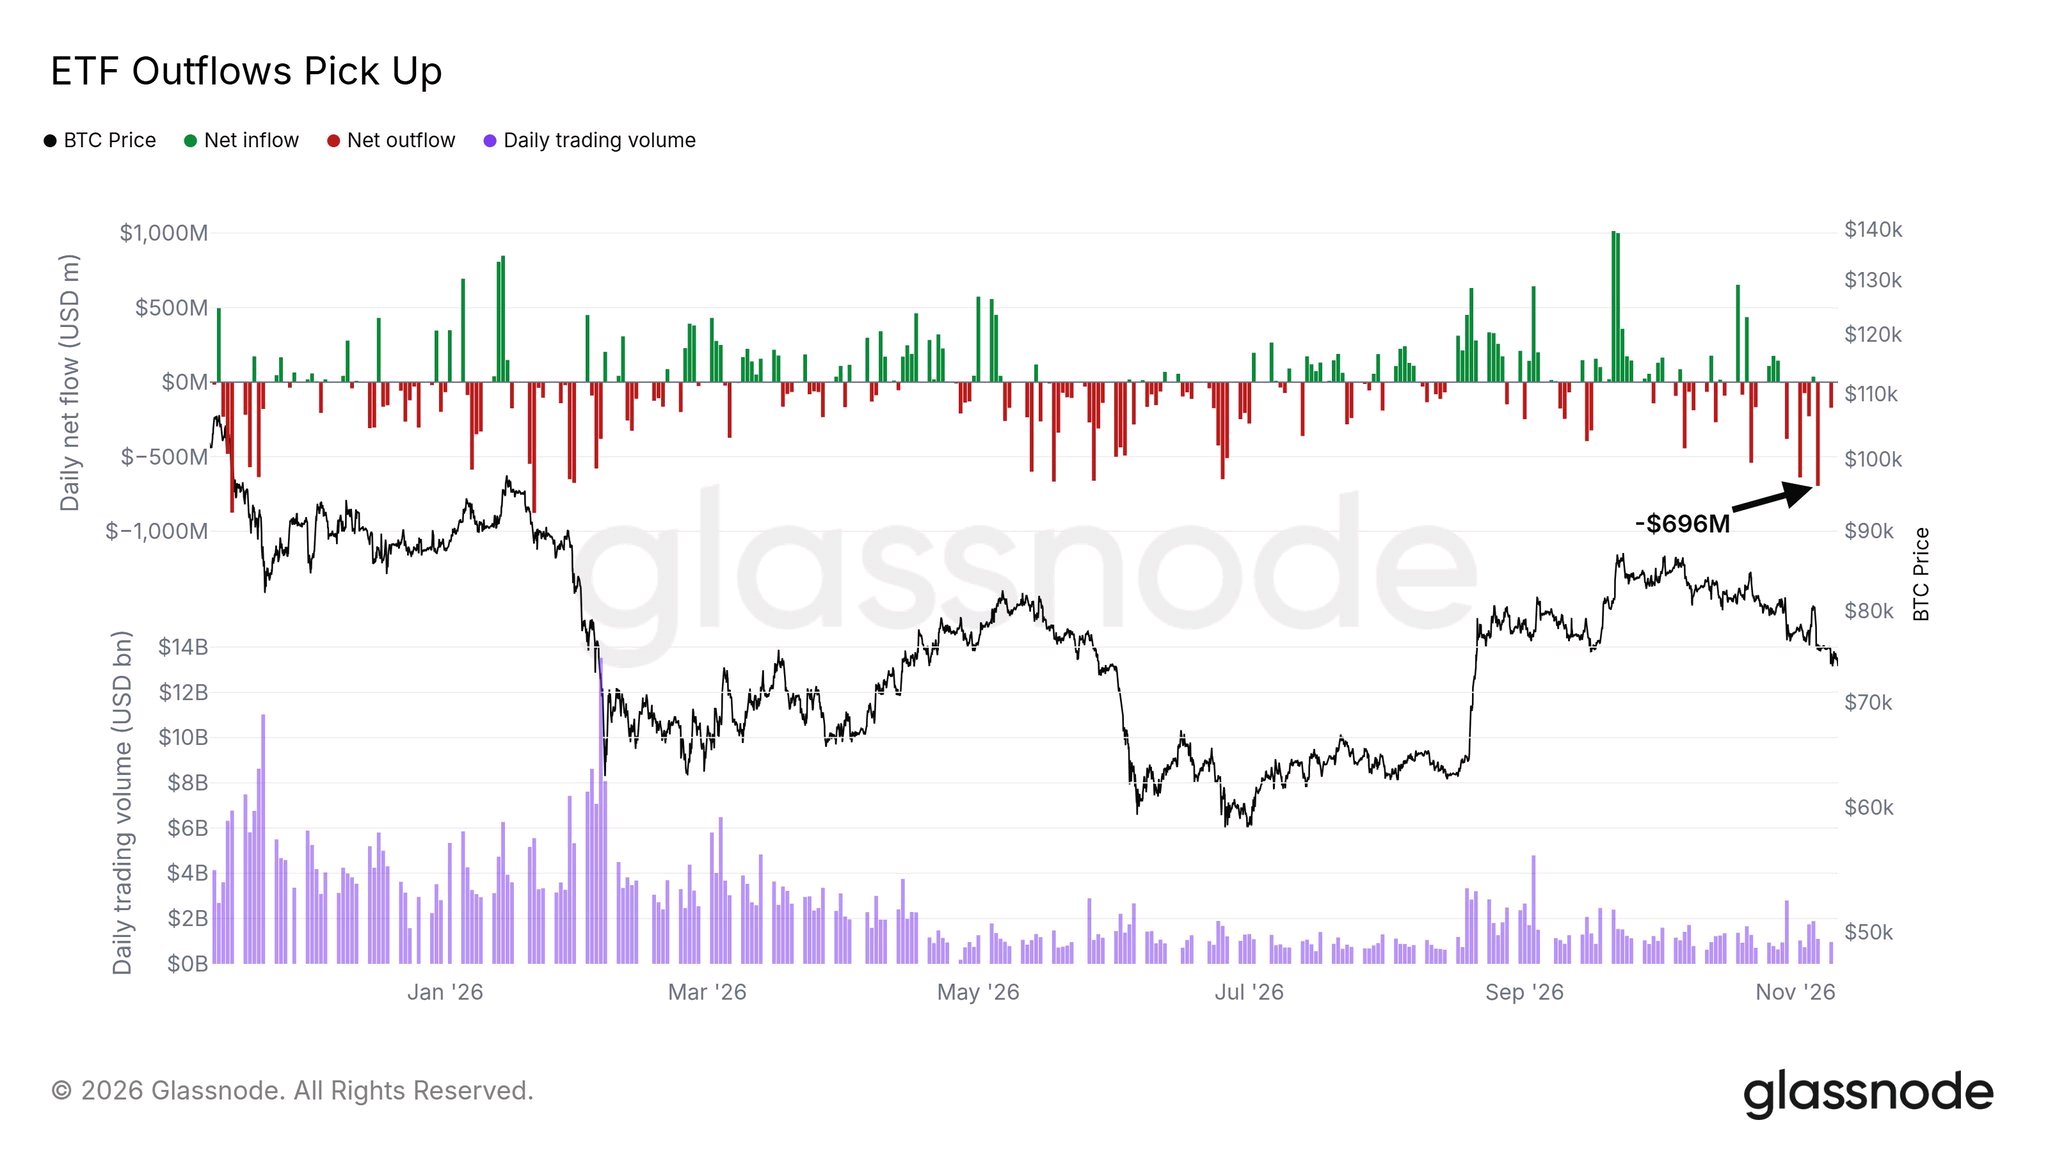
ETF Bitcoin Berbalik Negatif untuk Tahun 2026: -$1,1 Miliar
ETF Bitcoin spot AS kini mencatatkan kerugian untuk tahun 2026. Data Farside, yang dikutip oleh Cointelegraph, menunjukkan arus keluar bersih sekitar $1,1 miliar hingga 9 November.BTCUSDT Menjelang awal November di tahun 2024 dan 2025, dana-dana ini telah mencatatkan arus masuk sekitar $25 miliar. Penurunan ini terjadi dengan cepat. SoSoValue mencatat angka -$502 juta untuk tahun 2026 hingga 5 November. The Block mencatat angka -$914 juta setelah penurunan -$411,9 juta pada hari Jumat. Penurunan -$201 juta pada hari Senin membawa totalnya menjadi sekitar -$1,1 miliar. Tiga angka. Tiga tanggal. Satu penurunan (menurut perhitungan saya). Sebuah tweet viral menyebutkan bahwa hari Jumat mengalami arus keluar sebesar $696 juta, yang terbesar sejak Januari. Saya tidak dapat memverifikasi hal tersebut. $696,3 juta adalah angka untuk tanggal 25 Juni. Hari dengan arus keluar terbesar yang dapat saya konfirmasi baru-baru ini adalah sebesar $643,3 juta pada 30 Oktober. Itu adalah angka terbesar sejak 25 Juni dan yang terbesar ke-12 sejak peluncuran, menurut SoSoValue melalui CoinDesk. IBIT kini mengalami arus keluar selama tujuh sesi berturut-turut sejak 30 Oktober. Totalnya sekitar $1,66 miliar, menurut Farside. Namun, pergerakannya tidak satu arah. FBTC milik Fidelity mencatatkan arus masuk pada dua hari tersebut. MSBT milik Morgan Stanley telah menarik $783 juta tahun ini. Uang berpindah antar dana selain juga keluar dari dana tersebut. Sebagai gambaran, dana-dana tersebut masih memegang sekitar $95,9 miliar, atau 6,28% dari kapitalisasi pasar Bitcoin. Penurunan sebesar -$1,1 miliar dalam setahun hanya sekitar 1,1% dari total tersebut (menurut perhitungan saya). "Kembali ke arus masuk yang stabil akan meredakan tekanan" adalah pernyataan yang wajar. Namun, ini juga bersifat melingkar. Arus dana telah mengikuti pergerakan harga musim gugur ini. Saya mengamati dua hal. Apakah satu hari arus masuk akan berubah menjadi tren berkelanjutan. Dan apakah rangkaian arus keluar IBIT akhirnya akan berakhir. #WSOT2026 #Pantauan IHK AS November #Oracle20BFundingPlanTestsTheAITrade #Pantauan Pasar Pemilu Paruh Waktu #AnthropicIPOValuationTest


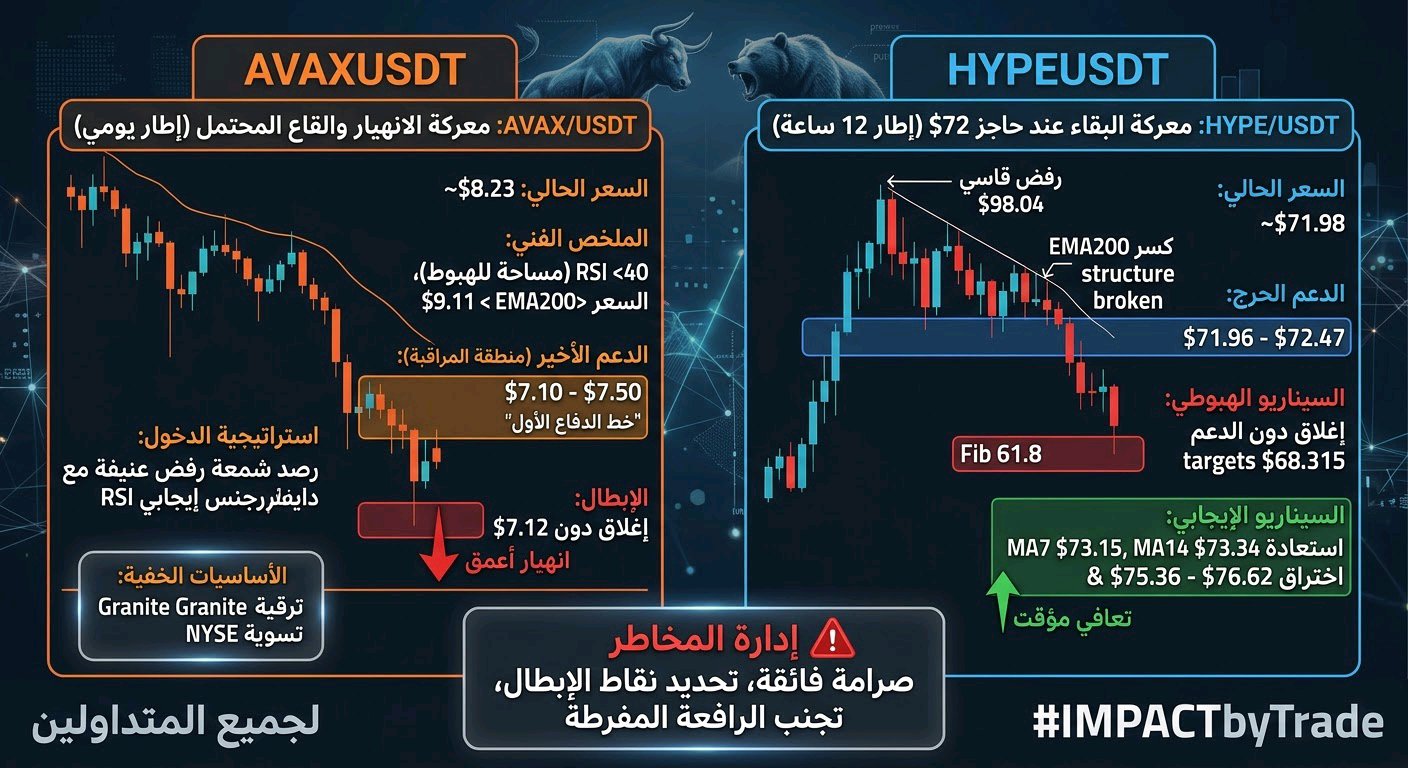
A battle for survival! Will the bottoms hold, or will we wait for the deeper "bleeding"? 🩸📉 AVAXUSDT$AVAXUSDT is teetering on edge of a major Breakdown, is the bottom finally in? Avalanche is trading around $8.23, down a brutal 7.48%, as entire altcoin market bleeds out and sellers relentlessly hammer price lower. chart looks ugly, sentiment is in the gutter, and the bulls are nowhere to be found. 👀 but chart is starting to show a setup worth watching. 😋 what stands out on the 1D chart. RSI hovering near 40, showing that momentum is weak but not yet fully oversold, there is still room for another leg down before a meaningful bounce. eMA200 at $9.11, and price is trading well below it, this is a massive bearish signal, confirming that the macro trend has flipped. support around $7.12-$7.50 green zone that buyers absolutely must defend. 🌊 break below this and it is a freefall. resistance $9.11 (EMA200) overhead ceiling that has been rejecting price for weeks. mACD deep in negative territory with a bearish histogram, confirming that sellers are still in full control. 📰 news nobody is talking about. Avalanche has been rolling out major upgrades, the Granite upgrade introduced sub-second confirmations and biometric authentication for dApps. avalanche foundation is even pursuing a $1 billion institutional capital raise through U.S. corporate treasuries. just recently, reports surfaced that the New York Stock Exchange will settle tokenized stocks on the Avalanche blockchain, a massive validation of the network's infrastructure. yet despite this barrage of bullish fundamentals, the price keeps bleeding, this is the ultimate bearish divergence. good news is being sold, market is telling us that the path of least resistance remains down, at least for now. My trading plan: I'm watching the $7.10-$7.50 green zone closely. This is the last line of defense. If AVAX breaks below $8.00 with volume, I expect a rapid flush into the green zone. That is where I will be watching for a reaction. if price reaches the green zone and shows a violent rejection wick with a bullish divergence on the RSI, that is when start building a position. confirmed breakout above the local resistance after defending this zone would be the signal that the tide has finally turned. however, a clear break and close below $7.12 would invalidate the entire setup and could open the door to a deeper capitulation toward $6. opportunity isn't catching a falling knife. It's waiting for the market to flush out the weak hands and confirm that the green zone is a hard floor. would you consider accumulating AVAX near the $7.50 green zone, or wait for a confirmed breakout above $9.11? 😋 #IMPACTbyTrade 🚨 HYPE at the Edge: Will the $72 Floor Hold? 📉 The battle for HYPE is reaching a make-or-break $HYPEUSDT moment as the token directly tests its most critical support of the season. Currently trading at $71.98 (-5.59% in the 24h cycle on a 46.38M volume), HYPE is staring right down the barrel of a massive trend-continuation or breakdown. There is a deeply concerning, higher-timeframe bearish pattern that most retail traders are failing to acknowledge. The Hidden 12-Hour Trap 🔍 The Failed Reclamation: After its brutal rejection from the $98.04 peak, HYPE attempted a recovery but was aggressively pushed back, printing a prominent lower high directly into a heavy supply zone. The Structure Break: This drop wasn't just a simple rejection. The key trigger was when the price broke down from the EMA 200, severely damaging its daily market structure. Volume and Price: Volume compression alongside sustained lower highs indicates that sell-side pressure on relief bounces is far outpacing new buyers. HYPE recently fell right through its $73.57 intraday target and is now actively testing the $71.96–$72.47 floor. Critical Trading Scenarios & Invalidation 🎯 ($HYPE$HYPEUSDT USDT) 📉 Bearish Target ($68.315) 🔴 If HYPE fails to gain buy-side traction here and suffers a decisive close below the $72.00–$72.47 zone, the macro bullish case is delayed. This failure would strongly confirm a deeper slide down to the $68.315 Fibonacci target, sweeping historical liquidity. Bullish Invalidation & Relief Target ($75.36 – $76.62) 🟢 To invalidate the downward channel, bulls must orchestrate a high-volume reversal, reclaiming MA7 ($73.15) and MA14 ($73.34) to force a daily breakout above the $75.362–$76.62 resistance cluster. That's where the actual target for a temporary recovery sits, but this requires genuine spot absorption. Mindset Warning 💡 HYPE has shown how quickly its momentum can evaporate. Always preserve capital, manage your leverage defensively, and identify your invalidation mark before you enter a position. Are we witnessing the final flush before a relief bounce, or is HYPE about to lose the $72 floor and tumble deeper? Drop your setup below 👇! #IMPACTbyTrade #WSOT2026 #WSOTPicktoEarn10U #BybitAIEvolving #مراقبة سوق الانتخابات النصفية #ByXIMPACT

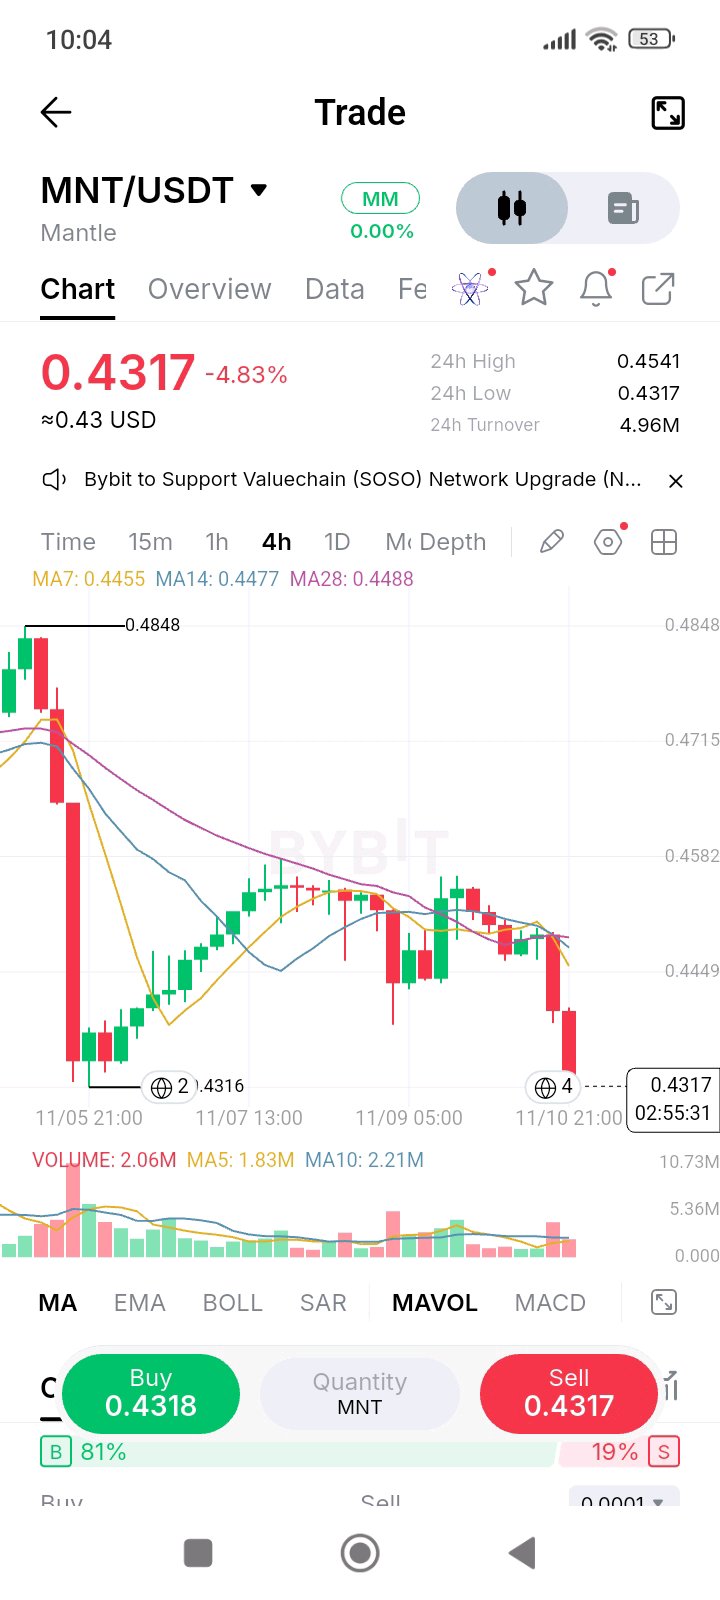
$MNT at $0.4317: Will Buyers Defend Support?
$MNT Under Pressure! Can Buyers Defend $0.4316? 👀 I’ve been watching $MNT closely, and this latest move is definitely not something I want to ignore. Mantle has faced serious selling pressure after failing to sustain its recovery, and now the market is testing an important support zone. $MNT is trading around $0.4317, down nearly 4.83%. After recovering from the previous sharp drop, price spent time consolidating around $0.445–$0.455, but sellers have stepped back in and pushed it toward the recent low. This tells me buyers are losing short-term control. 📊 The technical picture isn't looking comfortable. On the 4H chart, MA7 sits at $0.4455, MA14 at $0.4477, and MA28 at $0.4488. Price is below all three averages, showing bearish momentum. 🐋 I don't have confirmed whale-flow or token-unlock data, so I'm not going to invent a story. Volume and buyer absorption around support are what I want to monitor next. 🎯 Key levels I'm watching: * Support: $0.4316 * Resistance: $0.4455–$0.4488 * Breakout level: $0.4541 * Next upside target: $0.4541 on a successful recovery. 🔥 If $0.4316 breaks decisively, further downside pressure could follow. But if buyers defend this zone and reclaim the moving averages, a recovery becomes interesting. I'm still watching $MNT. No blind entries, no chasing candles. Will buyers defend this support, or are sellers preparing another leg down? #WSOTPicktoEarn10U #OilVolatilityTracksIranPeaceTalks #Oracle20BFundingPlanTestsTheAITrade #MidtermsMarketWatch

Выбор NYSE для AVAX и взлет GRAM 🚀
Всем привет! Короткий вечерний дайджест рынка с самыми важными событиями из вашего списка, которые выделяются на фоне сегодняшней волатильности: AVAX демонстрирует уверенный рост на повышенных объемах вопреки общей коррекции рынка. Главным драйвером послужила новость о том, что Нью-Йоркская фондовая биржа (NYSE) выбрала блокчейн Avalanche в качестве расчетной сети для своей будущей круглосуточной платформы торговли токенизированными ценными бумагами. GRAM стал главным лидером дня среди альткоинов, прибавив почти 9% за последние 24 часа на фоне охлаждения остального рынка. Монета уверенно удерживает внимание трейдеров и демонстрирует лучшую суточную динамику среди отслеживаемых активов. Не финансовый совет, просто делюсь тем, что попало в поле зрения. Всем отличного вечера и профитных торгов! 👍 #Наблюдение за рынком в период промежуточных выборов #ByX $AVAXUSDT $GRAMUSDT
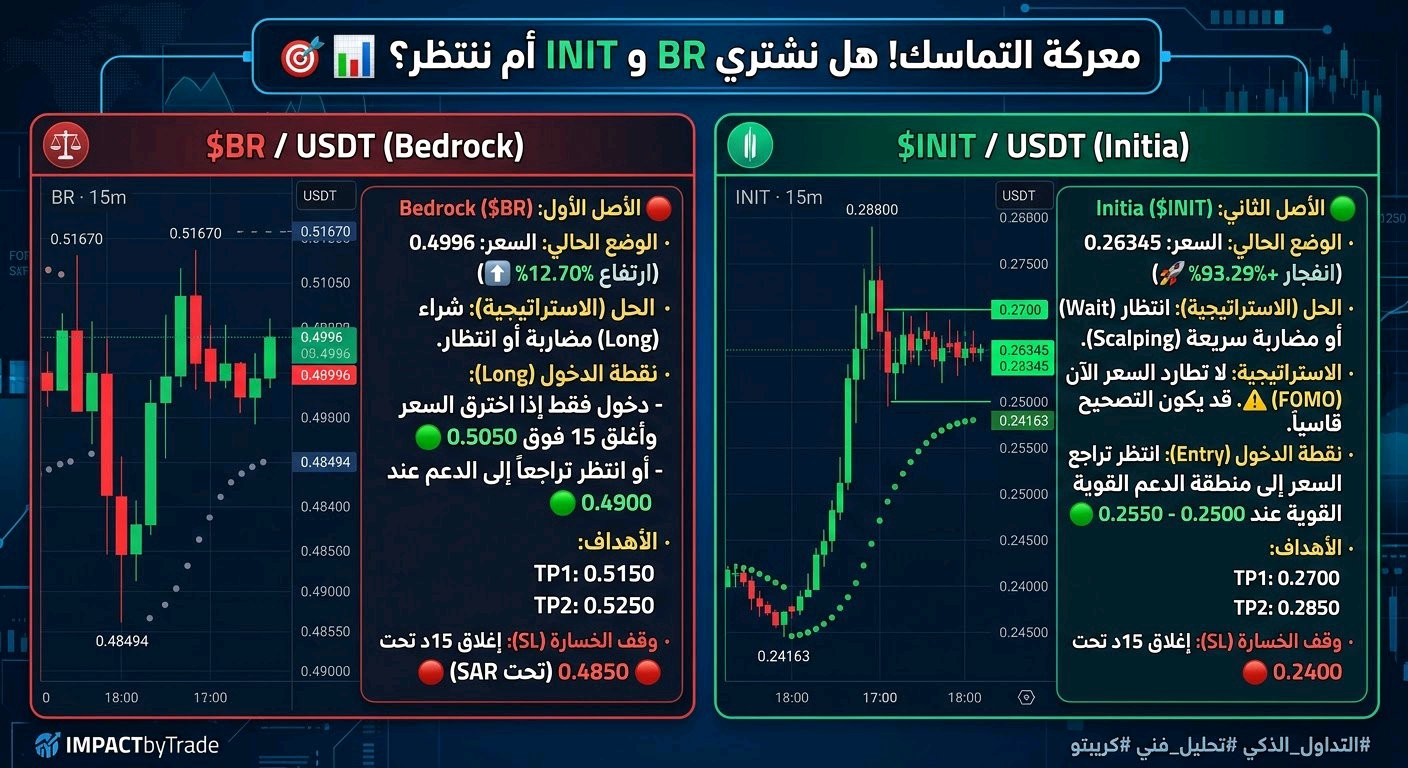
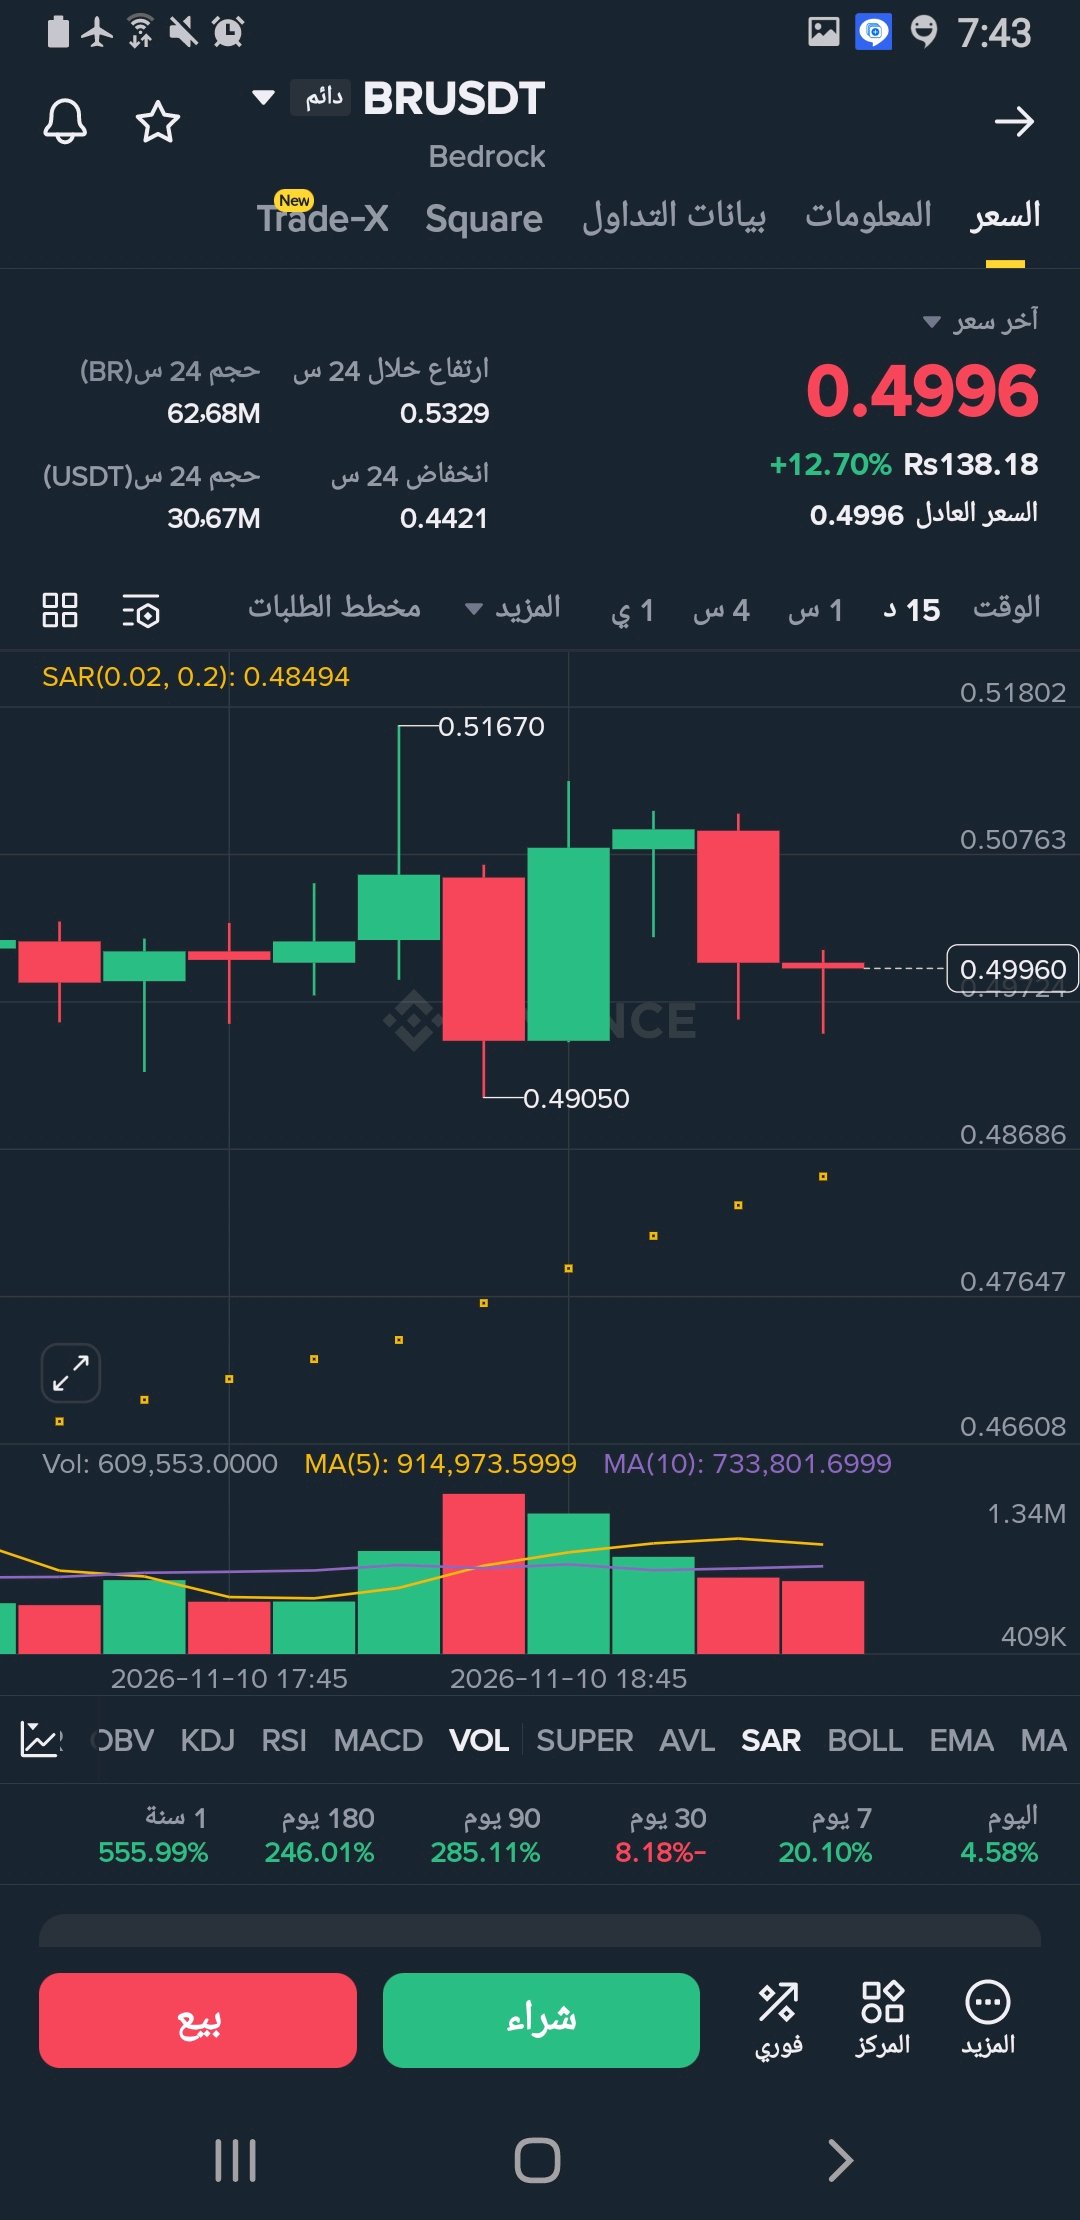
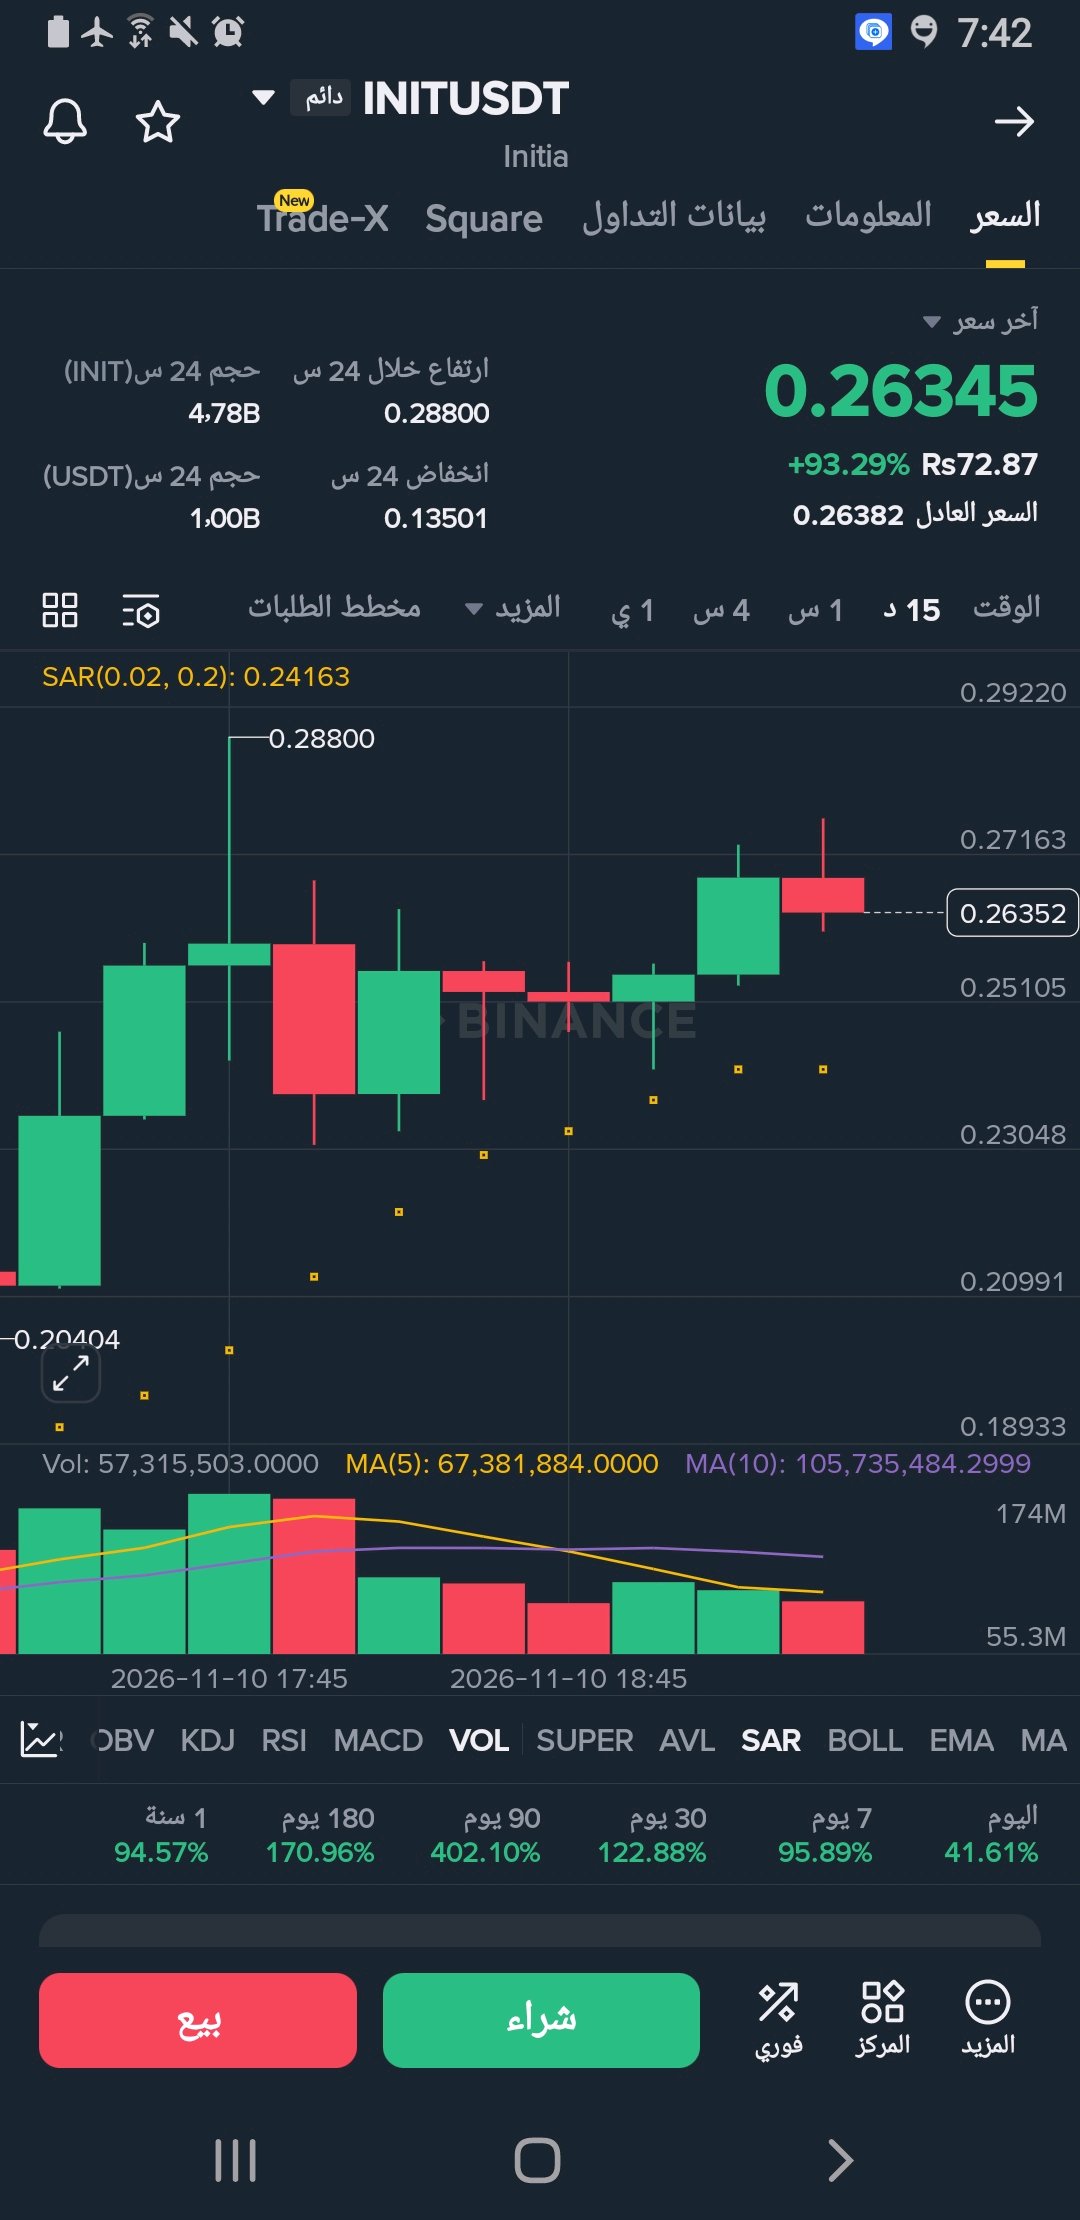
#IMPACTbyTrade Pertarungan demi Konsistensi! Haruskah kita beli BR$BRUSDT dan $INITUSDT INIT atau menunggu? 🎯📊 Halo trader! Hari ini kita sedang meninjau dua grafik yang mencerminkan fluktuasi tajam pada timeframe 15 menit. Kedua mata uang ini menunjukkan volatilitas yang signifikan, dan prosesnya memerlukan ketepatan dan kehati-hatian. Berikut adalah solusi trading (rencana aksi) untuk masing-masing: 🔴 Aset Pertama: $BR/USDT (Bedrock) · Situasi Saat Ini: Harga di 0,4996 (naik +12,70%). · Analisis Teknis: Mata uang ini mengalami volatilitas ekstrem, mencapai level tertinggi di 0,51670 lalu turun ke level terendah di 0,49050. Harga saat ini diperdagangkan dalam kisaran sempit (candle merah kecil). Indikator Parabolic SAR berada di bawah harga di 0,48494, mendukung skenario pantulan bullish. Volume rata-rata. · Solusi (Strategi): Beli (Long) secara spekulatif atau menunggu. • Titik Masuk (Long): Hanya masuk jika harga menembus dan menutup candle 15 menit di atas 0,5050. Atau tunggu pullback ke support di 0,4900. • Target 1 (TP1): 0,5150. • Target 2 (TP2): 0,5250. • Stop Loss (SL): Candle 15 menit ditutup di bawah 0,4850 (di bawah indikator SAR). 🟢 Aset Kedua: $INIT/USDT (Initia) • Situasi Saat Ini: Harga di 0,26345 (breakout +93,29%). • Analisis Teknis: Kenaikan Roket! Mencapai level tertinggi di 0,28800 lalu terkoreksi. Saat ini, harga bergerak sideways di antara 0,2500 dan 0,2700. Indikator SAR masih di bawah harga di 0,24163 (sinyal positif). Volume mulai menurun secara bertahap setelah breakout awal. • Solusi (Strategi): Menunggu atau Scalping. Strategi: Jangan kejar harga sekarang (FOMO). Mata uang ini naik +93% dalam satu hari, artinya koreksi bisa terjadi tajam. Titik Masuk: Tunggu harga pullback ke zona support kuat di 0,2500-0,2550. Target 1 (TP1): 0,2700. Target 2 (TP2): 0,2850. Stop Loss (SL): Candle 15 menit ditutup di bawah 0,2400. #WSOT2026 #WSOTPicktoEarn10U #BybitAIEvolving #Pantauan Pasar Pemilu Paruh Waktu @

$ADA | Innovation attracts attention, but adoption is what gives a blockchain lasting relevance. Cardano takes a research-driven approach to development, using its Proof-of-Stake consensus mechanism to secure the network while supporting a growing smart contract ecosystem. Three areas deserve attention: → DeFi growth and active applications. → Developer activity and on-chain usage. → Governance participation and ecosystem expansion. The key challenge is converting technical progress into consistent user demand. For ADA, real adoption matters more than development headlines. #ADA #Cardano #Blockchain #Bybit #ByX #MidtermsMarketWatch
$BTC | Bitcoin's real strength goes beyond price. It's built on scarcity, security, and decentralization. With a fixed maximum supply of 21 million BTC, Bitcoin operates through a Proof-of-Work system that protects its network without central control. What matters now: → Institutional demand and capital flows. → ETF activity and broader market sentiment. → Whether buyers can defend key support levels. Entry zones to monitor: → $75K–$77K: Potential support area. → $72K–$74K: Deeper pullback zone. → $80K–$82K: Recovery and confirmation area. These are observation zones, not guaranteed entry signals. Wait for price confirmation before considering a spot position. Scarcity creates the foundation. Demand drives the market. #BTC #Bitcoin #Bybit #ByX #MidtermsMarketWatch

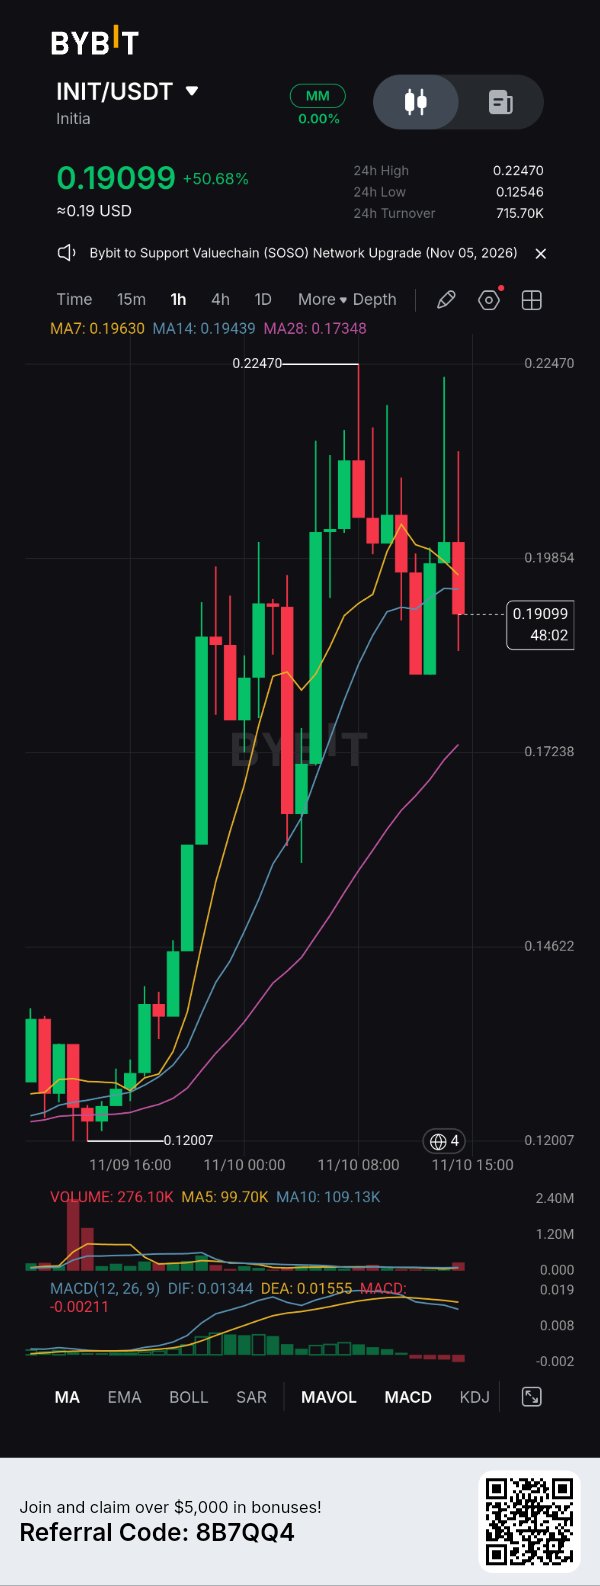
🚀 $INITUSDT: +50,68% — TAPI PERGERAKAN BERIKUTNYA BISA JADI LEBIH MENARIK DARI RELINYA! Beberapa trader merayakan kenaikan 50%. Yang lain langsung mulai bertanya satu hal: Siapa yang masih membeli setelah kenaikan besar ini? 💰 Harga saat ini: $0,19099 📈 Perubahan 24J: +50,68% 🔝 Tertinggi 24J: $0,22470 🔻 Terendah 24J: $0,12546 💵 Volume 24J: $715,70K 🧾 AUDIT RELI INIT telah melakukan pergerakan yang mengesankan, naik dari wilayah harga yang lebih rendah menuju $0,22470 sebelum mengalami pullback. Itu memberi tahu kita bahwa pembeli telah menunjukkan kekuatan yang cukup besar, tetapi penolakan dari harga tertinggi tersebut layak mendapat perhatian. Pasar sekarang sedang memutuskan apakah ini hanya periode pendinginan atau awal dari koreksi yang lebih dalam. 🔍 APA KATA INDIKATOR Moving average: - MA7: $0,19630 - MA14: $0,19439 - MA28: $0,17348 Harga saat ini berada di bawah MA7 dan MA14 tetapi tetap di atas MA28. Struktur pemulihan yang lebih luas masih terlihat, meskipun tekanan jangka pendek telah meningkat. MACD: - DIF: 0,01344 - DEA: 0,01555 - Histogram: -0,00211 DIF telah menyilang di bawah DEA, dengan histogram negatif. Momentum jangka pendek melemah. Volume: - Saat ini: 276,10K - MA5: 99,70K - MA10: 109,13K Volume saat ini berada di atas kedua rata-rata. Itu berarti aktivitas tetap tinggi, tetapi volume saja tidak dapat memberi tahu kita apakah pembeli atau penjual yang akan mengendalikan pergerakan berikutnya. 🎯 LEVEL YANG SAYA PANTAU 🟢 $0,19854: Area pemulihan penting pertama. 🚀 $0,22470: Harga tertinggi sebelumnya. Breakout yang meyakinkan dengan pembelian yang berkelanjutan dapat membuka kembali sisi kenaikan. 🛡️ $0,19439–$0,19000: Area untuk dipantau guna percobaan pemulihan potensial. 🔻 $0,17348: MA28, referensi support yang lebih dalam yang penting. Pergerakan berkelanjutan di bawah wilayah ini akan melemahkan struktur pemulihan saat ini. 🧠 KEPUTUSAN TRADER INIT telah memberikan pergerakan besar. Godaannya sekarang adalah untuk langsung masuk karena grafik terlihat menarik. Namun, trader berpengalaman tahu bahwa melewatkan entri lebih baik daripada memaksakannya. Saya sedang mengamati harga untuk merebut kembali rata-rata jangka pendek, MACD untuk membaik, dan volume pembelian untuk mendukung pemulihan. Reli pertama menarik perhatian. Pergerakan berikutnya mengungkapkan siapa yang benar-benar memegang kendali. Trader INIT, apakah kalian menunggu breakout baru di atas $0,22470 atau mencari pullback yang lebih sehat sebelum mempertimbangkan entri? 👀 Analisis berdasarkan grafik 1H yang disediakan. Ini adalah pengamatan teknis, bukan prediksi yang dijamin atau nasihat keuangan. #IMPACTbyTrade #BybitAIEvolving #WSOTPicktoEarn10U #Pantauan Pasar Pemilu Paruh Waktu


SUI
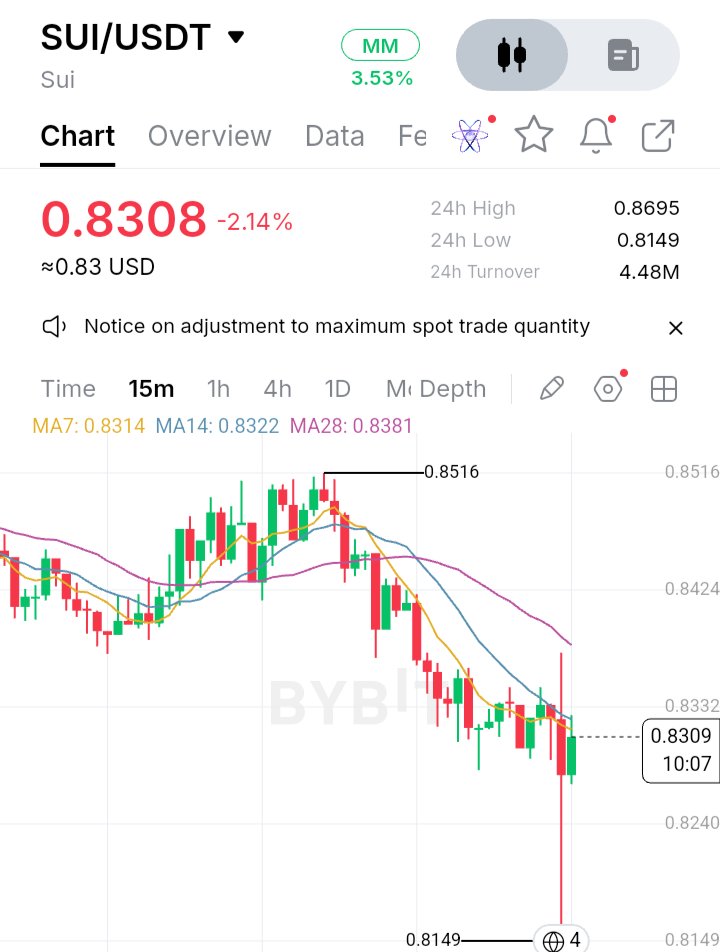
$SUIUSDT I used to think a falling price automatically meant sellers were winning. But looking at SUI's latest 15-minute chart, I'm paying closer attention to what happens after a sharp sell-off. SUI is trading around $0.8308, down 2.14%, after losing momentum from its recent high near $0.8516. What caught my attention is the aggressive downside move followed by a long lower wick reaching $0.8149. That wick is worth watching. It suggests price moved significantly lower before recovering, indicating that buyers responded at those levels. However, I wouldn't call it a confirmed reversal just yet. Another detail reinforces the cautious outlook. SUI is trading below its MA7 at $0.8314, MA14 at $0.8322 and MA28 at $0.8381. This alignment shows that short-term momentum remains under pressure. For me, $0.8149 is the important downside reference, while $0.8381 is the level bulls need to reclaim to improve the short-term structure. I want to see whether buyers can turn this initial reaction into sustained recovery. A single lower wick can attract attention, but follow-through is what gives it meaning. I'm watching the next few candles closely. #MidtermsMarketWatch #WSOTPicktoEarn10U #NovUSCPIWatch


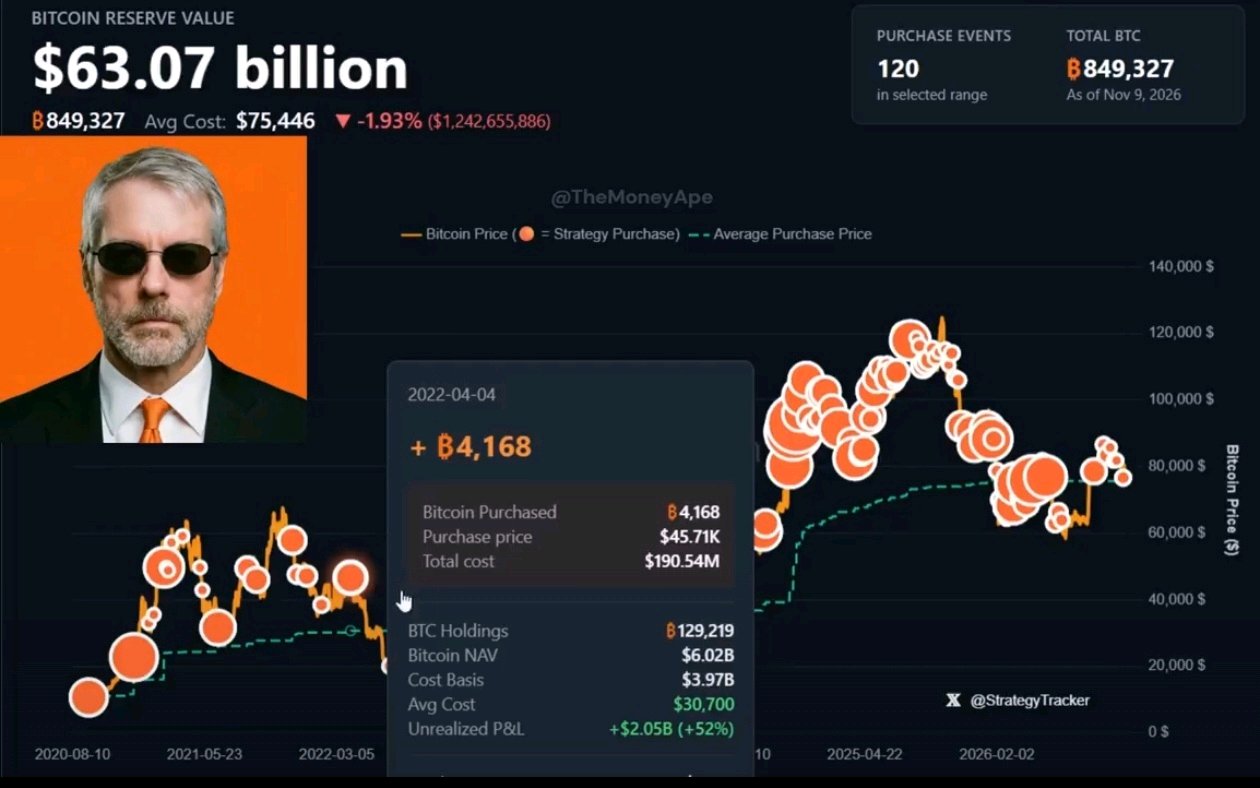
🚨 SEMAKIN BESAR MEREKA MENJUAL, SEMAKIN BANYAK SAYLOR MEMBELI! 🚀
1.037 $BTCUSDT ditambahkan ke dalam tas senilai $77,60 JUTA! 💰 Strategi sekarang memegang 850.364 BTC yang sangat besar. Sementara para 'paper hands' panik dan menjual, para pemegang jangka panjang terus mengakumulasi. 🔥 Setiap penurunan adalah peluang. 🔥 Setiap aksi jual menciptakan akumulasi. 🔥 Pasokan Bitcoin semakin ketat. UNTUK SETIAP PENJUAL, ADA SAYLOR. 🧡 PARA BULL BTC BELUM SELESAI! 🚀📈 #WSOT2026 #WSOTPicktoEarn10U #Pantauan Pasar Pemilu Paruh Waktu
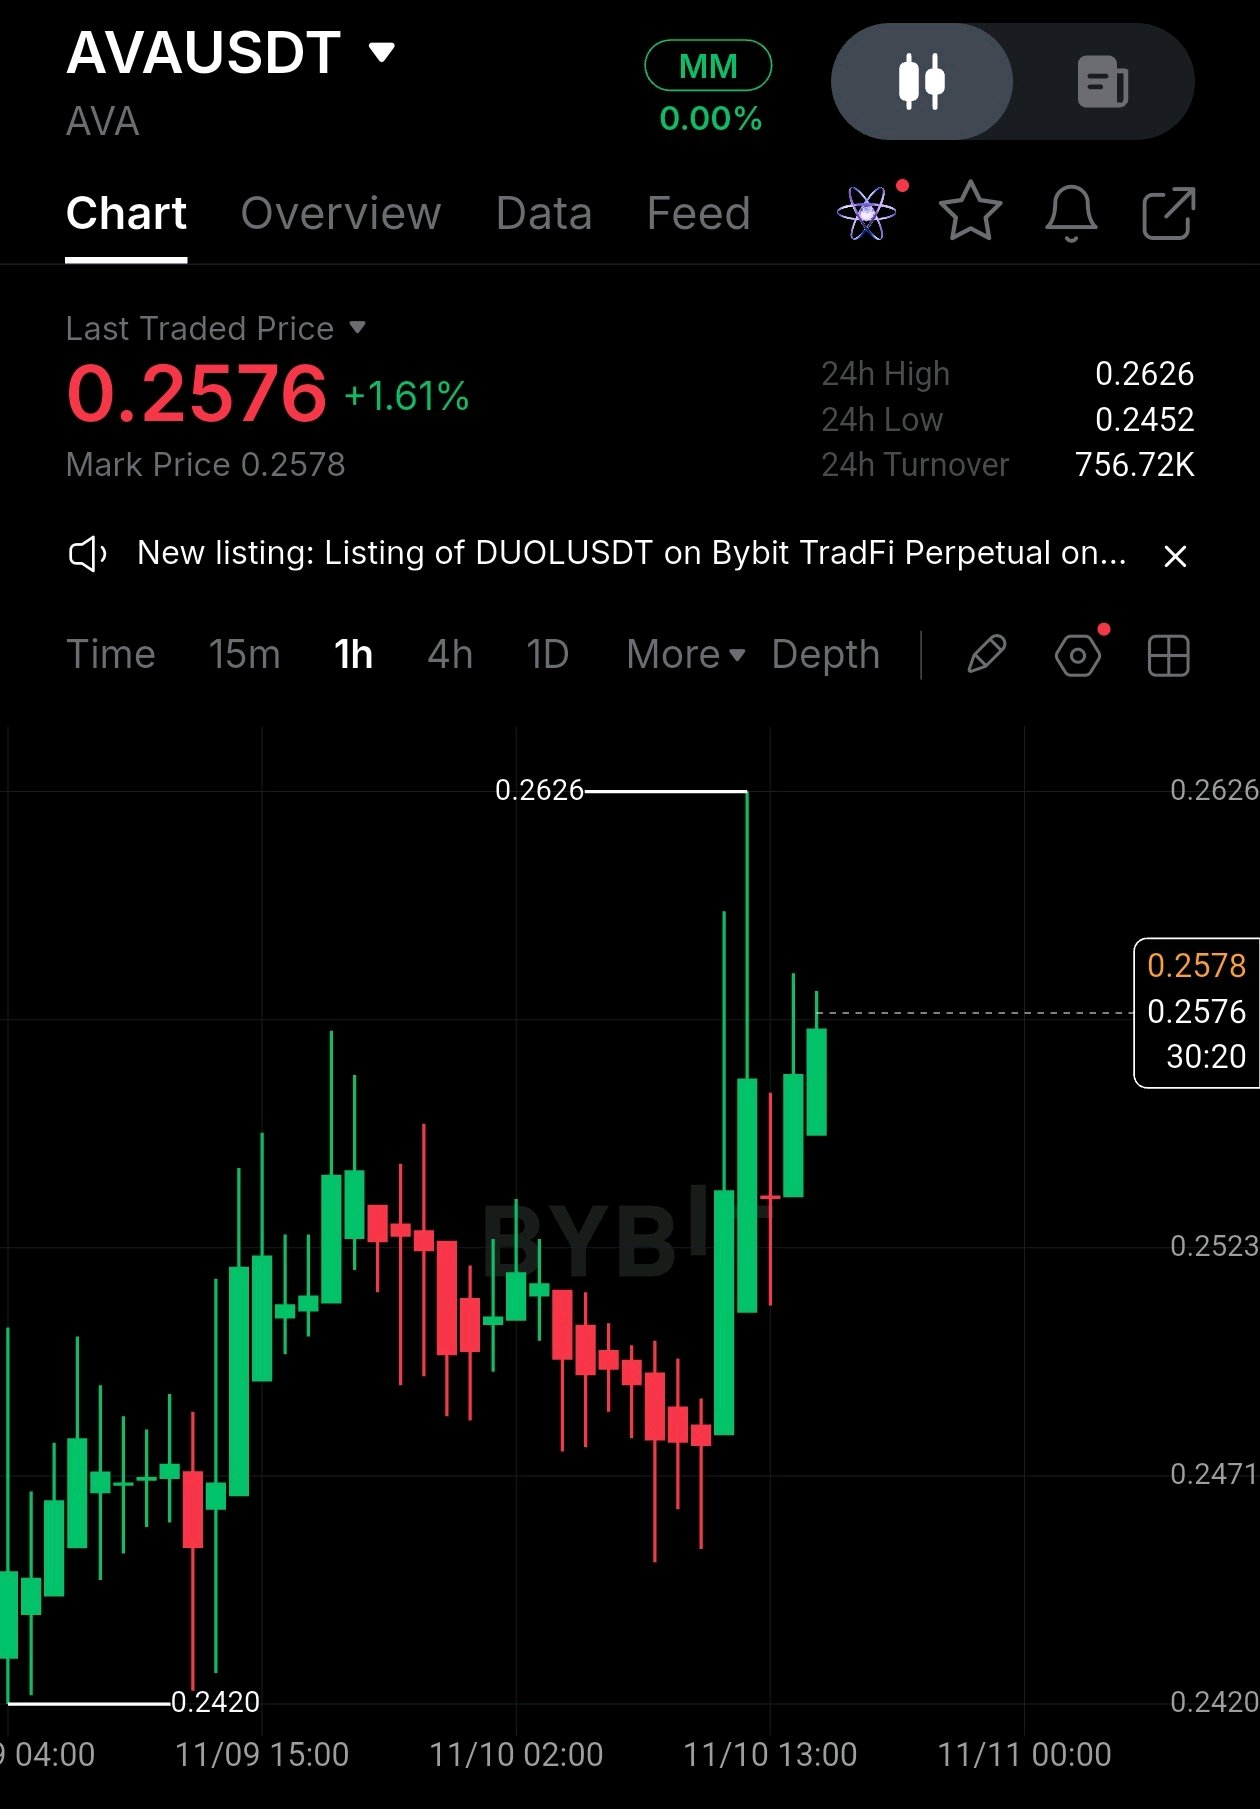
Guys, saya sedang memantau setup LONG di $AVA nih. 👀🔥 $AVAUSDT | Perp 🎯 TP: 0.2620 🛑 SL: 0.2518 📍 Zona Entry: 0.2545 – 0.2560 Yang saya suka di sini bukan cuma momentum bullish-nya, tapi cara harga bereaksi setelah tekanan jual baru-baru ini. Penjual mencoba mendorong AVA lebih rendah, tapi pembeli masuk dengan agresif di sekitar area 0.2470–0.2480. Lihat pemulihannya! 💥 Candle bullish yang kuat muncul, mendorong harga kembali ke arah 0.2576. Ini menunjukkan pembeli mulai mengambil kendali dalam struktur jangka pendek. Sekarang, resistance penting ada di sekitar 0.2626. Itu adalah harga tertinggi sebelumnya, dan likuiditas mungkin tertahan di atas level tersebut. Market maker mungkin akan mengincar area itu jika tekanan beli terus berlanjut. Jadi pola pikir saya sederhana: Jika AVA bertahan di atas 0.2545 dan pembeli mempertahankan momentum, saya menunggu pergerakan lain menuju 0.2620. Breakout 1 jam yang bersih di atas 0.2626 bisa membuka peluang untuk kenaikan lebih lanjut. Tapi jika harga kehilangan level 0.2520, setup bullish jadi lemah, dan koreksi yang lebih dalam bisa terjadi. Saya tidak tertarik mengejar candle hijau sembarangan. Saya ingin melihat bagaimana harga bereaksi di sekitar level-level penting. Sabar dulu, eksekusi kemudian. 😮💨📈 Bagaimana menurut kalian? 👇 Apakah $AVA akan menuju 0.2620 dan breakout, atau kita akan mengalami koreksi dulu? 🚀 #Pantauan IHK AS November #Pantauan Pasar Pemilu Paruh Waktu

PEPE Is Still on My Watchlist…🐸!!
Honestly, I think $PEPEUSDT is one of those coins people either love or completely ignore. When the market is green, everyone talks about it. When the market turns red, most people disappear. But here's what I'm curious about… Will PEPE surprise everyone again in the next bull run, or has its biggest moment already passed? I'm watching, not predicting. What's your opinion on PEPE? $HYPEUSDT #USPayrollsAndRateDecisionsDriveMacroWeek #MidtermsMarketWatch #Oracle20BFundingPlanTestsTheAITrade #WSOT2026 #OilVolatilityTracksIranPeaceTalks


$INJUSDT is up 10.34% over the last 7 days, but its derivatives market is telling a less convincing story: futures volume reached $235.69M against just $33.12M in spot volume on November 10. That is a 7.1x difference. The rally is attracting traders, but genuine spot demand is not keeping pace. There is a fundamental reason INJ remains interesting. According to its September 2026 SEC filing, Injective had approximately 90,000 daily active wallets during Q3 and had facilitated more than $75B in cumulative spot trading volume. Its community buyback mechanism also connects application-generated fees with INJ accumulation and redistribution. However, adoption does not automatically translate into immediate price appreciation. The current market structure needs attention. INJ is trading around $8.02, with a 24-hour range of $7.82–$8.29. Meanwhile, aggregate futures open interest has declined 5.42% to approximately $149.39M. For the next 24–72 hours, watch the $8.25 resistance zone. A convincing breakout with stronger spot participation could open $8.55, followed by $8.80. On the downside, $7.82 is the immediate support. A decisive break below it invalidates the recovery setup. Risk: leveraged positioning could unwind before spot buyers step in. INJ needs real spot demand to validate this recovery. Until then, the rally remains vulnerable to a derivatives-driven reversal. #MidtermsMarketWatch


NVDAXUSDT Bottom Formation & Resistance Retest
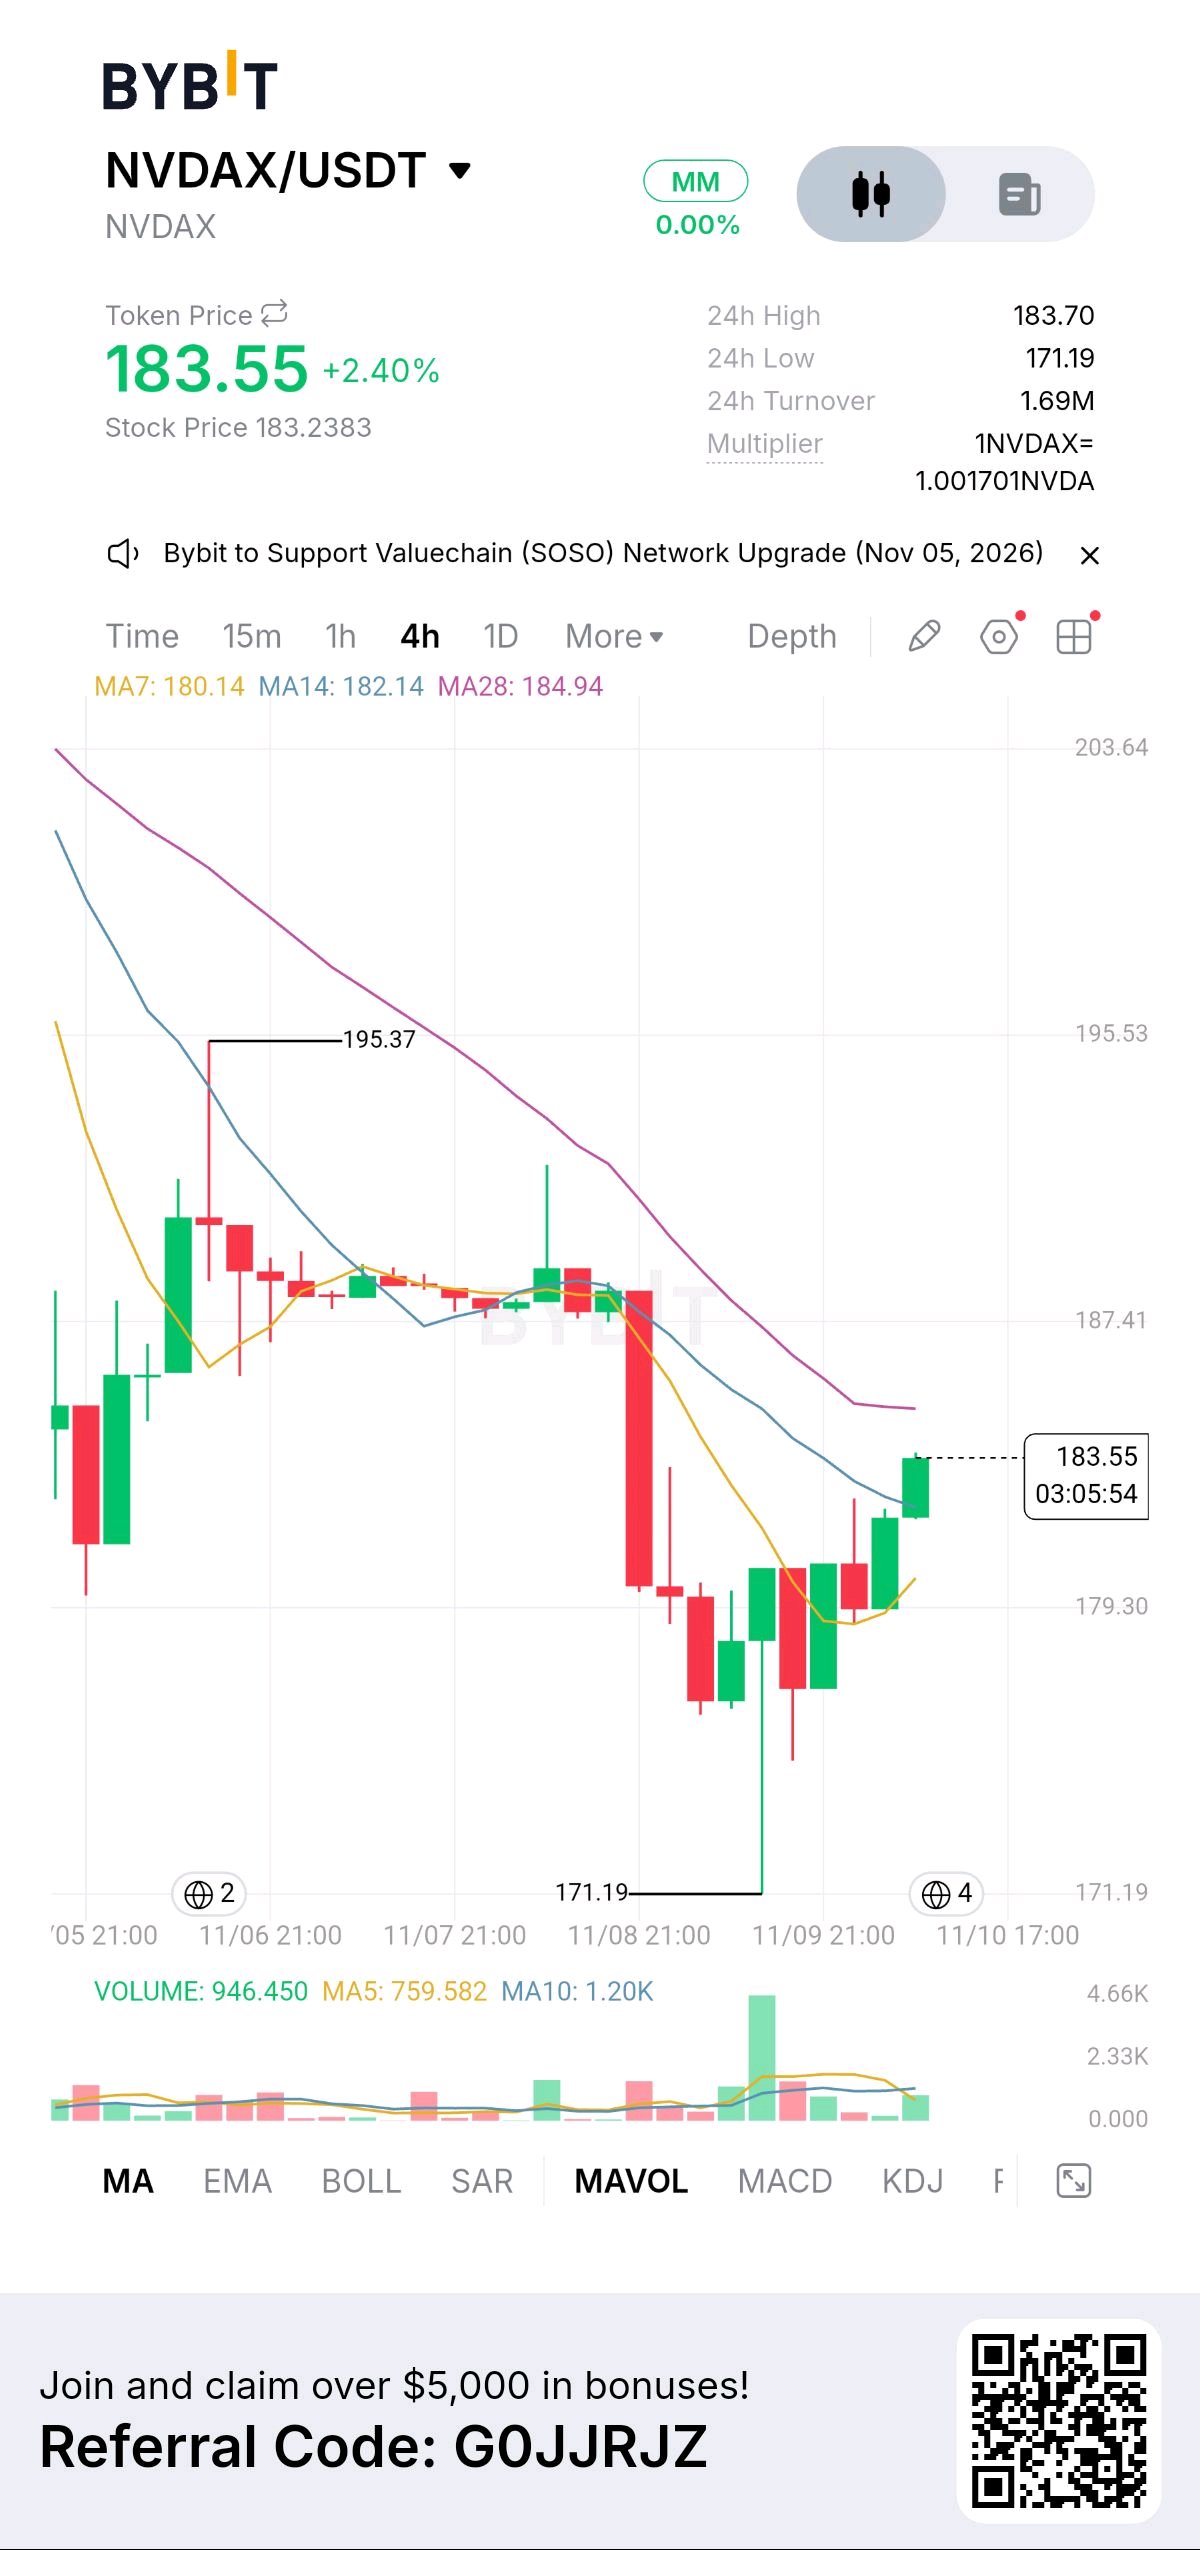
📈 $NVDAXUSDT is showing signs of a potential trend reversal on the 4-hour timeframe, currently trading at 183.55 (+2.40%). After a prolonged downtrend, the asset established a sharp local support floor at 171.19 and has staged a steady recovery, now testing immediate overhead resistance. ▪️ Technical Setup: The asset is attempting to reclaim its short-term moving averages. The price is currently trading above the MA7 (180.14) and MA14 (182.14), but faces immediate pressure from the MA28 at 184.94. The tight cluster of these MAs suggests a consolidation phase before the next major move. ▪️ Indicators: 24h turnover stands at 1.69M with a 24h low of 171.19. The volume profile shows a notable spike in buying volume during the initial bounce from the floor, indicating buyers are actively stepping in to defend the 180.00 psychological level. ▪️ Outlook: A clean 4-hour close above the 184.94 (MA28) ceiling is critical to confirm a bullish continuation toward the previous high of 195.37. Conversely, if rejected here, the price may retest the MA7 dynamic support to build further momentum. ⚠️ Risk Disclosure: High-volatility markets can experience rapid price swings. This analysis is for educational purposes only and does not constitute financial advice. #WSOT2026 #BybitAIEvolving #MidtermsMarketWatch


اخبار،
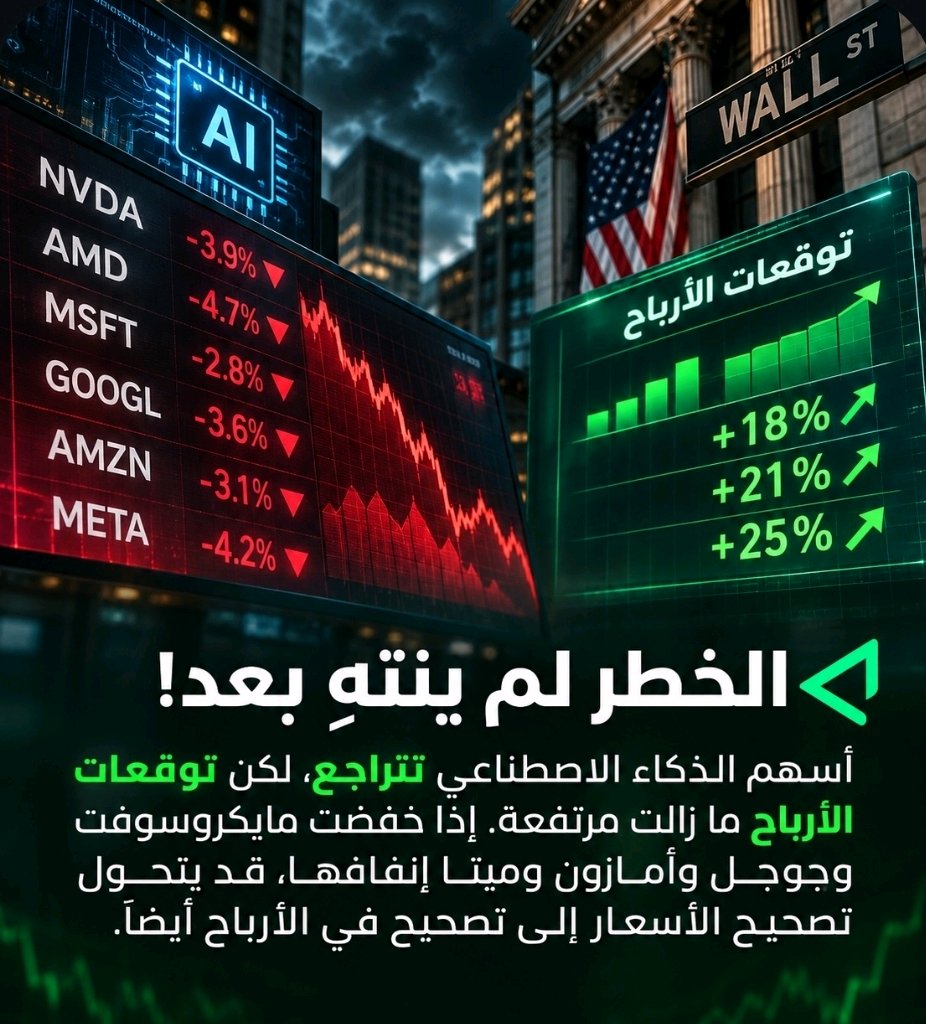
🇺🇸 وول ستريت تخسر.. هل أوروبا تكسب؟ 🇪🇺 مع استمرار الضغوط على أسهم الذكاء الاصطناعي الأمريكية، تتجه الأنظار إلى البورصات الأوروبية! Cap..ital Econ..omics تتوقع تفوق أوروبا نسبيًا إذا استمر انكماش فقاعة الذكاء الاصطناعي، بفضل تنوع قطاعاتها وقلة اعتمادها على عمالقة التكنولوجيا. فهل أوروبا هي الفرصة القادمة؟ #مراقبة سوق الانتخابات النصفية $NVDAXUSDT $XRPUSDT



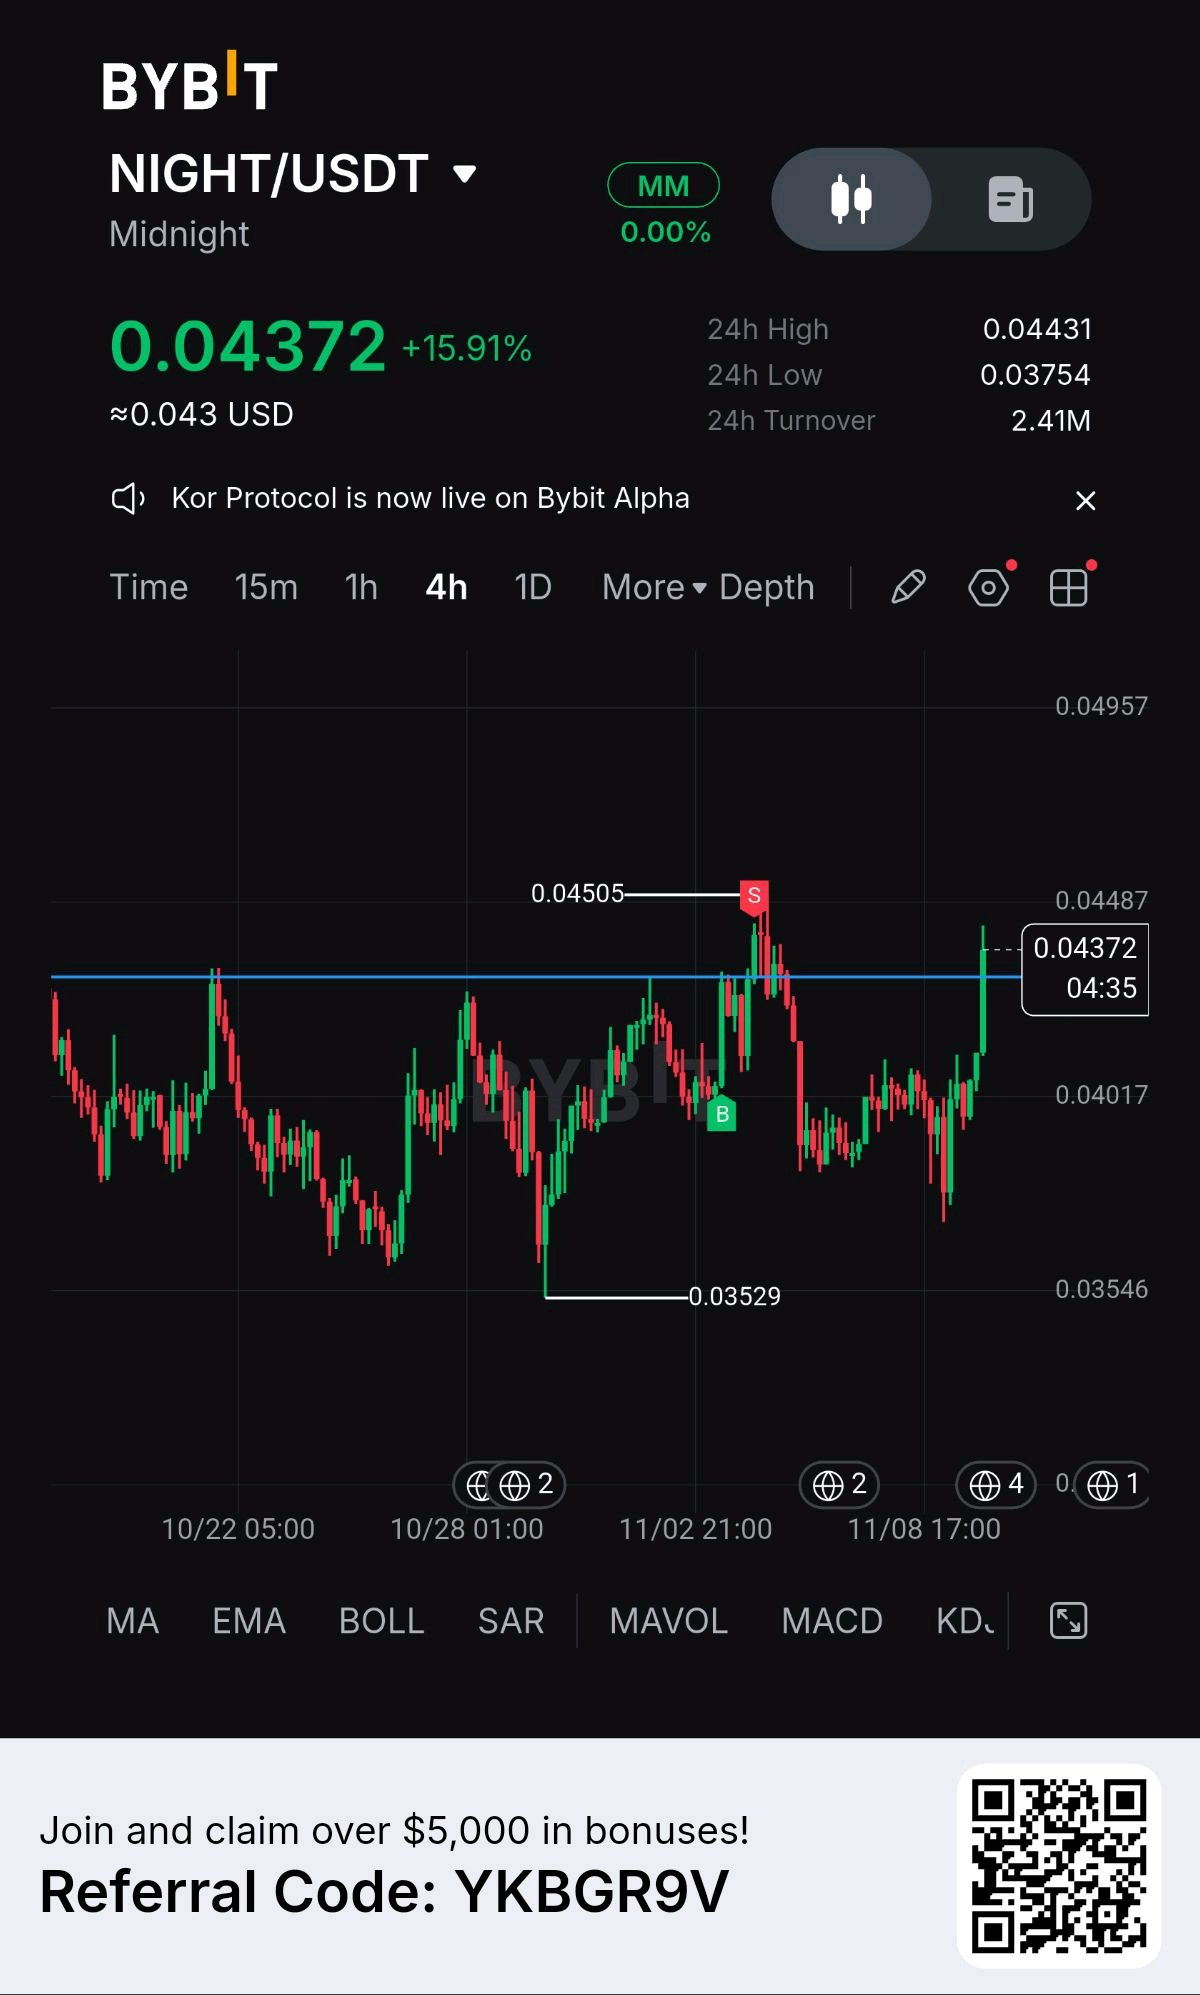
$NIGHT: Breakout at the $0.0435 Line
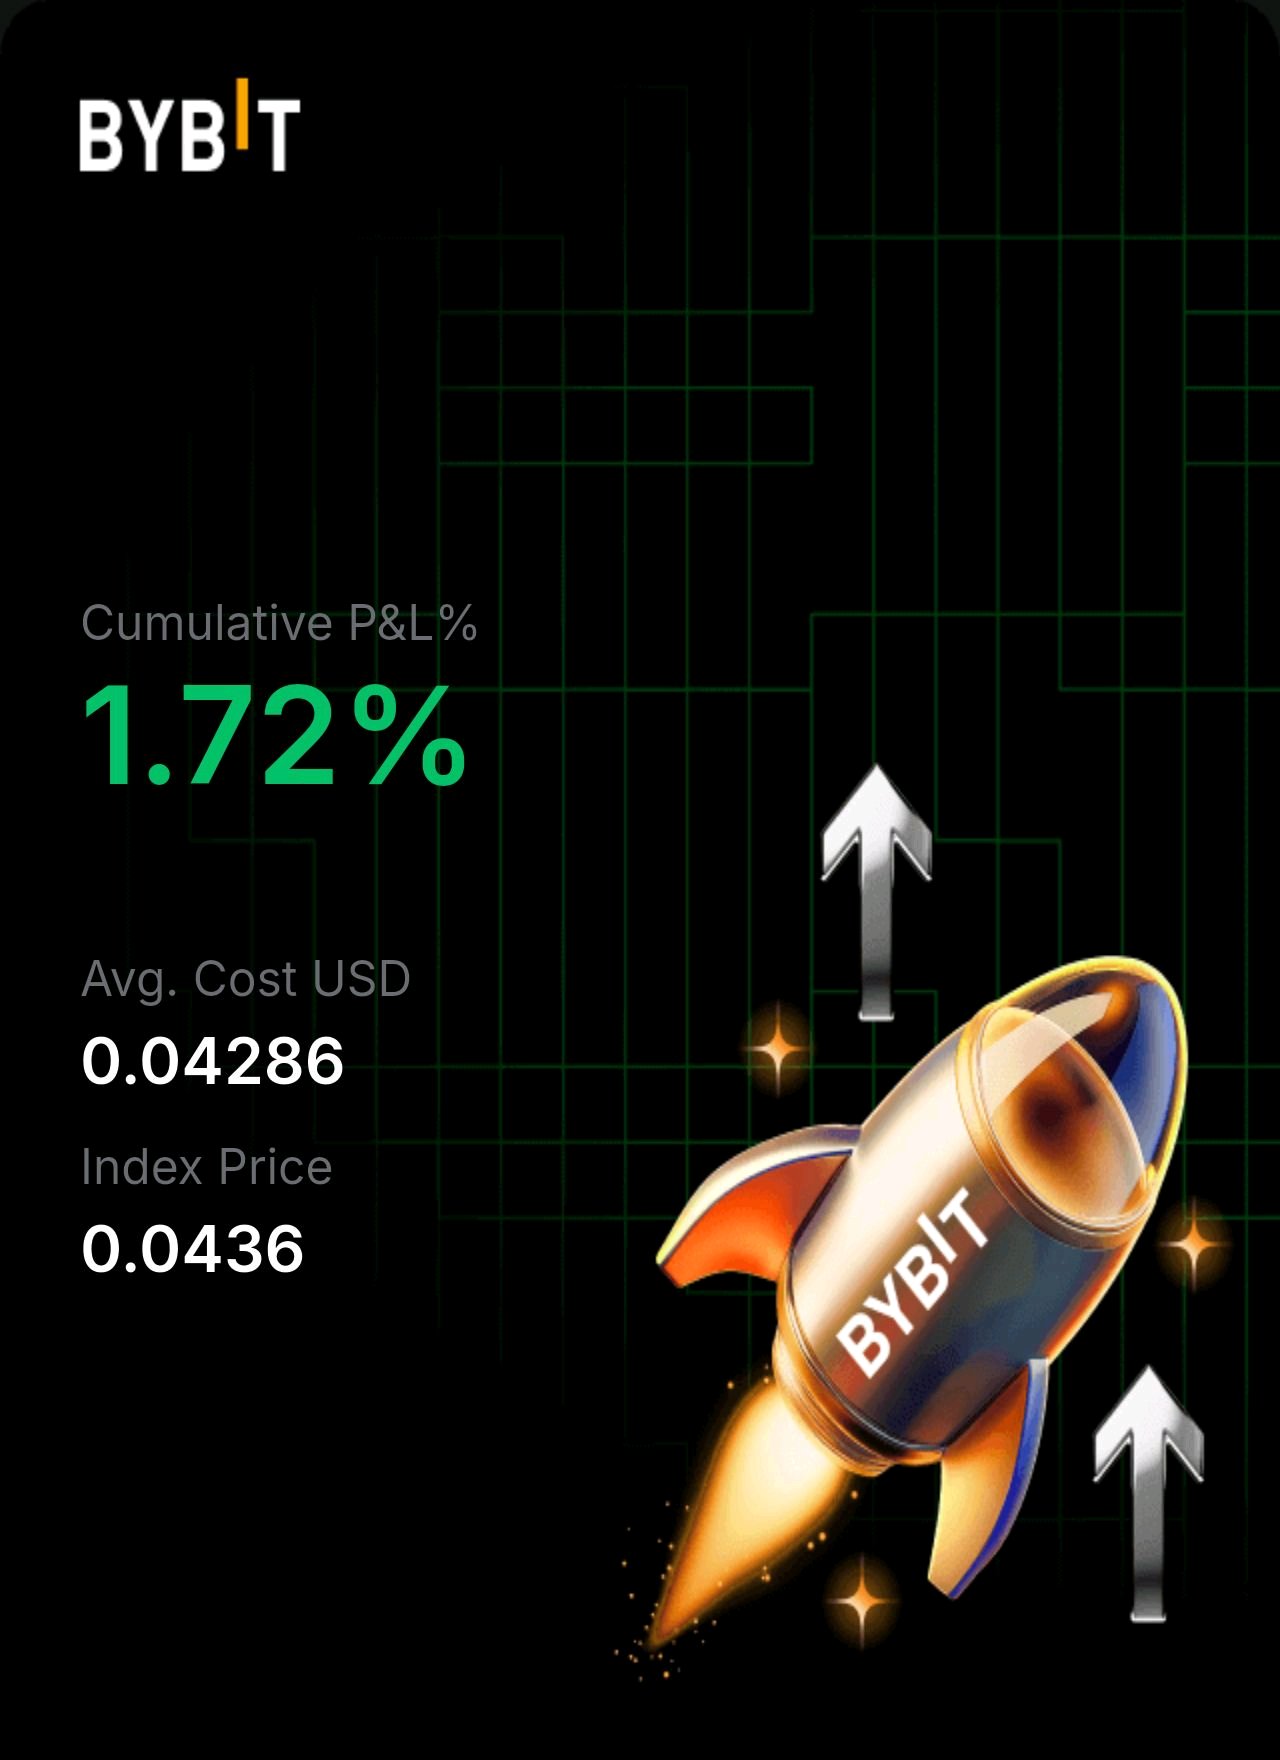
$NIGHT is up almost 16% and pressing against the same resistance that has capped it for two weeks. I'm holding a moonbag, so this level matters to me. What the 4H chart shows: Price is $0.04372 after bouncing from a 24h low of $0.03754. The bounce came with a strong green candle that pushed right into the $0.0435 area, which is the horizontal line that stopped the last two rallies. The high from Nov 4 to 5 was $0.04505, and the swing low is $0.03529 from late October. Price is still inside a two-week range, so this is a test of resistance, not a confirmed breakout. 24h turnover is $2.41M. What's happening: The news flow is strong. Charles Hoskinson said on Nov 8 that Midnight could surpass Cardano's market cap, and that kind of headline fuels speculation. On the fundamentals side, Midnight completed its Ledger 9 mainnet upgrade on Nov 6, adding tools for private cross-chain deposits. The Sig Network launched on Oct 29 to bring Ethereum assets in, and the mainnet has passed one million transactions. Monument Bank's plan to tokenize up to £250M in deposits on Midnight was delayed to November, so it is a potential catalyst this month. About 16.6B of the 24B NIGHT supply is circulating, so the market cap is over $700M. NIGHT is still more than 60% below its $0.1179 record. China and the global backdrop: China's Q3 GDP grew 4.5%, beating forecasts, and the yuan hit a 4-year high. For China, that means steadier policy and less need for emergency stimulus. For the world, stronger Asian growth supports risk appetite, and Asian exchange access matters for NIGHT, which listed on Japan's OKCoinJapan on Oct 13 and on S.BLOX, run by a Sony Group company, in August. The link is indirect, since China restricts crypto trading, and the beat is export-led with retail sales up only 1.1%. NIGHT trades closely with Cardano, so ADA and the Fed matter more than China data. Key levels: Support: $0.04017 first, then $0.03754 (the 24h low), then $0.03529 (the late-October low). Resistance: $0.0435 to $0.0440 first, then $0.04505, then a long gap toward the $0.0600 area before the $0.1179 record. I want a 4H close above $0.04505 on rising volume before I call this a real breakout. Scenarios: Bull: the Monument Bank launch or other Midnight news lands, buyers hold above $0.0435, and NIGHT breaks $0.04505. Base: NIGHT keeps ranging between $0.0375 and $0.0450 as the market waits for catalysts. Bear: the breakout fails at $0.0435, $0.04017 breaks, and NIGHT retests the $0.0375 to $0.0353 zone. Honest risk: the final thaw of the Glacier Drop and Scavenger Mine allocations ends around Nov 29 to Dec 4 (sources differ), which could add selling pressure from holders who have waited a year. Holder concentration on BNB Chain is also very high, and a 16% pump on a headline can reverse fast. Not financial advice. Will you hold the moonbag through the unlock? $NIGHTUSDT $SUIUSDT #WSOT2026 #WSOTPicktoEarn10U #NovUSCPIWatch #MidtermsMarketWatch

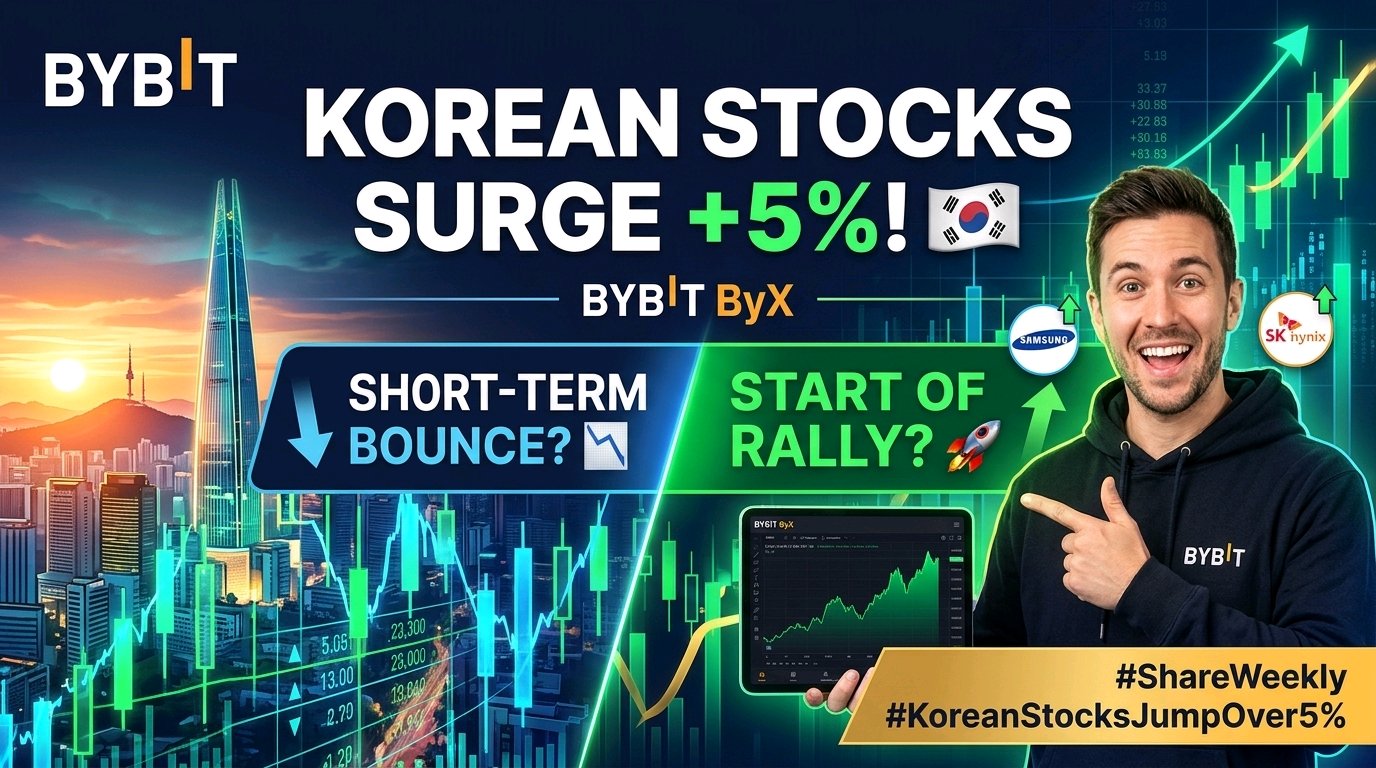
🚨 Today's Hot Topic | Korean Stocks Rebound: A Paradigm Shift or a Fleeting Bounce? The financial markets are buzzing as the KOSPI surged over 5% intraday, spearheaded powerhouse market leaders like Samsung Electronics and SK Hynix! Such a dramatic, high-volume upward movement has naturally ignited a fierce debate across global trading desks: Is this explosive move merely a short-term relief bounce, or is it the definitive kickoff of a major new structural rally? 📊 Deconstructing the Rally: Key Drivers Tech & Semiconductor Momentum: Samsung Electronics and SK Hynix are at the epicenter of global memory and AI-driven hardware demand. When these giants move violently to the upside, it acts as a massive liquidity wave lifting the entire index. Macro Sentiment & Institutional Flows: The sharp intraday reversal signals aggressive institutional accumulation. Are foreign capital flows returning to Asian equities, or are short-sellers aggressively unwinding positions? The Crypto & Tokenized Asset Correlation: In today's interconnected macro ecosystem, explosive liquidity in traditional equities often spills over into risk-on crypto assets, bridging traditional finance (TradFi) and decentralized finance (DeFi) sentiment. 🔍 Market Outlook: Short-Term Trap vs. Structural Bull Run The Bearish Case (Short-Term Bounce): Macro headwinds, fluctuating currency dynamics, and global liquidity tightening suggest this could be a classic "dead cat bounce" or liquidity sweep before another consolidation phase. Prudent traders are watching key resistance levels closely. The Bullish Case (New Rally Start): If this 5%+ surge breaks multi-week resistance structures with sustained volume, we could be witnessing the bottoming process and the early accumulation phase of a prolonged multi-month trend. 💬 Where Do You See the Best Opportunities ? How are you positioning your portfolio amidst this volatility? Are you scaling into tech majors, hedging your downside, or rotating capital into high-beta altcoins tracking the broader risk-on sentiment? Drop your trading strategies, analysis, and price targets in the comments below! 👇 #WSOT2026 #MidtermsMarketWatch $BTCUSDT $ETHUSDT

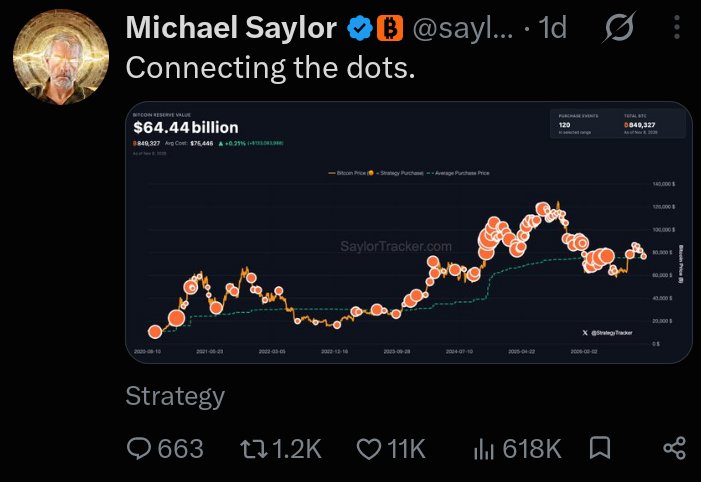
Michael Saylor dropped another Bitcoin tease!
"Connecting the dots" The Strategy chairman's latest X post has sparked speculation about another potential $BTCUSDT purchase. But there's a bigger story behind it. 🧵👇 🟠 Strategy reportedly holds 849,327 BTC, worth approximately $62.98 billion. 📉 Bitcoin falling below Strategy's average purchase price of $75,451 has pushed its holdings into roughly $1 billion in unrealized losses. Just a month ago, Strategy was reportedly sitting on nearly $10 billion in unrealized profits. A dramatic market reversal! 🐻 Bitcoin's Q4 2026 weakness is drawing comparisons with previous bearish cycles in 2014, 2018 and 2022. 📊 Analysts are also warning about weakening momentum, with BTC approaching its fifth consecutive weekly red candle. 💰 Despite the pressure, Strategy reportedly maintains $4.9 billion in USD reserves and recently acquired $208 million worth of STRC. 👀 Now everyone's watching Michael Saylor. Does "Connecting the dots" hint at another Bitcoin purchase? Or is it simply another message about his long term BTC conviction? One thing is clear that Strategy's Bitcoin strategy is facing another major market test. #IMPACTbyTrade #MidtermsMarketWatch

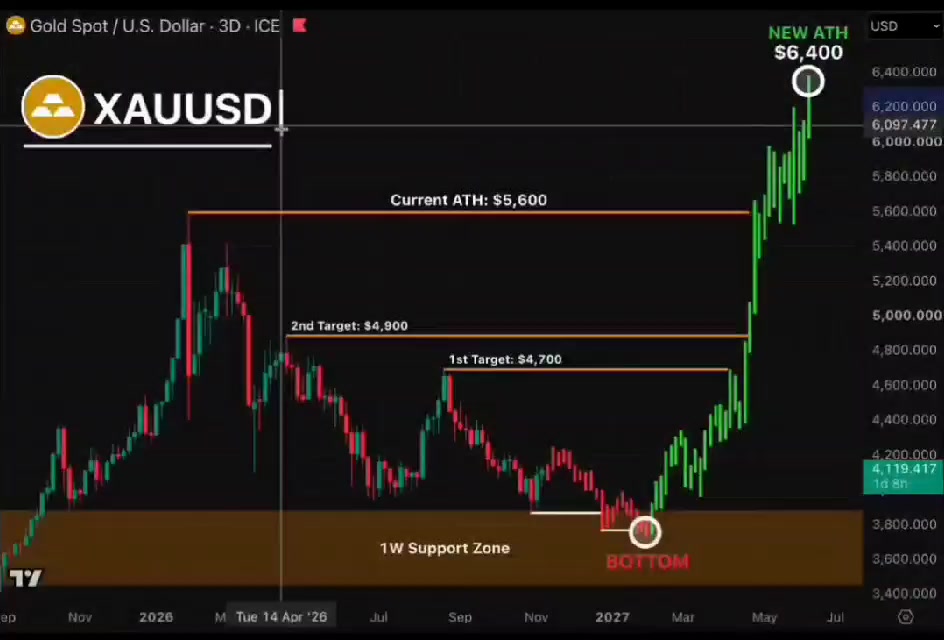
🚨 GOLD IS PREPARING ITS FINAL SHAKEOUT Gold is down ~30% from its $5,600 ATH. Everyone expects an even BIGGER crash I see the opposite: the last flush before the next leg up My roadmap: → $3,800-3,900: final wash into 1W support → CAPITULATION: weak hands get wiped out → $4,700 → $4,900: first targets → $5,600 → $6,400: breakout to NEW ATH That's a ~50% rise from the bottom to the old ATH Fear is building, weak hands are selling. This is exactly how major cycle bottoms form I'm not chasing here. I'm waiting for the capitulation $XAUTUSDT #MidtermsMarketWatch

Wait for Confirmation! 🚀
$MNTUSDT #WSOT2026 #WSOTPicktoEarn10U #BybitAIEvolving #MidtermsMarketWatch #Oracle20BFundingPlanTestsTheAITrade


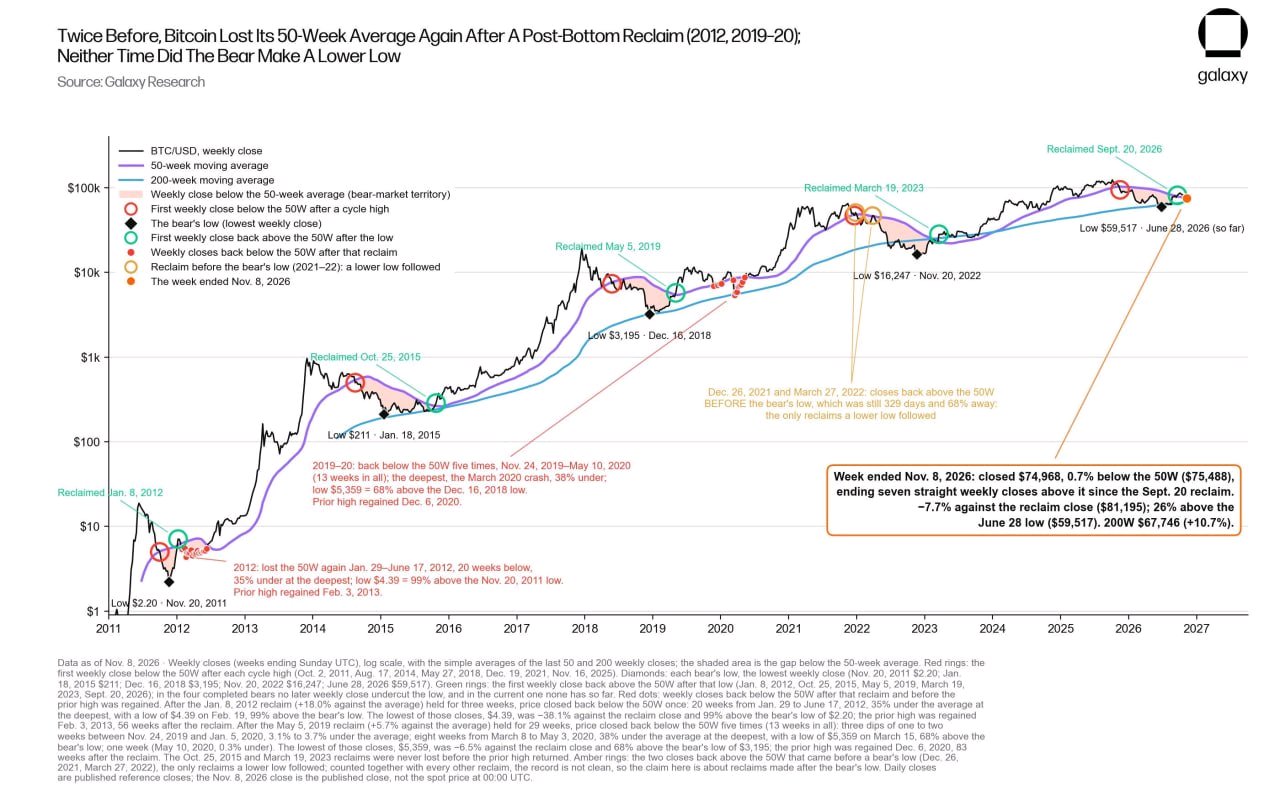
Pola Historis Bitcoin yang Layak Dicermati
Bitcoin kembali berada di bawah rata-rata 50 mingguan, namun konteks historisnya patut diperhatikan. Menurut Alex Thorn dari Galaxy, dua kali terakhir $BTCUSDT kehilangan level ini setelah titik terendah pasar beruang (bear market), harga tidak pernah mencetak titik terendah yang lebih rendah. Grafik yang terlihat bearish tidak selalu berujung pada hasil yang bearish. #Pantauan IHK AS November #Data Penggajian AS dan Keputusan Suku Bunga Mendorong Pekan Makro #BybitAIEvolving #Keputusan Suku Bunga BOE #Pantauan Pasar Pemilu Paruh Waktu

$INIT MIGHT BE COOLING OFF
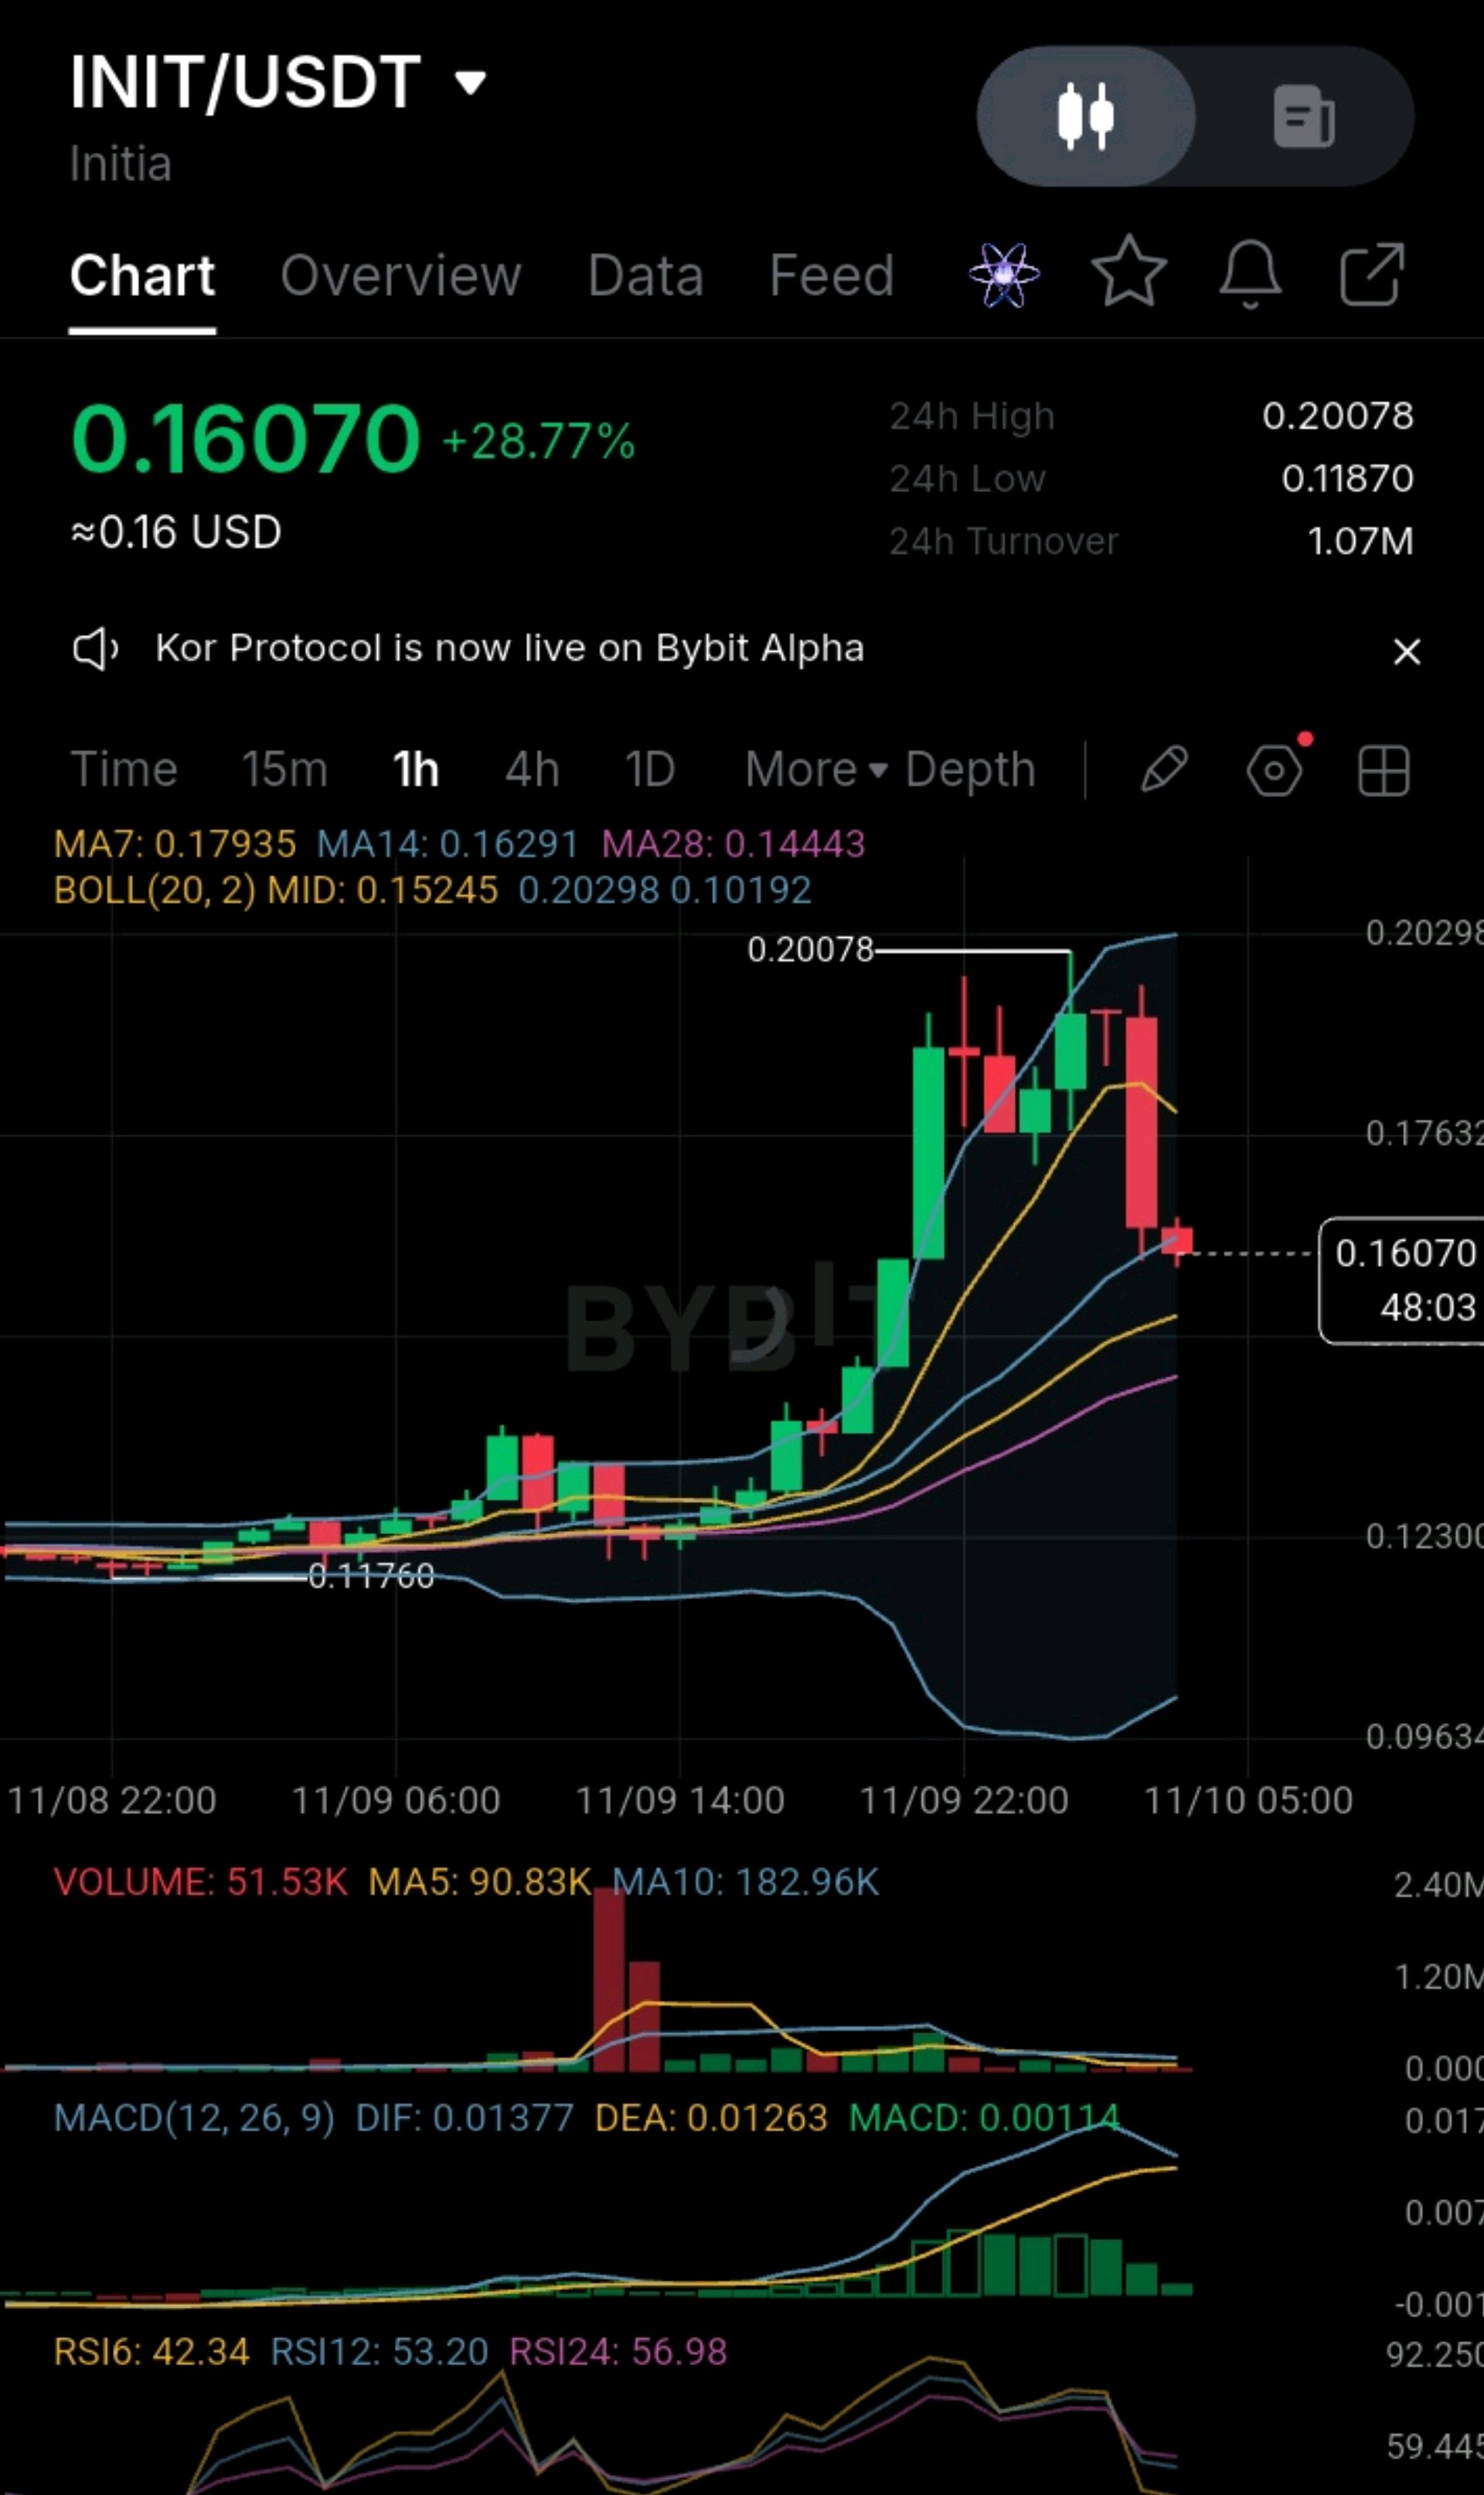
#ByXIMPACT #WSOTPicktoEarn10U #NovUSCPIWatch #MidtermsMarketWatch #BybitAIEvolving ⚡$INIT MIGHT BE COOLING OFF AFTER A BIG RUN. INITUSDT: A PULLBACK IS NOT A BREAKDOWN. HERE'S WHAT I'M WATCHING. 📊 $INIT has pulled back from 0.20078 to around 0.1607, losing its MA7 after a vertical breakout. But is this the start of a deeper reversal, or simply a healthy retest within a broader uptrend? That distinction is why I'm watching the next support levels as closely as the recent rejection. I'm not relying on red candles alone. I'm looking at market structure, moving-average alignment, momentum, volume, and the levels that would weaken or strengthen the bullish case. 1. MARKET STRUCTURE: PULLBACK AFTER A VERTICAL RUN Following the base near 0.1176, price ripped to a high of 0.20078 and was rejected with long upper wicks. The latest big red candle shows sellers have regained some short-term control, but the broader breakout structure still needs a break of support to be considered invalidated. 2. MOVING AVERAGES: A SHORT-TERM DETERIORATION At the time of the screenshot: MA7: 0.17935 MA14: 0.16291 MA28: 0.14443 Price has lost the MA7 and is testing the MA14, which is the near-term line to defend. However, it remains above the MA28 and the BB midline (0.15245), so the broader breakout structure has not been invalidated. 0.17935 is now the key resistance reference. 3. MOMENTUM AND VOLUME MACD is still positive (DIF 0.01377 vs DEA 0.01263), but the histogram is shrinking and DIF is curling over, so a bearish cross is close. RSI6 is around 42.34, while RSI12 is 53.20 and RSI24 is 56.98. This suggests short-term momentum has turned down faster than the broader readings. Displayed volume is approximately 51.53K, below the MA5 (90.83K) and MA10 (182.96K). The big volume came on the earlier candles, so the move is losing fuel. The current candle is still open, so judge it at the close. 4. KEY LEVELS AND INVALIDATION 🔹 0.20078: 24-hour high and major resistance. 🔹 0.17935: MA7; reclaiming it could strengthen the recovery case. 🔹 0.16291: MA14; the level being tested right now. 🔹 0.15245: Hourly middle Bollinger Band and the dip-entry area. 🔹 0.14443: MA28; a break below it would weaken the breakout structure. A sustained reclaim of the MA7 with stronger volume would support the bullish thesis. Rejection followed by a loss of the MA14 would call for reassessment. 5. THE REASON BEHIND THE TRADE Illustrative plan: a bounce entry around 0.1525-0.1560 (BB mid area), a stop-loss at 0.1440 below the MA28, and take-profit levels at 0.1629 and 0.1794. These are planned levels, not guaranteed outcomes. Risk only 1-2% of the account on the stop distance. Leverage magnifies both gains and losses. Unrealized P&L is not realized profit, and a large unrealized return does not eliminate reversal risk. Catching a falling knife between the MA14 and MA28 is poor risk/reward, so patience matters here. MY VIEW: INIT is showing a short-term pullback after a +28% day, but holding the MA14 and reclaiming the MA7 on volume would provide better evidence that the breakout is intact. Until then, confirmation matters more than prediction. 🤝 Community question: Do you think INIT will hold the MA14 at 0.1629 and retest 0.1794, or will fading volume send it down to the 0.1525 midline and 0.1444? $INITUSDT $INITUSDT This is technical analysis for discussion, not financial advice.

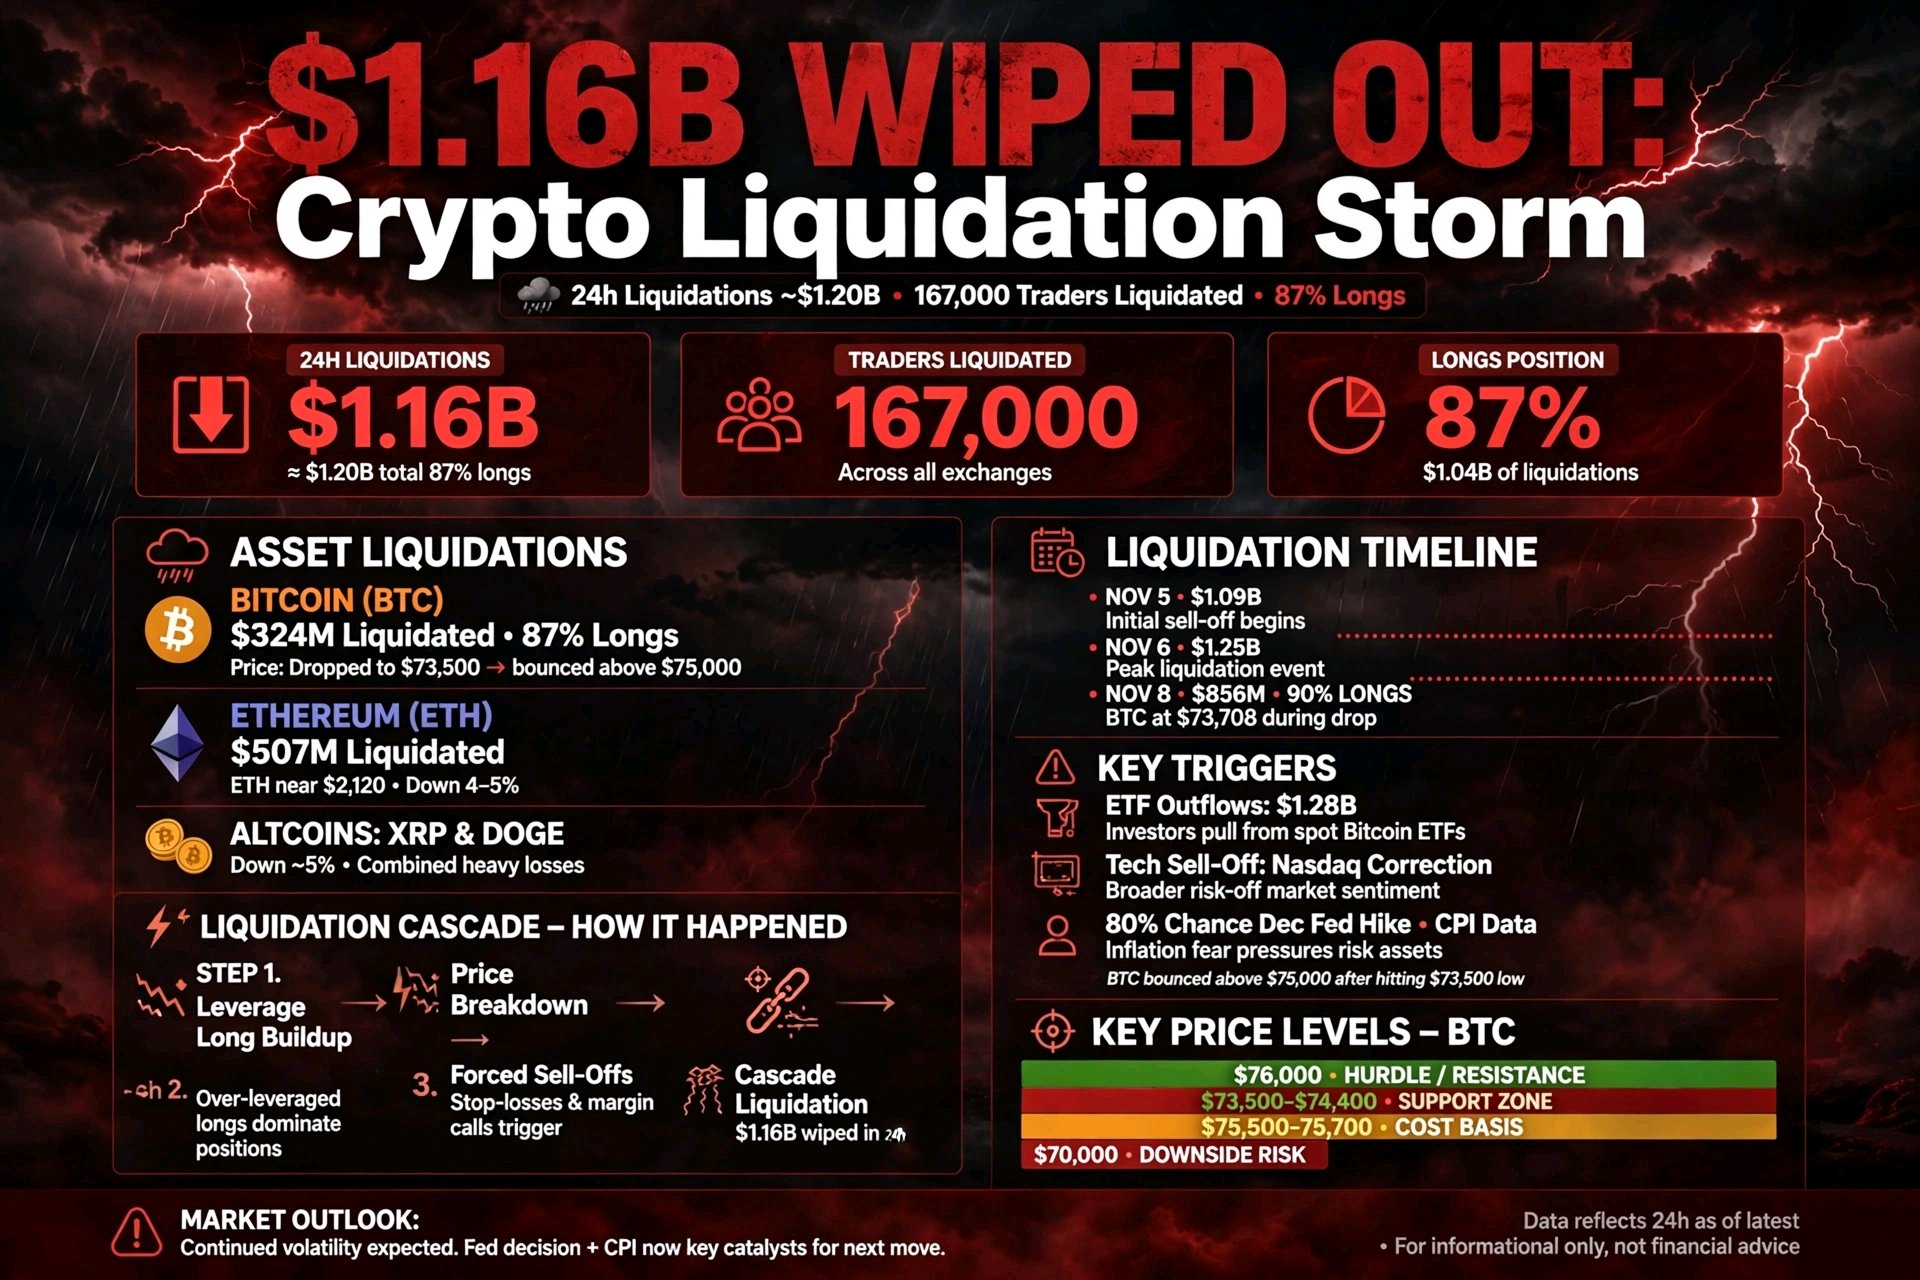
🚨 $1,16 MILIAR LENYAP BEGITU SAJA. 😱
Pasar kripto sedang menghadapi kehancuran sistemik total, dan jika kamu pikir ini hanya karena pasar teknologi, kamu melewatkan cerita sebenarnya. Meskipun pembantaian teknologi global—yang dipicu oleh berita utama pribadi yang mengejutkan seputar CEO Nvidia Jensen Huang—memulai kepanikan, smart money sedang melarikan diri karena perpaduan beracun dari bencana makro. Inilah yang belum disatukan oleh media arus utama: - Dampak Sampingan Teknologi: Kejatuhan Nvidia secara aktif menguras likuiditas besar-besaran dari aset spekulatif. - Guncangan Binance $6,34 Miliar: Trauma psikologis dari eksploitasi Binance yang bersejarah membuat modal paus tetap terkunci. - Pembekuan Pemilu Paruh Waktu: Raksasa institusional secara agresif mengurangi risiko dan beralih ke uang tunai menjelang Pemilu Paruh Waktu AS yang berisiko tinggi. Laporan Kerusakan 24 Jam: Leverage trader benar-benar habis total, menghasilkan total likuidasi yang mengejutkan sebesar $1,16 Miliar. - Bitcoin ( $BTCUSDT ): Retak di bawah tekanan yang sangat besar, sekarang berjuang mati-matian untuk mempertahankan zona $74.860. - Ethereum ( $ETHUSDT ): Mengalami hantaman brutal, anjlok 5,9% langsung ke $2.124. Ini bukan lagi sekadar koreksi biasa. Ini adalah pertempuran untuk tren makro berikutnya. Apakah kamu membeli di tengah pembantaian bersejarah ini, atau kamu hanya menonton dari pinggir lapangan? Tuliskan strategi bertahan hidupmu di bawah ini. 👇 #Pantauan Pasar Pemilu Paruh Waktu #BybitAIEvolving

BCHUSDT – Buy Now or Wait for $200? 🤔
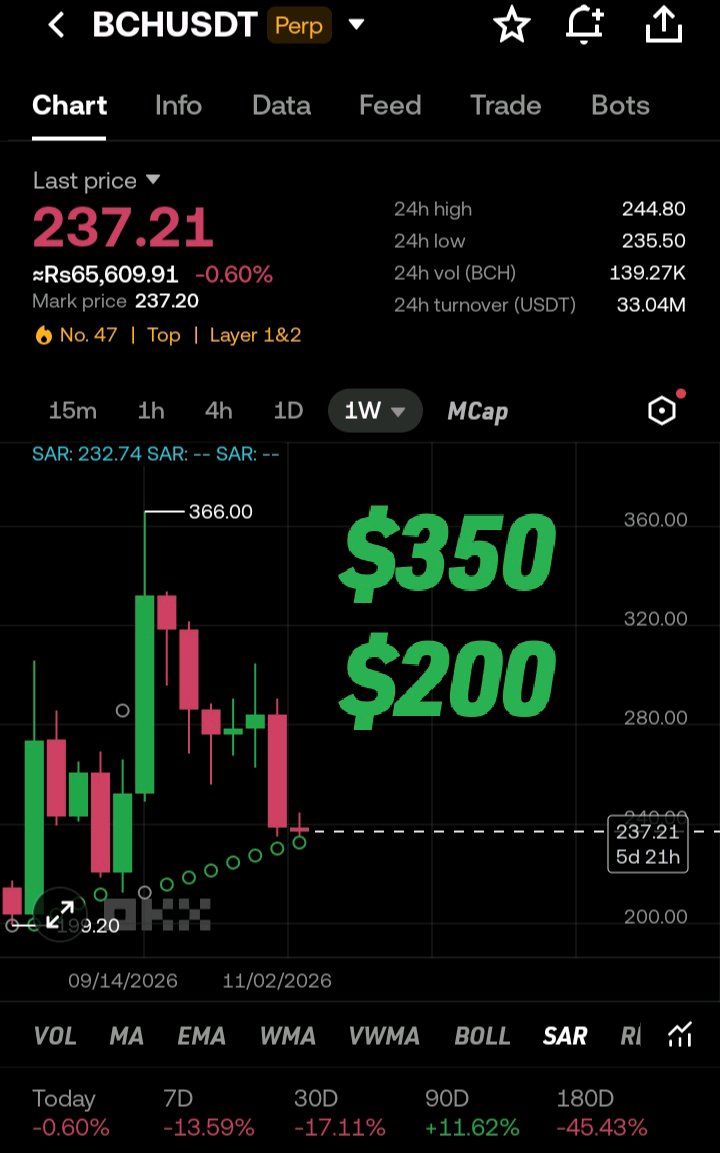
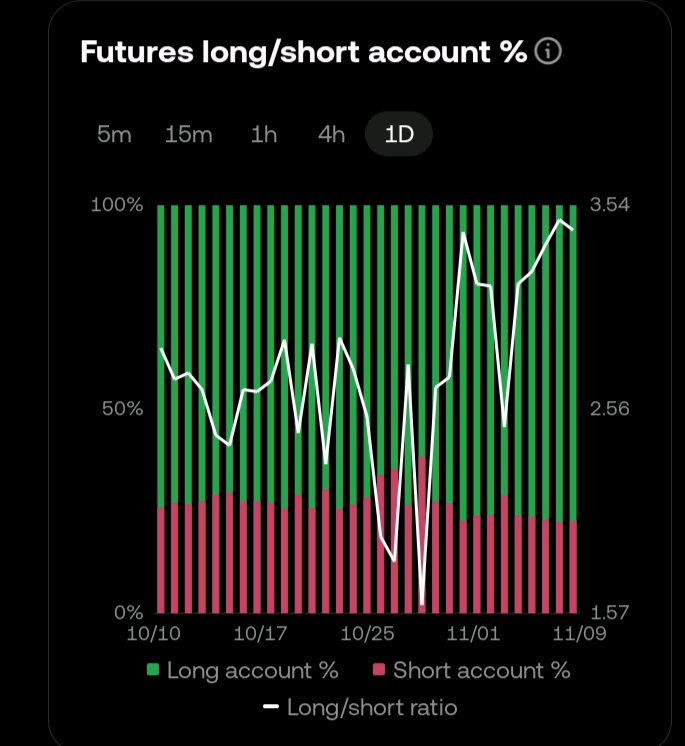
$BCHUSDT Current: 237.21 📉 | Target: $350 🎯 Chart & Data: · Weekly SAR is right at 232.74 (Key support). · Funding Rate: Deep negative. Shorts are paying longs (Short squeeze potential). · Long Ratio: Very high at 3.54. Retail is heavily long. My View: If SAR holds, a bounce to $350 is possible. However, the high Long ratio means the market might drop to liquidate them first. Plan: Consider DCA (partial buying) to balance the risk. Buy now or wait for $200? 👇 #WSOTPicktoEarn10U #USPayrollsAndRateDecisionsDriveMacroWeek #Oracle20BFundingPlanTestsTheAITrade #MidtermsMarketWatch #AnthropicIPOTestsTheAIBoom $BTCUSDT
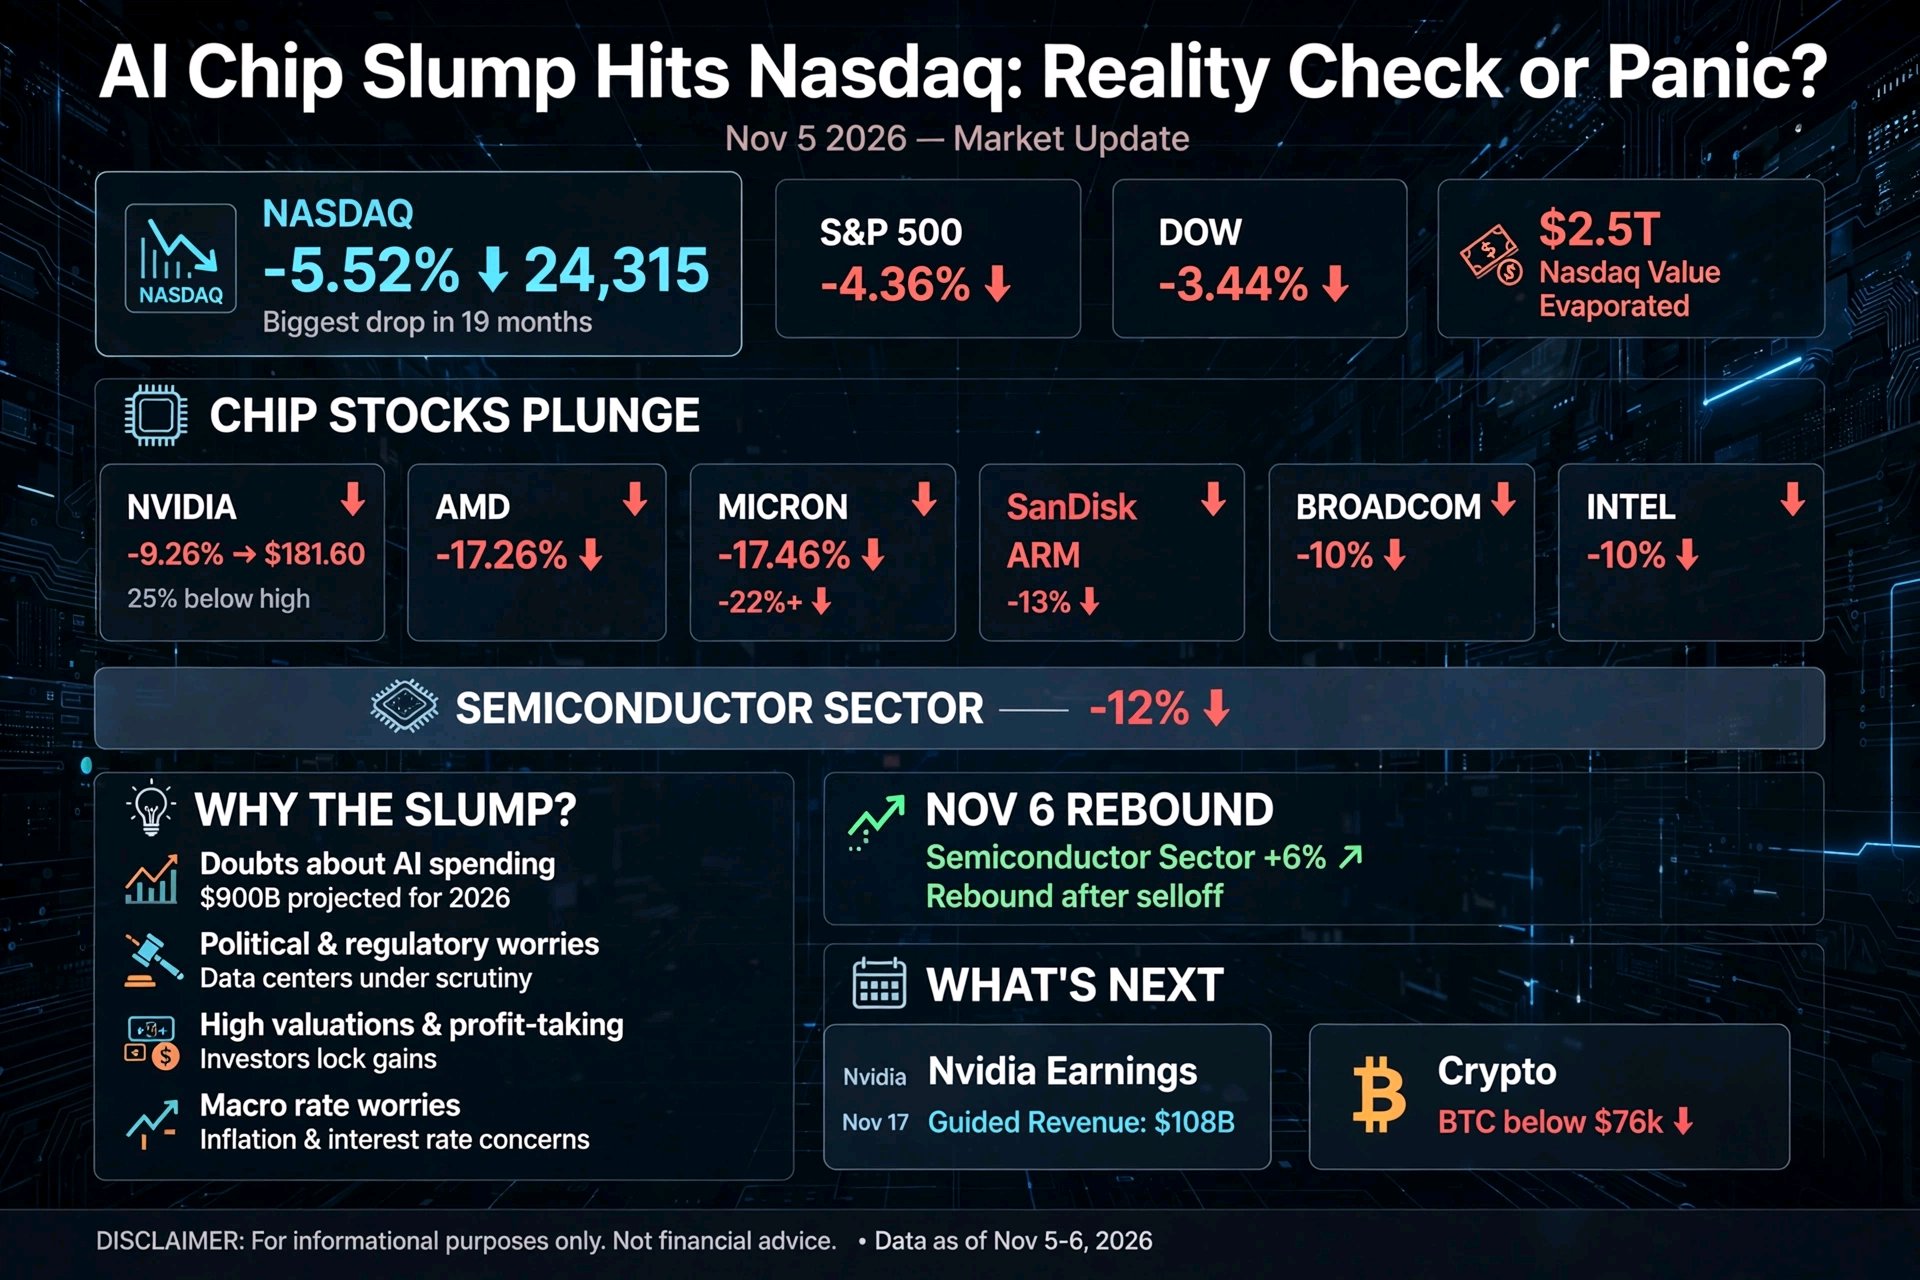
AI Chip Slump Hits the Nasdaq
: Reality Check or Panic? 🚨 The Day Wall Street Flinched On Thursday, November 5, 2026, the Nasdaq Composite fell 5.52% to 24,315, its biggest daily drop in 19 months. 😱 The S&P 500 fell 4.36% and the Dow fell 3.44%. The sell-off pushed the Nasdaq into correction territory, more than 10% below its peak. 📉 Reuters estimated roughly $2.5 trillion in Nasdaq market value evaporated in a single session. 💸 🔥 Chip Stocks Led the Fall The damage was heaviest in AI and semiconductor names: 👇 🟢➡️🔴 Nvidia: −9.26% to $181.60, about 25% below its 52-week high 🔻 AMD: −17.26% 🔻 Micron: −17.46% 🔻 SanDisk: over −22% 🔻 Arm: −13%, Broadcom: −10%, Intel: −10% The semiconductor sector fell about 12% in a day, one of its worst sell-offs in years. 😳 🧠 Why Did It Happen? 💰 1. Doubts About AI Spending Investors questioned the pace, cost and financing of the AI boom. 🏗️ One analysis noted that JPMorgan expects about $900 billion of AI spending worldwide in 2026, and investors want to know when that money pays back. 🤔 🏛️ 2. Political and Regulatory Worries Some coverage linked the fall to worries about US data-center policies after the midterm elections. 🗳️ One outlet argued the market was pricing political risk on land, energy and permits for AI infrastructure, not just on valuations. ⚡ 📊 3. High Valuations and Profit-Taking Stocks had run up for months, so even small bad news could trigger heavy selling. 🎢 Analysts say investors want clear proof of long-term profits before paying today's prices. 🧾 🏦 4. Macro Pressure Rate worries remain in the background, with markets watching the Fed and today's CPI report. 📅 That makes expensive growth stocks more sensitive to bad news. ⚠️ 🔄 The Partial Rebound The next day, November 6, chip stocks bounced. 📈 The broader semiconductor index rose over 6%, and AMD, Intel and Micron were up roughly 7% to 13%. A Jefferies strategist called the sell-off reactionary, not a fundamental reset, according to Reuters. 🧐 But analysts warned that volatility may continue, and a bounce is not a verdict. 🎯 ⚠️ A Reality Check One report stressed that these moves reflect a repricing of share prices, not cash leaving company bank accounts or a collapse in chip shipments or data-center orders. 📌 So this looks like a valuation reset, not proof that AI demand has vanished. Still, if spending flattens, comparisons with the 2022 chip slump may return. 😬 🗓️ The Next Big Test: Nvidia Earnings Nvidia reports on Tuesday, November 17. 📣 It guided revenue to about $108 billion this quarter. Markets will watch for strong results and confident guidance. A beat may calm nerves, while a miss could deepen the slump. 🎯 ₿ What This Means for Crypto ($BTC $SOL $ARB) Crypto has been trading closely with tech lately. 🔗 Bitcoin slid below $76,000 around the sell-off, so it offered no safe haven. 😬 In general, altcoins like SOL and ARB tend to move harder than BTC in both directions, so a weak Nasdaq can hit them more. ⚖️ If tech stabilizes, crypto may find relief, but if the AI sell-off returns, expect more volatility. 🎢 🧭 What Traders Can Do 📌 Avoid panic and FOMO. Wild swings trap both buyers and sellers. 🪤 📌 Watch key dates. Today's CPI and Nvidia's November 17 earnings can move markets. 📅 📌 Spread entries. Don't go all-in on one day's move. 🪜 📌 Mind leverage. Fast drops can liquidate over-leveraged positions. 🛡️ 📌 Follow the proof. Earnings and spending data matter more than headlines. 🔍 🎯 Final Thought The AI boom is moving from hype to proof. 💡 Big winners can fall fast when expectations are high, and rebounds can be just as sharp. Whether this is a healthy reset or the start of something bigger, the next few weeks will tell. 🌍 #Oracle20BFundingPlanTestsTheAITrade #MidtermsMarketWatch #BOERateDecision #AnthropicIPOTestsTheAIBoom #OilVolatilityTracksIranPeaceTalks $BTCUSDT @jalekhakhatun
1,16 Miliar Lenyap:
Badai Likuidasi Kripto Menghantam Trader dengan Leverage ⚡🩸 🚨 24 Jam yang Brutal Pasar kripto baru saja memberikan pelajaran menyakitkan tentang penggunaan leverage. 😬 Dalam 24 jam, lebih dari $1 miliar posisi leveraged telah hangus. Data Coinglass menunjukkan sekitar $1,2 miliar likuidasi, dan $1,04 miliar di antaranya berasal dari posisi long, yang artinya taruhan pada kenaikan harga. 📉 Sekitar 167.000 trader terkena likuidasi. 😱 ⚙️ Apa Itu Likuidasi? Sekilas penyegaran bagi trader baru. 👇 Saat Anda trading dengan leverage, Anda meminjam dana untuk membuka posisi yang lebih besar. Jika harga bergerak melawan Anda dan jaminan (collateral) Anda tidak lagi mampu menutupi kerugian, bursa akan menutup posisi trading Anda secara otomatis. Penjualan paksa tersebut dapat mendorong harga lebih turun lagi, yang memicu likuidasi lebih lanjut. Reaksi berantai ini disebut sebagai kaskade likuidasi. 🌊 📊 Siapa yang Paling Terkena Dampak? ₿ Bitcoin: sekitar $324 juta dilikuidasi, hampir 87% di antaranya adalah posisi long. BTC sempat turun ke sekitar $73.500 sebelum memantul di atas $75.000. Ξ Ethereum: lebih dari $507 juta dilikuidasi, lebih banyak dari Bitcoin. ETH diperdagangkan di dekat $2.120 dan turun sekitar 4–5% pada hari ini. 🔻 Major lainnya: XRP, Dogecoin, dan lainnya juga turun sekitar 5%. Rasa sakitnya hanya satu sisi. 🎯 Posisi long dihancurkan sementara posisi short hampir tidak berpengaruh. Itu memberitahu kita bahwa para trader terlalu banyak bertaruh pada pemantulan harga yang tidak pernah terjadi. 🪤 📅 Ini Bukan Gelombang Pertama Minggu ini terasa berat. 😮💨 📆 5 November: sekitar $1,09 miliar dilikuidasi, saat Bitcoin turun sekitar 6% dari di atas $80.000 ke sekitar $75.700. 📆 6 November: sekitar $1,25 miliar dilikuidasi. 📆 8 November: sekitar $856 juta dilikuidasi, sekitar 90% posisi long, saat Bitcoin menyentuh $73.708, level terendah sejak Agustus. 📆 Sekarang: gelombang $1 Miliar+ lainnya. Pembersihan yang berulang menunjukkan bahwa posisi long yang terlalu banyak menggunakan leverage terus disapu bersih. 🧹 🧠 Apa yang Memicu Aksi Jual Ini? 🏦 1. Arus Keluar ETF yang Besar ETF Bitcoin spot AS kehilangan $1,28 miliar minggu lalu, minggu terburuk sejak akhir Juni. 📤 Hal itu menghilangkan sumber utama pembelian yang stabil. 📉 2. Aksi Jual Saham Teknologi Aksi jual tajam pada saham AI dan chip mendorong Nasdaq ke wilayah koreksi, dan kripto telah diperdagangkan seperti aset teknologi berisiko tinggi. 🤖⛈️ 🗳️ 3. Tekanan Makro dan Politik Para trader juga mulai memperhitungkan kekhawatiran suku bunga. Pasar melihat peluang sekitar 80% untuk kenaikan suku bunga Fed pada bulan Desember, jadi laporan CPI hari ini bisa mengguncang segalanya lagi. 📊⚠️ 🔓 4. Kekhawatiran Keamanan Bursa Satu laporan menyebutkan adanya peretasan Binance di antara tekanan terhadap sentimen pasar. Saya belum bisa memverifikasi detailnya, jadi sikapi dengan hati-hati sampai Binance atau sumber terpercaya lainnya mengonfirmasi apa yang terjadi. 🔍 🔍 Level Kunci yang Dipantau Trader 📍 $73.500–$74.400: posisi terendah baru-baru ini dan support mingguan. 📍 ~$75.500–$75.700: basis biaya pemegang jangka pendek dan harga beli rata-rata Strategy. Bitcoin diperdagangkan tepat di bawahnya, jadi banyak pembeli baru yang mengalami kerugian (underwater). 😬 📍 ~$76.000: hambatan kenaikan pertama. 📍 ~$70.000: level yang ditandai beberapa analis sebagai target penurunan jika support gagal bertahan. 🔻 ⚖️ Apakah Ini Bullish atau Bearish? Kedua pandangan itu ada. 🤔 🐂 Kasus Bullish: Pembersihan likuidasi besar-besaran dapat menghilangkan kelebihan leverage dan membantu menetapkan dasar (bottom). 🐻 Kasus Bearish: Arus keluar ETF, ekuitas yang lemah, dan risiko kenaikan suku bunga dapat terus menekan harga. Ingatlah bahwa peristiwa likuidasi menunjukkan kerusakan yang sudah terjadi. Itu tidak memberi tahu Anda apa yang akan terjadi selanjutnya. 🎯 🛡️ Pelajaran untuk Trader 📌 Hormati leverage. Leverage tinggi mengubah ayunan harga normal menjadi penghancur akun. 💀 📌 Gunakan stop-loss dan ukuran posisi yang kecil. Jangan pernah mengambil risiko lebih dari yang Anda mampu untuk kehilangan. 🧯 📌 Hindari mengejar harga (chasing). Jangan membeli setiap penurunan atau melakukan short setiap pemantulan secara membabi buta. 🪤 #Oracle20BFundingPlanTestsTheAITrade #Pantauan Pasar Pemilu Paruh Waktu #Keputusan Suku Bunga BOE #AnthropicIPOValuationTest #Volatilitas Minyak Melacak Pembicaraan Perdamaian Iran $BTCUSDT @jalekhakhatun