MidtermsMarketWatch
2026年の米国中間選挙が近づいています。変化する政策期待、市場センチメント、マクロ経済シグナルは、BTC、ETH、その他のリスク資産にどのような影響を与えうるでしょうか? あなたのマーケット見通し、主要なインジケーター、トレーディングシナリオ、そしてその見解の裏付けとなる根拠を共有してください。 多様な視点。リアルなインサイト。より良いマーケットディスカッションを。

ゴールドマンサックスが3月の利上げを予想に追加した。彼らのゴールド(金)に関する見通しを確認しよう。
ゴールドマン・サックスは、FRBによる25ベーシスポイント(bp)の利上げがあと2回行われると予想している。1回は12月、もう1回は2027年3月だ。 同社のチーフ米国エコノミスト、デビッド・メリクル氏は、予想を上回るCPI発表を受けてこの見通しを記した。これにより、9月の利上げを含め、今回のサイクルでの利上げは合計3回となる。 3月の利上げは1月に前倒しされる可能性すらある。さらにゴールドマンは、最初の利下げ時期を1四半期後ろ倒しし、2027年12月とした。 まず2つの詳細を述べる。 これは方針転換だ。10月下旬の時点では、ゴールドマンは3月の利上げを基本シナリオから外していた。investingLiveによると、3回連続でインフレ率が高いCPIが発表されたことで、再び織り込まれることとなった。 同社は依然として12月の利上げ幅を25bpと見ている。ウォラー理事が示唆した50bpではない。FRBが12月に公表するドット・プロット(金利見通し)において、ゴールドマンはFOMCメンバーの大半が3回目の利上げを示唆すると予想している。ダラス連銀のローガン総裁も、少なくともあと2回の25bpの利上げが必要との見解を示しており、同様のスタンスだ。 さて、ここからが私が考えずにはいられない部分だ。 ゴールドマンのゴールド調査チームは11月5日に目標価格を引き下げた。2026年末に4,150ドル、2027年末に4,800ドルとしている。 同ノートでは、2027年3月の利上げ、利下げの遅れ、あるいはターミナルレート(最終到達金利)の上昇をダウンサイドリスクとして挙げていた。その場合、金価格は2027年末に4,800ドルではなく、4,660ドル近辺で終了するとしている。 その5日後、同社のエコノミストは、これらの3つのトリガーのうち、3月の利上げと利下げの遅延という2つを基本シナリオに組み込んだ。ゴールドの予測が更新された様子はまだない。 これは矛盾しているだろうか?必ずしもそうとは言えない。両者は別々のチームだからだ。ゴールドのノートは、すでに12月のタカ派的な展開を織り込んでいる可能性がある。 そして、そのギャップは小さい。4,660ドルは4,800ドルより2.9%低い(筆者計算)。11月10日のCPI発表後のキットコによる金スポット価格4,055ドルから見れば、ダウンサイドシナリオであっても約15%の上昇を示唆している。基本シナリオでは約18%の上昇だ(筆者計算)。価格はその後も変動している。 つまり、ゴールドマンの見解はこう読み取れる。短期的には横ばいだが、長期的には中央銀行の買い支えによって恩恵を受けるというものだ。 市場にとって、「高金利の長期化(higher for longer)」が現在の基本シナリオだ。ビットコインもゴールドも、今週は利上げ確率に反応して取引された。 私が注目しているのは3点。ゴールドマンのゴールドチームが予想を修正するかどうか。11月25日発表の10月PCE。そして、11月と12月のインフレデータが、ゴールドマンの予想通りに落ち着くかどうかだ。 もし落ち着けば、3月の利上げ予想は再び取り下げられる可能性がある。 #WSOT2026 #Oracle20BFundingPlanTestsTheAITrade #MidtermsMarketWatch #AnthropicIPOValuationTest #BOE金利決定



After unlock, $FHE did NOT dip. That is the real story today. Bitcoin fell to near $73,750. Ethereum fell to near $2,042. Solana, XRP, Dogecoin, Cardano — almost all altcoins are in red. Market fear is at 29, CPI was hot, liquidations crossed $718 million. Everything is under pressure. But $FHE held its ground. Even after millions of tokens unlocked, price did not collapse. No panic dump. No weak hands crash. That means sellers are done, and holders are strong. In crypto, coins that survive unlock + BTC dip together are usually the first to move when market turns green. I am holding 9,000+ $FHE. My view: if BTC just stabilizes above $73,500, $FHE has a clean path to $0.03, then $0.05. This is not financial advice. Just my observation — strength in fear is rare. And rare strength often gets rewarded. Are you watching FHE too? Drop your target below. #AnthropicIPOTestsTheAIBoom #Oracle20BFundingPlanTestsTheAITrade #MidtermsMarketWatch #BybitAIEvolving #OilVolatilityTracksIranPeaceTalks $SOLUSDT $FHEUSDT
🔥 THE SILENT GIANT NO ONE IS WATCHING — YET Read this before you sell $FHE. While other coins tweet 10x a day, post memes, and beg for attention, $FHE team has been silent since August. No hype. No noise. No fake announcements. And still — it did NOT die. It survived unlock. It survived BTC crash to $73,750. It survived Fear at 29. That is not weakness. That is strength. Why? Because $FHE is not a meme. It is infrastructure. Fully Homomorphic Encryption for AI agents, private data, quantum-resistant future. Real tech. Real partnerships. Clean tokenomics with limited supply pressure after unlock. Look at history: $ZEC pumped 300%+ when privacy narrative returned. $XMR held strong in bear markets. Privacy never dies. It waits. Then it explodes. $FHE is that same story, but for AI era. One real update — one partnership, one mainnet news, one Binance push — and this silent coin can wake up fast. From $0.016, even $1 is not fantasy, it is math + narrative + patience. I hold 9,000+ $FHE. I am not selling silence. I am buying it. Not financial advice. Conviction. #BybitAIEvolving #BOERateDecision #OilVolatilityTracksIranPeaceTalks #MidtermsMarketWatch #AnthropicIPOTestsTheAIBoom $MNTUSDT $FHEUSDT

おはようございます🌞 | BTC、ETH、SOLのアップデート
$BTCUSDT : ~74,000 (-1.28%) 📉 · 24時間安値: 73,748 | 高値: 75,431 · 5週連続の下落、73Kのサポートラインをテスト中。 $ETHUSDT : ~2,044 (-3.90%) 📉 · 2,000ドルのサポートラインが迫っています。 · 大規模なショートの清算が発生しました。 SOL: ~82.9 (-4.54%) 📉 · 83.5ドルのサポートラインを維持。 · 84.4ドル以上で引ければ反発の可能性があります。 マイポートフォリオ: 合計: 697.14 PKR ✅ 6ヶ月の損益: +Rs16,163.40 (+1,526.41%) 🚀 市場は赤(下落)ですが、長期保有ポートフォリオは堅調です。 皆さんは今日何を保有していますか? 👇 #11月米国CPIウォッチ #Oracle20BFundingPlanTestsTheAITrade #MidtermsMarketWatch #AnthropicIPOValuationTest #BybitAI進化中

🏭 誰が投資していると噂されているのか?**
⚠️ **AnthropicのIPO支援者は、まるでAIサプライチェーンのチェックリスト** 🤖 AnthropicのIPO(新規株式公開)計画が注目を集めていますが、それは単なる規模の問題ではありません。報道されている支援者のリストを見ると、AIスタックのほぼすべての階層が網羅されているからです。📊 **🏭 誰が出資しているのか?** 報道によると、Google、Nvidia、AMD、Broadcom、Micron、Microsoft、そしてTSMCが、IPO価格での私募を通じて合計260億ドルを出資する計画だとのことです。💰 これにより、半導体メーカー、メモリサプライヤー、クラウドプロバイダー、そして主要なファウンドリが一つの資本テーブルに並ぶことになります。🧩 **🔗 Claudeへの賭け以上の意味** これらの企業は、単なるプロダクトへの出資だけを行っているわけではありません。彼らは「顧客」を支援しているのです。🛒 Anthropicが成長するにつれ、彼らが販売するあらゆるものの需要が高まります: - 🧠 **チップ:** モデルの学習と実行に必要なGPUやカスタムアクセラレーター - 💾 **メモリ:** AIワークロード向けの広帯域メモリ - ☁️ **クラウド容量:** データセンターのスペースと大規模なコンピューティングリソース - 🏗️ **製造:** 高度なチップ製造 サプライヤーにとって、Anthropicの株式を持つことは、自社製品の長期的な需要を確保するための一つの手段でもあります。🔄 **💵 バリュエーションの疑問** Anthropicは、IPO時のバリュエーション(企業価値評価)で約1兆ドル、完全希薄化ベースで1.4兆ドルを目指していると報じられています。🚀 これは非常に巨大な数字であり、公開市場の投資家にとって重要な疑問を投げかけています。つまり、その株価にはどれだけの成長がすでに織り込まれているのか、という点です。🤔 **⚖️ それぞれのメリット** - 🏢 **サプライヤー:** 株式を取得し、急成長する顧客との関係を築く。 - 🧪 **Anthropic:** コンピューティングリソースとキャパシティを拡大するための資金を得る。 - 📈 **公開市場の投資家:** この関係性にどれだけの価値があるかを判断する。 **⚠️ 考慮すべきリスク** 循環的な資金調達は懸念すべき点です。🔁 サプライヤーが出資した顧客が、その資金を使って再び自社から購入を行う場合、需要が実態以上に強く見える可能性があります。投資家は、支出コミットメント、競合状況、そしてこれほど巨大なバリュエーションに対して市場がどう反応するかを注視すべきです。🔍 **🎯 最終的な結論** このIPOは、単なる一企業としてではなく、AIサプライチェーン全体を市場がどう評価するかの試金石となります。公式な書類が確認されるまでは、報道されている数字を慎重に扱うようにしてください。📑 *これは財務アドバイスではありません。常に自分自身でリサーチを行ってください。* 🙏 **ハッシュタグ:** #AnthropicIPO 🚀 #AI株 🤖 #Nvidia 💚 #テック投資 📊 #IPOニュース 🔔 --- #11月米国CPIウォッチ #Oracle20BFundingPlanTestsTheAITrade #MidtermsMarketWatch #AnthropicIPOValuationTest #BOE金利決定


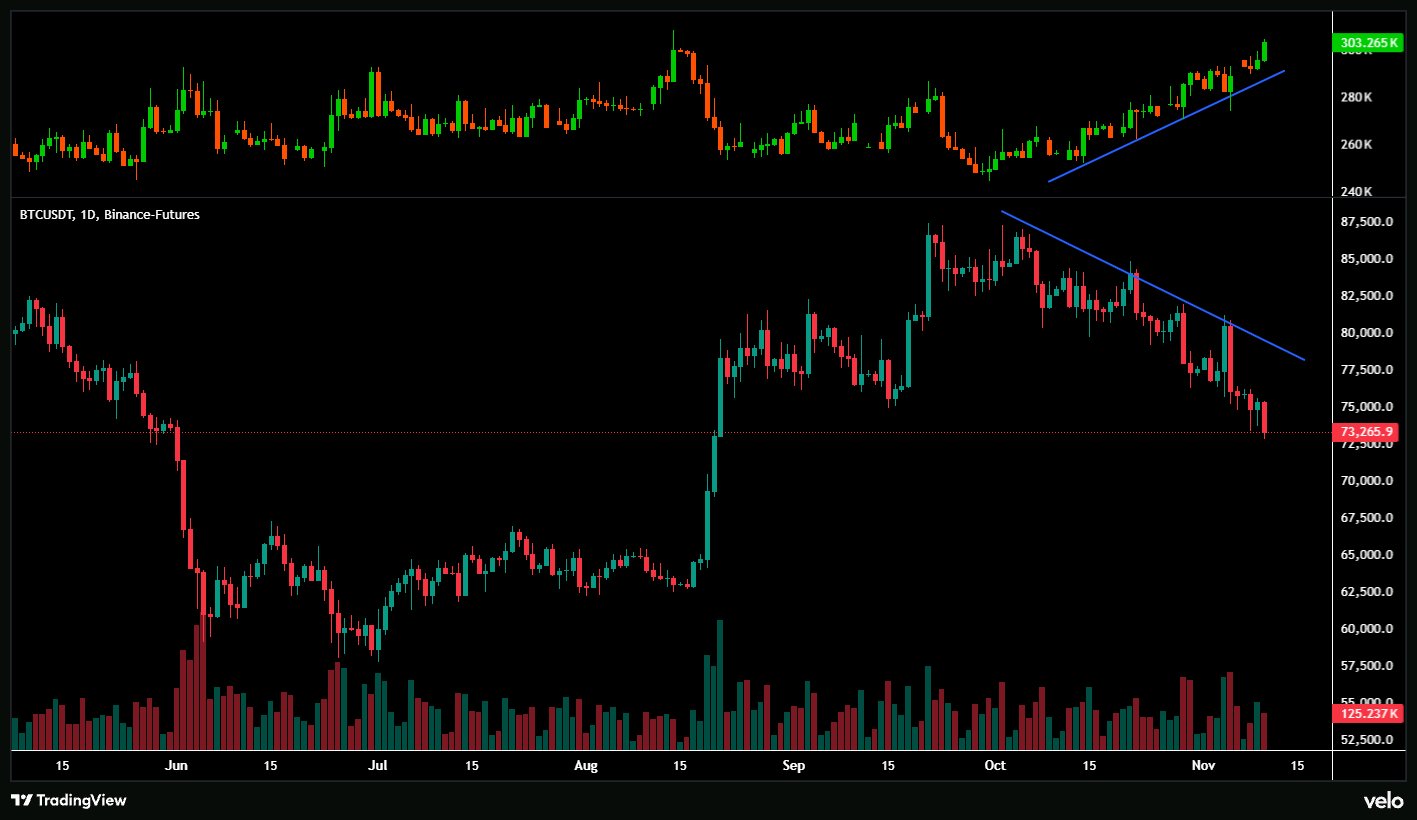
BTCUSDTは下落していますが、オープンインタレスト(建玉)は上昇しています。 これは珍しい組み合わせです。 市場からレバレッジが解消されるどころか、ビットコインが安値を更新する中で、さらにポジションが積み上がっています。 これは大規模な清算イベント(ロスカット)を引き起こす完璧な材料になりかねません。 何か大きなことが起きようとしているのかもしれません。👀 #MidtermsMarketWatch

https://www.bybit.com/press/community/6341068275339510360 #BybitAI進化中 #BOE金利決定 #AnthropicIPOValuationTest #MidtermsMarketWatch

🚨 $TRUMP at All-Time Lows: Squeeze or Trap? 📉
The tension on $TRUMP has reached a boiling point as the token tests its macro floor while derivatives data paints an aggressive divergence. Trading around $1.132 following a sharp rejection from $1.152, price action is hovering dangerously close to the historical low support near $1.102. This isn’t a standard dip—it is a critical test of whether spot buyers will defend the base or allow price discovery to the downside. 🔍 Derivatives Divergence vs. Spot Pressure: * Aggressive Short Stacking: Futures Open Interest climbed over 6% to ~$155.7M even as spot price continued bleeding, while 8-hour funding flipped negative to -0.0103%. This setup confirms aggressive short-side momentum, not organic spot accumulation. * Liquidation Asymmetry: Over 82% of recent liquidations came from leveraged longs. With futures volume (~$238.6M) dwarfing spot turnover (~$29.8M) by roughly 8x, leveraged speculation is driving the entire tape. * Structural Dilution: Only 281.9M tokens are in circulation out of the 1B maximum supply. The gap between current market cap ($315M) and FDV ($1.12B) keeps traders cautious regarding future unlock overhang. 🎯 Critical Technical Roadmap ($TRUMPUSDT): 🔴 Bearish Invalidation ($1.100 – $1.102): A decisive 1H/4H breakdown beneath $1.102 with rising OI removes the last visible support floor, exposing the chart to an aggressive liquidation cascade into uncharted territory. 🟢 Bullish Reversal & Short Squeeze: To invalidate the downward channel, bulls must reclaim the $1.137–$1.153 resistance band on real spot volume. Negative funding creates high fuel for a violent short squeeze, but sustained upside requires genuine spot absorption, not just covering rallies. Political sentiment volatility and Senate regulatory inquiries continue to test narrative-driven tokens. Protect capital, respect your stops, and avoid overleveraging. Are you bidding the $1.10 historical floor for a squeeze bounce, or waiting for a breakdown flush? Share your thesis below! 👇 $TRUMPUSDT #ByXIMPACT
https://www.bybit.com/press/community/7205759403794315717 #BOE金利決定 #AnthropicIPOValuationTest #MidtermsMarketWatch #Oracle20BFundingPlanTestsTheAITrade #原油価格の変動がイランの和平交渉に連動 $SOLUSDT $DOGEUSDT @

https://www.bybit.com/press/community/8070450532248647485 #米国雇用統計と金利決定が主導するマクロ週 #Oracle20BFundingPlanTestsTheAITrade #MidtermsMarketWatch #AnthropicIPOValuationTest #BybitAI進化中 $SOLUSDT @$DOGEUSDT

Bom dia pessoal alguém pode me ajuda com lucro bybit

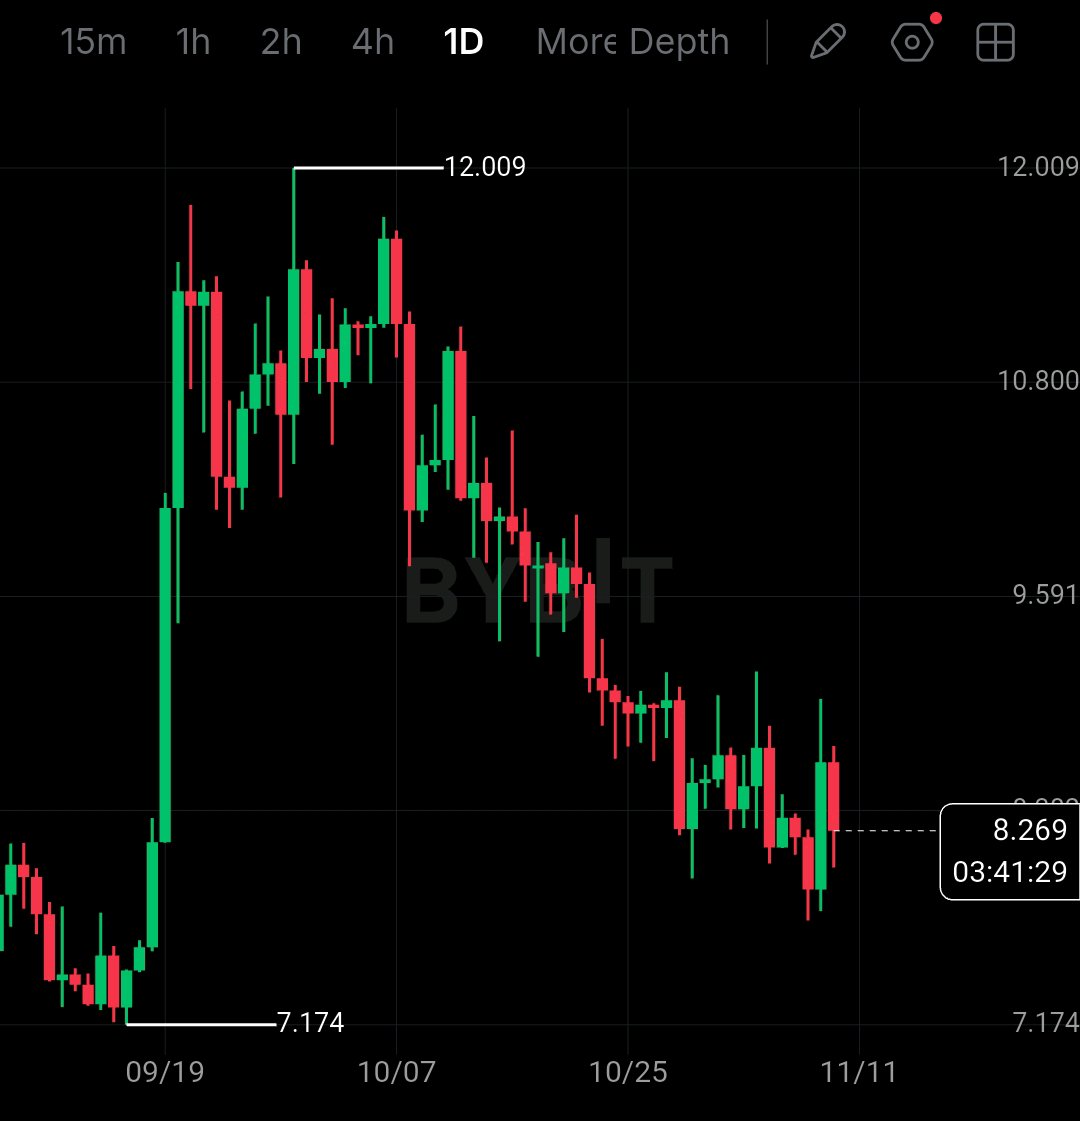
$AVAXUSDTはたった今8.54ドルを失い、残高は8.06ドルになりました。 AVAXは12.009ドルから8.26ドルまで下落しました。反発する様子はなく、じわじわと下げ続けています。 チャートが真実を物語っています。価格は9.117ドルのEMA200を下回って停滞。8.549ドルのフィボナッチラインも割り込みました。これが最後の防衛ラインでした。RSIは41付近で、売られすぎではなく、単に弱い状態。MACDは0.008で横ばい、勢いは全くありません。 もし8.062ドルを割り込んで終値を付ければ、次の下落局面として7.763ドル、そして7.528ドルへの道が開かれます。逆に8.549ドルを出来高を伴って奪還できれば、ブレイクダウンは失敗に終わり、9.117ドルが見えてきます。 私の戦略はシンプルです。中途半端なところでは買いません。8.062ドル割れでショート、ストップは8.549ドルの上、ターゲットは7.763ドルと7.528ドル。ロングは8.549ドルを奪還した場合のみ。リスクは1〜2%、最大でも分離マージンの5〜10倍レバレッジです。 皆さんはどう思いますか? 8.062ドルを割り込むか、それとも8.549ドルを奪還するか? 8.062ドルを割るなら「DOWN」、8.549ドルを奪還するなら「UP」とコメントしてください。 $AVAXUSDTをタップしてこの8.062ドルのテストでトレード、同じコインで取引しましょう。 @BybitX @Bybit Learn @PRADO @JonyDong 509 @Jiji715 @Annnn #Oracle20BFundingPlanTestsTheAITrade #MidtermsMarketWatch #AnthropicIPOValuationTest #BOE金利決定 #BybitAI進化中

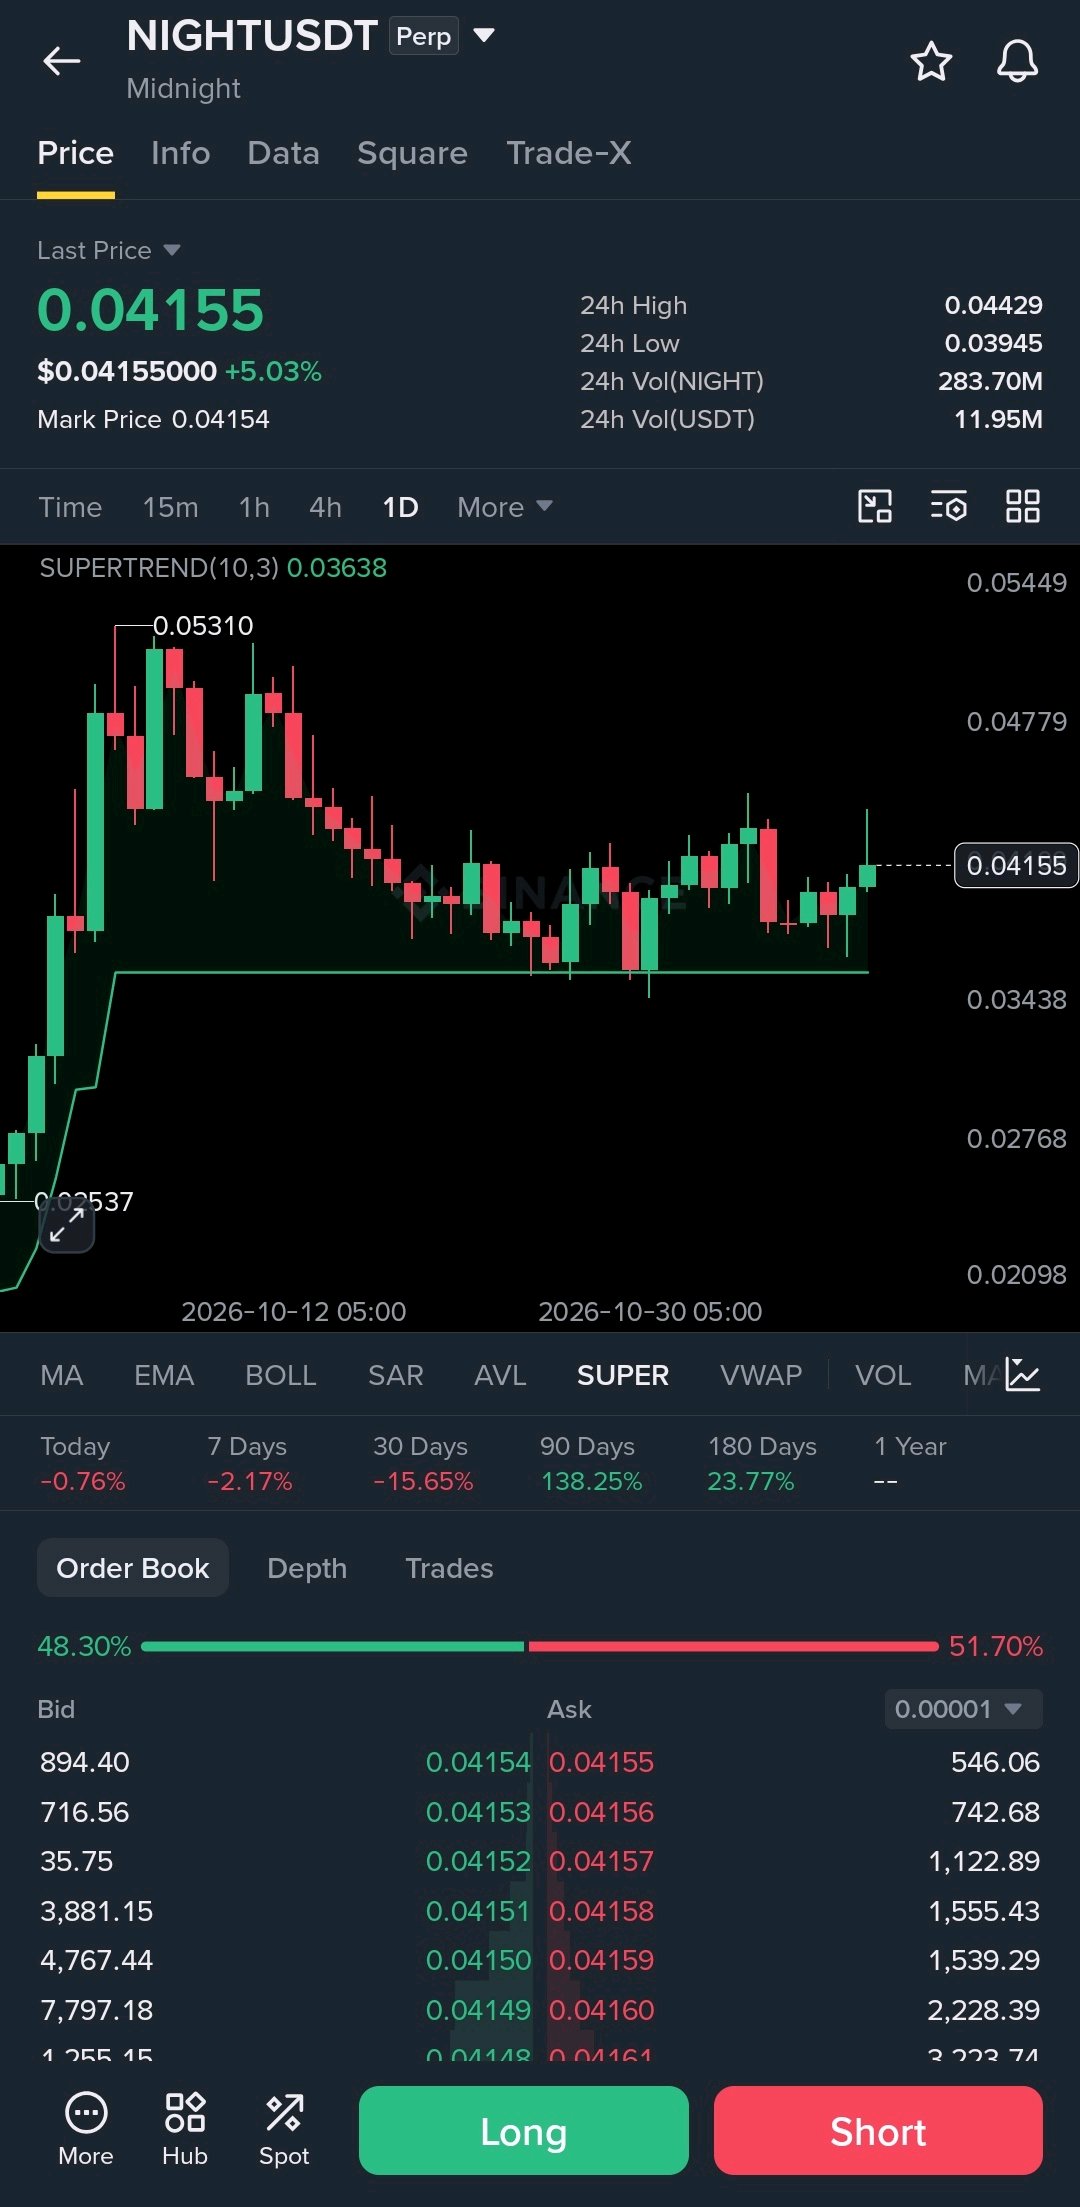
Something interesting is happening with $NIGHTUSDT , and the key level is getting closer. After pulling back from $0.0531, Midnight has started building a decent base around $0.04. Price is holding above the daily Supertrend at $0.03638, which keeps the recovery setup looking constructive. Levels I'm watching: Support: $0.0395 to $0.0364 Resistance: $0.0443 Breakout zone: $0.0478 Major level: $0.0531 A convincing move above $0.0443 could give buyers room to push higher. Losing $0.0364 would put this structure under pressure. Credit where it's due, NIGHT is showing resilience after the pullback. Now a clean breakout would be the next step. #MidtermsMarketWatch #AnthropicIPOTestsTheAIBoom
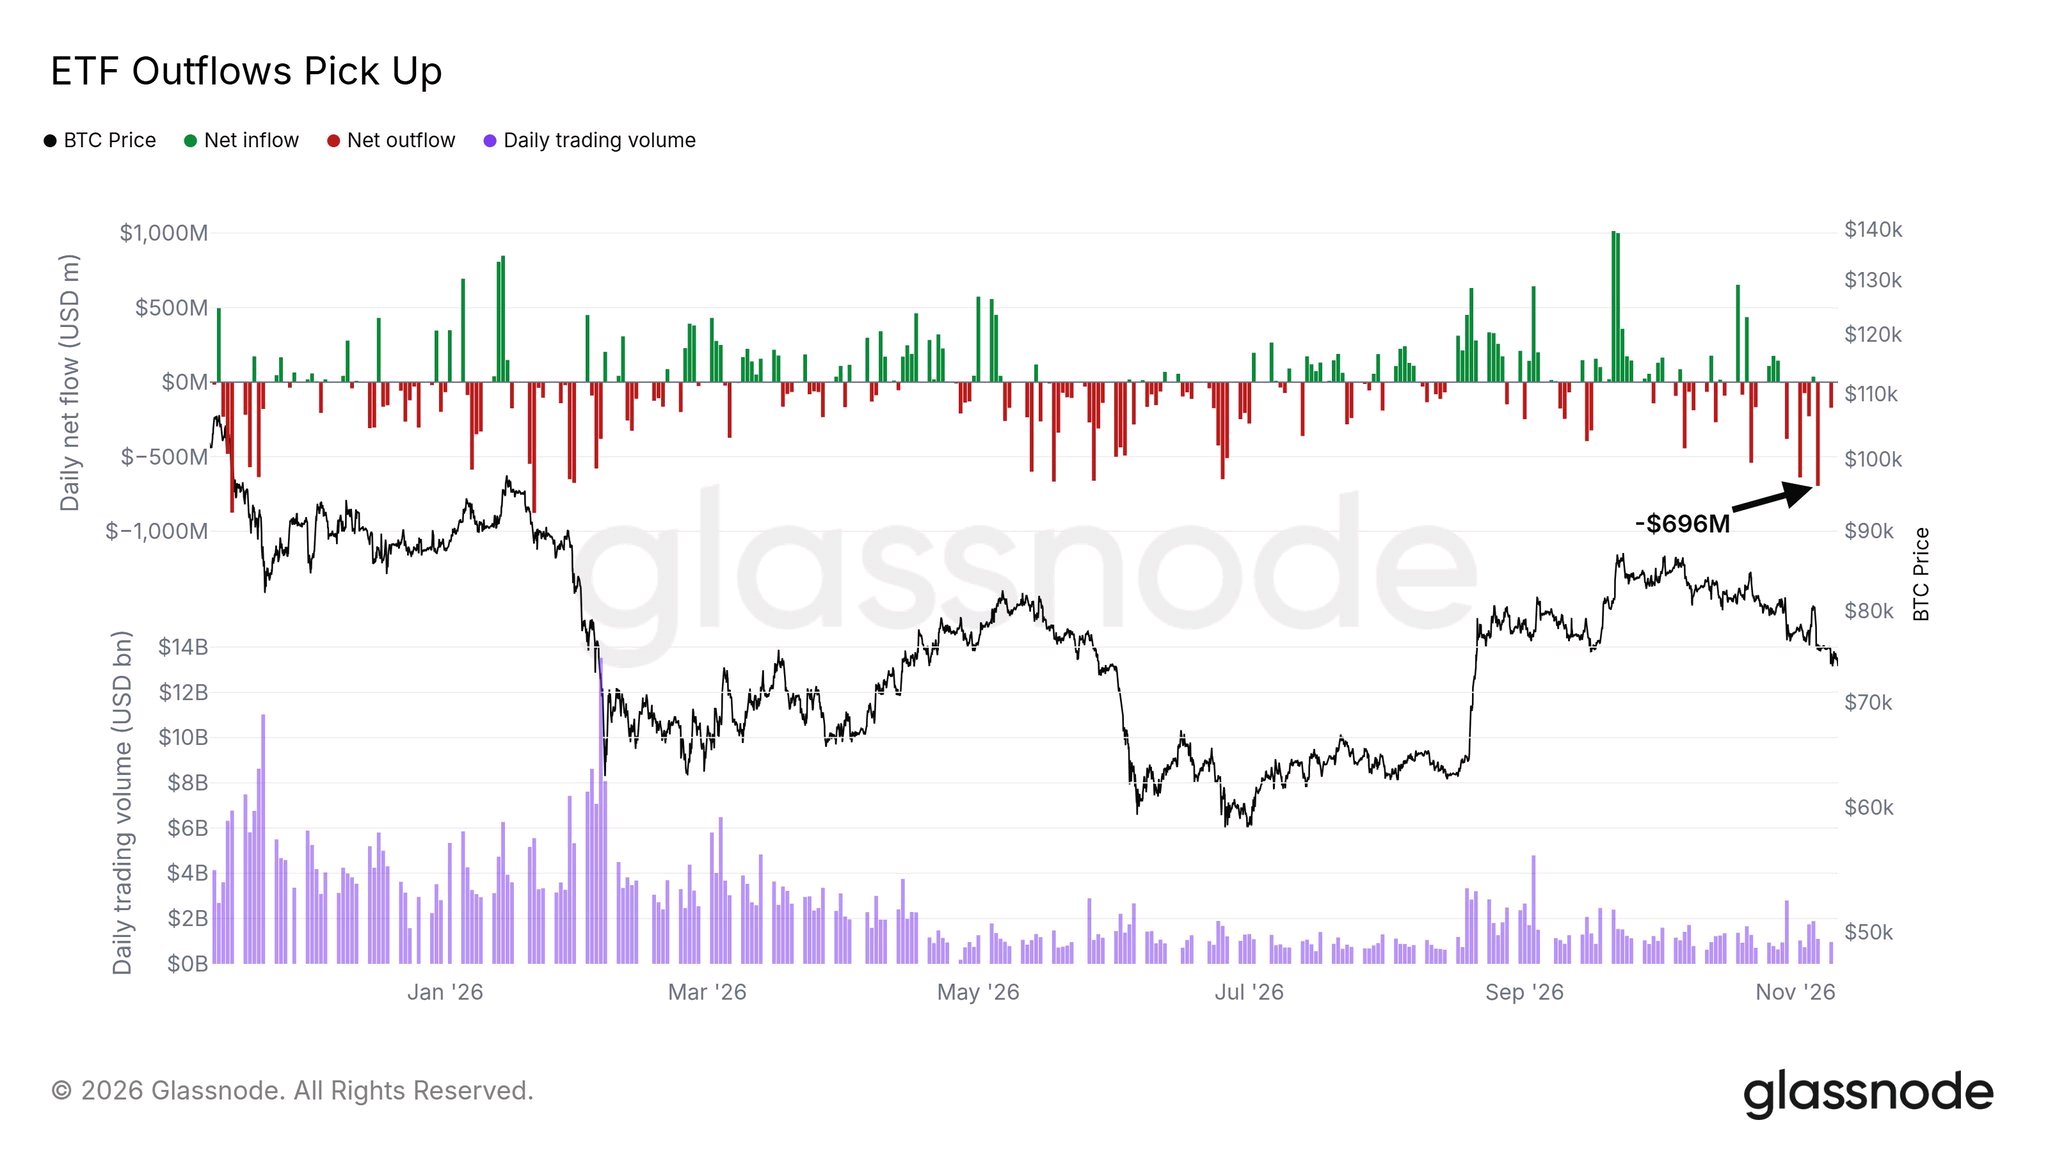
ビットコインETF、2026年はマイナスに転落:11億ドルの流出
米国の現物ビットコインETFが、2026年に入ってマイナスに転じました。 コインテレグラフが引用したFarsideのデータによると、11月9日までの純流出額は約11億ドルとなっています。BTCUSDT 2024年と2025年の両年とも、11月初旬までにこれらのファンドは約250億ドルの流入を記録していました。 下落は急速でした。SoSoValueのデータでは、11月5日時点で2026年の通算はマイナス5億200万ドルとなっていました。The Blockは、金曜日のマイナス4億1190万ドルを経て、マイナス9億1400万ドルと報じました。月曜日のマイナス2億100万ドルを加えると、約マイナス11億ドルに達します。 3つの数字。3つの日付。1つの下落(筆者による計算)。 金曜日に6億9600万ドルの流出があり、1月以来最大であったというツイートが拡散されています。私にはそれを確認できませんでした。6億9630万ドルという数字は6月25日のものです。 私が確認できた最近の最大流出日は、10月30日の6億4330万ドルです。これはCoinDesk経由のSoSoValueによると、6月25日以来最大で、ローンチ以来12番目に大きな額です。 IBITは10月30日以降、7営業日連続で流出が続いています。Farsideによると合計で約16億6000万ドルに達します。 しかし、一方通行というわけではありません。フィデリティのFBTCはそのうち2日間で資金流入がありました。モルガン・スタンレーのMSBTは今年7億8300万ドルを集めています。資金はファンド外へ流出しているだけでなく、ファンド間でも移動しているのです。 規模感で言うと、これらのファンドは依然として約959億ドル(ビットコイン時価総額の6.28%)を保有しています。マイナス11億ドルという今年の数字はその約1.1%に過ぎません(筆者による計算)。 「安定した資金流入に戻ればプレッシャーは和らぐ」というのはもっともですが、循環論法でもあります。この秋、資金フローは価格に連動してきました。 私は2つの点に注目しています。1日だけの資金流入が連続的な流れに変わるかどうか。そして、IBITの流出がようやく止まるかどうかです。 #WSOT2026 #11月米国CPIウォッチ #Oracle20BFundingPlanTestsTheAITrade #MidtermsMarketWatch #AnthropicIPOValuationTest


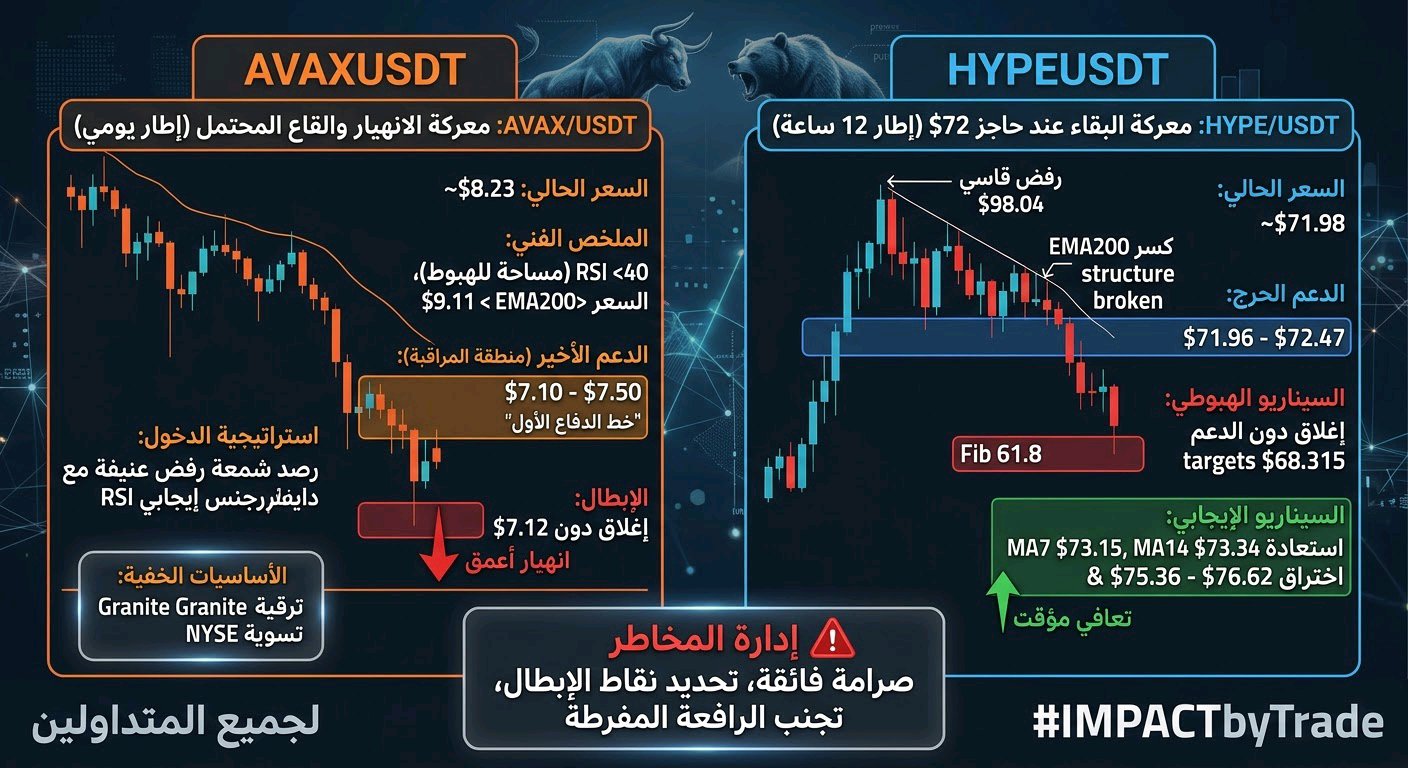
A battle for survival! Will the bottoms hold, or will we wait for the deeper "bleeding"? 🩸📉 AVAXUSDT$AVAXUSDT is teetering on edge of a major Breakdown, is the bottom finally in? Avalanche is trading around $8.23, down a brutal 7.48%, as entire altcoin market bleeds out and sellers relentlessly hammer price lower. chart looks ugly, sentiment is in the gutter, and the bulls are nowhere to be found. 👀 but chart is starting to show a setup worth watching. 😋 what stands out on the 1D chart. RSI hovering near 40, showing that momentum is weak but not yet fully oversold, there is still room for another leg down before a meaningful bounce. eMA200 at $9.11, and price is trading well below it, this is a massive bearish signal, confirming that the macro trend has flipped. support around $7.12-$7.50 green zone that buyers absolutely must defend. 🌊 break below this and it is a freefall. resistance $9.11 (EMA200) overhead ceiling that has been rejecting price for weeks. mACD deep in negative territory with a bearish histogram, confirming that sellers are still in full control. 📰 news nobody is talking about. Avalanche has been rolling out major upgrades, the Granite upgrade introduced sub-second confirmations and biometric authentication for dApps. avalanche foundation is even pursuing a $1 billion institutional capital raise through U.S. corporate treasuries. just recently, reports surfaced that the New York Stock Exchange will settle tokenized stocks on the Avalanche blockchain, a massive validation of the network's infrastructure. yet despite this barrage of bullish fundamentals, the price keeps bleeding, this is the ultimate bearish divergence. good news is being sold, market is telling us that the path of least resistance remains down, at least for now. My trading plan: I'm watching the $7.10-$7.50 green zone closely. This is the last line of defense. If AVAX breaks below $8.00 with volume, I expect a rapid flush into the green zone. That is where I will be watching for a reaction. if price reaches the green zone and shows a violent rejection wick with a bullish divergence on the RSI, that is when start building a position. confirmed breakout above the local resistance after defending this zone would be the signal that the tide has finally turned. however, a clear break and close below $7.12 would invalidate the entire setup and could open the door to a deeper capitulation toward $6. opportunity isn't catching a falling knife. It's waiting for the market to flush out the weak hands and confirm that the green zone is a hard floor. would you consider accumulating AVAX near the $7.50 green zone, or wait for a confirmed breakout above $9.11? 😋 #IMPACTbyTrade 🚨 HYPE at the Edge: Will the $72 Floor Hold? 📉 The battle for HYPE is reaching a make-or-break $HYPEUSDT moment as the token directly tests its most critical support of the season. Currently trading at $71.98 (-5.59% in the 24h cycle on a 46.38M volume), HYPE is staring right down the barrel of a massive trend-continuation or breakdown. There is a deeply concerning, higher-timeframe bearish pattern that most retail traders are failing to acknowledge. The Hidden 12-Hour Trap 🔍 The Failed Reclamation: After its brutal rejection from the $98.04 peak, HYPE attempted a recovery but was aggressively pushed back, printing a prominent lower high directly into a heavy supply zone. The Structure Break: This drop wasn't just a simple rejection. The key trigger was when the price broke down from the EMA 200, severely damaging its daily market structure. Volume and Price: Volume compression alongside sustained lower highs indicates that sell-side pressure on relief bounces is far outpacing new buyers. HYPE recently fell right through its $73.57 intraday target and is now actively testing the $71.96–$72.47 floor. Critical Trading Scenarios & Invalidation 🎯 ($HYPE$HYPEUSDT USDT) 📉 Bearish Target ($68.315) 🔴 If HYPE fails to gain buy-side traction here and suffers a decisive close below the $72.00–$72.47 zone, the macro bullish case is delayed. This failure would strongly confirm a deeper slide down to the $68.315 Fibonacci target, sweeping historical liquidity. Bullish Invalidation & Relief Target ($75.36 – $76.62) 🟢 To invalidate the downward channel, bulls must orchestrate a high-volume reversal, reclaiming MA7 ($73.15) and MA14 ($73.34) to force a daily breakout above the $75.362–$76.62 resistance cluster. That's where the actual target for a temporary recovery sits, but this requires genuine spot absorption. Mindset Warning 💡 HYPE has shown how quickly its momentum can evaporate. Always preserve capital, manage your leverage defensively, and identify your invalidation mark before you enter a position. Are we witnessing the final flush before a relief bounce, or is HYPE about to lose the $72 floor and tumble deeper? Drop your setup below 👇! #IMPACTbyTrade #WSOT2026 #WSOTPicktoEarn10U #BybitAIEvolving #مراقبة سوق الانتخابات النصفية #ByXIMPACT

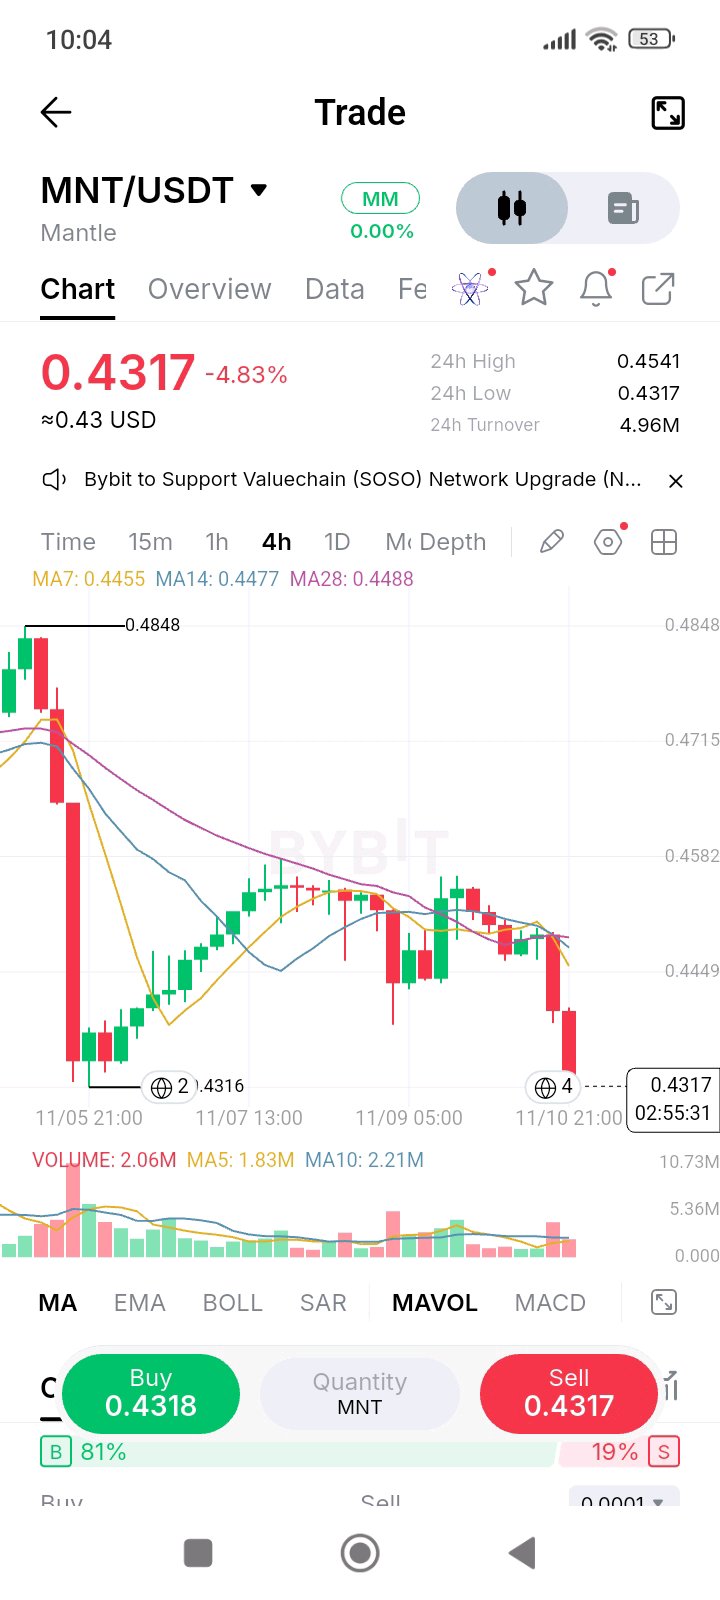
$MNT at $0.4317: Will Buyers Defend Support?
$MNT Under Pressure! Can Buyers Defend $0.4316? 👀 I’ve been watching $MNT closely, and this latest move is definitely not something I want to ignore. Mantle has faced serious selling pressure after failing to sustain its recovery, and now the market is testing an important support zone. $MNT is trading around $0.4317, down nearly 4.83%. After recovering from the previous sharp drop, price spent time consolidating around $0.445–$0.455, but sellers have stepped back in and pushed it toward the recent low. This tells me buyers are losing short-term control. 📊 The technical picture isn't looking comfortable. On the 4H chart, MA7 sits at $0.4455, MA14 at $0.4477, and MA28 at $0.4488. Price is below all three averages, showing bearish momentum. 🐋 I don't have confirmed whale-flow or token-unlock data, so I'm not going to invent a story. Volume and buyer absorption around support are what I want to monitor next. 🎯 Key levels I'm watching: * Support: $0.4316 * Resistance: $0.4455–$0.4488 * Breakout level: $0.4541 * Next upside target: $0.4541 on a successful recovery. 🔥 If $0.4316 breaks decisively, further downside pressure could follow. But if buyers defend this zone and reclaim the moving averages, a recovery becomes interesting. I'm still watching $MNT. No blind entries, no chasing candles. Will buyers defend this support, or are sellers preparing another leg down? #WSOTPicktoEarn10U #OilVolatilityTracksIranPeaceTalks #Oracle20BFundingPlanTestsTheAITrade #MidtermsMarketWatch

Выбор NYSE для AVAX и взлет GRAM 🚀
Всем привет! Короткий вечерний дайджест рынка с самыми важными событиями из вашего списка, которые выделяются на фоне сегодняшней волатильности: AVAX демонстрирует уверенный рост на повышенных объемах вопреки общей коррекции рынка. Главным драйвером послужила новость о том, что Нью-Йоркская фондовая биржа (NYSE) выбрала блокчейн Avalanche в качестве расчетной сети для своей будущей круглосуточной платформы торговли токенизированными ценными бумагами. GRAM стал главным лидером дня среди альткоинов, прибавив почти 9% за последние 24 часа на фоне охлаждения остального рынка. Монета уверенно удерживает внимание трейдеров и демонстрирует лучшую суточную динамику среди отслеживаемых активов. Не финансовый совет, просто делюсь тем, что попало в поле зрения. Всем отличного вечера и профитных торгов! 👍 #Наблюдение за рынком в период промежуточных выборов #ByX $AVAXUSDT $GRAMUSDT
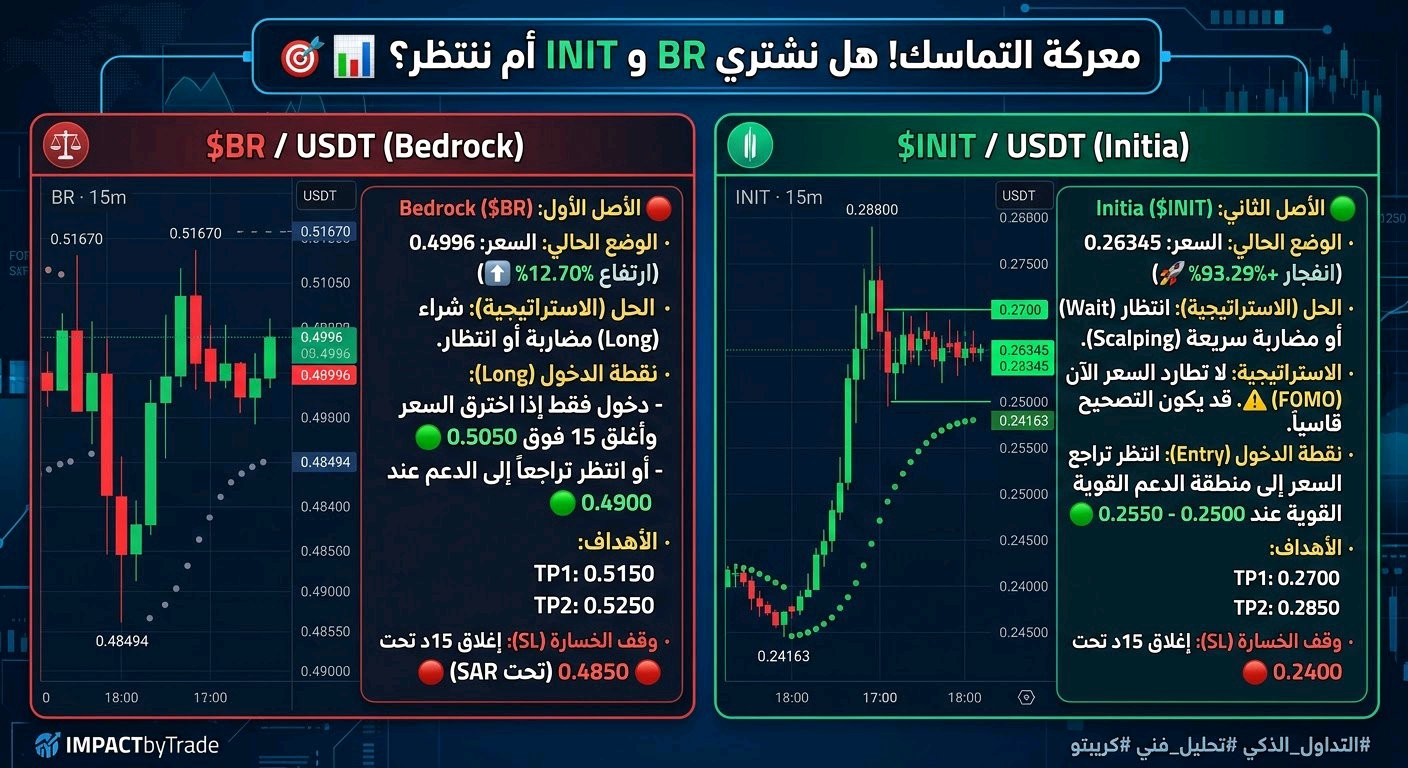
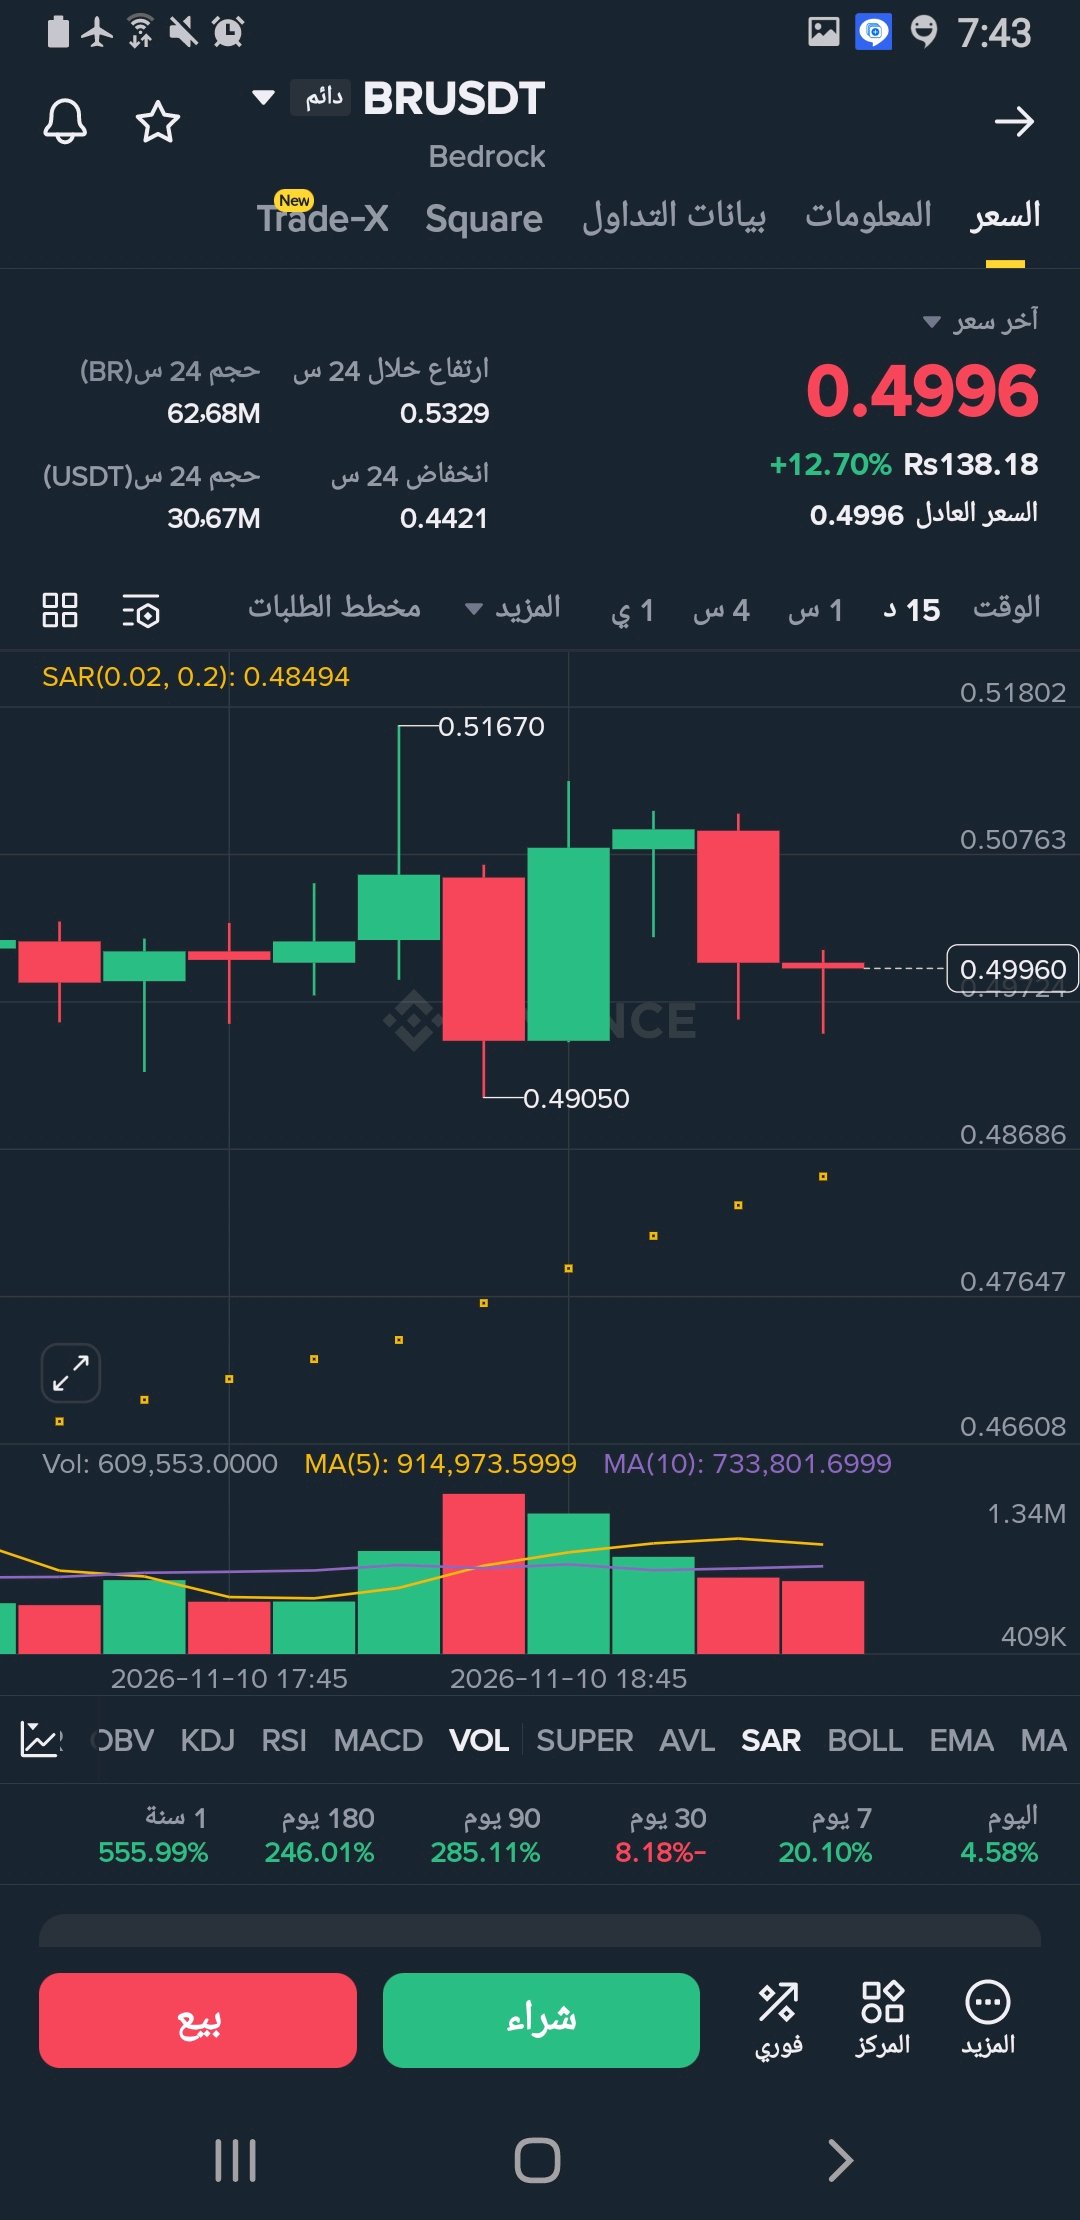
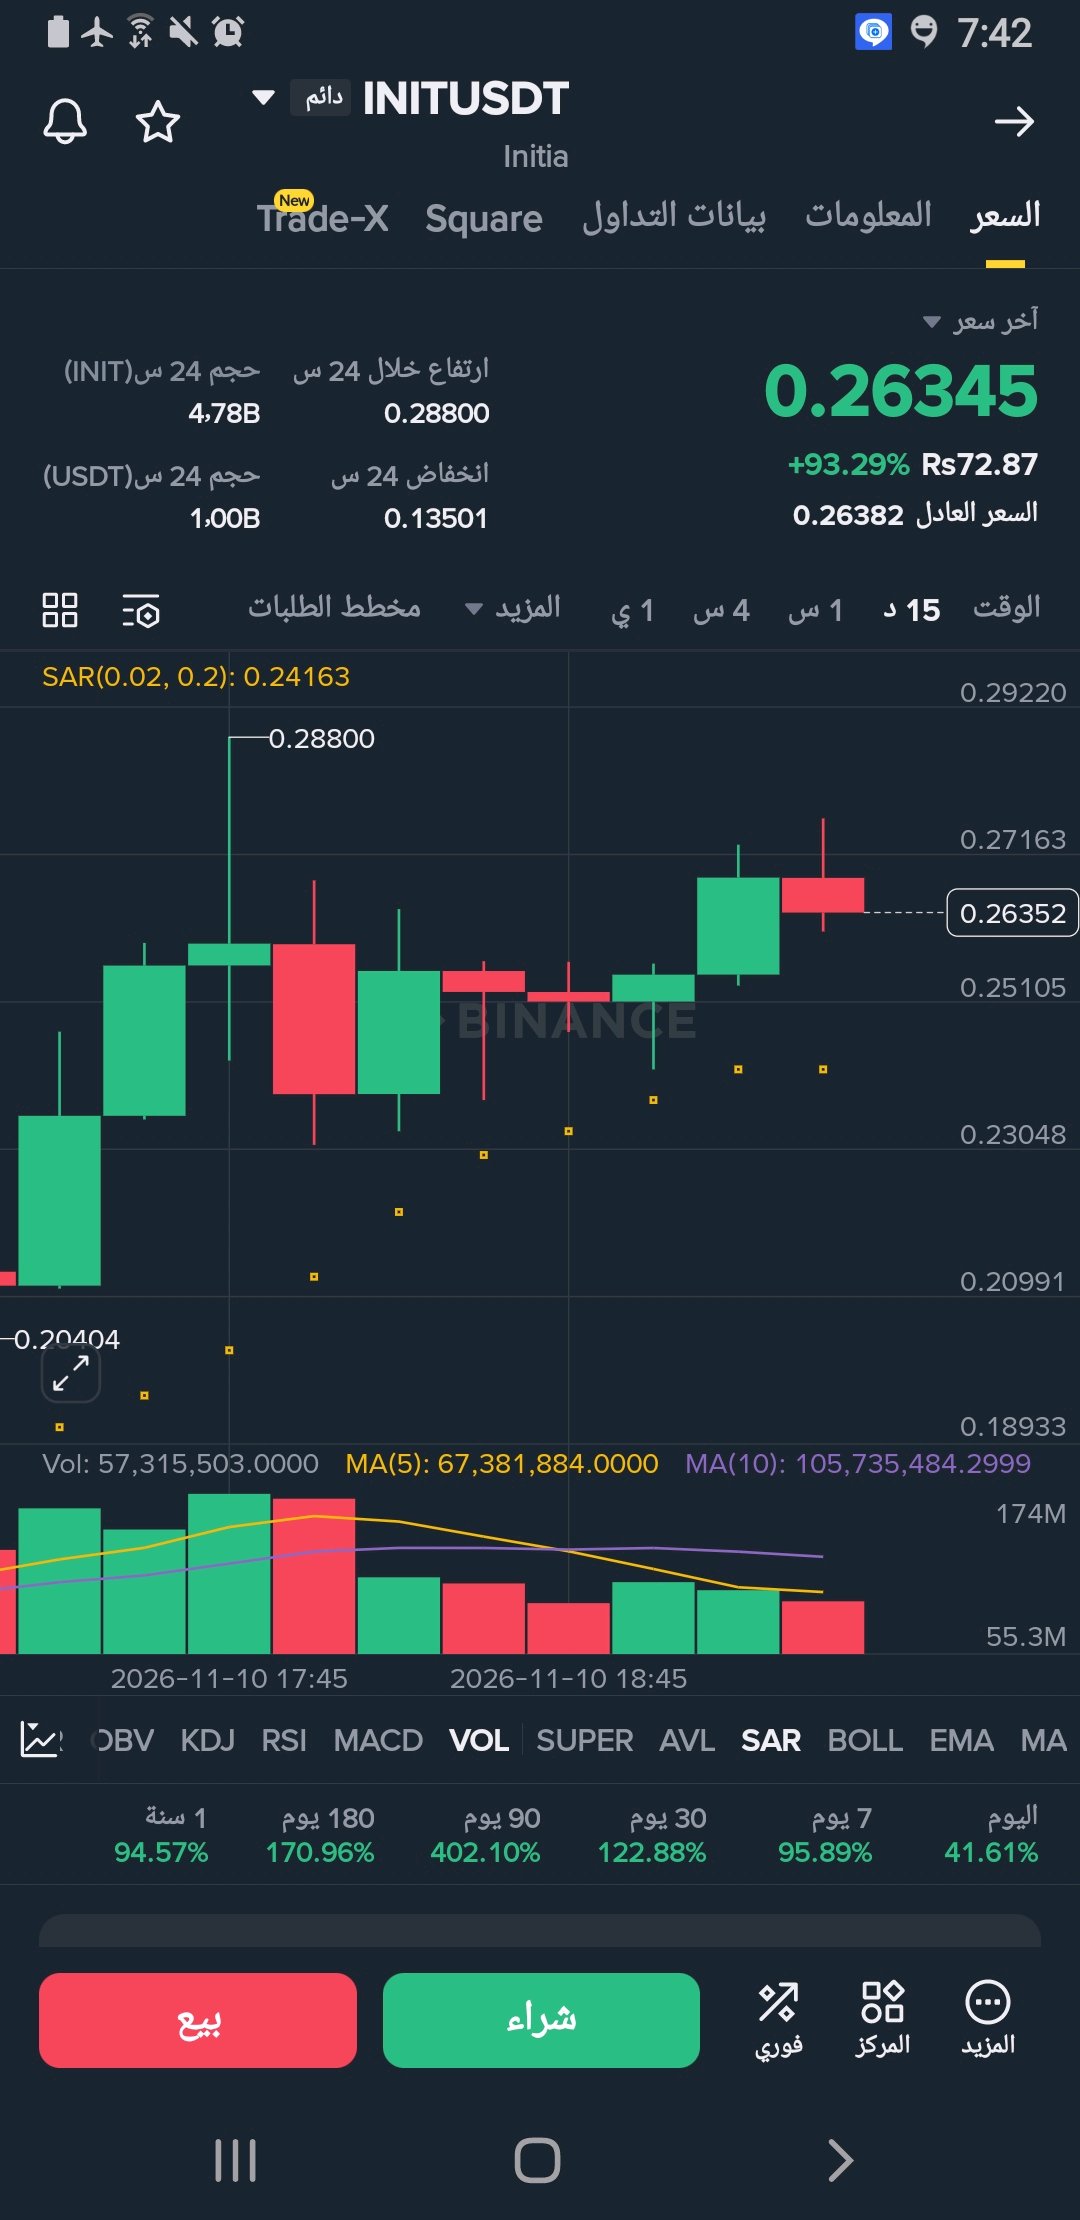
#IMPACTbyTrade The Battle for Consistency! Should we buy BR$BRUSDT and $INITUSDT INIT or wait? 🎯📊 Hello traders! Today we're reviewing two charts reflecting sharp fluctuations on the 15-minute timeframe. Both currencies are showing significant volatility, and the process requires precision and caution. Here's the trading solution (action plan) for each: 🔴 First Asset: $BR/USDT (Bedrock) · Current Situation: Price at 0.4996 (up +12.70%). · Technical Analysis: The currency has experienced extreme volatility, reaching a high of 0.51670 and then falling to a low of 0.49050. The current price is trading in a narrow range (small red candle). The Parabolic SAR indicator is below the price at 0.48494, supporting a bullish bounce scenario. Volume is average. · Solution (Strategy): Buy (Long) speculatively or wait. • Entry Point (Long): Only enter if the price breaks through and closes a 15-minute candle above 0.5050. Or wait for a pullback to support at 0.4900. • Target 1 (TP1): 0.5150. • Target 2 (TP2): 0.5250. • Stop Loss (SL): 15-minute candle closes below 0.4850 (below the SAR indicator). 🟢 Second Asset: $INIT/USDT (Initia) • Current Situation: Price at 0.26345 (+93.29% breakout). • Technical Analysis: Rocket Rise! Reached a high of 0.28800 and then corrected. Currently, the price is moving sideways between 0.2500 and 0.2700. The SAR indicator is still below the price at 0.24163 (positive signal). Volume has started to gradually decrease after the initial breakout. • Solution (Strategy): Wait or Scalping. Strategy: Don't chase the price now (FOMO). The currency is up +93% in one day, meaning a correction could be sharp. Entry Point: Wait for the price to pull back to the strong support zone at 0.2500-0.2550. Target 1 (TP1): 0.2700. Target 2 (TP2): 0.2850. Stop Loss (SL): 15-minute candle closes below 0.2400. #WSOT2026 #WSOTPicktoEarn10U #BybitAIEvolving #مراقبة سوق الانتخابات النصفية @

$ADA | Innovation attracts attention, but adoption is what gives a blockchain lasting relevance. Cardano takes a research-driven approach to development, using its Proof-of-Stake consensus mechanism to secure the network while supporting a growing smart contract ecosystem. Three areas deserve attention: → DeFi growth and active applications. → Developer activity and on-chain usage. → Governance participation and ecosystem expansion. The key challenge is converting technical progress into consistent user demand. For ADA, real adoption matters more than development headlines. #ADA #Cardano #Blockchain #Bybit #ByX #MidtermsMarketWatch
$BTC | Bitcoin's real strength goes beyond price. It's built on scarcity, security, and decentralization. With a fixed maximum supply of 21 million BTC, Bitcoin operates through a Proof-of-Work system that protects its network without central control. What matters now: → Institutional demand and capital flows. → ETF activity and broader market sentiment. → Whether buyers can defend key support levels. Entry zones to monitor: → $75K–$77K: Potential support area. → $72K–$74K: Deeper pullback zone. → $80K–$82K: Recovery and confirmation area. These are observation zones, not guaranteed entry signals. Wait for price confirmation before considering a spot position. Scarcity creates the foundation. Demand drives the market. #BTC #Bitcoin #Bybit #ByX #MidtermsMarketWatch

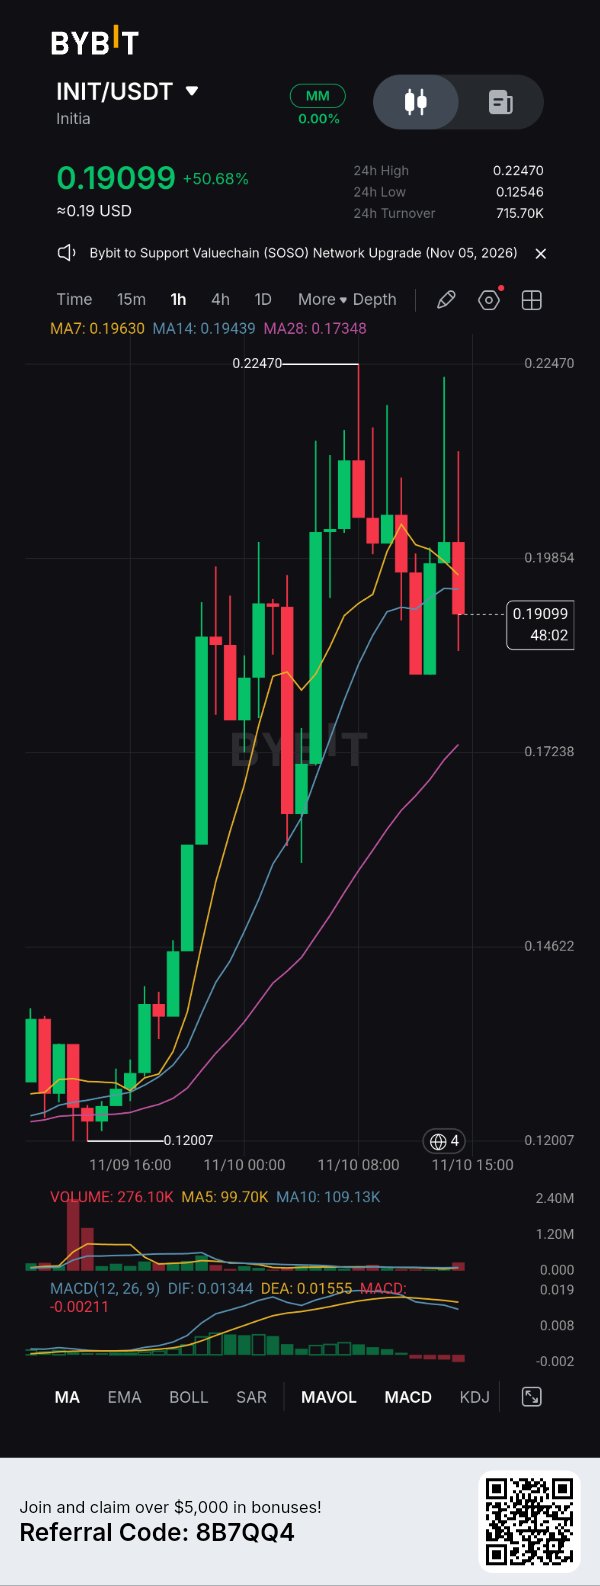
🚀 $INITUSDT: +50.68% — BUT THE NEXT MOVE COULD BE MORE INTERESTING THAN THE RALLY! Some traders celebrate a 50% move. Others immediately start asking one question: Who's still buying after the big move? 💰 Current price: $0.19099 📈 24H change: +50.68% 🔝 24H high: $0.22470 🔻 24H low: $0.12546 💵 24H turnover: $715.70K 🧾 THE RALLY AUDIT INIT has made an impressive move, climbing from the lower price region towards $0.22470 before pulling back. That tells us buyers have demonstrated considerable strength, but the rejection from the high deserves attention. The market is now deciding whether this is simply a cooling-off period or the beginning of a deeper correction. 🔍 WHAT THE INDICATORS SAY Moving averages: - MA7: $0.19630 - MA14: $0.19439 - MA28: $0.17348 Price is currently below MA7 and MA14 but remains above MA28. The broader recovery structure is still visible, although short-term pressure has increased. MACD: - DIF: 0.01344 - DEA: 0.01555 - Histogram: -0.00211 DIF has crossed below DEA, with a negative histogram. Short-term momentum is weakening. Volume: - Current: 276.10K - MA5: 99.70K - MA10: 109.13K Current volume is above both averages. That means activity remains elevated, but volume alone cannot tell us whether buyers or sellers will control the next move. 🎯 THE LEVELS ON MY RADAR 🟢 $0.19854: First important recovery area. 🚀 $0.22470: Previous high. A convincing breakout with sustained buying could reopen the upside. 🛡️ $0.19439–$0.19000: Area to monitor for a potential recovery attempt. 🔻 $0.17348: MA28, an important deeper support reference. A sustained move below this region would weaken the current recovery structure. 🧠 THE TRADER'S VERDICT INIT has already delivered a major move. The temptation now is to jump in because the chart looks exciting. But experienced traders know that missing an entry is better than forcing one. I'm watching for price to reclaim the short-term averages, MACD to improve and buying volume to support the recovery. The first rally gets attention. The next move reveals who really has control. INIT traders, are you waiting for a fresh breakout above $0.22470 or looking for a healthier pullback before considering an entry? 👀 Analysis based on the supplied 1H chart. These are technical observations, not guaranteed predictions or financial advice. #IMPACTbyTrade #BybitAIEvolving #WSOTPicktoEarn10U #MidtermsMarketWatch


SUI
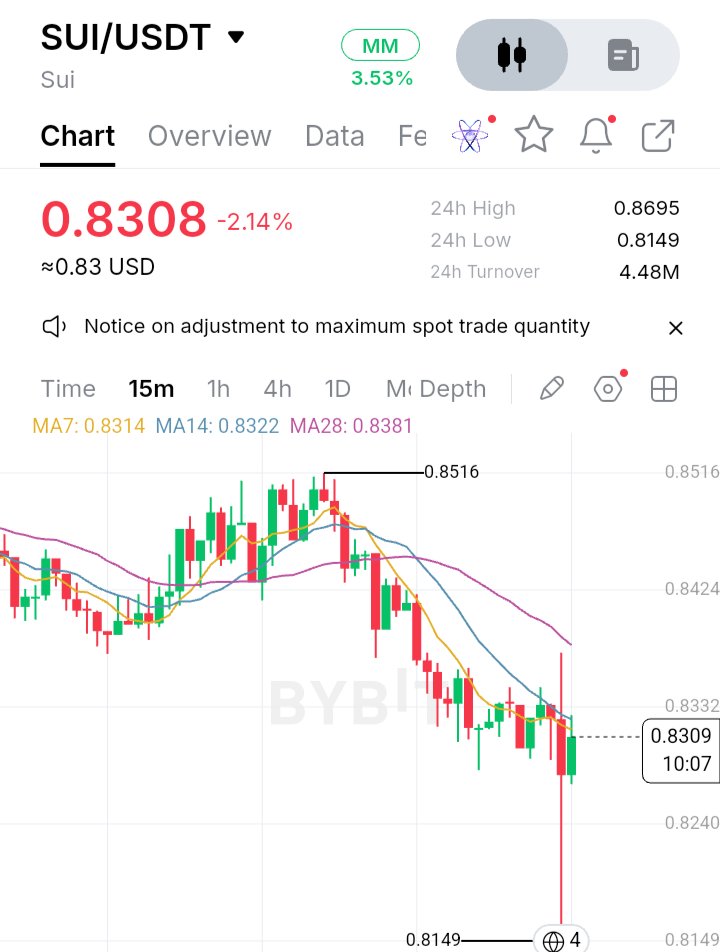
$SUIUSDT I used to think a falling price automatically meant sellers were winning. But looking at SUI's latest 15-minute chart, I'm paying closer attention to what happens after a sharp sell-off. SUI is trading around $0.8308, down 2.14%, after losing momentum from its recent high near $0.8516. What caught my attention is the aggressive downside move followed by a long lower wick reaching $0.8149. That wick is worth watching. It suggests price moved significantly lower before recovering, indicating that buyers responded at those levels. However, I wouldn't call it a confirmed reversal just yet. Another detail reinforces the cautious outlook. SUI is trading below its MA7 at $0.8314, MA14 at $0.8322 and MA28 at $0.8381. This alignment shows that short-term momentum remains under pressure. For me, $0.8149 is the important downside reference, while $0.8381 is the level bulls need to reclaim to improve the short-term structure. I want to see whether buyers can turn this initial reaction into sustained recovery. A single lower wick can attract attention, but follow-through is what gives it meaning. I'm watching the next few candles closely. #MidtermsMarketWatch #WSOTPicktoEarn10U #NovUSCPIWatch


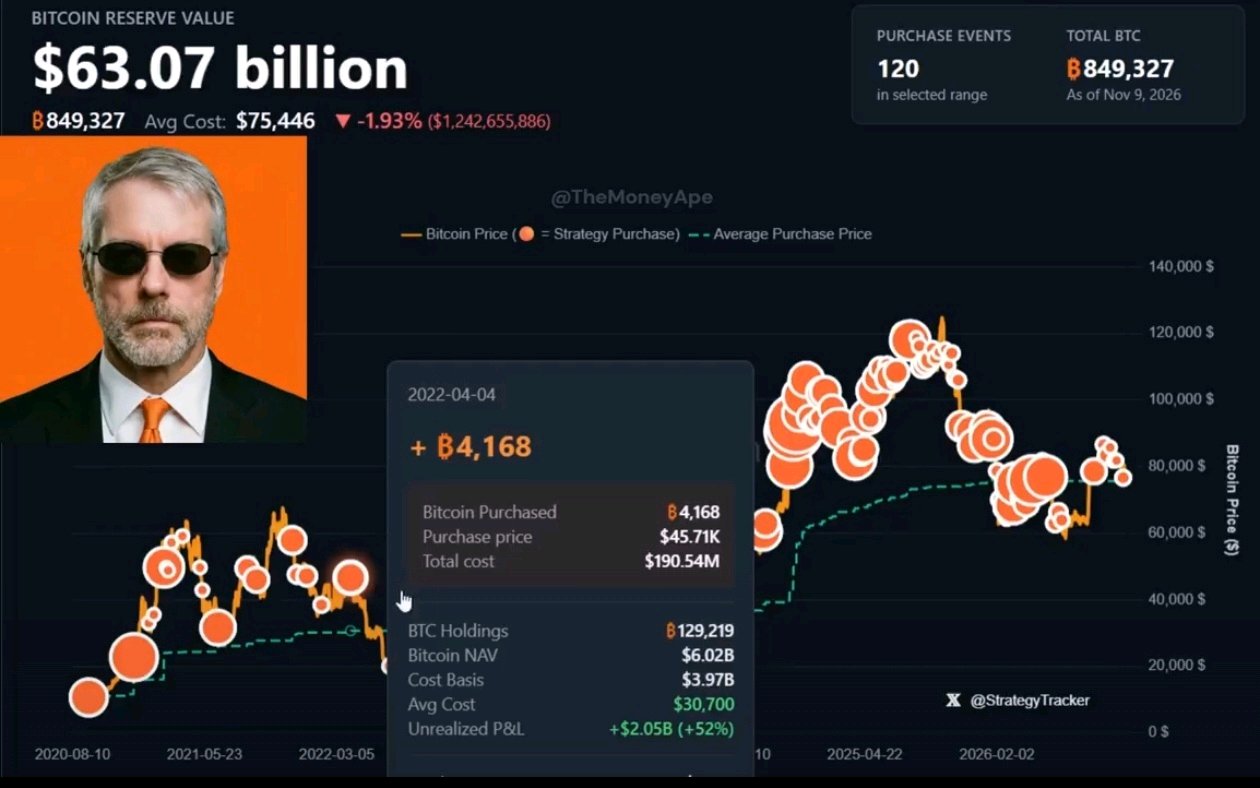
🚨 THE BIGGER THEY SELL, THE MORE SAYLOR BUYS! 🚀
1,037 $BTCUSDT added to the bag worth $77.60 MILLION! 💰 Strategy now holds a massive 850,364 BTC. While paper hands panic and sell, the long-term believers keep accumulating. 🔥 Every dip is an opportunity. 🔥 Every sell-off creates accumulation. 🔥 Bitcoin supply keeps getting tighter. FOR EVERY SELLER, THERE IS SAYLOR. 🧡 THE BTC BULLS ARE NOT DONE YET! 🚀📈 #WSOT2026 #WSOTPicktoEarn10U #MidtermsMarketWatch
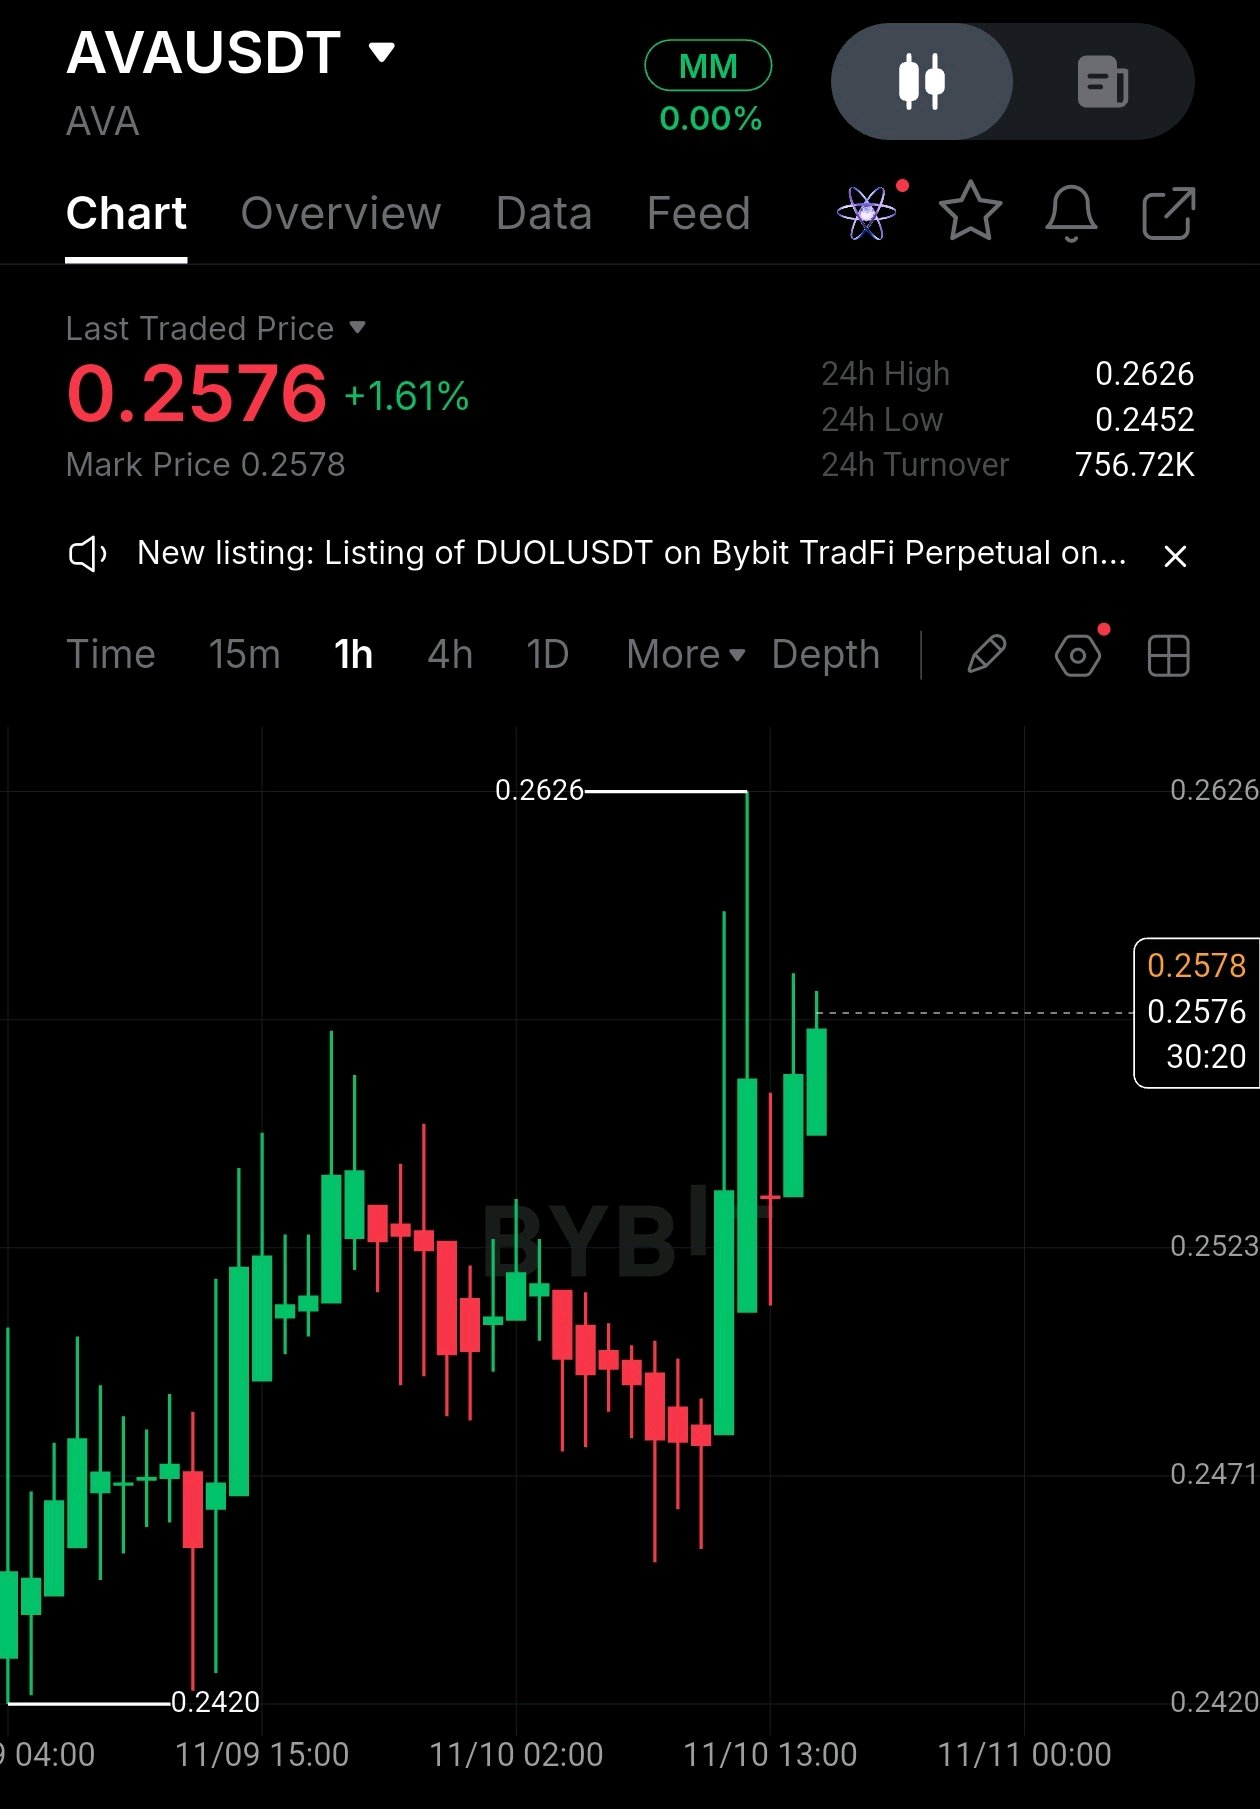
みんな、$AVAのロングセットアップを監視中。👀🔥 $AVAUSDT | 無期限先物 🎯 利確 (TP): 0.2620 🛑 損切り (SL): 0.2518 📍 エントリーゾーン: 0.2545 – 0.2560 ここがいいのは、単なる強気モメンタムだけじゃなくて、直近の売り圧力に対する価格の反応だね。 売り手がAVAを押し下げようとしたけど、0.2470–0.2480付近で買い手が積極的に参入してきた。 この回復を見て!💥 強い陽線が出て、価格を0.2576まで押し戻した。これは短期的な構造において、買い手が主導権を握りつつあることを示唆してる。 さて、重要なレジスタンスは0.2626付近。 ここは前回の高値で、そのレベルより上には流動性が溜まっている可能性がある。買い圧力が続けば、マーケットメイカーはそのエリアをターゲットにするかもしれない。 僕の考え方はシンプル: AVAが0.2545を維持して、買い手が勢いを保つなら、0.2620への再上昇を狙う。 1時間足で0.2626を明確にブレイクすれば、さらなる上昇の扉が開く可能性がある。 でも、0.2520を割り込んだら強気セットアップは崩れるし、さらなる調整が続くかもしれない。 適当に緑のローソク足を追いかける気はない。重要なレベルで価格がどう反応するかを見極めたい。 忍耐が先、実行は後。😮💨📈 みんなはどう思う? 👇 $AVAは0.2620を目指してブレイクアウトすると思う?それとも先に調整が来るかな? 🚀 #11月米国CPIウォッチ #MidtermsMarketWatch

PEPE Is Still on My Watchlist…🐸!!
Honestly, I think $PEPEUSDT is one of those coins people either love or completely ignore. When the market is green, everyone talks about it. When the market turns red, most people disappear. But here's what I'm curious about… Will PEPE surprise everyone again in the next bull run, or has its biggest moment already passed? I'm watching, not predicting. What's your opinion on PEPE? $HYPEUSDT #USPayrollsAndRateDecisionsDriveMacroWeek #MidtermsMarketWatch #Oracle20BFundingPlanTestsTheAITrade #WSOT2026 #OilVolatilityTracksIranPeaceTalks


$INJUSDT is up 10.34% over the last 7 days, but its derivatives market is telling a less convincing story: futures volume reached $235.69M against just $33.12M in spot volume on November 10. That is a 7.1x difference. The rally is attracting traders, but genuine spot demand is not keeping pace. There is a fundamental reason INJ remains interesting. According to its September 2026 SEC filing, Injective had approximately 90,000 daily active wallets during Q3 and had facilitated more than $75B in cumulative spot trading volume. Its community buyback mechanism also connects application-generated fees with INJ accumulation and redistribution. However, adoption does not automatically translate into immediate price appreciation. The current market structure needs attention. INJ is trading around $8.02, with a 24-hour range of $7.82–$8.29. Meanwhile, aggregate futures open interest has declined 5.42% to approximately $149.39M. For the next 24–72 hours, watch the $8.25 resistance zone. A convincing breakout with stronger spot participation could open $8.55, followed by $8.80. On the downside, $7.82 is the immediate support. A decisive break below it invalidates the recovery setup. Risk: leveraged positioning could unwind before spot buyers step in. INJ needs real spot demand to validate this recovery. Until then, the rally remains vulnerable to a derivatives-driven reversal. #MidtermsMarketWatch


NVDAXUSDT Bottom Formation & Resistance Retest
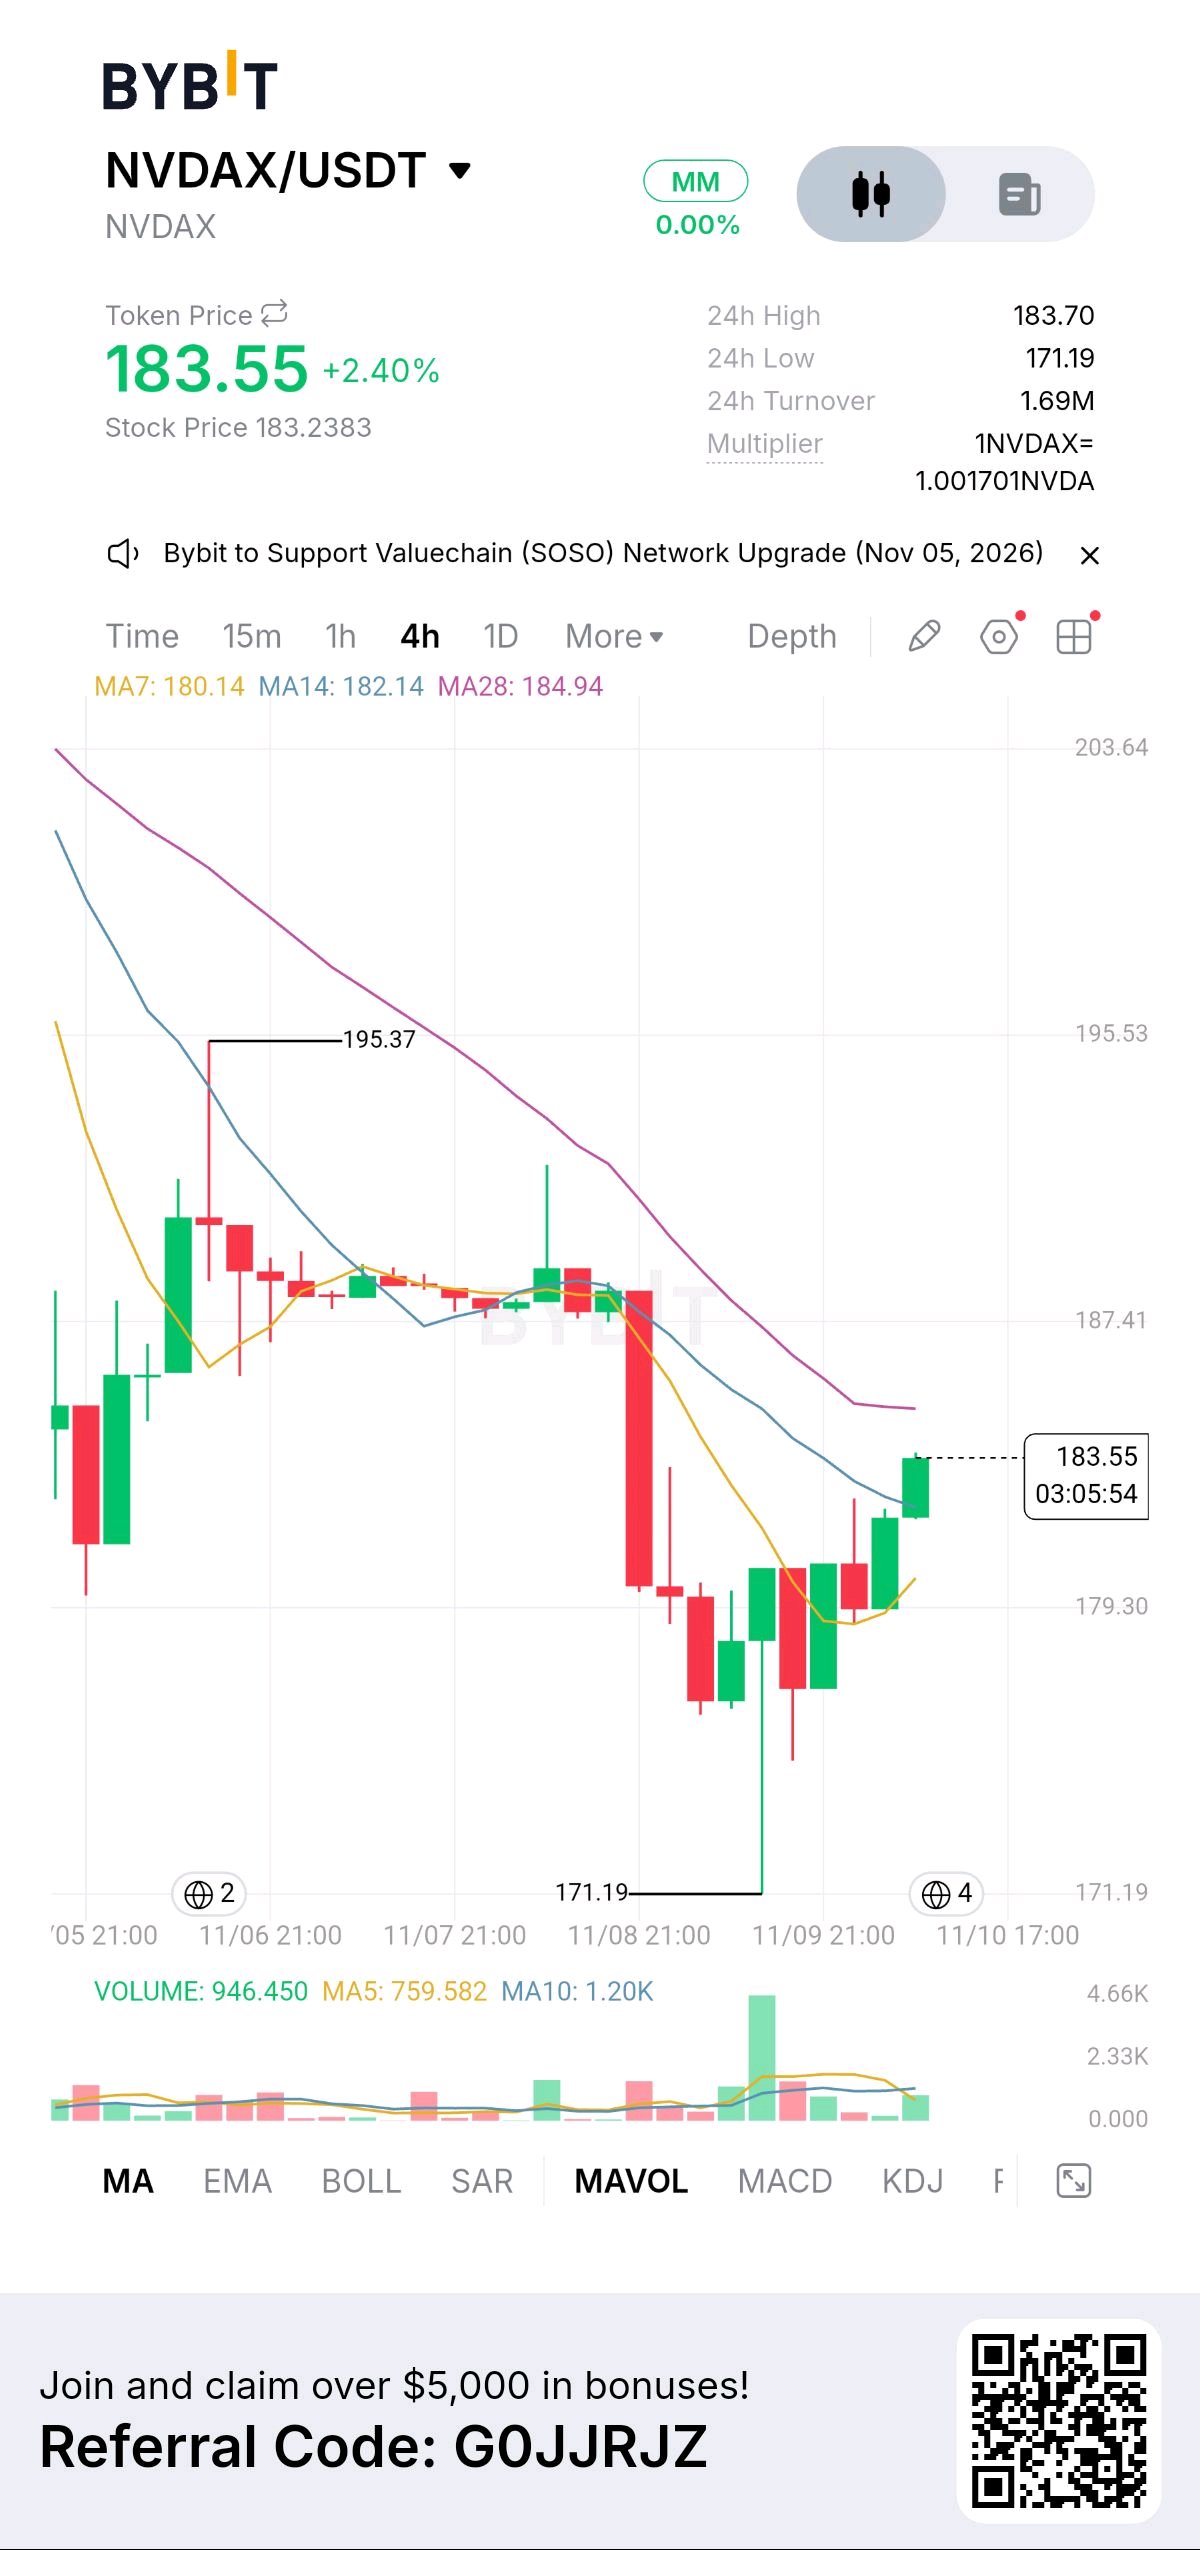
📈 $NVDAXUSDT is showing signs of a potential trend reversal on the 4-hour timeframe, currently trading at 183.55 (+2.40%). After a prolonged downtrend, the asset established a sharp local support floor at 171.19 and has staged a steady recovery, now testing immediate overhead resistance. ▪️ Technical Setup: The asset is attempting to reclaim its short-term moving averages. The price is currently trading above the MA7 (180.14) and MA14 (182.14), but faces immediate pressure from the MA28 at 184.94. The tight cluster of these MAs suggests a consolidation phase before the next major move. ▪️ Indicators: 24h turnover stands at 1.69M with a 24h low of 171.19. The volume profile shows a notable spike in buying volume during the initial bounce from the floor, indicating buyers are actively stepping in to defend the 180.00 psychological level. ▪️ Outlook: A clean 4-hour close above the 184.94 (MA28) ceiling is critical to confirm a bullish continuation toward the previous high of 195.37. Conversely, if rejected here, the price may retest the MA7 dynamic support to build further momentum. ⚠️ Risk Disclosure: High-volatility markets can experience rapid price swings. This analysis is for educational purposes only and does not constitute financial advice. #WSOT2026 #BybitAIEvolving #MidtermsMarketWatch


ニュース、
🇺🇸 ウォール街の敗北…欧州に勝機あり? 🇪🇺 米国のAI関連株への圧力が高まる中、市場の注目は欧州株式市場に集まっています! Capital Economicsは、もしAIバブルの収縮が続いた場合、欧州市場はセクターの多様性とテクノロジー大手への依存度の低さから、相対的に優位に立つと予測しています。 果たして欧州は次のチャンスとなるのでしょうか? #MidtermsMarketWatch $NVDAXUSDT $XRPUSDT




$NIGHT: Breakout at the $0.0435 Line
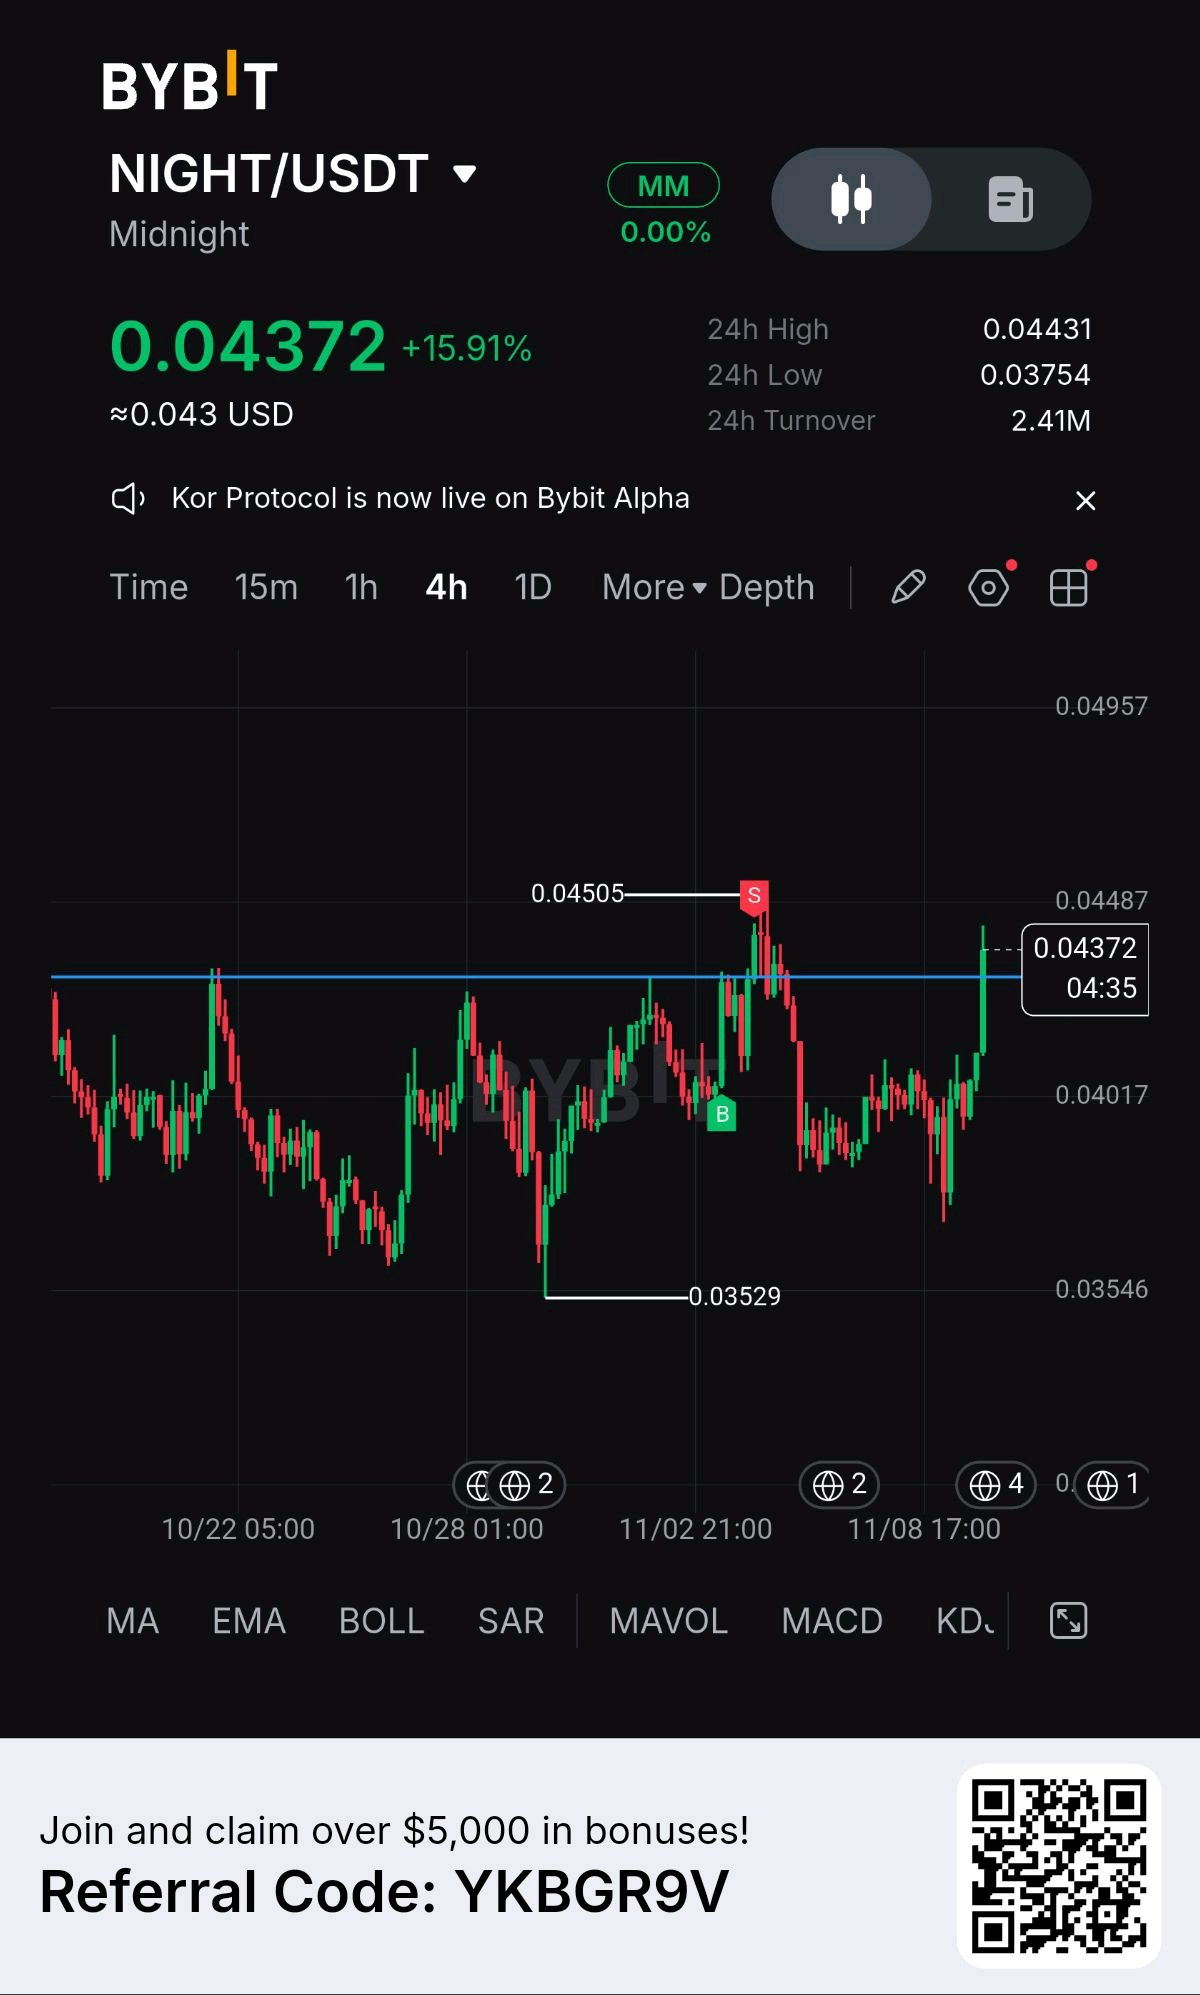
$NIGHT is up almost 16% and pressing against the same resistance that has capped it for two weeks. I'm holding a moonbag, so this level matters to me. What the 4H chart shows: Price is $0.04372 after bouncing from a 24h low of $0.03754. The bounce came with a strong green candle that pushed right into the $0.0435 area, which is the horizontal line that stopped the last two rallies. The high from Nov 4 to 5 was $0.04505, and the swing low is $0.03529 from late October. Price is still inside a two-week range, so this is a test of resistance, not a confirmed breakout. 24h turnover is $2.41M. What's happening: The news flow is strong. Charles Hoskinson said on Nov 8 that Midnight could surpass Cardano's market cap, and that kind of headline fuels speculation. On the fundamentals side, Midnight completed its Ledger 9 mainnet upgrade on Nov 6, adding tools for private cross-chain deposits. The Sig Network launched on Oct 29 to bring Ethereum assets in, and the mainnet has passed one million transactions. Monument Bank's plan to tokenize up to £250M in deposits on Midnight was delayed to November, so it is a potential catalyst this month. About 16.6B of the 24B NIGHT supply is circulating, so the market cap is over $700M. NIGHT is still more than 60% below its $0.1179 record. China and the global backdrop: China's Q3 GDP grew 4.5%, beating forecasts, and the yuan hit a 4-year high. For China, that means steadier policy and less need for emergency stimulus. For the world, stronger Asian growth supports risk appetite, and Asian exchange access matters for NIGHT, which listed on Japan's OKCoinJapan on Oct 13 and on S.BLOX, run by a Sony Group company, in August. The link is indirect, since China restricts crypto trading, and the beat is export-led with retail sales up only 1.1%. NIGHT trades closely with Cardano, so ADA and the Fed matter more than China data. Key levels: Support: $0.04017 first, then $0.03754 (the 24h low), then $0.03529 (the late-October low). Resistance: $0.0435 to $0.0440 first, then $0.04505, then a long gap toward the $0.0600 area before the $0.1179 record. I want a 4H close above $0.04505 on rising volume before I call this a real breakout. Scenarios: Bull: the Monument Bank launch or other Midnight news lands, buyers hold above $0.0435, and NIGHT breaks $0.04505. Base: NIGHT keeps ranging between $0.0375 and $0.0450 as the market waits for catalysts. Bear: the breakout fails at $0.0435, $0.04017 breaks, and NIGHT retests the $0.0375 to $0.0353 zone. Honest risk: the final thaw of the Glacier Drop and Scavenger Mine allocations ends around Nov 29 to Dec 4 (sources differ), which could add selling pressure from holders who have waited a year. Holder concentration on BNB Chain is also very high, and a 16% pump on a headline can reverse fast. Not financial advice. Will you hold the moonbag through the unlock? $NIGHTUSDT $SUIUSDT #WSOT2026 #WSOTPicktoEarn10U #NovUSCPIWatch #MidtermsMarketWatch

🚨 Today's Hot Topic | Korean Stocks Rebound: A Paradigm Shift or a Fleeting Bounce? The financial markets are buzzing as the KOSPI surged over 5% intraday, spearheaded powerhouse market leaders like Samsung Electronics and SK Hynix! Such a dramatic, high-volume upward movement has naturally ignited a fierce debate across global trading desks: Is this explosive move merely a short-term relief bounce, or is it the definitive kickoff of a major new structural rally? 📊 Deconstructing the Rally: Key Drivers Tech & Semiconductor Momentum: Samsung Electronics and SK Hynix are at the epicenter of global memory and AI-driven hardware demand. When these giants move violently to the upside, it acts as a massive liquidity wave lifting the entire index. Macro Sentiment & Institutional Flows: The sharp intraday reversal signals aggressive institutional accumulation. Are foreign capital flows returning to Asian equities, or are short-sellers aggressively unwinding positions? The Crypto & Tokenized Asset Correlation: In today's interconnected macro ecosystem, explosive liquidity in traditional equities often spills over into risk-on crypto assets, bridging traditional finance (TradFi) and decentralized finance (DeFi) sentiment. 🔍 Market Outlook: Short-Term Trap vs. Structural Bull Run The Bearish Case (Short-Term Bounce): Macro headwinds, fluctuating currency dynamics, and global liquidity tightening suggest this could be a classic "dead cat bounce" or liquidity sweep before another consolidation phase. Prudent traders are watching key resistance levels closely. The Bullish Case (New Rally Start): If this 5%+ surge breaks multi-week resistance structures with sustained volume, we could be witnessing the bottoming process and the early accumulation phase of a prolonged multi-month trend. 💬 Where Do You See the Best Opportunities ? How are you positioning your portfolio amidst this volatility? Are you scaling into tech majors, hedging your downside, or rotating capital into high-beta altcoins tracking the broader risk-on sentiment? Drop your trading strategies, analysis, and price targets in the comments below! 👇 #WSOT2026 #MidtermsMarketWatch $BTCUSDT $ETHUSDT

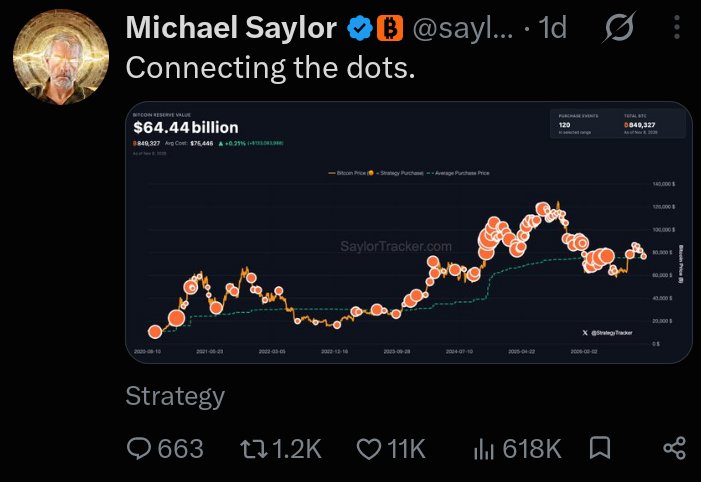
Michael Saylor dropped another Bitcoin tease!
"Connecting the dots" The Strategy chairman's latest X post has sparked speculation about another potential $BTCUSDT purchase. But there's a bigger story behind it. 🧵👇 🟠 Strategy reportedly holds 849,327 BTC, worth approximately $62.98 billion. 📉 Bitcoin falling below Strategy's average purchase price of $75,451 has pushed its holdings into roughly $1 billion in unrealized losses. Just a month ago, Strategy was reportedly sitting on nearly $10 billion in unrealized profits. A dramatic market reversal! 🐻 Bitcoin's Q4 2026 weakness is drawing comparisons with previous bearish cycles in 2014, 2018 and 2022. 📊 Analysts are also warning about weakening momentum, with BTC approaching its fifth consecutive weekly red candle. 💰 Despite the pressure, Strategy reportedly maintains $4.9 billion in USD reserves and recently acquired $208 million worth of STRC. 👀 Now everyone's watching Michael Saylor. Does "Connecting the dots" hint at another Bitcoin purchase? Or is it simply another message about his long term BTC conviction? One thing is clear that Strategy's Bitcoin strategy is facing another major market test. #IMPACTbyTrade #MidtermsMarketWatch

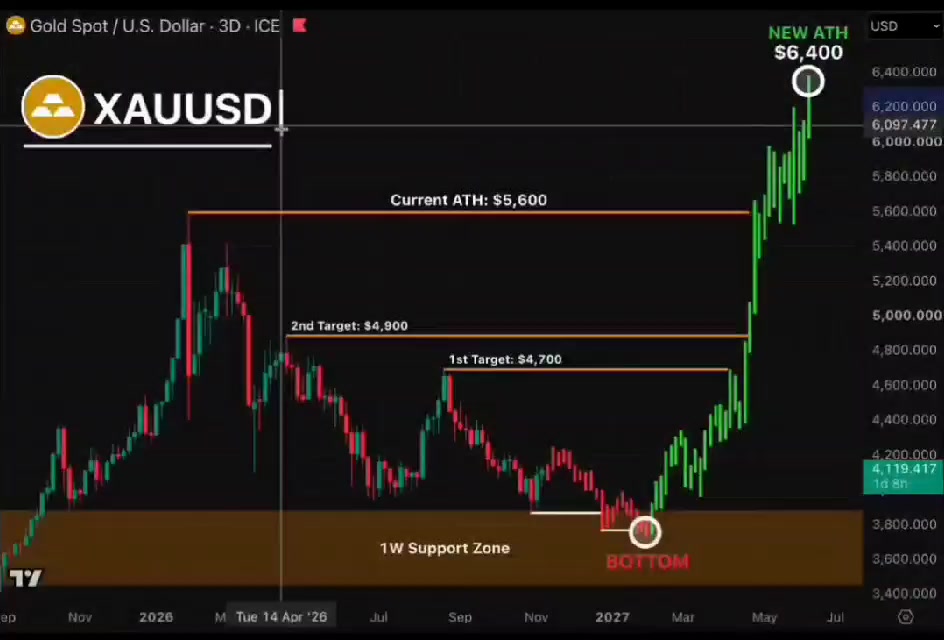
🚨 GOLD IS PREPARING ITS FINAL SHAKEOUT Gold is down ~30% from its $5,600 ATH. Everyone expects an even BIGGER crash I see the opposite: the last flush before the next leg up My roadmap: → $3,800-3,900: final wash into 1W support → CAPITULATION: weak hands get wiped out → $4,700 → $4,900: first targets → $5,600 → $6,400: breakout to NEW ATH That's a ~50% rise from the bottom to the old ATH Fear is building, weak hands are selling. This is exactly how major cycle bottoms form I'm not chasing here. I'm waiting for the capitulation $XAUTUSDT #MidtermsMarketWatch

確認を待って!🚀
$MNTUSDT #WSOT2026 #WSOTPicktoEarn10U #BybitAI進化中 #MidtermsMarketWatch #Oracle20BFundingPlanTestsTheAITrade


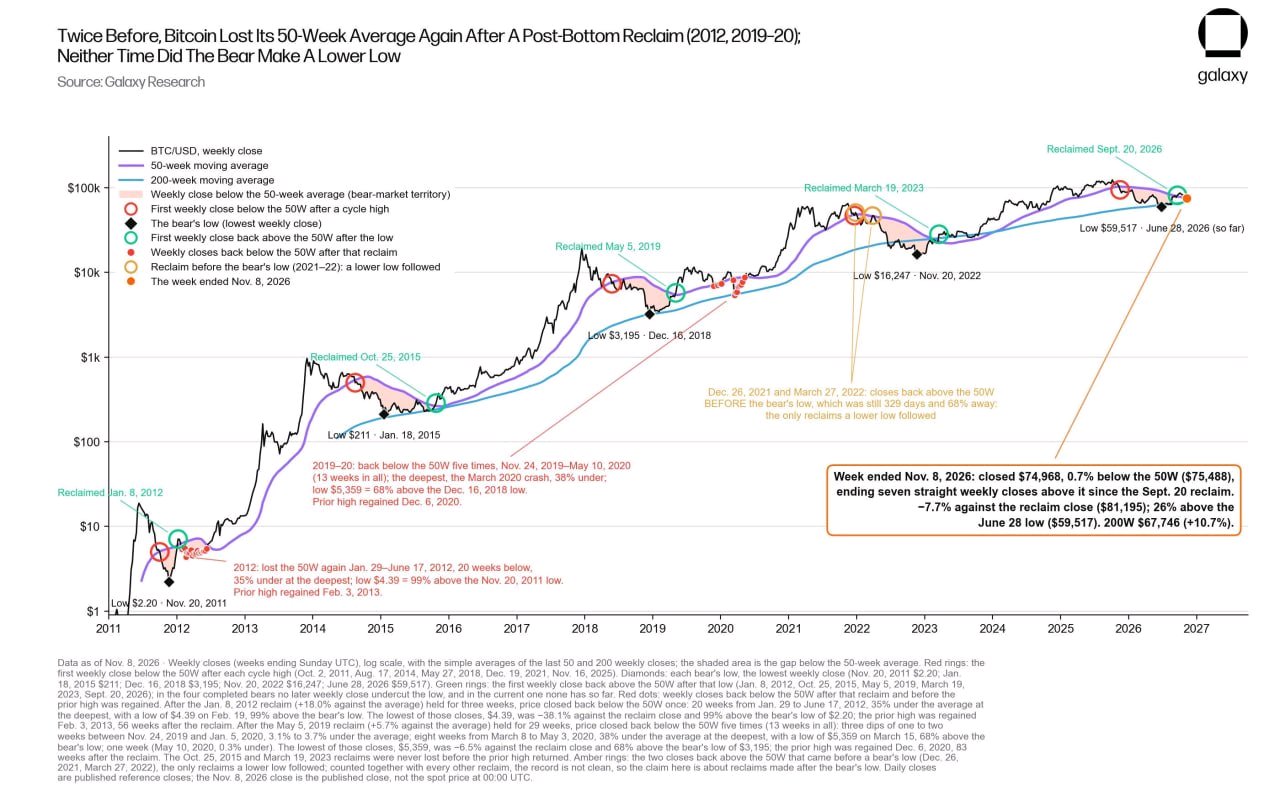
注目すべきビットコインの歴史的パターン
ビットコインが再び50週移動平均線を下回りましたが、歴史的な背景には注目する価値があります。 Galaxyのアレックス・ソーン氏によると、過去に弱気相場の底打ち後に$BTCUSDTがこの水準を割り込んだ2回のケースでは、それ以降に安値を更新することはありませんでした。 弱気に見えるチャートが、必ずしも弱気な結果につながるとは限りません。 #11月米国CPIウォッチ #米国雇用統計と金利決定が主導するマクロ週 #BybitAI進化中 #BOE金利決定 #MidtermsMarketWatch

$INIT MIGHT BE COOLING OFF
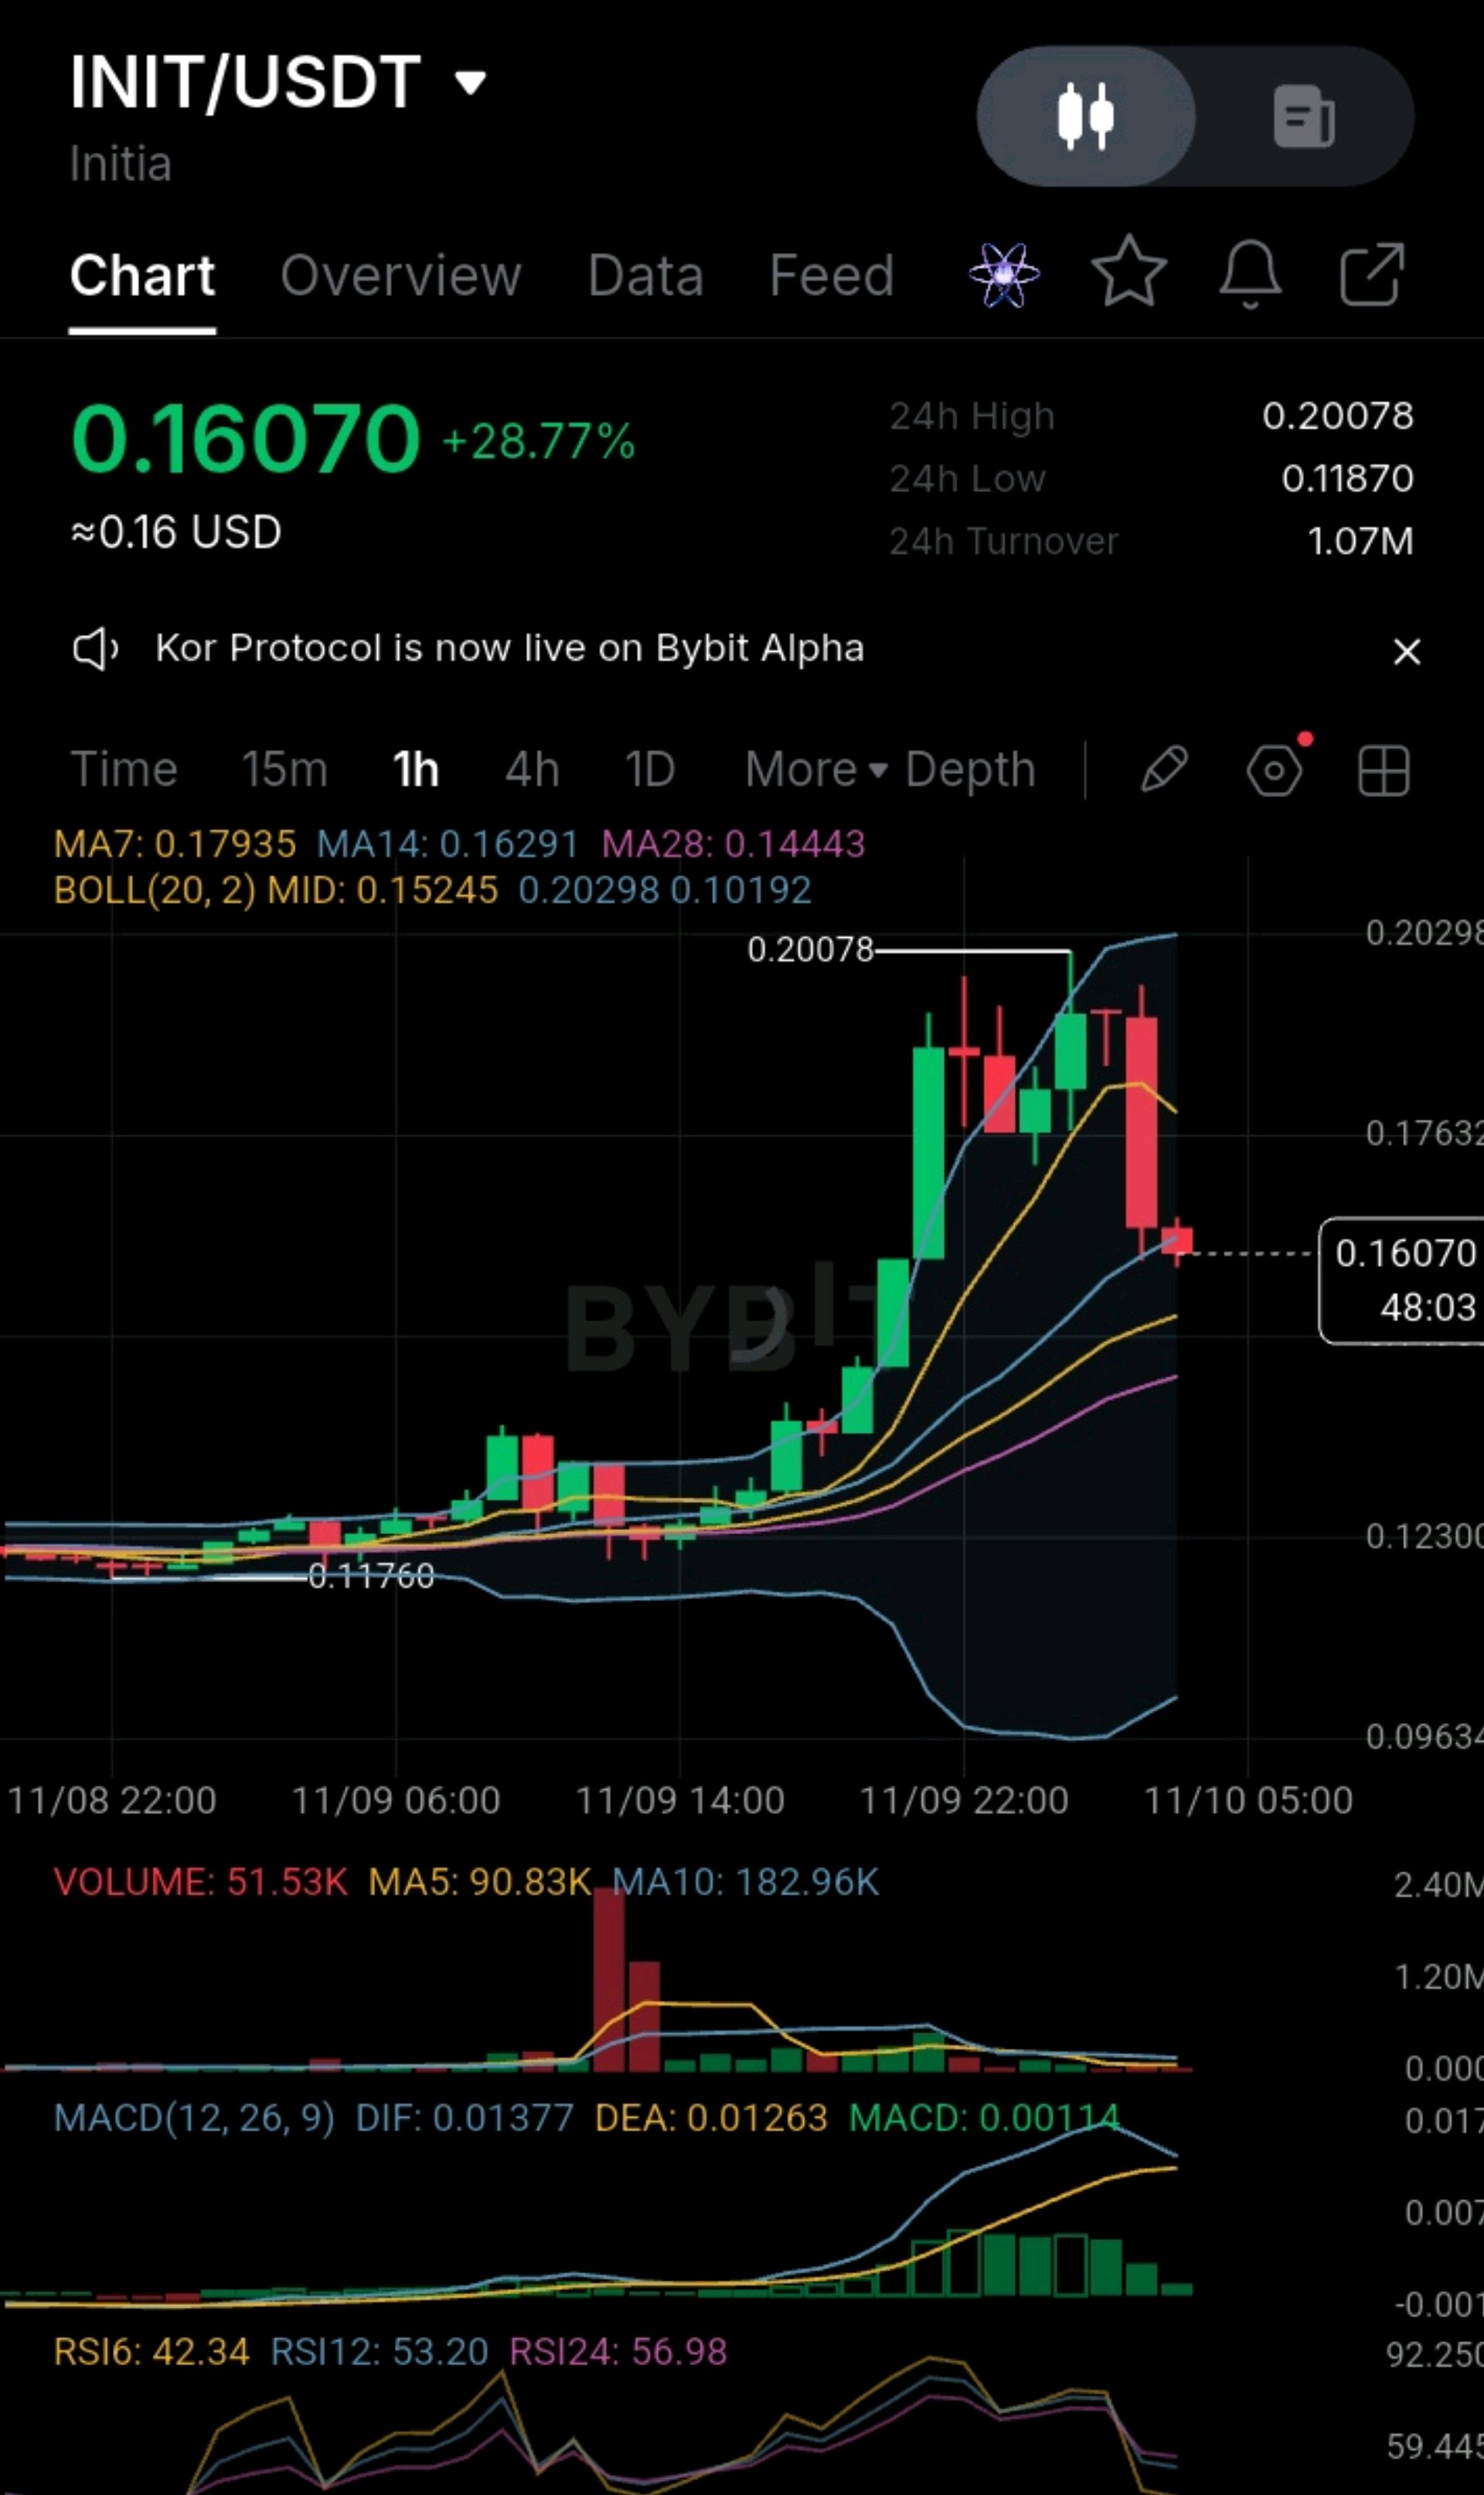
#ByXIMPACT #WSOTPicktoEarn10U #NovUSCPIWatch #MidtermsMarketWatch #BybitAIEvolving ⚡$INIT MIGHT BE COOLING OFF AFTER A BIG RUN. INITUSDT: A PULLBACK IS NOT A BREAKDOWN. HERE'S WHAT I'M WATCHING. 📊 $INIT has pulled back from 0.20078 to around 0.1607, losing its MA7 after a vertical breakout. But is this the start of a deeper reversal, or simply a healthy retest within a broader uptrend? That distinction is why I'm watching the next support levels as closely as the recent rejection. I'm not relying on red candles alone. I'm looking at market structure, moving-average alignment, momentum, volume, and the levels that would weaken or strengthen the bullish case. 1. MARKET STRUCTURE: PULLBACK AFTER A VERTICAL RUN Following the base near 0.1176, price ripped to a high of 0.20078 and was rejected with long upper wicks. The latest big red candle shows sellers have regained some short-term control, but the broader breakout structure still needs a break of support to be considered invalidated. 2. MOVING AVERAGES: A SHORT-TERM DETERIORATION At the time of the screenshot: MA7: 0.17935 MA14: 0.16291 MA28: 0.14443 Price has lost the MA7 and is testing the MA14, which is the near-term line to defend. However, it remains above the MA28 and the BB midline (0.15245), so the broader breakout structure has not been invalidated. 0.17935 is now the key resistance reference. 3. MOMENTUM AND VOLUME MACD is still positive (DIF 0.01377 vs DEA 0.01263), but the histogram is shrinking and DIF is curling over, so a bearish cross is close. RSI6 is around 42.34, while RSI12 is 53.20 and RSI24 is 56.98. This suggests short-term momentum has turned down faster than the broader readings. Displayed volume is approximately 51.53K, below the MA5 (90.83K) and MA10 (182.96K). The big volume came on the earlier candles, so the move is losing fuel. The current candle is still open, so judge it at the close. 4. KEY LEVELS AND INVALIDATION 🔹 0.20078: 24-hour high and major resistance. 🔹 0.17935: MA7; reclaiming it could strengthen the recovery case. 🔹 0.16291: MA14; the level being tested right now. 🔹 0.15245: Hourly middle Bollinger Band and the dip-entry area. 🔹 0.14443: MA28; a break below it would weaken the breakout structure. A sustained reclaim of the MA7 with stronger volume would support the bullish thesis. Rejection followed by a loss of the MA14 would call for reassessment. 5. THE REASON BEHIND THE TRADE Illustrative plan: a bounce entry around 0.1525-0.1560 (BB mid area), a stop-loss at 0.1440 below the MA28, and take-profit levels at 0.1629 and 0.1794. These are planned levels, not guaranteed outcomes. Risk only 1-2% of the account on the stop distance. Leverage magnifies both gains and losses. Unrealized P&L is not realized profit, and a large unrealized return does not eliminate reversal risk. Catching a falling knife between the MA14 and MA28 is poor risk/reward, so patience matters here. MY VIEW: INIT is showing a short-term pullback after a +28% day, but holding the MA14 and reclaiming the MA7 on volume would provide better evidence that the breakout is intact. Until then, confirmation matters more than prediction. 🤝 Community question: Do you think INIT will hold the MA14 at 0.1629 and retest 0.1794, or will fading volume send it down to the 0.1525 midline and 0.1444? $INITUSDT $INITUSDT This is technical analysis for discussion, not financial advice.

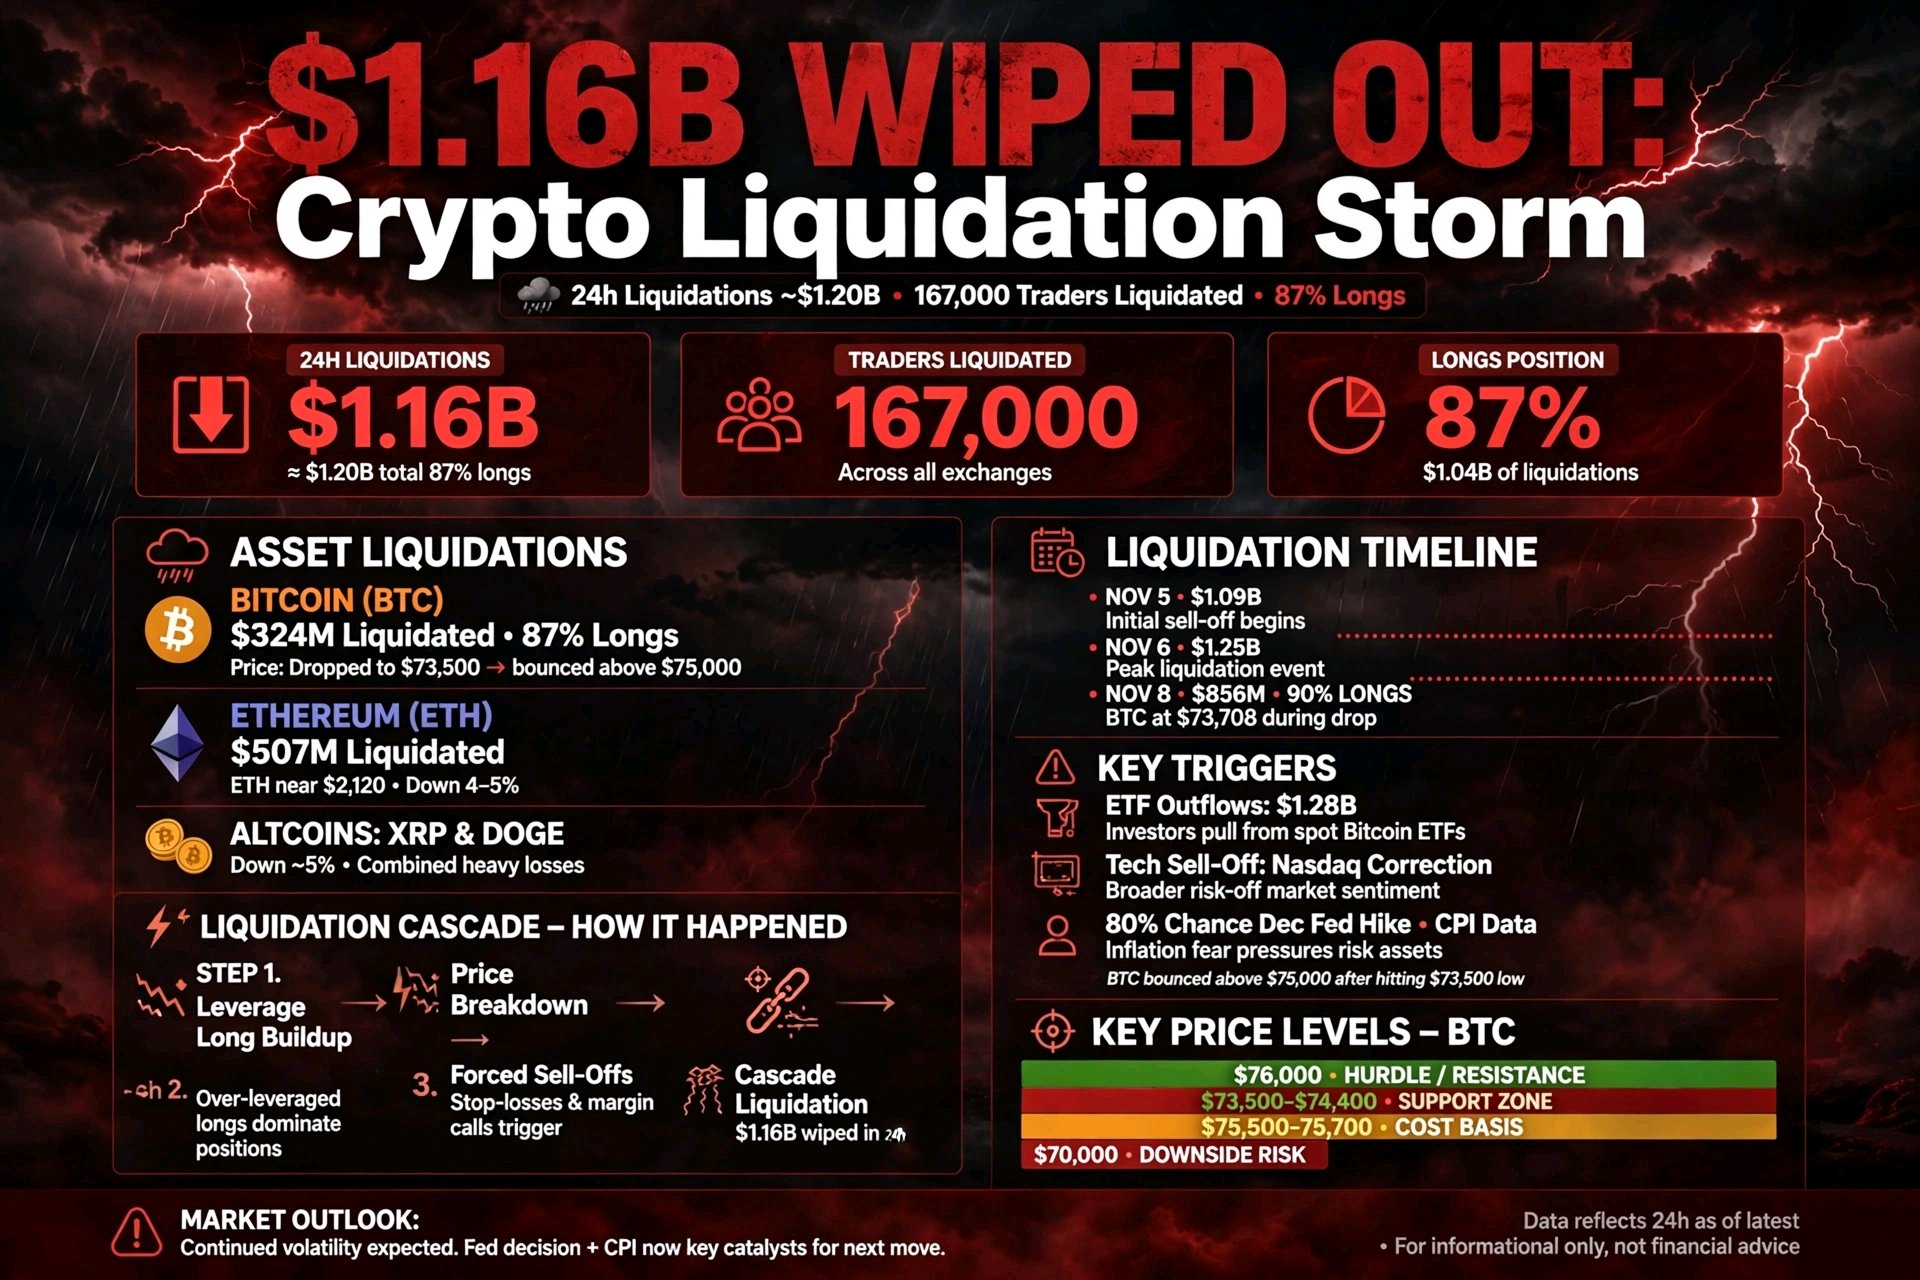
🚨 $1.16 BILLION VANISHED INTO THIN AIR. 😱
The crypto market is facing an absolute systemic meltdown, and if you think it’s just because of the tech market, you are missing the real story. While the global tech bloodbath—triggered by shocking personal headlines around Nvidia CEO Jensen Huang—started the panic, smart money is fleeing due to a toxic mix of macro disasters. Here is what the mainstream media isn't putting together yet: - The Tech Spillover: Nvidia's crash is actively draining massive liquidity out of speculative assets. - The $6.34B Binance Shock: The psychological trauma of the historic Binance exploit is keeping whale capital locked away. - The Midterm Freeze: Institutional giants are aggressively de-risking and moving to cash ahead of the high-stakes US Midterm Elections. The 24-Hour Damage Report: Leverage traders got completely wiped out clean, resulting in a staggering $1.16 Billion in total liquidations. - Bitcoin ( $BTCUSDT ): Cracked under immense pressure, now desperately fighting to hold the $74,860 zone. - Ethereum ( $ETHUSDT ): Taking a brutal beating, collapsing 5.9% straight down to $2,124. This is no longer a simple correction. This is a battle for the next macro trend. Are you buying this historic bloodbath, or are you sitting on the sidelines? Drop your survival strategy below. 👇 #MidtermsMarketWatch #BybitAIEvolving

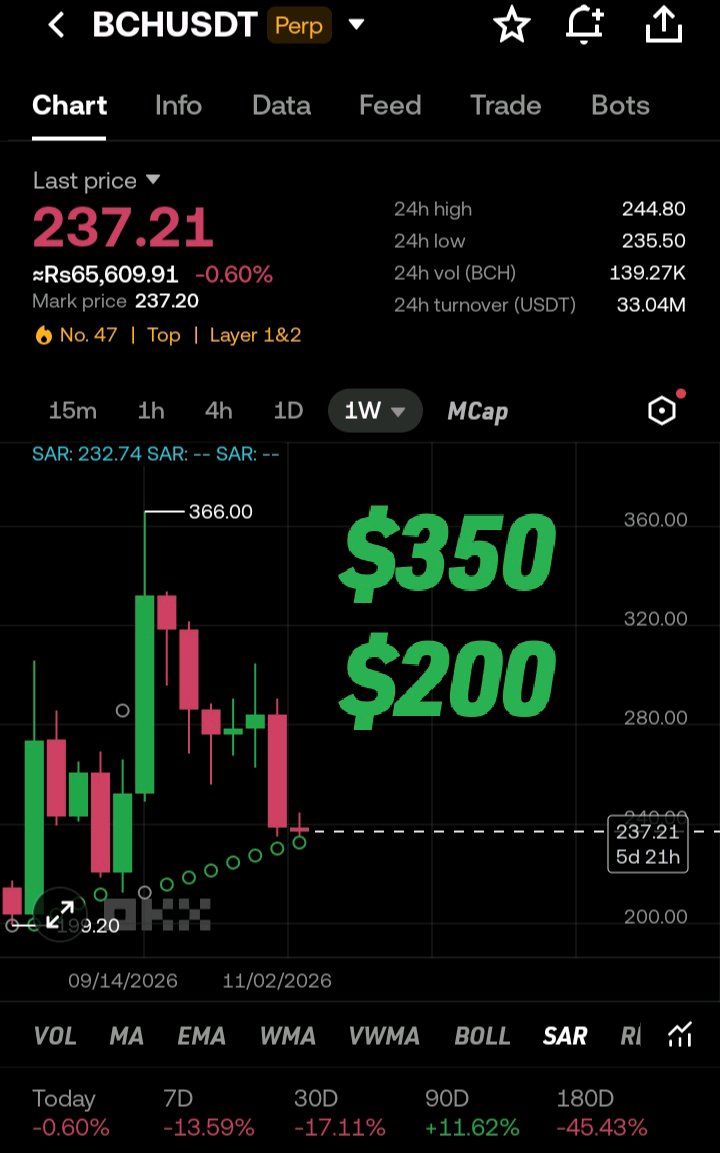
BCHUSDT – Buy Now or Wait for $200? 🤔
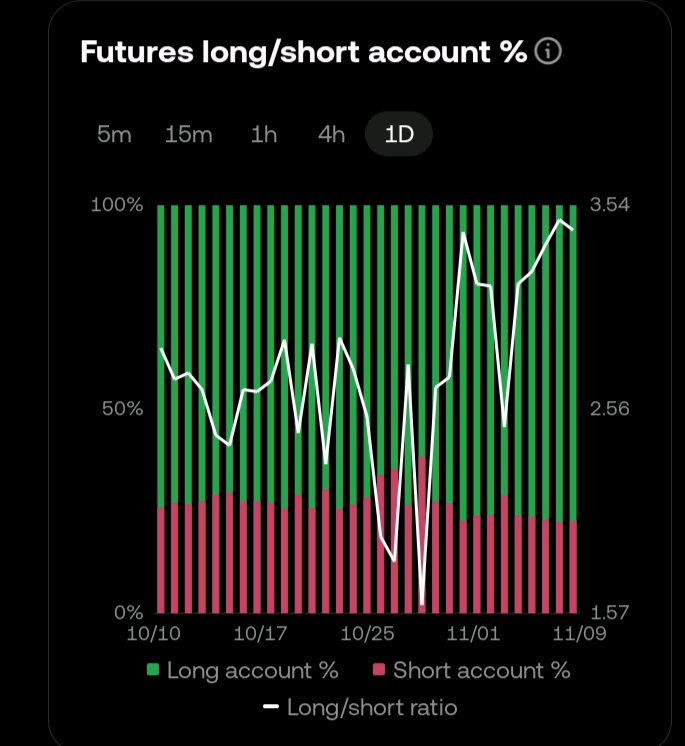
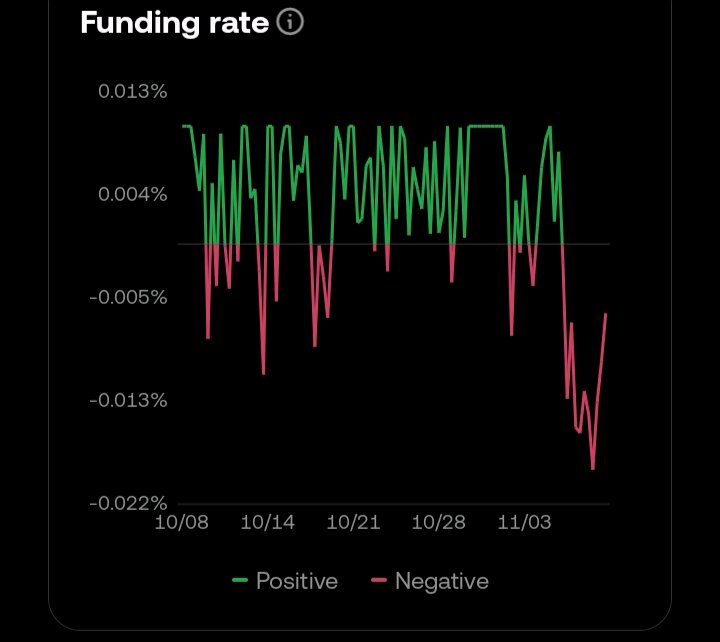
$BCHUSDT Current: 237.21 📉 | Target: $350 🎯 Chart & Data: · Weekly SAR is right at 232.74 (Key support). · Funding Rate: Deep negative. Shorts are paying longs (Short squeeze potential). · Long Ratio: Very high at 3.54. Retail is heavily long. My View: If SAR holds, a bounce to $350 is possible. However, the high Long ratio means the market might drop to liquidate them first. Plan: Consider DCA (partial buying) to balance the risk. Buy now or wait for $200? 👇 #WSOTPicktoEarn10U #USPayrollsAndRateDecisionsDriveMacroWeek #Oracle20BFundingPlanTestsTheAITrade #MidtermsMarketWatch #AnthropicIPOTestsTheAIBoom $BTCUSDT
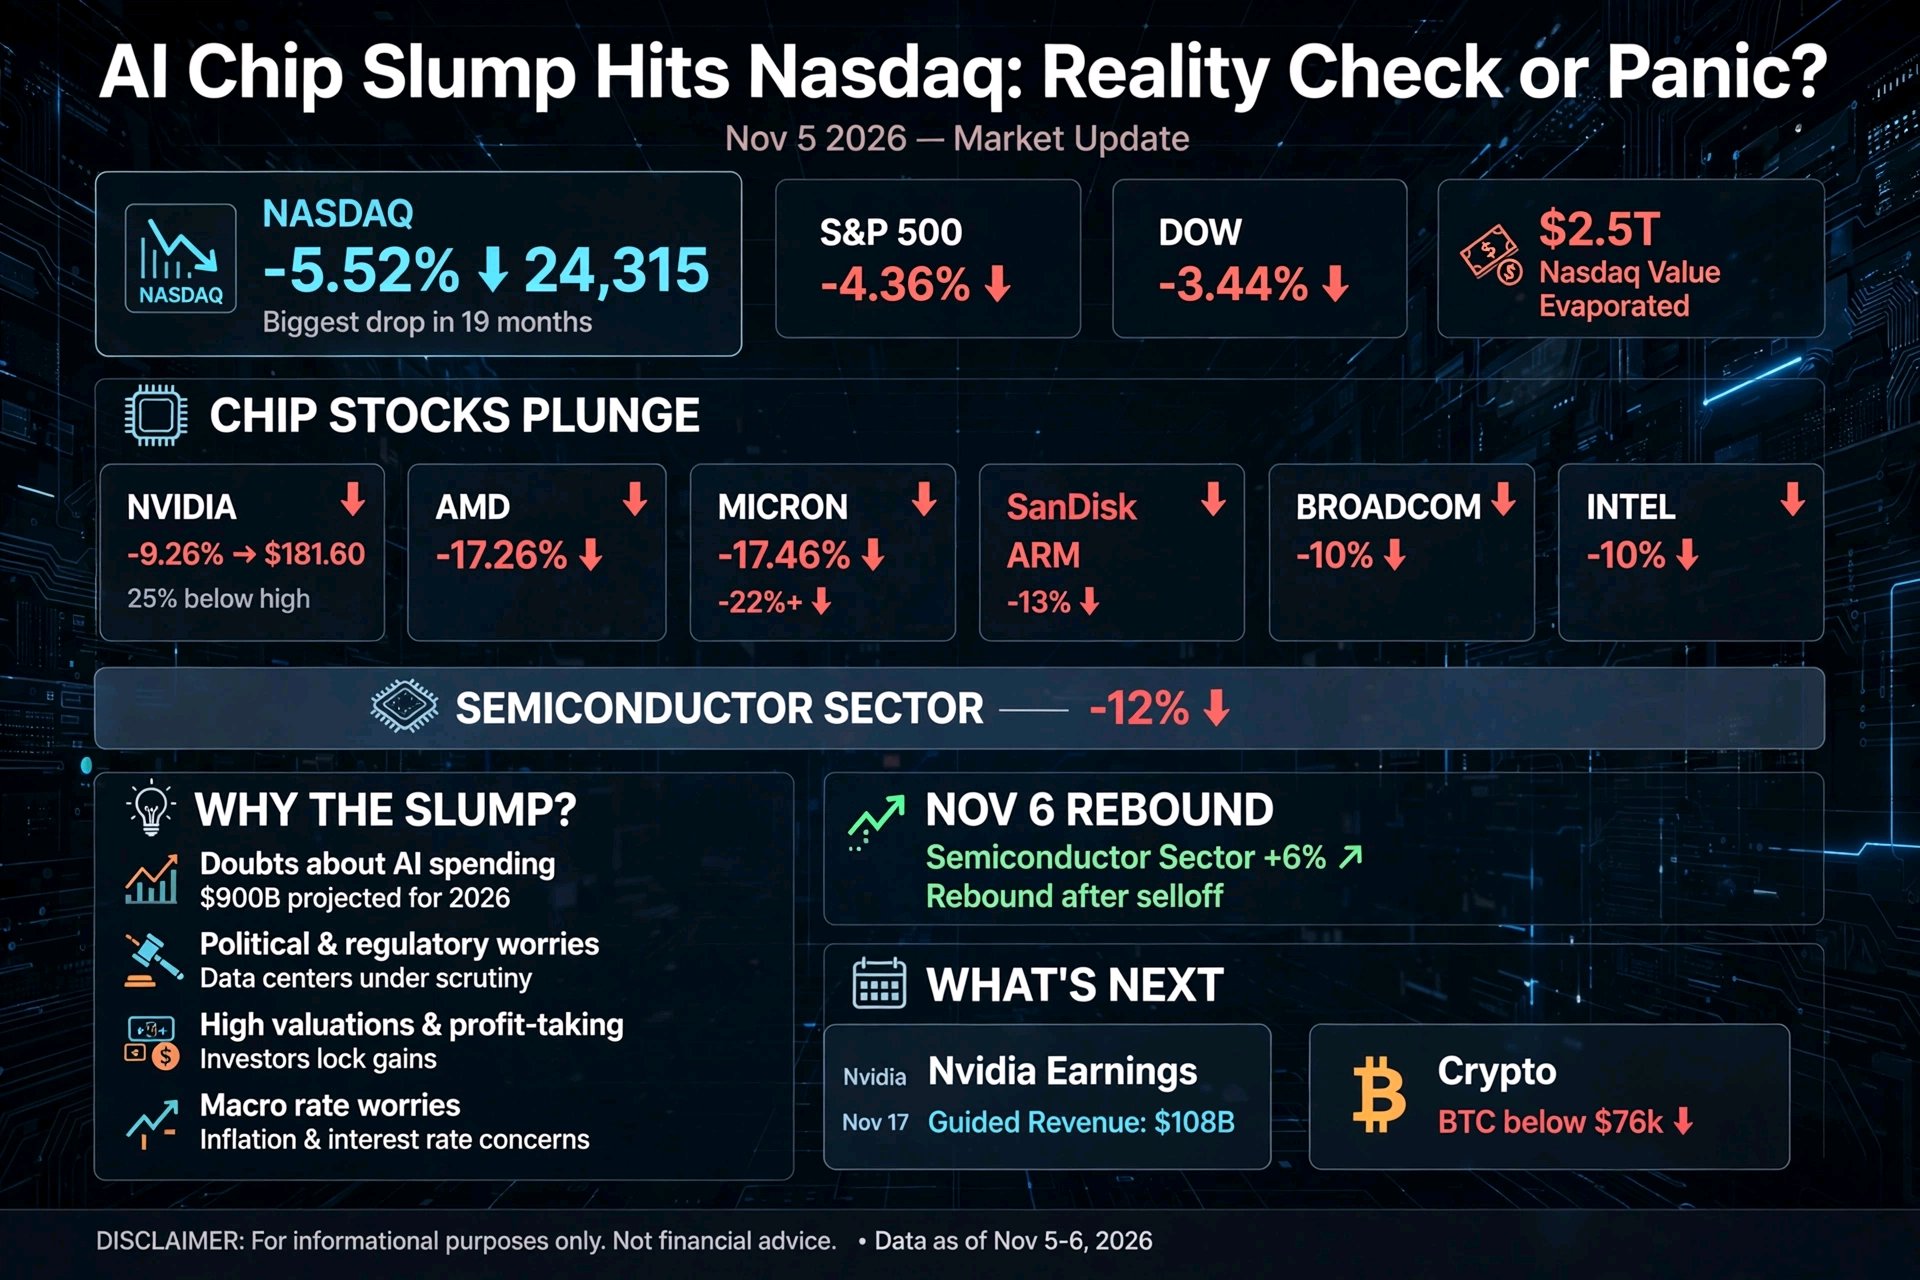
AIチップの不振、ナスダックに波及
: 現実を直視するか、パニックになるか? 🚨 ウォール街がひるんだ日 2026年11月5日(木)、ナスダック総合指数は5.52%下落し24,315となり、過去19ヶ月で最大の下げ幅を記録しました。😱 S&P 500は4.36%下落し、ダウ平均は3.44%下落しました。この売り越しにより、ナスダックはピークから10%以上下落する調整局面入りとなりました。📉 ロイターの推計によると、ナスダックの時価総額のうち約2.5兆ドルがわずか1セッションで消失したとのことです。💸 🔥 下落を主導した半導体銘柄 最もダメージが大きかったのは、AIおよび半導体関連銘柄でした:👇 🟢➡️🔴 Nvidia: −9.26%(181.60ドル)、52週高値から約25%下落 🔻 AMD: −17.26% 🔻 Micron: −17.46% 🔻 SanDisk: −22%超 🔻 Arm: −13%、Broadcom: −10%、Intel: −10% 半導体セクターは1日で約12%下落し、近年にない最悪の売り越しの一つとなりました。😳 🧠 なぜ起きたのか? 💰 1. AI支出への疑念 投資家たちは、AIブームのペース、コスト、資金調達について疑問を抱きました。🏗️ ある分析によると、JPモルガンは2026年の世界的なAI支出額を約9000億ドルと予測していますが、投資家はその投資がいつ回収されるのかを知りたがっています。🤔 🏛️ 2. 政治的・規制的な懸念 一部の報道では、この下落を中間選挙後の米国のデータセンター政策への懸念と結びつけています。🗳️ あるメディアは、市場がAIインフラの用地、エネルギー、許認可に関する政治的リスクを織り込み始めており、単なるバリュエーションの問題ではないと論じています。⚡ 📊 3. 高すぎるバリュエーションと利益確定売り 株価は何ヶ月も上昇していたため、小さな悪材料でも大量の売りを誘発する可能性がありました。🎢 アナリストは、投資家が現在の価格を支払う前に、長期的な利益の明確な証拠を求めていると指摘しています。🧾 🏦 4. マクロ経済の圧力 金利への懸念が背景にあり、市場はFRBの動向と本日のCPI(消費者物価指数)発表を注視しています。📅 これにより、割高なグロース株は悪材料に敏感になっています。⚠️ 🔄 部分的な反発 翌日の11月6日、半導体株は反発しました。📈 半導体指数全体では6%以上上昇し、AMD、Intel、Micronはそれぞれ約7%から13%上昇しました。ロイターによると、ジェフリーズのストラテジストは今回の売り越しをファンダメンタルズのリセットではなく、一時的な過剰反応であると評しています。🧐 しかしアナリストたちは、ボラティリティは続く可能性があり、この反発が即座に結論を意味するわけではないと警告しています。🎯 ⚠️ 現実を直視する あるレポートでは、これらの一連の動きは株価の再評価を反映したものであり、企業の銀行口座から現金が流出したわけでも、半導体の出荷やデータセンターの受注が崩壊したわけでもないと強調しています。📌 つまり、これはバリュエーションのリセットであって、AI需要が消滅した証拠ではないようです。とはいえ、支出が横ばいになれば、2022年の半導体不況との比較論が再燃するかもしれません。😬 🗓️ 次の大きな試練:Nvidiaの決算 Nvidiaの決算発表は11月17日(火)です。📣 同社は今四半期の収益を約1080億ドルとガイダンスしています。市場は好決算と強気な見通しを求めています。予想を上回れば投資家の心理は落ち着くでしょうが、下回れば下落傾向が深まる可能性があります。🎯 ₿ 暗号資産への影響 ($BTC $SOL $ARB) 暗号資産は最近、ハイテク株と連動して動いています。🔗 ビットコインはこの売り越し中に76,000ドルを割り込み、安全資産としての役割を果たせませんでした。😬 一般的に、SOLやARBのようなアルトコインはBTCよりも激しく上下する傾向があるため、ナスダックの軟調さはこれらにさらなる打撃を与える可能性があります。⚖️ ハイテク株が安定すれば暗号資産も落ち着きを取り戻すでしょうが、AI関連の売り越しが再燃すれば、さらなるボラティリティを覚悟すべきです。🎢 🧭 トレーダーができること 📌 パニックやFOMO(取り残される恐怖)を避ける。激しい値動きは買い手と売り手の両方を罠にはめます。🪤 📌 重要な日程に注目する。本日のCPIや11月17日のNvidiaの決算発表は市場を動かします。📅 📌 エントリーを分散させる。1日の値動きだけで全資金を投入しないこと。🪜 📌 レバレッジに注意する。急激な下落は過度なレバレッジポジションを強制決済させます。🛡️ 📌 ファクト(事実)に従う。ヘッドラインニュースよりも、決算や支出データの方が重要です。🔍 🎯 最後の考察 AIブームは、期待(ハイプ)から実証(プルーフ)のフェーズへと移行しています。💡 期待値が高いとき、大勝ちしていた銘柄は急落しやすく、反発もまた鋭いものになりがちです。これが健全なリセットなのか、それともより大きな何かの始まりなのか、次の数週間がそれを物語るでしょう。🌍 #Oracle20BFundingPlanTestsTheAITrade #MidtermsMarketWatch #BOE金利決定 #AnthropicIPOValuationTest #原油価格の変動がイランの和平交渉に連動 $BTCUSDT @jalekhakhatun
11.6億が消失:
暗号資産市場に清算の嵐、レバレッジトレーダーを直撃 ⚡🩸 🚨 残酷な24時間 暗号資産市場は、レバレッジがいかに痛みを伴うかを思い知らせるような事態となりました。😬 24時間以内に10億ドル以上のレバレッジポジションが吹き飛びました。Coinglassのデータによると約12億ドルの清算が発生し、そのうち10億4000万ドルが価格上昇に賭けるロングポジションによるものでした。📉 およそ16万7000人のトレーダーが清算されました。😱 ⚙️ 清算(リキデーション)とは? 初心者向けの簡単な復習です。👇 レバレッジ取引では、借入を行って通常より大きなポジションを保有します。予想に反して価格が動き、証拠金で損失をカバーできなくなると、取引所が自動的に取引を決済します。この強制決済(投げ売り)がさらなる価格下落を招き、さらなる清算を引き起こします。この連鎖反応は「清算の連鎖(リキデーション・カスケード)」と呼ばれます。🌊 📊 最も打撃を受けたのは? ₿ ビットコイン:約3億2400万ドルが清算、その約87%がロング。BTCは一時約73,500ドルまで下落しましたが、その後75,000ドル台まで反発しました。 Ξ イーサリアム:5億700万ドル以上が清算され、ビットコインを上回りました。ETHは2,120ドル付近で取引されており、1日で約4〜5%下落しました。 🔻 その他の主要通貨:XRP、ドージコインなども約5%下落。 痛みは一方的でした。🎯 ロング勢が壊滅した一方で、ショート勢はほとんど影響を受けませんでした。これは、トレーダーたちが来るはずのなかった反発を期待して、ロングに大きく傾いていたことを示しています。🪤 📅 これが最初の波ではない 今週は厳しい週でした。😮💨 📆 11月5日:約10億9000万ドルが清算。ビットコインが80,000ドル超から約75,700ドルまで約6%下落しました。 📆 11月6日:約12億5000万ドルが清算。 📆 11月8日:約8億5600万ドルが清算(約90%がロング)。ビットコインは8月以来の安値となる73,708ドルを付けました。 📆 現在:さらに10億ドル以上の波。 繰り返し発生する一掃劇は、過剰なレバレッジをかけたロングポジションが常に狩られ続けていることを示しています。🧹 🧠 売りを誘発した要因は? 🏦 1. 大規模なETF資金流出 米現物ビットコインETFから先週12億8000万ドルが流出し、6月下旬以来の最悪の週となりました。📤 これにより、安定した買いの主要源が失われました。 📉 2. ハイテク株の売り AI関連株や半導体株の急落がナスダックを調整局面へと押し込み、暗号資産も高リスクのハイテク資産のように取引されています。🤖⛈️ 🗳️ 3. マクロ経済・政治的圧力 トレーダーは利上げ懸念も織り込み始めています。市場は12月のFRB利上げ確率を約80%と見ており、今日のCPI(消費者物価指数)発表で市場が再び揺れる可能性があります。📊⚠️ 🔓 4. 取引所のセキュリティ懸念 ある報道では、Binanceのハッキングがセンチメントへの圧力の一つとして言及されていました。詳細は確認できていないため、Binanceやその他の信頼できる情報源が事実を認めるまでは慎重に扱うようにしてください。🔍 🔍 トレーダーが注目する重要な価格帯 📍 73,500ドル~74,400ドル:直近の安値と週足のサポートライン。 📍 約75,500ドル~75,700ドル:短期保有者の取得単価およびMicroStrategyの平均買付価格。ビットコインは現在このすぐ下で取引されており、直近の買い手の多くが含み損を抱えています。😬 📍 約76,000ドル:最初の上値抵抗線。 📍 約70,000ドル:サポートが機能しなかった場合の下値ターゲットとして一部のアナリストが指摘している水準。🔻 ⚖️ これは強気か、弱気か? 両方の見方があります。🤔 🐂 強気派:大規模な清算は過剰なレバレッジを一掃し、底固めを助ける可能性がある。 🐻 弱気派:ETFからの流出、弱い株式市場、利上げリスクが引き続き価格への圧力となる可能性がある。 清算イベントは「すでに起きてしまった被害」を示すものであり、次に何が起こるかを教えてくれるものではないことを覚えておきましょう。🎯 🛡️ トレーダーへの教訓 📌 レバレッジを尊重すること。高レバレッジは、通常の変動を口座破綻へと変えてしまいます。💀 📌 ストップロスを設定し、ポジションサイズを小さくすること。失っても良い以上のリスクは決して取らないように。🧯 📌 追いかけ買いを避けること。すべての押し目買いや、反発ごとのショートを盲目的に行わないこと。🪤 #Oracle20BFundingPlanTestsTheAITrade #MidtermsMarketWatch #BOE金利決定 #AnthropicIPOValuationTest #原油価格の変動がイランの和平交渉に連動 $BTCUSDT @jalekhakhatun