🚀 Win 10 USDT: Show Your WSOT Trade × Bybit AI
From Nov. 13–27, show us how you’re using AI to gain an edge in WSOT: 1️⃣ Post your WSOT Al Arena P&L screenshot and explain your setup, entry, risk management and key takeaway; or 2️⃣ Share how Bybit AI helped you assess a market opportunity, shape your trading strategy, and execute the trade. 🎁 10 winners will each receive 10 USDT! We’re looking for authentic trades with clear reasoning and useful insights. Post with #WSOTShowYourAITradeToEarn10USDTand let the community learn from your trading setup! Notes: Bybit AI provides informational support and does not constitute financial advice.



Wetin we go talk again sef 🤦♂️ Abeg drop location if u sabi the church make I go worship God 😌


This one no be meme ooo


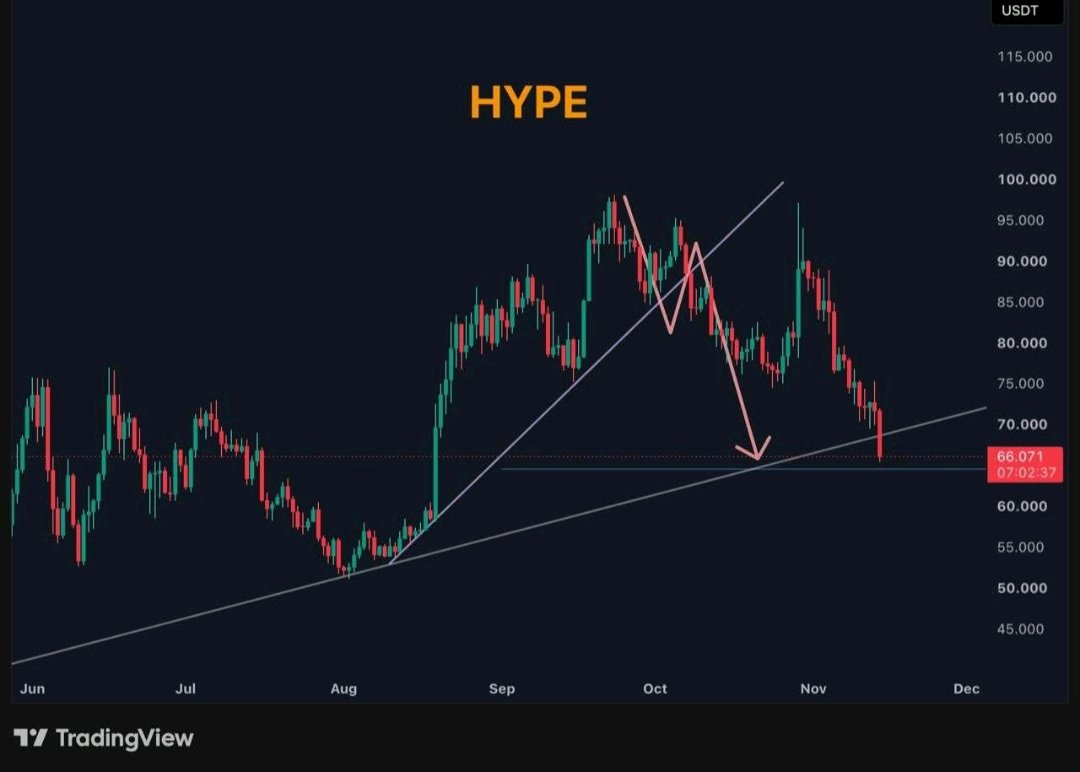
Everyone is posting this $HYPEUSDT chart today, but most people are reading it wrong. $66.071 | From $96 to $66 in one leg I am looking at this chart and I see 5 months of work in one picture. In August, HYPE was near $52. In September, it ran to $98. In October, it made a second top near $96 to $98 and failed. Now it is back at $66.071, sitting right on the rising trendline that has held since June. That trendline is not just a line for me. It is where every dip buyer from the last 5 months is sitting. If it holds, they will defend it. If it breaks, they will all sell at the same time. This is why I am not shorting $66. I have learned that shorting a 5-month trendline on the first touch is the most expensive mistake. Everyone sees the same breakdown, everyone shorts the same level, and then price bounces and traps them. My rule here is different. I need a close, not a wick. If HYPE closes below $66 and stays below it, then the trend is truly broken for me, and $59.65 opens next, then $53.42, that is the August low. If HYPE holds $66 and closes back above $70, that would be my first proof that dip buyers are still alive, then $73.81 opens. I am not chasing $66.071 in the middle. I am waiting for the market to tell me who is stronger, the trendline buyers or the breakdown sellers. Risk 1 to 2% only, 5x to 10x isolated max if I trade it. Otherwise I skip it. A trendline test is not a reason to go all in. Tell me honestly, do you trust trendlines like this, or do you think they break exactly when everyone is watching them? Give me your reason in one line, I want to read it. Tap $HYPEUSDT to trade this $66 trendline test with me, trade on this same coin #WSOT2026 #WSOTShowYourAITradeToEarn10USDT #JensenHuangExitTestsNvidiasAILeadership #USPPITestsTheHigherForLongerTrade #USInflationRunsHotAndRateHikeBetsRise @BybitX @Bybit Learn @612 Ceros @SignalX @Demon - Trader @GhostWriter @VietnexusCrypto @James @BitRase @BlockchainMaster


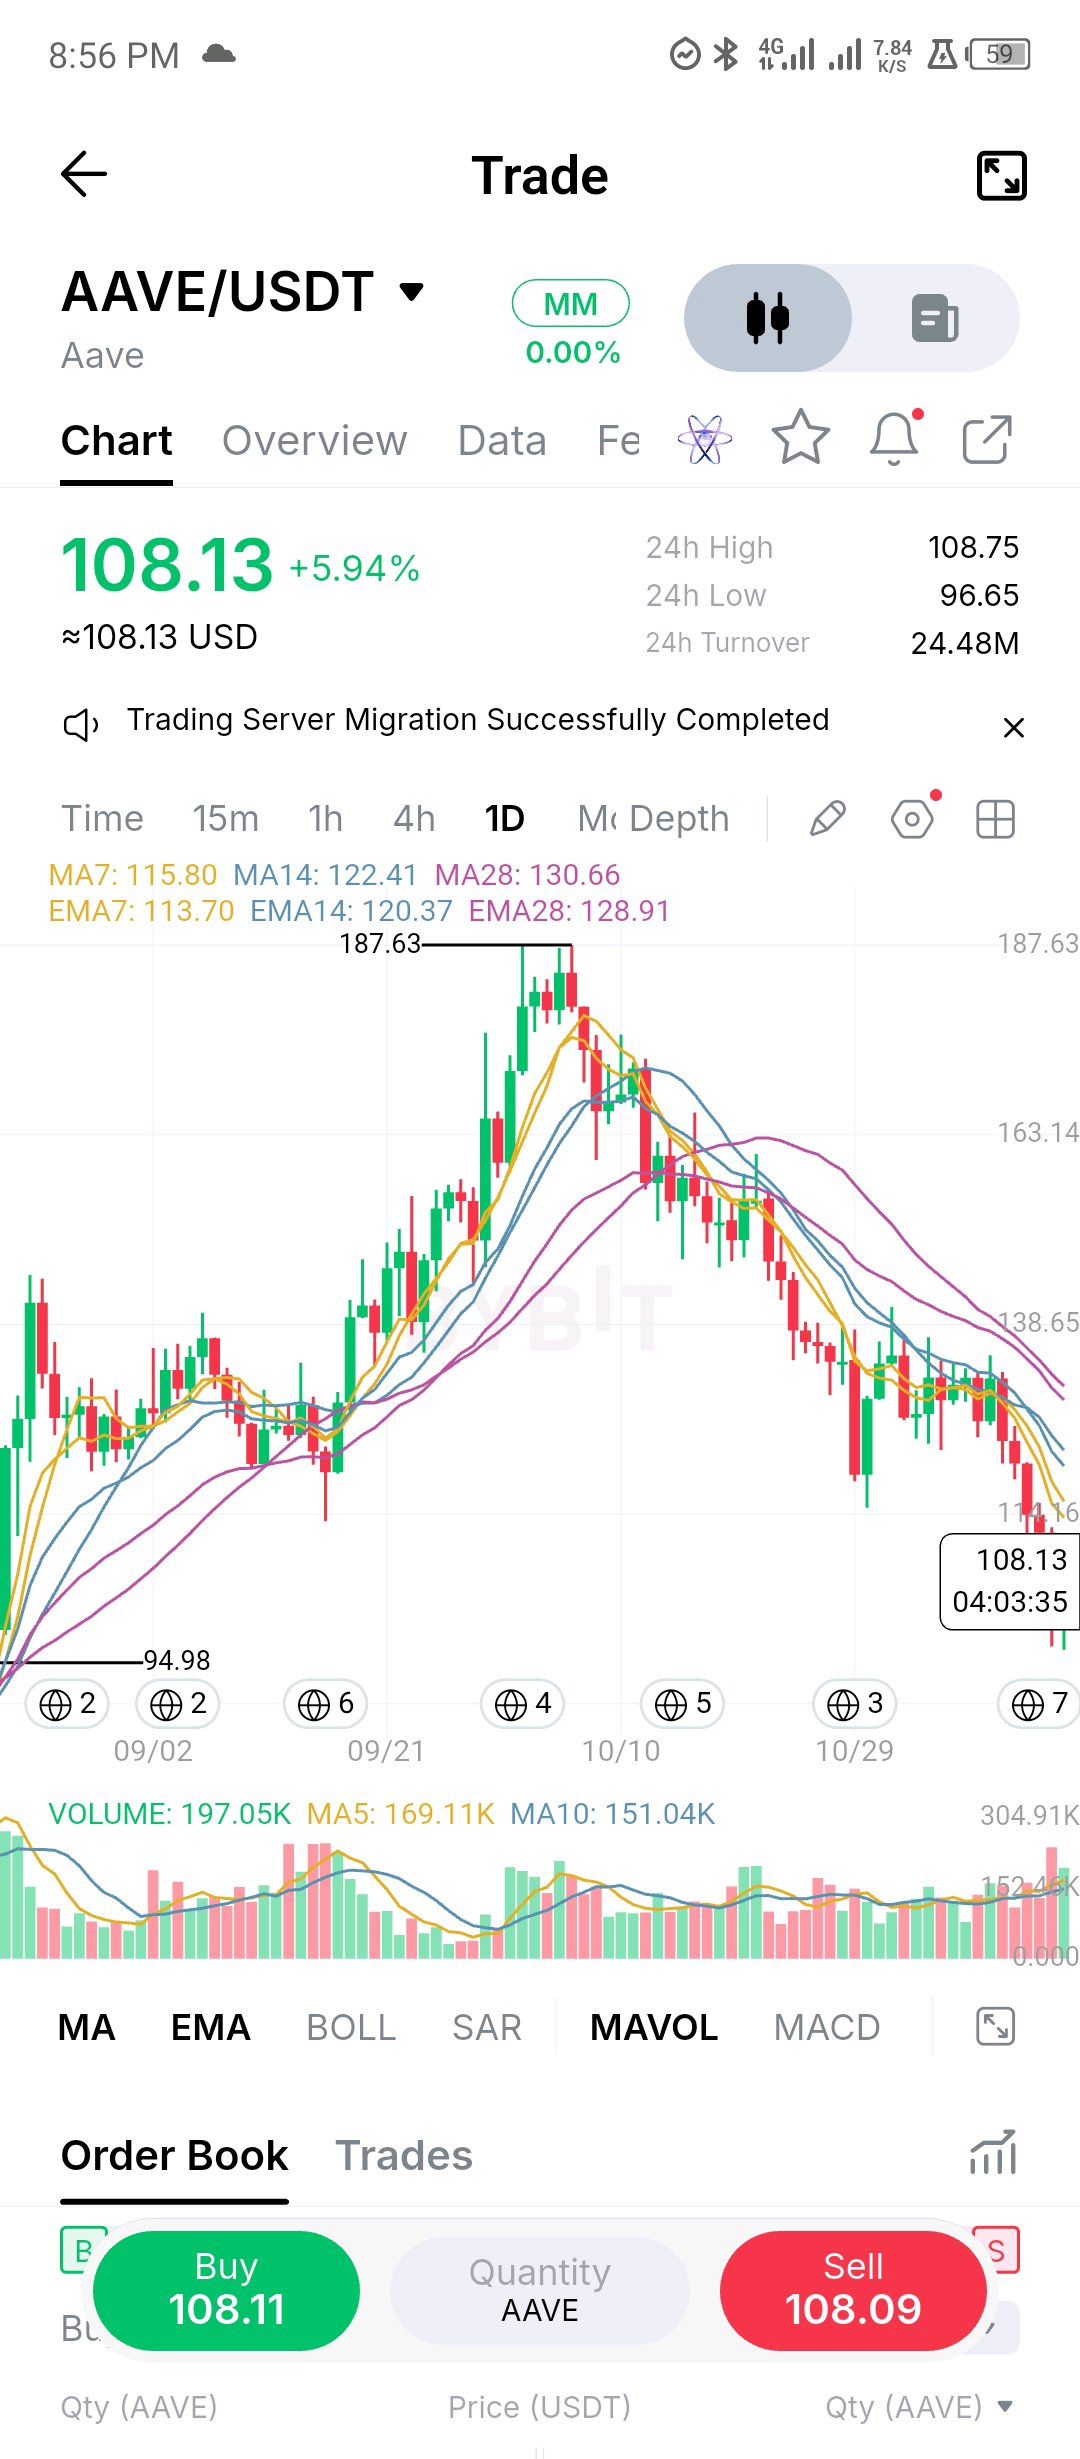
AAVE: BUYERS ARE RESPONDING, BUT THE DAILY DOWNTREND HAS NOT BEEN BROKEN Aave is an important part of decentralized finance, providing non-custodial lending and borrowing infrastructure. Its ecosystem allows users to earn interest by supplying assets and access liquidity through overcollateralized borrowing. Beyond its utility, AAVE has a notable value-accrual mechanism: the Aave DAO's $50 million annual buyback programme, funded through protocol revenue. However, strong fundamentals do not automatically translate into immediate price appreciation. The daily chart presents a market that is still attempting to recover from a prolonged decline. KEY FIGURES - Current price: $108.13 - 24-hour change: +5.94% - 24-hour high: $108.75 - 24-hour low: $96.65 - 24-hour turnover: $24.48M - Displayed volume: 197.05K AAVE MARKET CONSIDERATION AAVE has fallen substantially from its marked $187.63 peak. The recent recovery is encouraging, but price remains below the major moving averages. The current technical configuration is particularly important: - MA7: $115.80 - MA14: $122.41 - MA28: $130.66 - EMA7: $113.70 - EMA14: $120.37 - EMA28: $128.91 The averages remain bearishly aligned. This means buyers are attempting to establish a recovery while the broader daily trend still carries downside pressure. VOLUME AND TURNOVER The displayed trading volume is 197.05K, above both the MA5 reading of 169.11K and MA10 reading of 151.04K. This is a constructive development. Buying activity has improved relative to the recent volume averages. The 24-hour turnover of $24.48M also provides useful context for the level of market activity. However, one stronger volume reading is not enough to confirm sustained accumulation. SUPPORT, RESISTANCE AND LEVELS TO WATCH Immediate resistance: - $108.75 — displayed 24-hour high. - $113.70–$115.80 — first major moving-average resistance zone. - $120.37–$122.41 — next recovery barrier. - $128.91–$130.66 — broader resistance cluster. Support: - $104–$105 — near-term monitoring area, not yet confirmed as established support. - $96.65 — displayed 24-hour low. - $94.98 — previous marked chart low. BULLISH CONFIRMATION A sustained move above $108.75 would be the first positive development. The more meaningful confirmation would be a daily close above $115.80, preferably supported by expanding volume. Reclaiming $122.41 would further strengthen the recovery structure. BEARISH CONFIRMATION Failure to overcome the $113.70–$115.80 resistance region could invite renewed selling. A decisive breakdown below $96.65 would weaken the recovery thesis and bring the historical $94.98 area into focus. TRADE PLAN Bullish scenario: Avoid chasing the initial bounce. Watch for a confirmed breakout above $115.80, followed by a successful retest. The next technical areas of interest would be $120.37–$122.41 and subsequently $128.91–$130.66. Bearish scenario: If price rejects resistance and loses $96.65, avoid assuming the correction is over. Watch how price behaves around the $94.98 historical low. INVALIDATION For the bullish breakout setup, a failed reclaim followed by a sustained move back below $108.75 would weaken the immediate continuation argument. A decisive loss of the $96.65 support reference would invalidate the broader recovery thesis presented here. RISK NOTE AAVE remains volatile, and the prevailing daily moving-average structure is bearish. Breakout entries should be confirmed rather than anticipated. Position size should reflect the distance to the chosen invalidation level, and no trade should risk more than the trader can afford to lose. MY FINAL TAKE What interests me about AAVE is the contrast between improving participation and an unresolved higher-timeframe downtrend. Buyers are showing signs of returning, but they still have several resistance levels to overcome before the market can establish a convincing bullish reversal. I'm watching the $115.80 region closely. That is where the recovery will face its first meaningful structural test. Would you trust this recovery enough to consider a breakout above $115.80, or would you rather wait for stronger confirmation of a daily trend reversal? $AAVEUSDT #ByXIMPACT $BTCUSDT
من خلال خبرتي المتواضعه في تداول العقود الاجلة
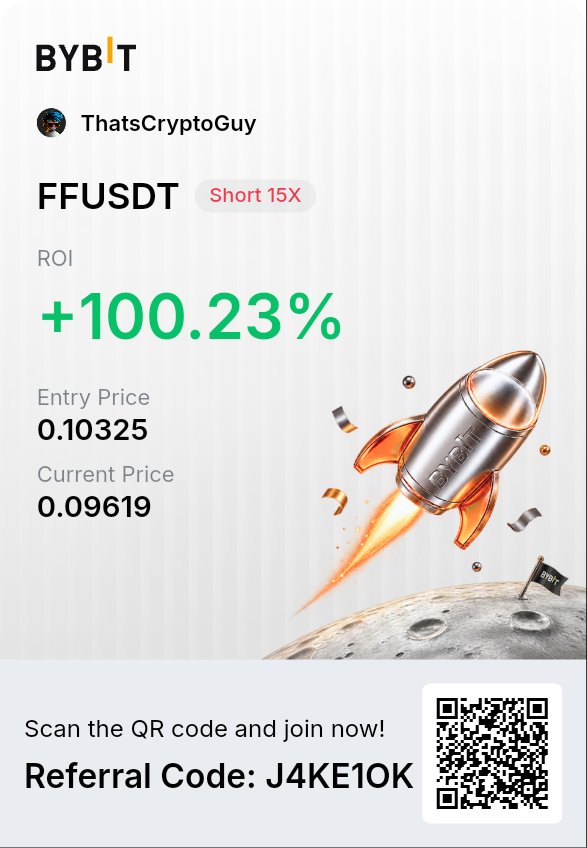
سوف الخص لكم اهم نقطتين وصلت لها من خلال خبرتي المتواضعه في تداول العقود الاجلة منذ ثلاث سنه نقطتين مهمين جدا لازم تتعلمها سوف اقسم شرح النقطتين في منشورات متفرقه بالترتيب اليوم سوف تبداء باذن الله بتوضيح النقطتين وكل واحد يعمل بحثه الخاص لنستفيد من بعض وغدا نفتح الموضوع والنقاش في المنشور القادم النقطتين هي 1- قياس جودة التنفيذ لا قياس الربح وحده . 2- لاتدخل عدة صفقات شراء او بيع على عملات تتحرك معاً لان هذا ليس تنوعا حقيقيا . هذه النقطتين كل واحد يعمل بحثه الخاص وغدا سوف ابدأ بشرح اول نقطه. #WSOT2026 #ارتفاع التضخم الأمريكي وزيادة الرهانات على رفع أسعار الفائدة #WSOT أظهر تداولك بالذكاء الاصطناعي لتربح 10 USDT $HYPEUSDT $FFUSDT


$HYPEUSDT відскочив від $60. Але чи справді продавці втратили контроль? Після різкого падіння HYPE показав сильну реакцію покупців. Ціна піднялася від $60,03 до області $67, але я поки не поспішаю називати це розворотом. Причина моєї обережності — структура ринку. 98% ЛІКВІДАЦІЙ ПРИПАЛО НА LONG За останнім доступним зрізом за добу на HYPE було ліквідовано близько $84,3 млн позицій. Із цієї суми приблизно $82,7 млн припало на LONG. Це масштабне очищення плечових покупців, які намагалися втримати попередній висхідний рух. Водночас відкритий інтерес на Hyperliquid скоротився на 8,9% — до приблизно $1,3 млрд. Для мене це важливий сигнал: частина спекулятивного капіталу вже залишила ринок. FUNDING ПОКАЗУЄ ЦІКАВУ РОЗБІЖНІСТЬ На Hyperliquid ставка фінансування перейшла в негативну область, тоді як на Binance та Bybit вона залишалася позитивною. Така різниця показує, що позиціонування трейдерів на різних біржах суттєво відрізняється. Негативний funding може створювати умови для закриття SHORT, але сам по собі не гарантує зростання. ДЕ ЗАРАЗ ЗОСЕРЕДЖЕНА ЛІКВІДНІСТЬ? Я виділяю такі області: - $68,75–69,10 — найближча перешкода для покупців. - $71,75–72,40 — важлива зона опору та потенційного закриття SHORT. - $74,75 — наступний орієнтир відновлення. - $64,25–64,65 — значний кластер ліквідацій LONG. - $60,00–60,10 — локальне дно останнього розпродажу. Особливо цікава асиметрія ліквідності: за доступною картою ліквідацій нижче ціни зосереджено значно більше потенційних ліквідацій LONG, ніж найближче зверху SHORT. Це означає, що ризик повторного зниження залишається. МОЯ ПОЗИЦІЯ Я бачу перші ознаки стабілізації, але ще не бачу підтвердженого розвороту. Повернення вище $69 із формуванням вищого мінімуму стане першим аргументом на користь покупців. Наступна перевірка — $72,40. Якщо HYPE зможе закріпитися вище цієї області, картина стане значно цікавішою. Якщо ж ціна втратить $64,60, увага знову переміститься до мінімуму $60. Найцікавіше зараз — не сам відскок HYPE, а те, чи зможуть покупці втримати його після того, як ринок уже ліквідував більшість плечових LONG. #IMPACTbyTrade $BTCUSDT


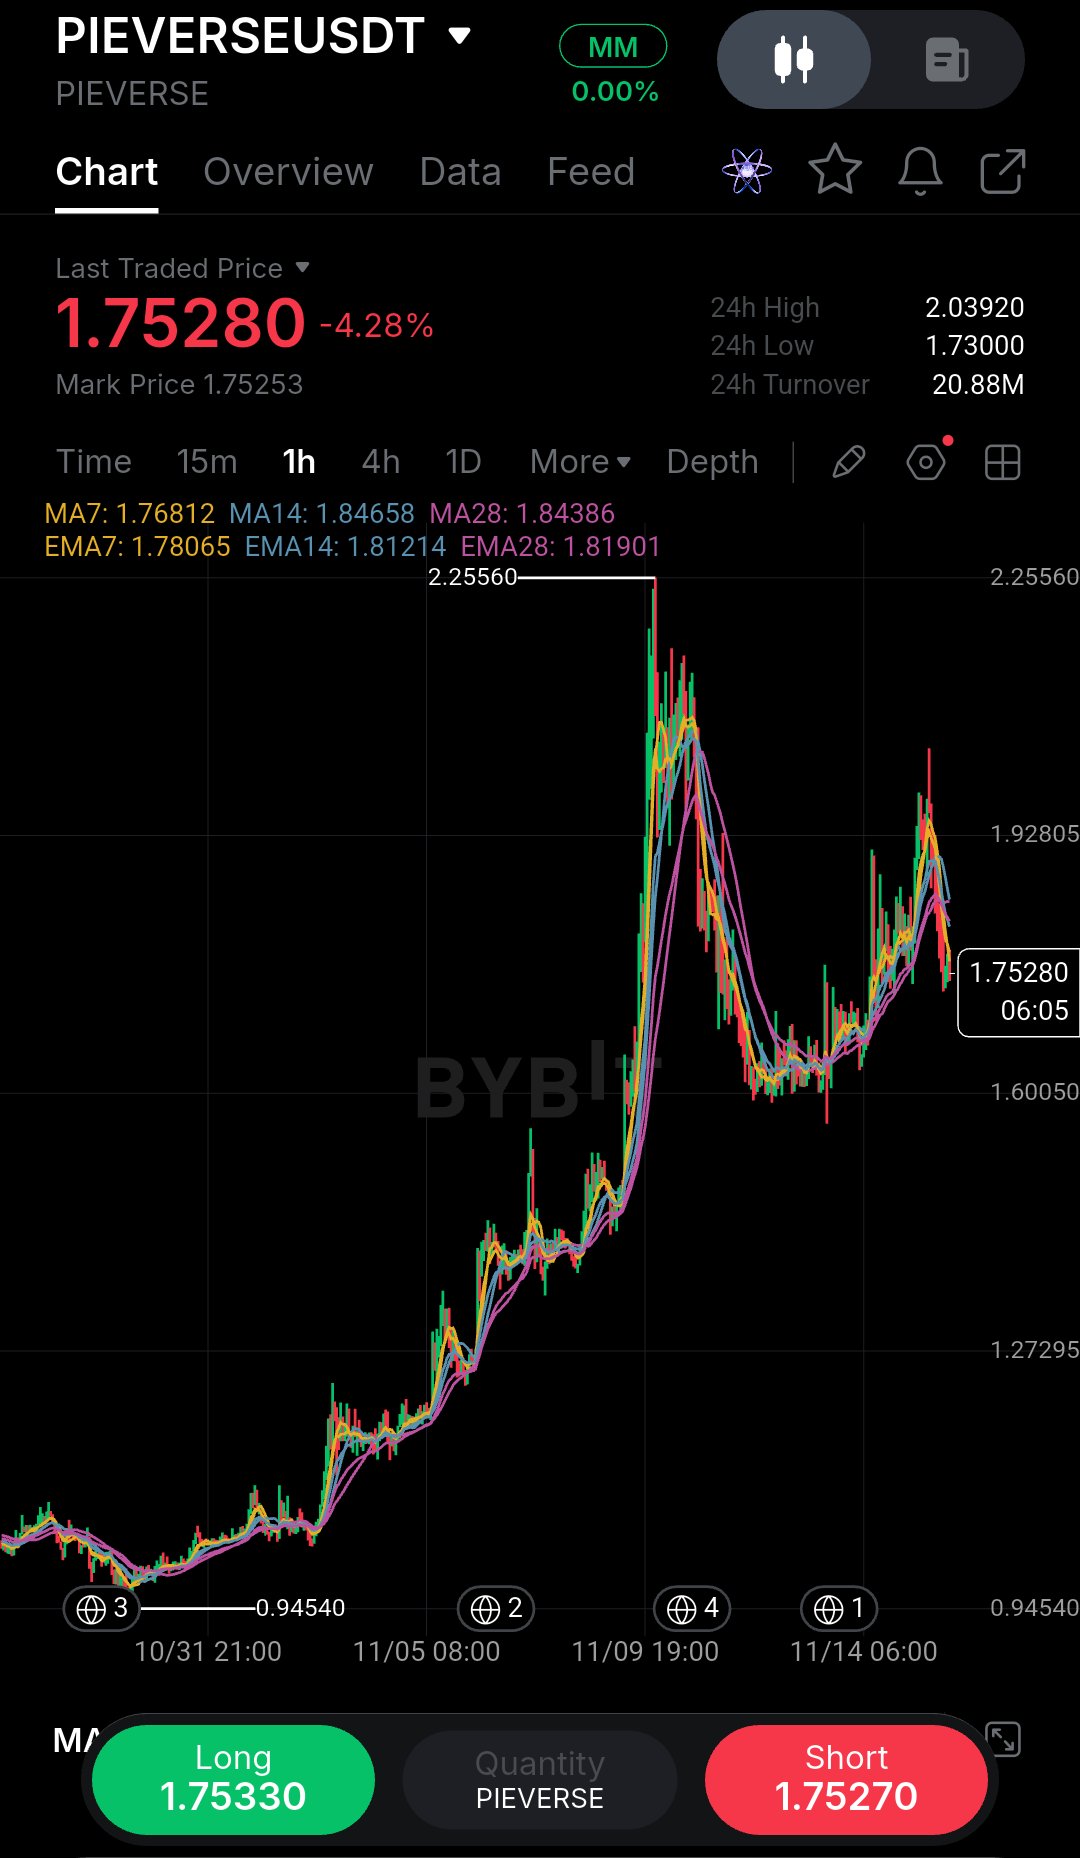
The first thing I ask myself looking at this PIEVERSE chart is whether I’d actually risk my own money here right now. Honestly, the answer is no—not in the middle of this heavy sell-off. But it’s a perfect example of why waiting for confirmation matters. Looking at the 1-hour timeframe, the macro trend is clearly bearish. We’ve bled from the 2.25560 peak, and the recent price action is pure capitulation. A heavy -4.28% drop just sliced straight through support, tagging a low of 1.73000. Right now, price is hovering at 1.75280, and the moving averages are stacked heavily above us. The MA7 (1.768), MA14 (1.846), and MA28 (1.843) are all fanning out to the downside. This is a textbook bearish alignment. When price goes vertical like this, there is very little structural support underneath it. A lesson I’ve learned from taking too many early entries is that oversold does not always mean it’s time to buy. I always let the market prove it can find a floor before entering. Trade Plan: Bias: Bearish (Waiting for a dead-cat bounce or structural base). Entry Zone: 1.8400 – 1.8500 (Looking for a retracement to the MA cluster, only if it forms a clear rejection). Stop Loss: 2.0390 (Above the previous breakdown block). Target 1: 1.7300 (Recent low). Target 2: 1.6005 (Macro swing low). Target 3: 1.5500 (Psychological support). Risk/Reward: 1:2.5 Invalidation: A 1H candle close back above 1.9000, signaling a massive V-shaped reversal. Do not FOMO into a falling candle. Wait for the market to cool off, respect your stop loss, and never risk more than you can afford to lose. Would you dare to catch this falling knife, or are you waiting for a clear reversal signal? $PIEVERSEUSDT #ByXIMPACT

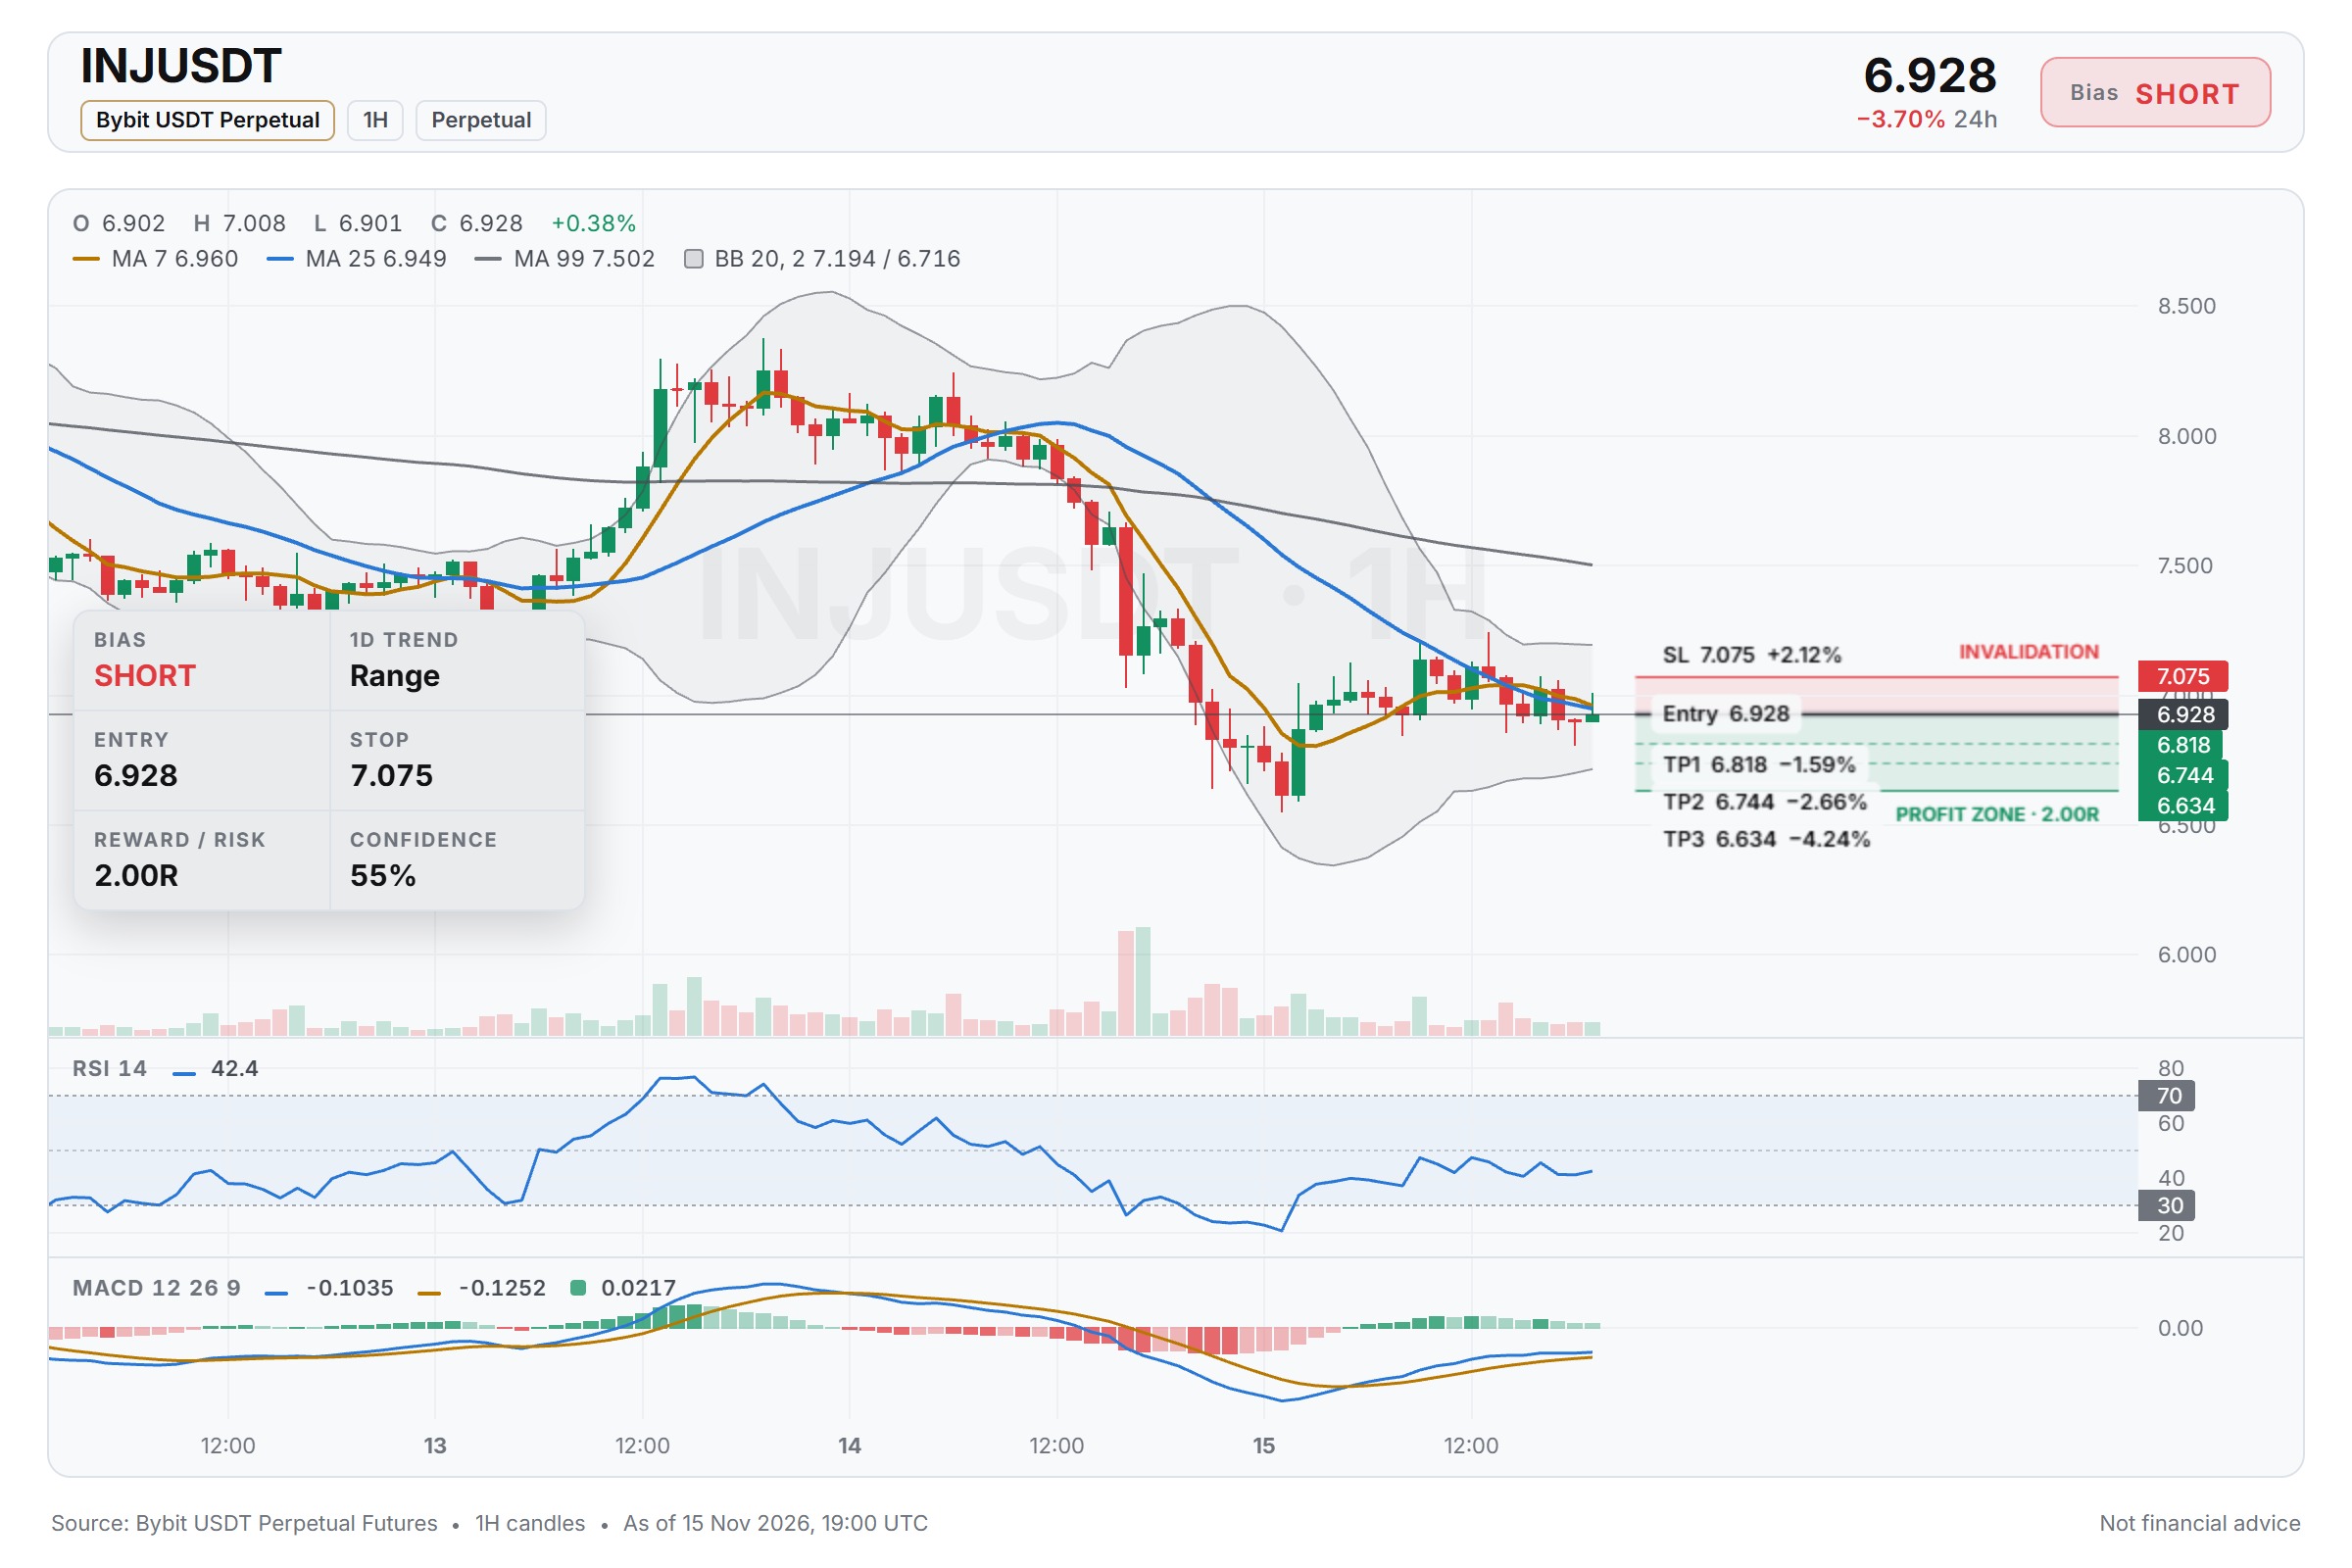
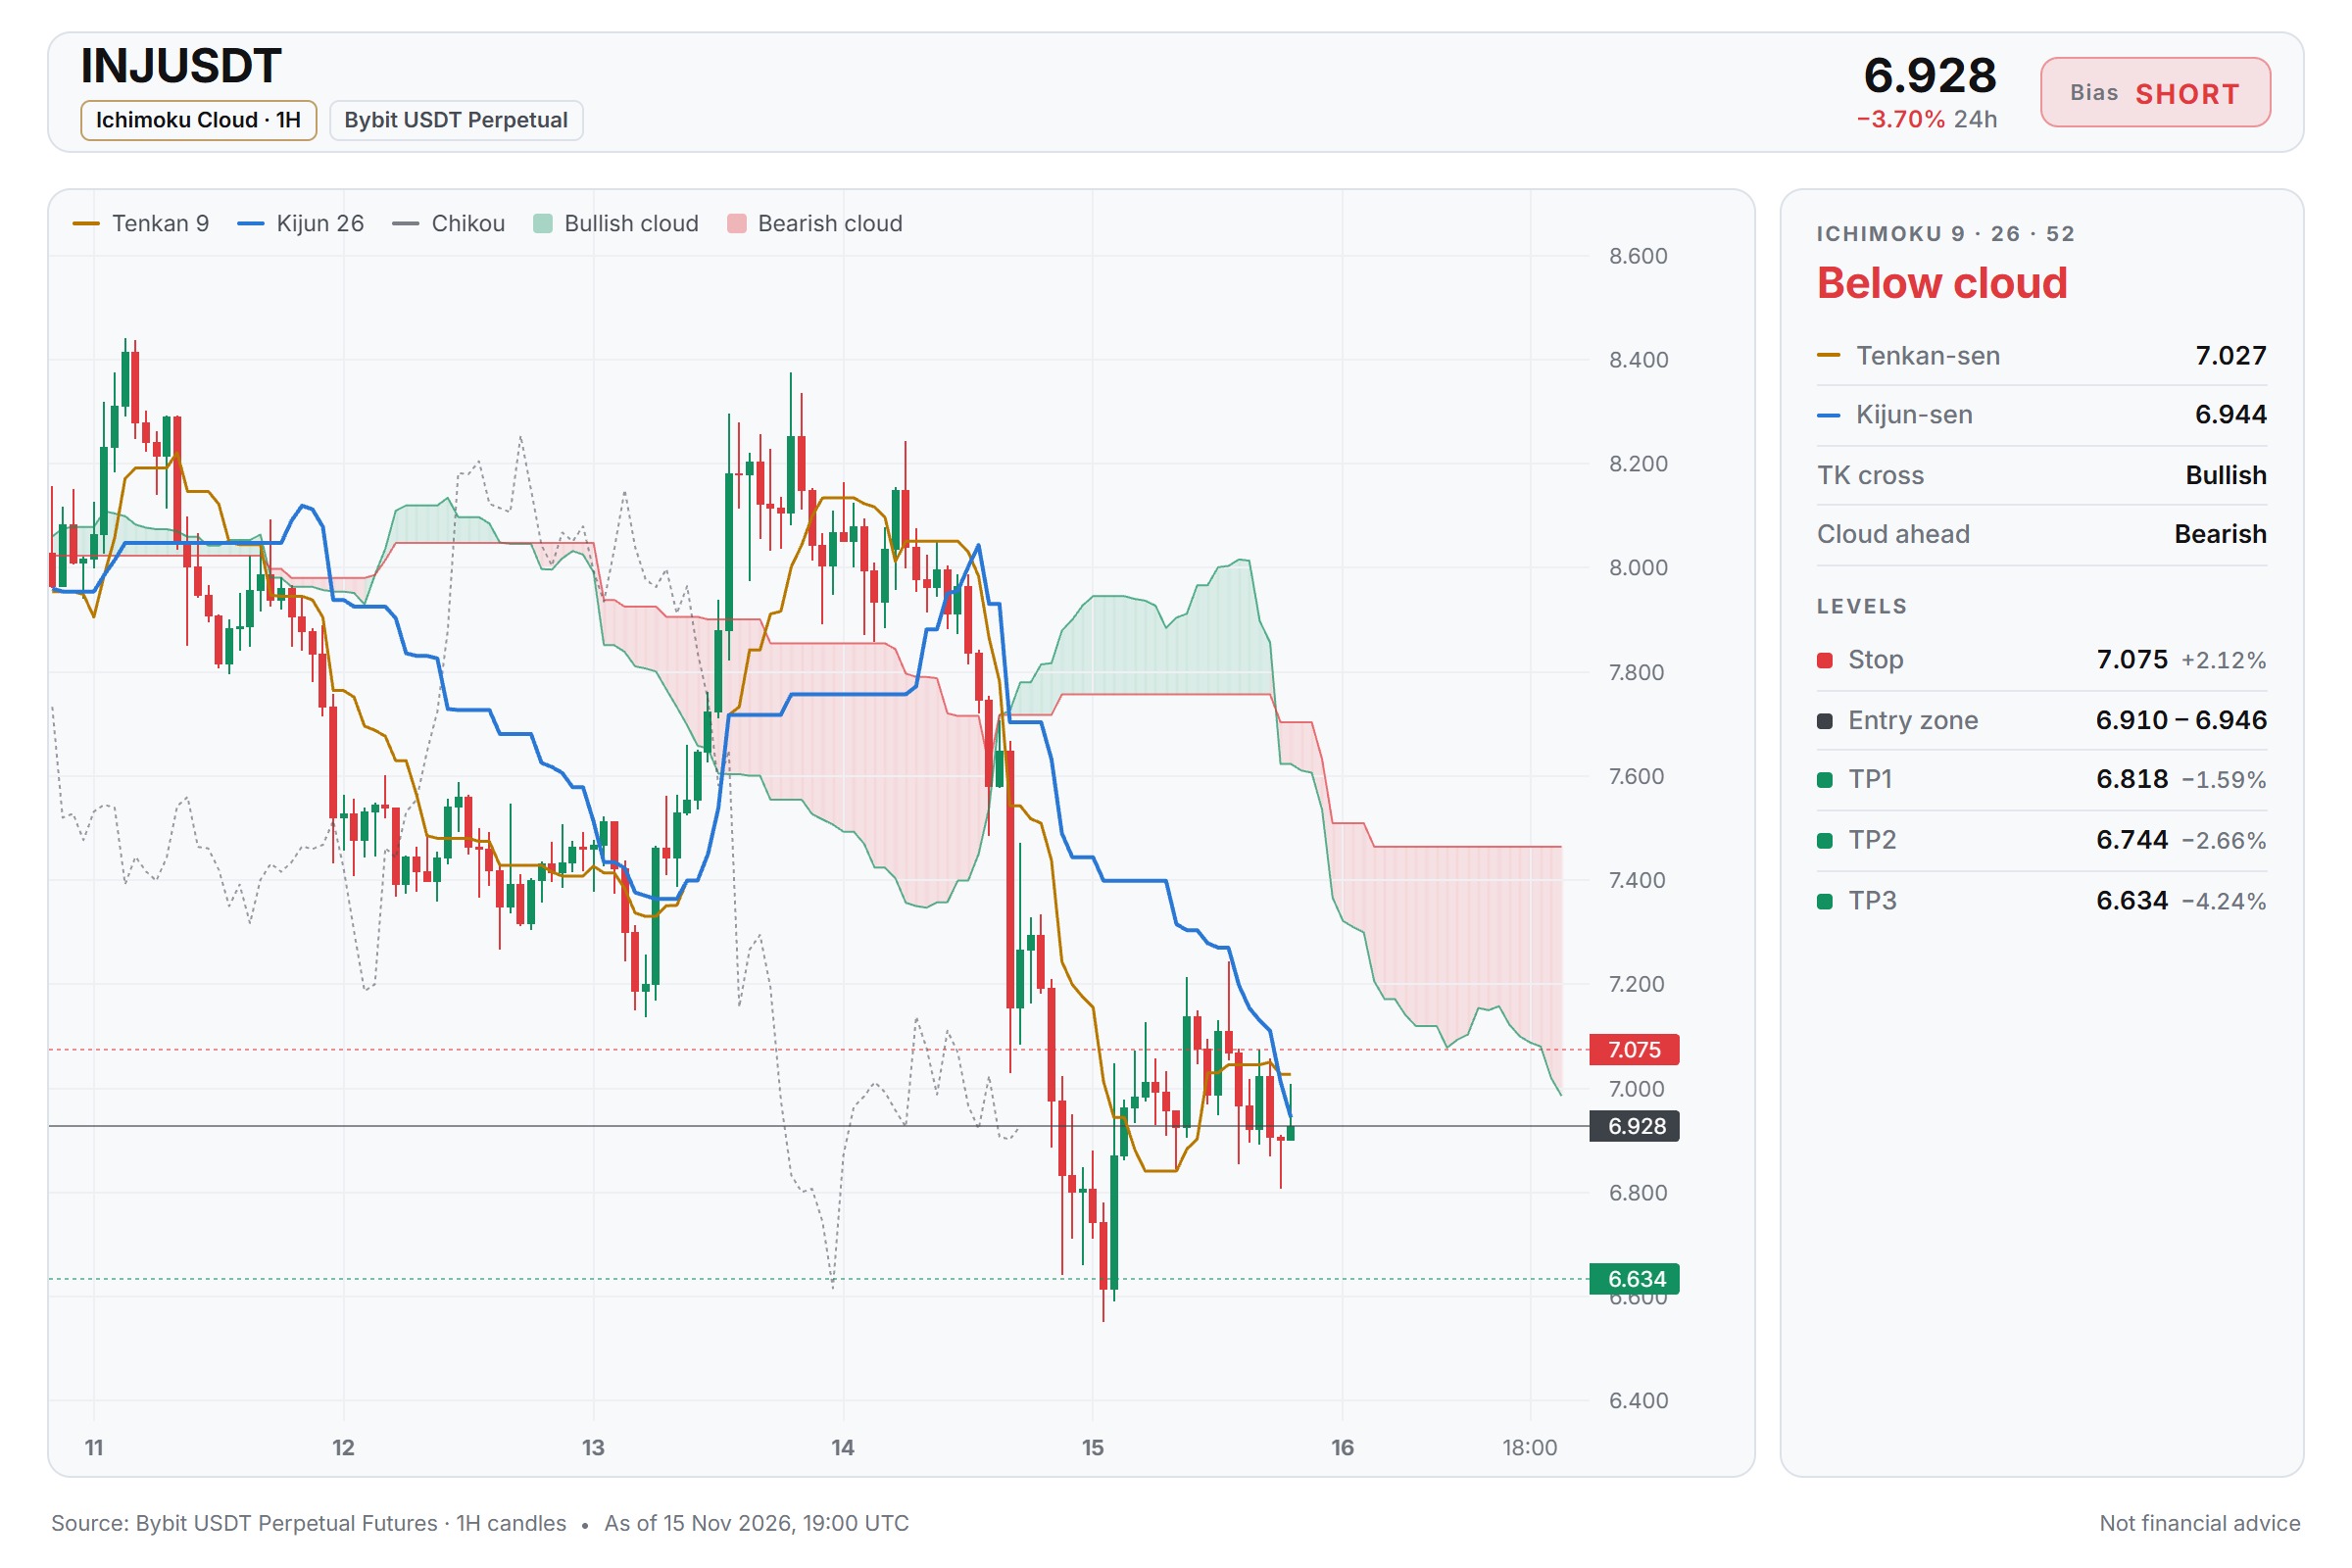
INJ Bearish as BTC Stalls
$INJ/USDT — SHORT Entry: 6.910 - 6.946 SL: 7.075 TP1: 6.818 TP2: 6.744 TP3: 6.634 From my view, the 15m RSI around 47 shows fading momentum while the short setup forms. With BTC trend neutral, a failure at 6.946 could open a path toward the TP2 and TP3 zones. I watch the SL at 7.075 as the key invalidation level. Do you think INJ will break the entry range before BTC gives a clearer direction? ⚠️ Personal market analysis only. NFA — manage risk and DYOR. Educational content, not investment advice or a recommendation to buy, sell, deposit, or withdraw any asset. No paid promotion or referral/affiliate links.$INJUSDT#WSOT2026 #WSOTShowYourAITradeToEarn10USDT

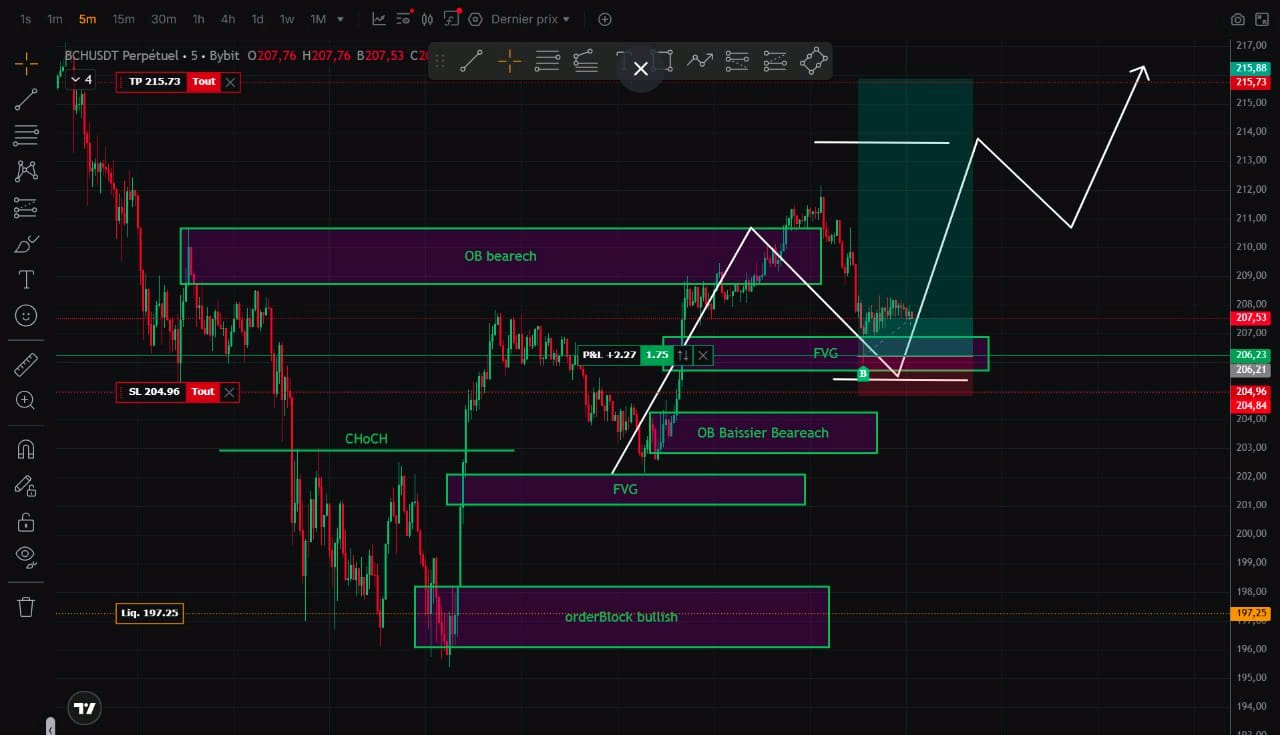
vous tradez avec quelle technique ?
sinon le #SMC reste ce qui m'inspire le plus

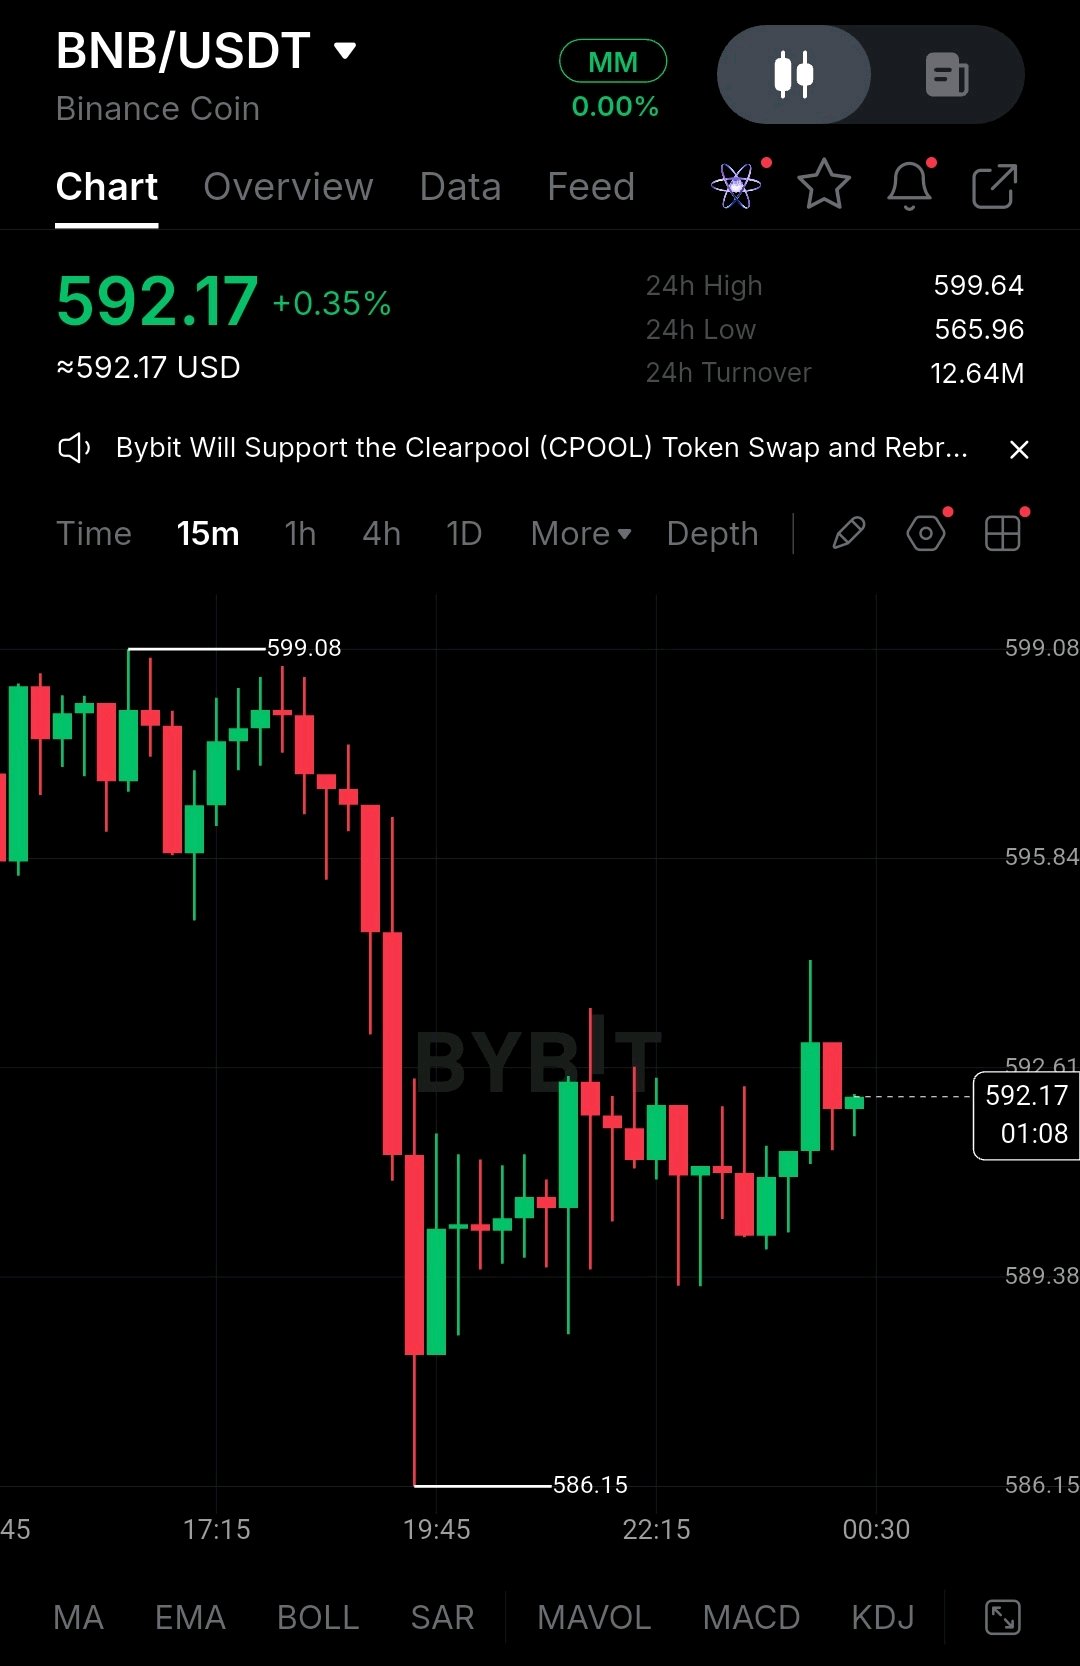
One Coin, Several Chains: BNB's Bet That Speed Will Eventually Pay the Token About $6.36 billion left Binance wallets on October 29, most of it within roughly 20 minutes. BNB fell 7.9% within minutes of the first headline. Binance says it has since replaced all affected holdings with more than $6.34 billion of its own money. BNB still fell to $584 on November 14, versus $759 on the day of the hack. In the same weeks, BNB Chain detailed a second Layer 1. It will use BNB as its only token for gas, staking and governance. The testnet is planned for the end of 2026 and mainnet for early 2027. The bridge isn't finished, so this remains a plan, not a product. The bull case is that BNB becomes shared collateral across several fast chains instead of the gas coin of one. The supply side is already working. The 37th burn on October 19 removed 1,646,196 BNB, worth about $1.197 billion, leaving 131,512,085 BNB against a 100 million target. In Q3, network revenue rose 54% to $54.2 million and token-holder net income hit $45.1 million, with no new issuance. The missing link is that the big burn is a schedule, not a revenue share. The quarterly formula uses BNB's average price and the number of blocks produced. The fee-linked burn was about 7,400 BNB in Q3, which by my arithmetic is under 0.5% of July's 1.6 million BNB burn. Annualized Q3 revenue is about $217 million against a market cap near $77 billion at recent prices (my calculation). One report says the new chain's base fee is fixed at zero. I could not confirm whether its priority fees are burned or go to validators, and that decides whether it feeds the token. Growth quality is also mixed. Daily active addresses fell 14% and stablecoin supply slipped 4.6% in Q3. The counterargument is that Binance covered a record loss from its own balance sheet and supply keeps shrinking, while fee revenue is rising. Against that, BNB's price still moves with one company's credibility, and the recent selloff also tracked a broad market drop tied to hot inflation and rate fears. My position is that BNB is priced like a claim on Binance and marketed like a claim on a chain. I'd watch four things: - Token-holder net income, excluding one-off launchpad spikes. - The New L1 fee rules, specifically whether fees are burned. - Stablecoin supply and daily active addresses recovering. - The Jenner hardfork on BSC mainnet on December 8. A faster chain only matters to holders if its fees reach the coin. #ByXIMPACT $BNBUSDT

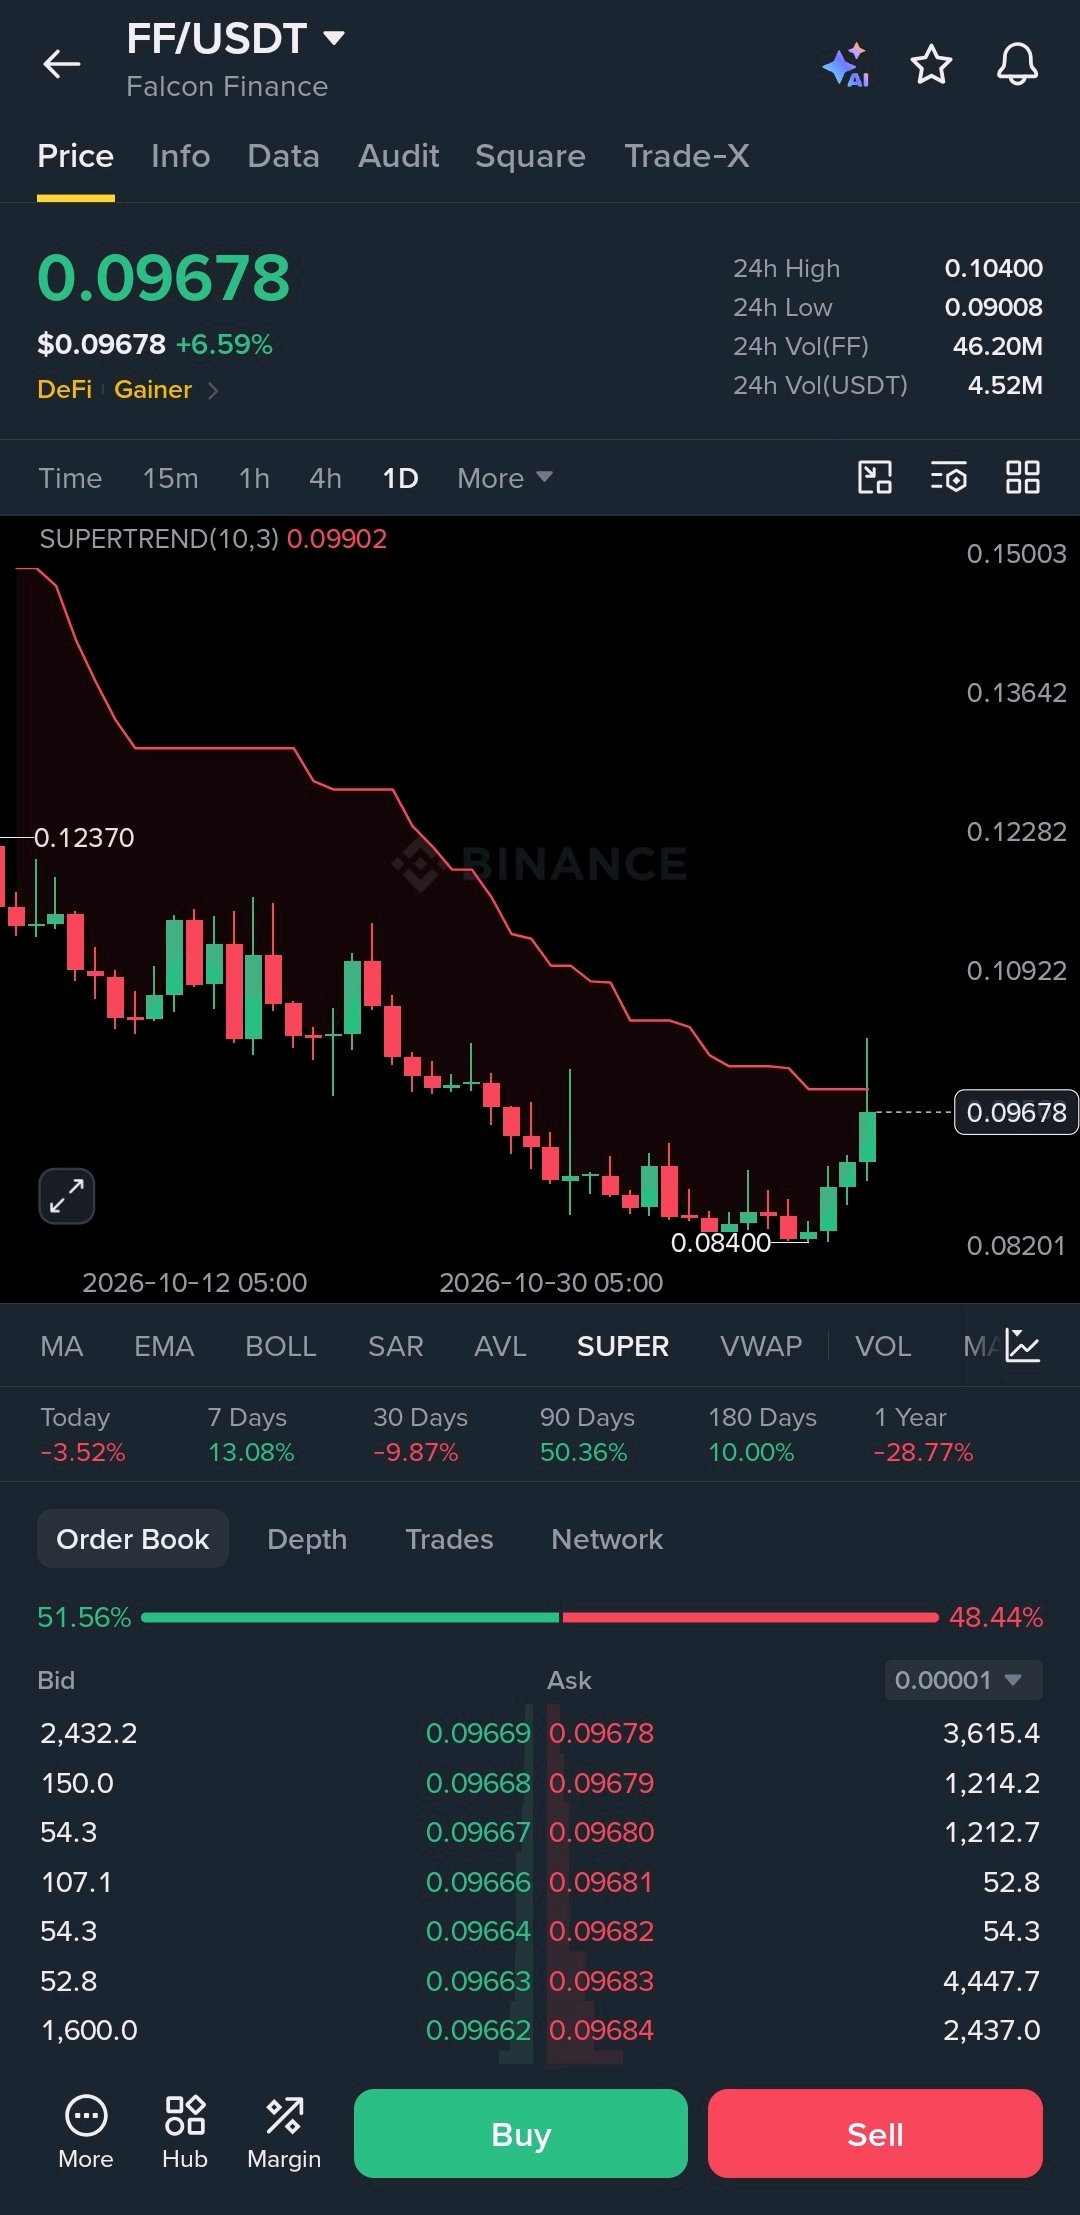
Is $FFUSDT finally preparing to break out of its downtrend? The next daily close could tell us a lot. Falcon Finance is showing a decent recovery, up 6.59% and bouncing from the $0.084 area. Buyers are stepping in, but there’s still one important hurdle ahead. Levels worth watching: Support: $0.090 Major support: $0.084 Immediate resistance: $0.099 to $0.104 Next resistance: $0.109 The daily Supertrend remains bearish at $0.0990, so reclaiming that level and holding above it would be an encouraging shift. A clean move beyond $0.104 could strengthen the recovery. Good bounce so far. Now FF needs confirmation before calling it a trend reversal. #AnthropicIPOTestsTheAIBoom #BitcoinHitsTwoMonthLowAfterUSMidterms

$NVDAXUSDT is trying to find a base after that brutal drop from 243, but the daily chart is flashing a warning sign. What caught my attention is the current price action: we are bouncing to 164.46, but we are running straight into the 7 EMA at 166.75. Look at the order book—there’s 70% buy pressure, yet the price is stalling. That’s a classic sign of absorption. My read here is that this is a weak relief bounce inside a heavy downtrend. The price is completely trapped below the 14 and 28 EMAs, which are sloping down hard. The 70% buy wall might look bullish on paper, but if it can't push price through the 7 EMA, the sellers will eventually eat through it. Key Levels: Resistance: 166.75 (7 EMA), 177.73 (14 EMA) Support: 156.70 (recent daily low) My Trade Plan: Bias: SHORT (Conditional) Entry: $165.00 – $168.00 (Fading the bounce right into the 7 EMA) Confirmation: I want to see a rejection wick or a bearish engulfing candle on the 4H chart right at this 166 level. If buyers step in and close a daily candle above 170 with volume, I step aside. Invalidation: $177.50 (A clean daily break above the 14 EMA kills the immediate bearish momentum). TP1: $156.70 (Retest of the recent low) TP2: $145.00 (Next major liquidity void) R:R: ~1:2.4 based on the stated levels. Why I'm taking this setup: Bounces into the first moving average after a steep drop are often the safest short entries. The buy pressure is trapped, and the trend is still firmly down. Selling this resistance gives us a tight stop and a clear path back to the lows. What would change my mind? If price reclaims 170 and flips the 7 EMA into support, the short thesis is dead. I’d wait for a higher low to form and look for a reversal trade. Until then, the bounce is just a setup for the next leg down. Are you fading this bounce at the 7 EMA, or waiting to see if 156 holds for a spot entry? #ByXIMPACT #WSOT2026 $BTCUSDT
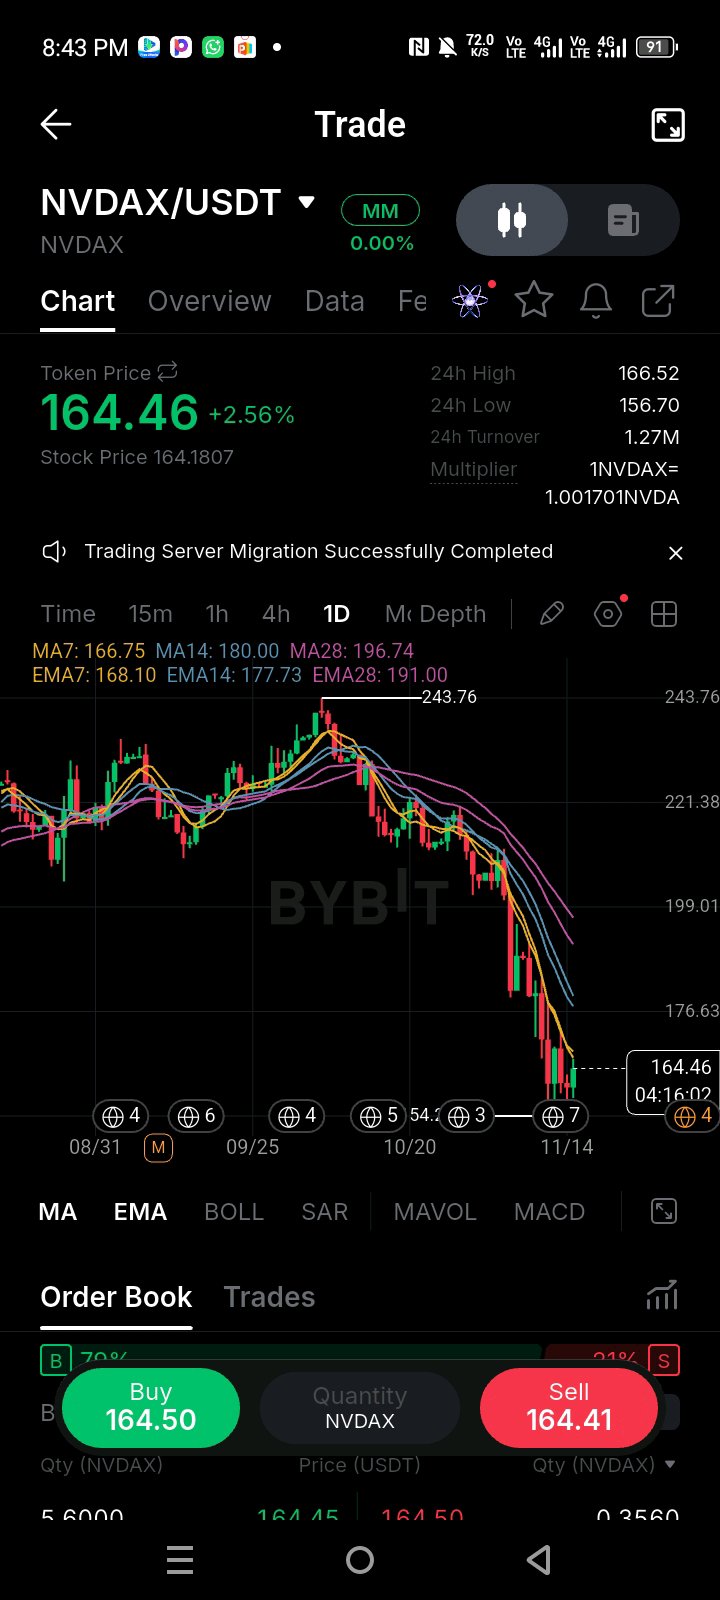

🔥Дженсен Хуанг ведёт переговоры с партнёрами о возможном возвращении на пост CEO Nvidia $NVDAXUSDT

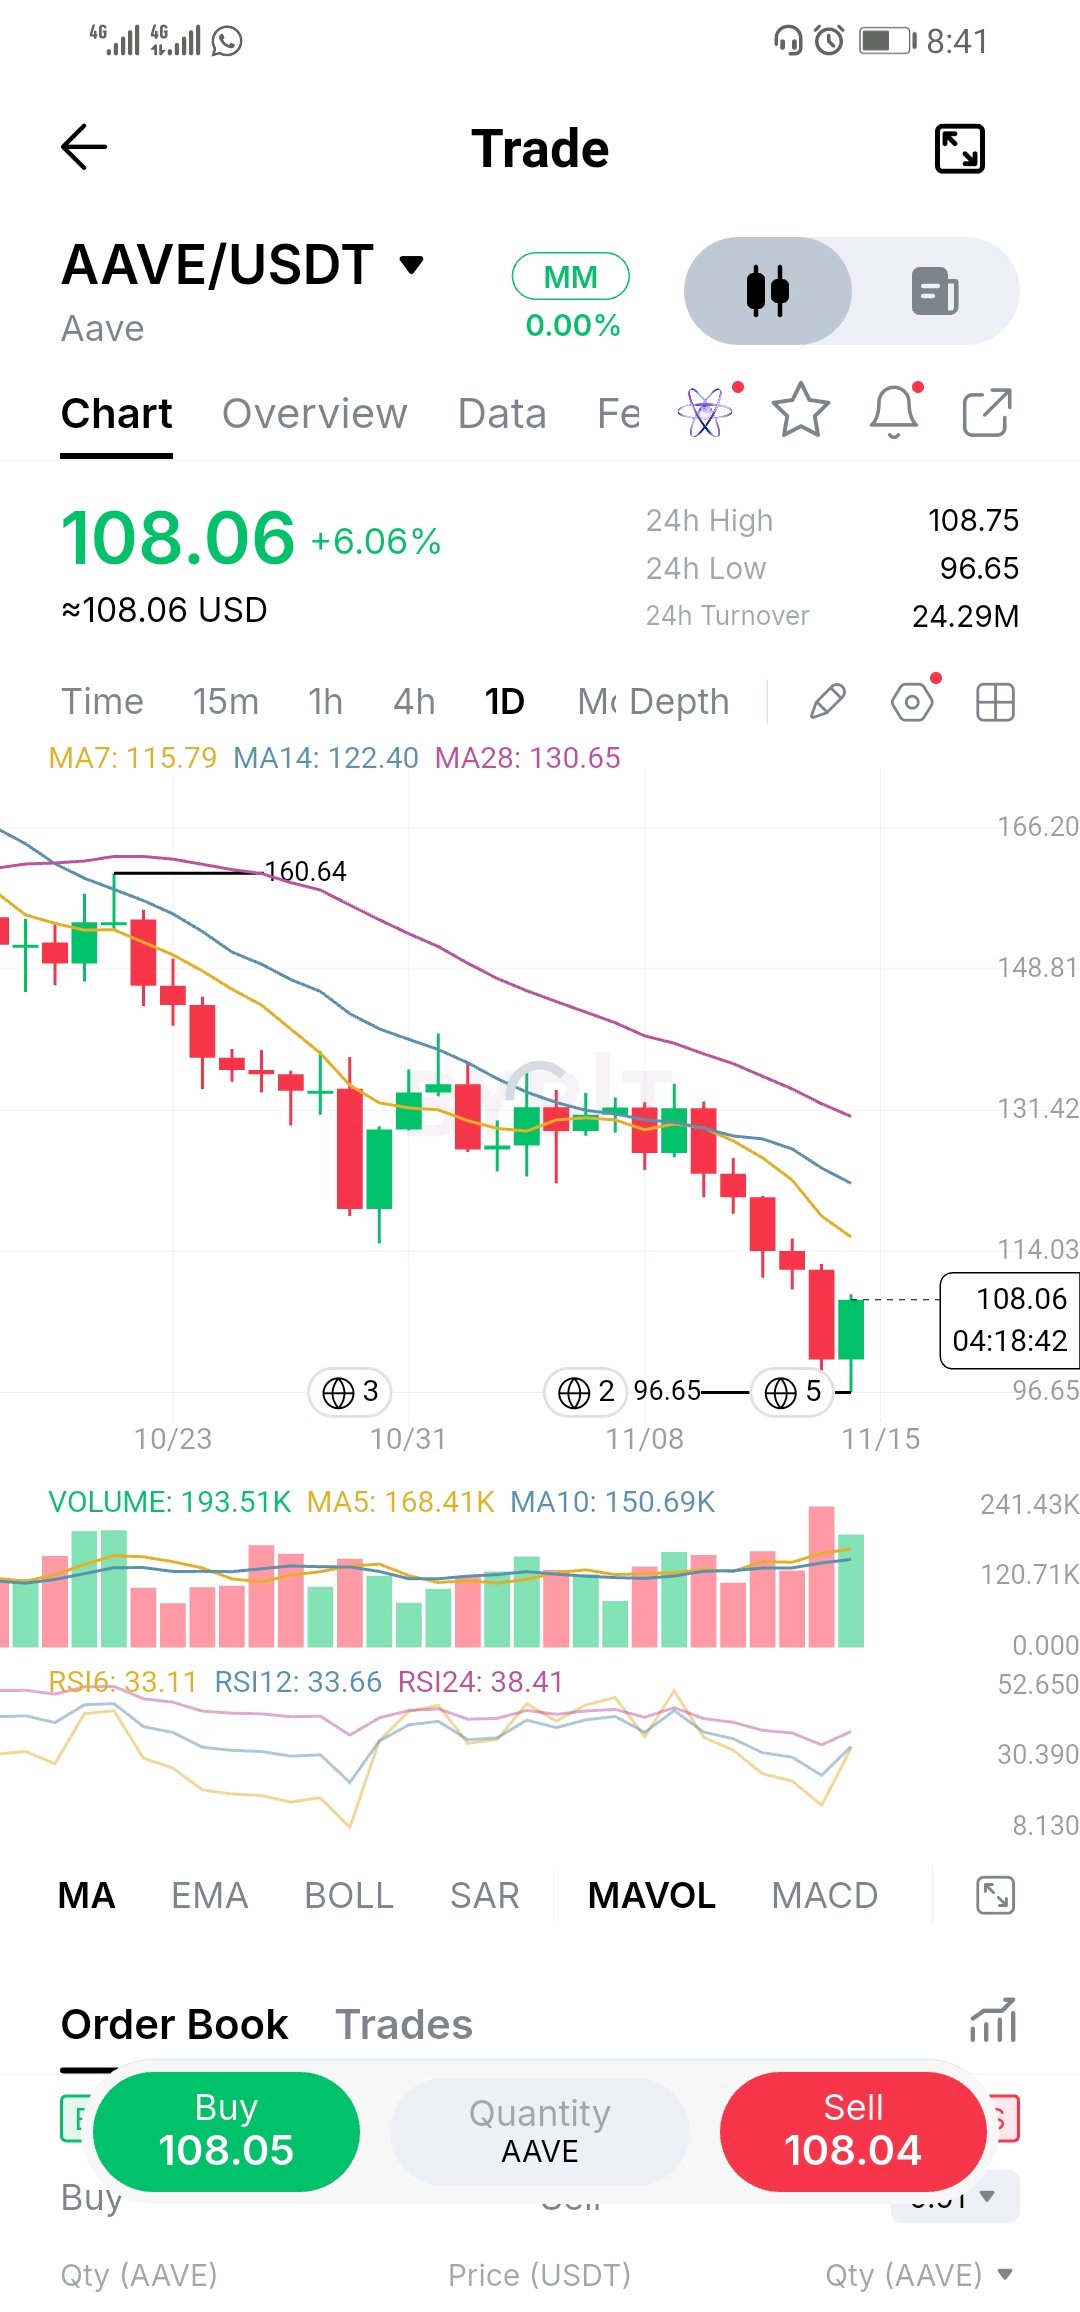
AAVE FLUSHED TO 96.65 AND BOUNCED 12% IN A DAY. THE HIGHER LOW IS THE TRADE. $AAVEUSDT, daily, 108.06 (+6.06%). Bias: bearish trend, early reversal attempt. The flush was violent. The 24h low is 96.65, RSI6 collapsed to about 8 (the floor of its range at 8.13) before rebounding to 33.11, and the candle that made the low carried the biggest volume bar on this chart. Since then price has bounced 11.8% off the low and is trading right under the 24h high of 108.75. But a bounce isn't a reversal. Structure: -33% from the 160.64 high on this chart, every bounce topped lower, and the lows kept falling until 96.65. Lower highs, lower lows. Price is under all three averages and they all slope down: MA7 115.79, MA14 122.40, MA28 130.65. It's 6.7% under the MA7 and 17% under the MA28. A real reversal needs two things: a higher low above 96.65 and a reclaim of the 7-day average. Today delivers neither yet. Resistance: 108.75 (24h high), 115.79 (MA7), 122.40 (MA14), 130.65 (MA28). Support: the 100 round number and the 102-103 area (half of the bounce), then 96.65 (24h low). Below it there's nothing on this chart, so 90 and 85 are round numbers, not proven levels. Volume: MA5 at 168.41K is above MA10 at 150.69K, and today's 193.51K with about 82% of the candle done is on pace for roughly 140% of the 5-day average. Buyers showed up on volume, which is the first thing that makes me take the bounce seriously. Plan: buy the pullback, not the chase. Price dips into 99-103, then a 4h candle closes above 103.50 with a lower wick and volume at or above the 4h average. If that close doesn't come, I'm not in. Entry ~103.50. Stop 95.80, under the flush low. On 7.70 of risk: TP1 115.79 = 1.6R TP2 122.40 = 2.5R TP3 130.65 = 3.5R A 4h close under 96.65 and I'm out. A daily close under it says the flush wasn't the low, with 90 and 85 next. Flush candles don't guarantee lows, so I'd take half off at TP1, move the stop up, and keep the size small. Turnover is only 24.29M USDT here, so wicks run wide. Not advice. Do you wait for the higher low like I do, or buy the flush itself? $AAVEUSDT #ByXIMPACT

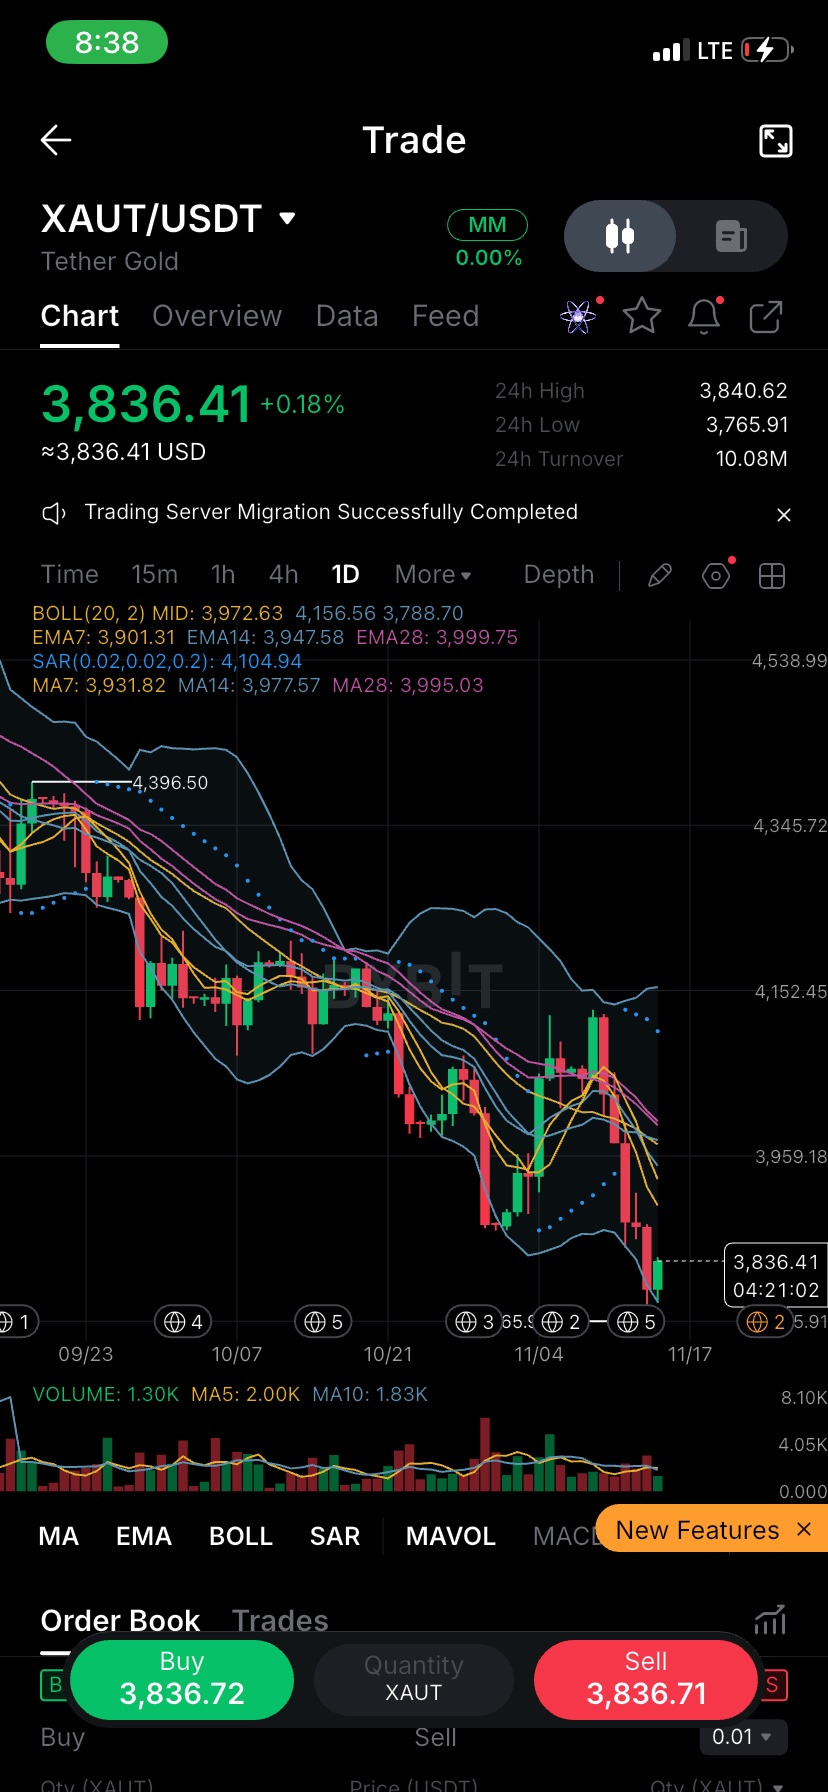
$XAUTUSDT Tether Gold: each token represents one troy ounce of physical gold held in vaults and redeemable for bars, so this chart is gold with a USDT price tag. About 827K tokens exist after Tether minted 119.7K new ones on Sept 28. Gold itself was 26.8% under its Jan 29 record of $5,405 on Nov 2, and the macro isn't helping. As of Nov 4, markets priced a 79% chance of a Fed hike in December, and the World Gold Council cut its 2026 investment-demand forecast to 200 tonnes from 400. The chart shows it. XAUT is at 3,836, down 12.7% from the 4,396.50 high in September. The post-election bounce (about +3% on Nov 4) ran into the 4,120s, just under the upper Bollinger band (4,156.56), and has since been fully reversed. Today's candle is a small green one off the 3,765.91 low, with light volume (1.30K vs a 2.00K 5-day average) and about four hours left. Price is under every average, and they're bunched: EMA7/14/28 at 3,901 / 3,948 / 4,000 and MA7/14/28 at 3,932 / 3,978 / 3,995. That makes 3,900-4,000 one thick ceiling. I'm not buying the middle of the range, and I'm not shorting a bounce off the lower band (3,788.70). I'd buy a retest of 3,770-3,790 with a stop under 3,745 and aim for 3,900-3,930 (EMA7/MA7): about 3R from 3,785. A daily close under 3,765 and I'm out. A daily close above 4,000 and the downtrend is over. $XAUTUSDT #ByXIMPACT $MNTUSDT

Arkham (ARKM) is showing signs of weakness, but its long-term potential remains interesting because of its role in blockchain intelligence and on-chain data analytics. Currently trading around $0.089, ARKM is facing bearish pressure after recently touching an all-time low near $0.082. However, the recovery from that low suggests that some buyers are beginning to show interest. 📊 Market Sentiment: Bearish in the short term, but cautiously optimistic about a potential recovery. 🐂 Bullish Outlook: A strong recovery above $0.093–$0.098 could improve market confidence and attract fresh buying interest. 🐻 Bearish Risk: Losing the $0.082 support could expose ARKM to further downside. 💡 My Take: ARKM is an interesting project with real utility in the blockchain intelligence sector. Its current weakness could attract long-term investors, but confirmation of a trend reversal is essential before becoming aggressively bullish. FINAL OUTLOOK: I'm cautiously optimistic about ARKM's recovery potential, but patience is important. Watch volume, market structure and Bitcoin's direction before making an entry. #ByXIMPACT
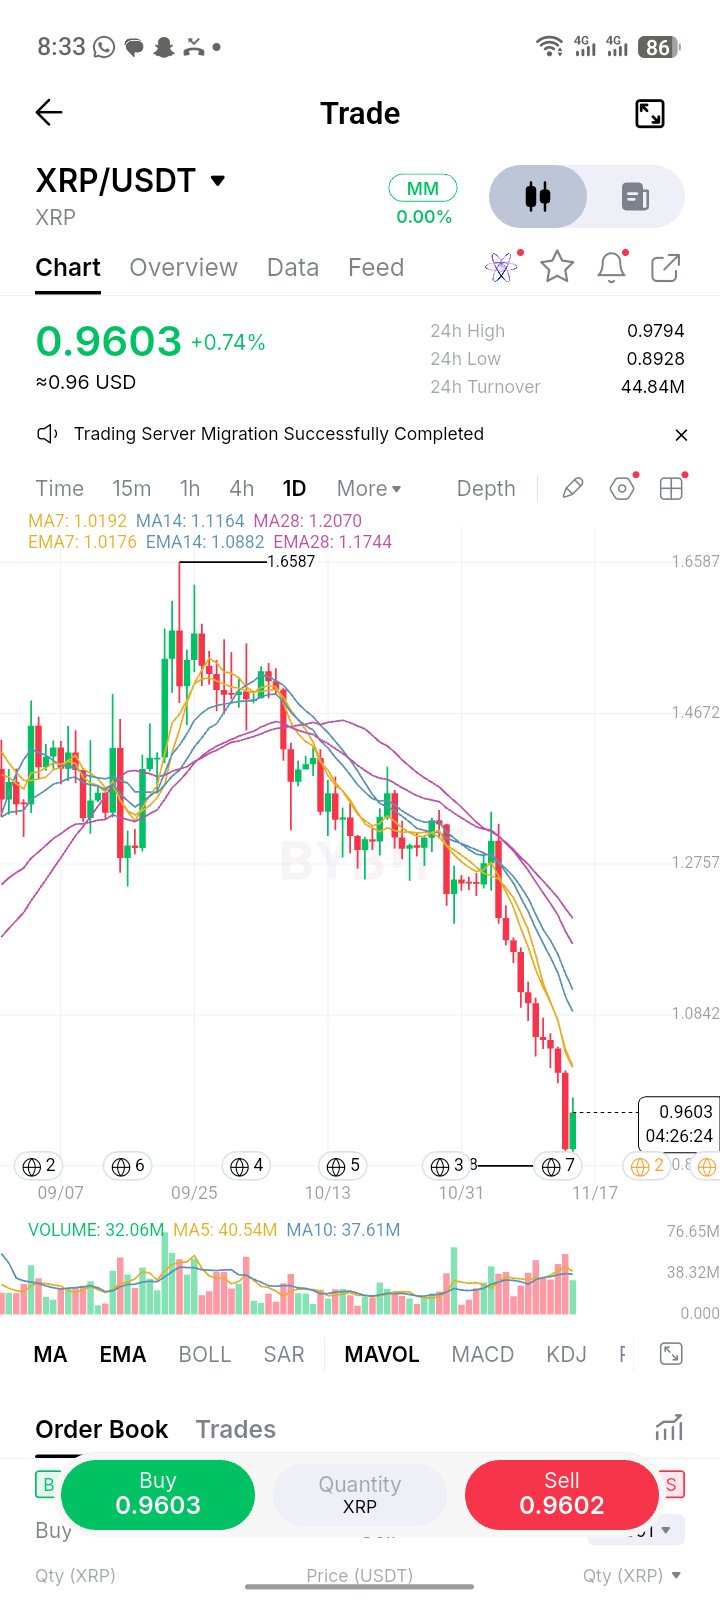
$XRPUSDT XRP is the token behind the XRP Ledger, a payments network built for fast, cheap settlement, and the asset Ripple uses for cross-border liquidity. A year ago it got what its holders had wanted for years: spot ETFs. Those funds have gathered about $1.7B since launch, but flows have stalled this month, with no net inflows at all from November 3 to 5. The price has been telling its own story. XRP is 0.9603, about 42% under the 1.6587 September high and roughly three quarters under its record. In October it lost every key level between 1.56 and 1.25, and this week it lost the one that mattered most psychologically. $1 had held after the July leverage flush, and today XRP traded as low as 0.8928. What I find interesting is how it closed the dip. After a roughly 10% red day yesterday, price flushed to 0.8928 and bought back to about 0.96, leaving a long lower wick, the same kind of forced-selling candle that showed up across the market on the Bitcoin crash. With about 4.5 hours left, volume is 32M against a 10-day average of 37.6M. Selling is still real, but it isn't accelerating. A wick isn't a reversal. Price is still about 5.8% under MA7 (1.019) and under every average, all sloping down. Now $1 has flipped from support to resistance, and it lines up with EMA7 and MA7 at 1.018 to 1.019, so 1.00 to 1.02 is the first real test. Above it: 1.088 and 1.116 (EMA14 and MA14), then 1.174 to 1.207 (EMA28 and MA28). Below, 0.8928 is the line, and the next marked level is the 0.80 round number, about 17% away. A dollar is a long way to fall and a short way to reclaim, and the market knows it. I'm watching whether XRP can close back above 1.00. $XRPUSDT #ByXIMPACT $PEPEUSDT

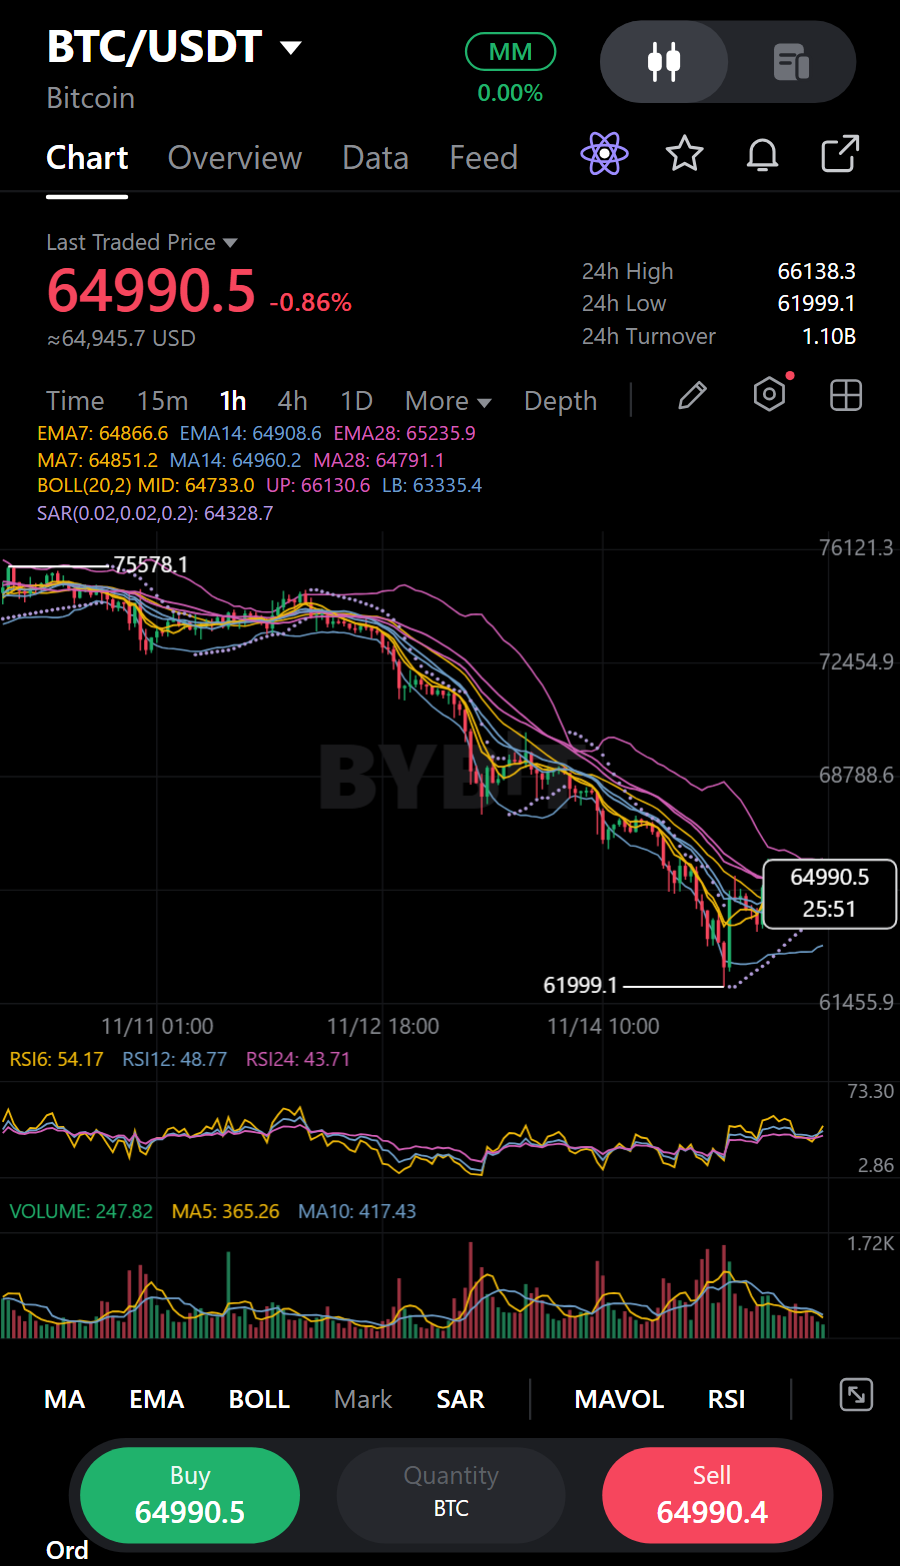
BTCUSDT: Rebound Still Leans Bearish
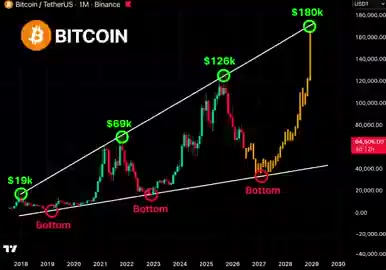
A small green candle is the latest interruption, not yet a turn: at 01:00 $BTCUSDT closed at 64,735.30 on just 0.6x the 12-candle average. Before that, the red 21:00 candle closed at 64,769.40, and red closes at 23:00 and 00:00 carried price to 64,704.60 and 64,571.60. The sequence shows sellers pressing after the rebound; the final uptick looks light on participation. Last traded price is 64,980.60, just above MA7 at 64,925.11, MA14 at 64,926.05 and MA28 at 64,818.47. That gives buyers a foothold, but these averages are close together and don’t erase the recent hourly weakness. A strategist has outlined a possible Bitcoin recovery in 2027, attributing the selloff to leverage and identifying levels that would support or invalidate that outlook. I see that as a longer-horizon counterpoint, not a near-term trigger for BTCUSDT. For this setup, buyers still need to demonstrate follow-through around the moving-average cluster; one low-volume green candle hasn’t done that yet. The market evidence keeps my immediate bias bearish: BTCUSDT is down 1.03% in the 24h ticker window, and traded volume is about 1.26x the preceding day. More activity alongside a decline doesn’t prove sellers will stay in control, but it agrees with the short setup more than with a confirmed recovery. I’d want to see the hourly candles build above the averages before changing that read. For a short, I’d watch 64,773.64 - 65,187.56 for a stall rather than chase weakness. The idea is wrong above the 66,222.36 Stop Loss. From the Entry Zone midpoint, TP1 at 63,945.80 gives about 0.8 to 1, and TP2 at 62,911.00 gives about 1.7 to 1. The first target offers limited room relative to the risk, so I’d be selective; fast swings and hourly wicks can still sweep an entry or stop before direction is clear. Trade Plan (SHORT / Bearish): • Support: 61,999.10 / 61,999.10 | Resistance: 66,138.30 / 74,822.90 • Entry Zone: 64,773.64 - 65,187.56 • Stop Loss (SL): 66,222.36 • Targets: TP1 63,945.80 | TP2 62,911.00 When price briefly reclaims the moving averages on light volume, what would convince you the bounce is real? Just my read, not advice.#IMPACTbyTrade


ETH ؟؟!!
$ETHUSDT أشياء تستحق الوقوف عندها في إيثيريوم! هناك مؤشرات لا يمكن تجاهلها: • أربع جولات بيع من محفظة مرتبطة بمؤسسة إيثيريوم. • نحو 696 مليون دولار صافي تدفقات خارجة من صناديق ETH خلال نوفمبر. • هبوط تجاوز 20% تقريباً خلال موجة التراجع الأخيرة. السؤال هنا: هل نحن أمام تصحيح قاسٍ وتصفية مراكز مبالغ فيها، أم أن المؤسسات تعيد تقييم مستقبل إيثيريوم؟ لا أملك دليلاً على وجود خلل أو معلومات خفية لدى كبار الملاك، لكن تزامن هذه المؤشرات يستحق المتابعة. السوق لا يخبرنا بكل شيء، لكن تدفقات الأموال غالباً ما تكشف الكثير. راقب السيولة قبل أن تطارد السعر. #WSOT2026 #WSOT أظهر تداولك بالذكاء الاصطناعي لتربح 10 USDT #ارتفاع التضخم الأمريكي وزيادة الرهانات على رفع أسعار الفائدة


Aslm ALHAMDULILLAH ALHAMDULILLAH ALHAMDULILLAH night trade

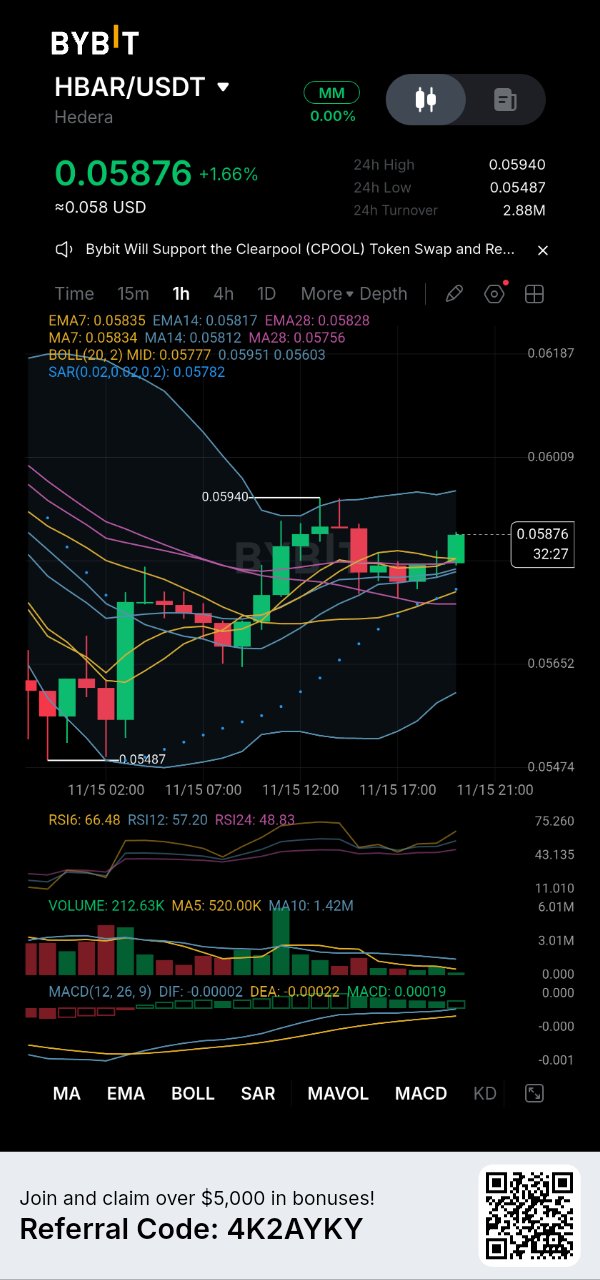
HBAR is methodically reclaiming lost ground, and I am keeping a tight leash on my active trade. The bears tried to dictate the narrative, but the buyers have firmly taken back the wheel. Looking at this 1-hour chart, the price defended the 0.05487 trench and is now driving upward to 0.05876. It is currently pressing against the moving average ribbon, testing the immediate ceiling. Here is my technical reality check: The Power: The MACD has just printed a fresh bullish cross, and the SAR dots are anchored below at 0.05782. The momentum has clearly swung in favor of the bulls. The Danger: The RSI is climbing at 66.48, and the price is staring down the upper Bollinger Band at 0.05951. Furthermore, the local high of 0.05940 is acting as a stubborn lid. A brief pause is expected before breaking through. The Foundation: The EMA cluster (0.05817 - 0.05835) is providing a solid, unyielding cushion, preventing any structural collapse. My Execution Strategy and Risk Management: I am avoiding the urge to chase the momentum here. My Plan for Existing Positions: Since my entry is already locked in from the lower base, I am sitting comfortably in the green. Treating this exact consolidation as the structural floor means buying now is buying the bottom. I am actively managing my winner to hold my ground and ride the continuation. My Ironclad Stop Loss: I have mapped a strict exit trigger just beneath the absolute swing low at 0.05400. If sellers drag the price below this threshold, the setup is void, and I cut the position instantly. No hesitation, just pure discipline. My Target: A decisive breakthrough above the recent 0.05940 peak to unlock further price discovery. I am trading the structure, safeguarding my capital, and letting the market play out. Are you managing your HBAR position through this setup with me? $HBARUSDT $INITUSDT #ByXIMPACT


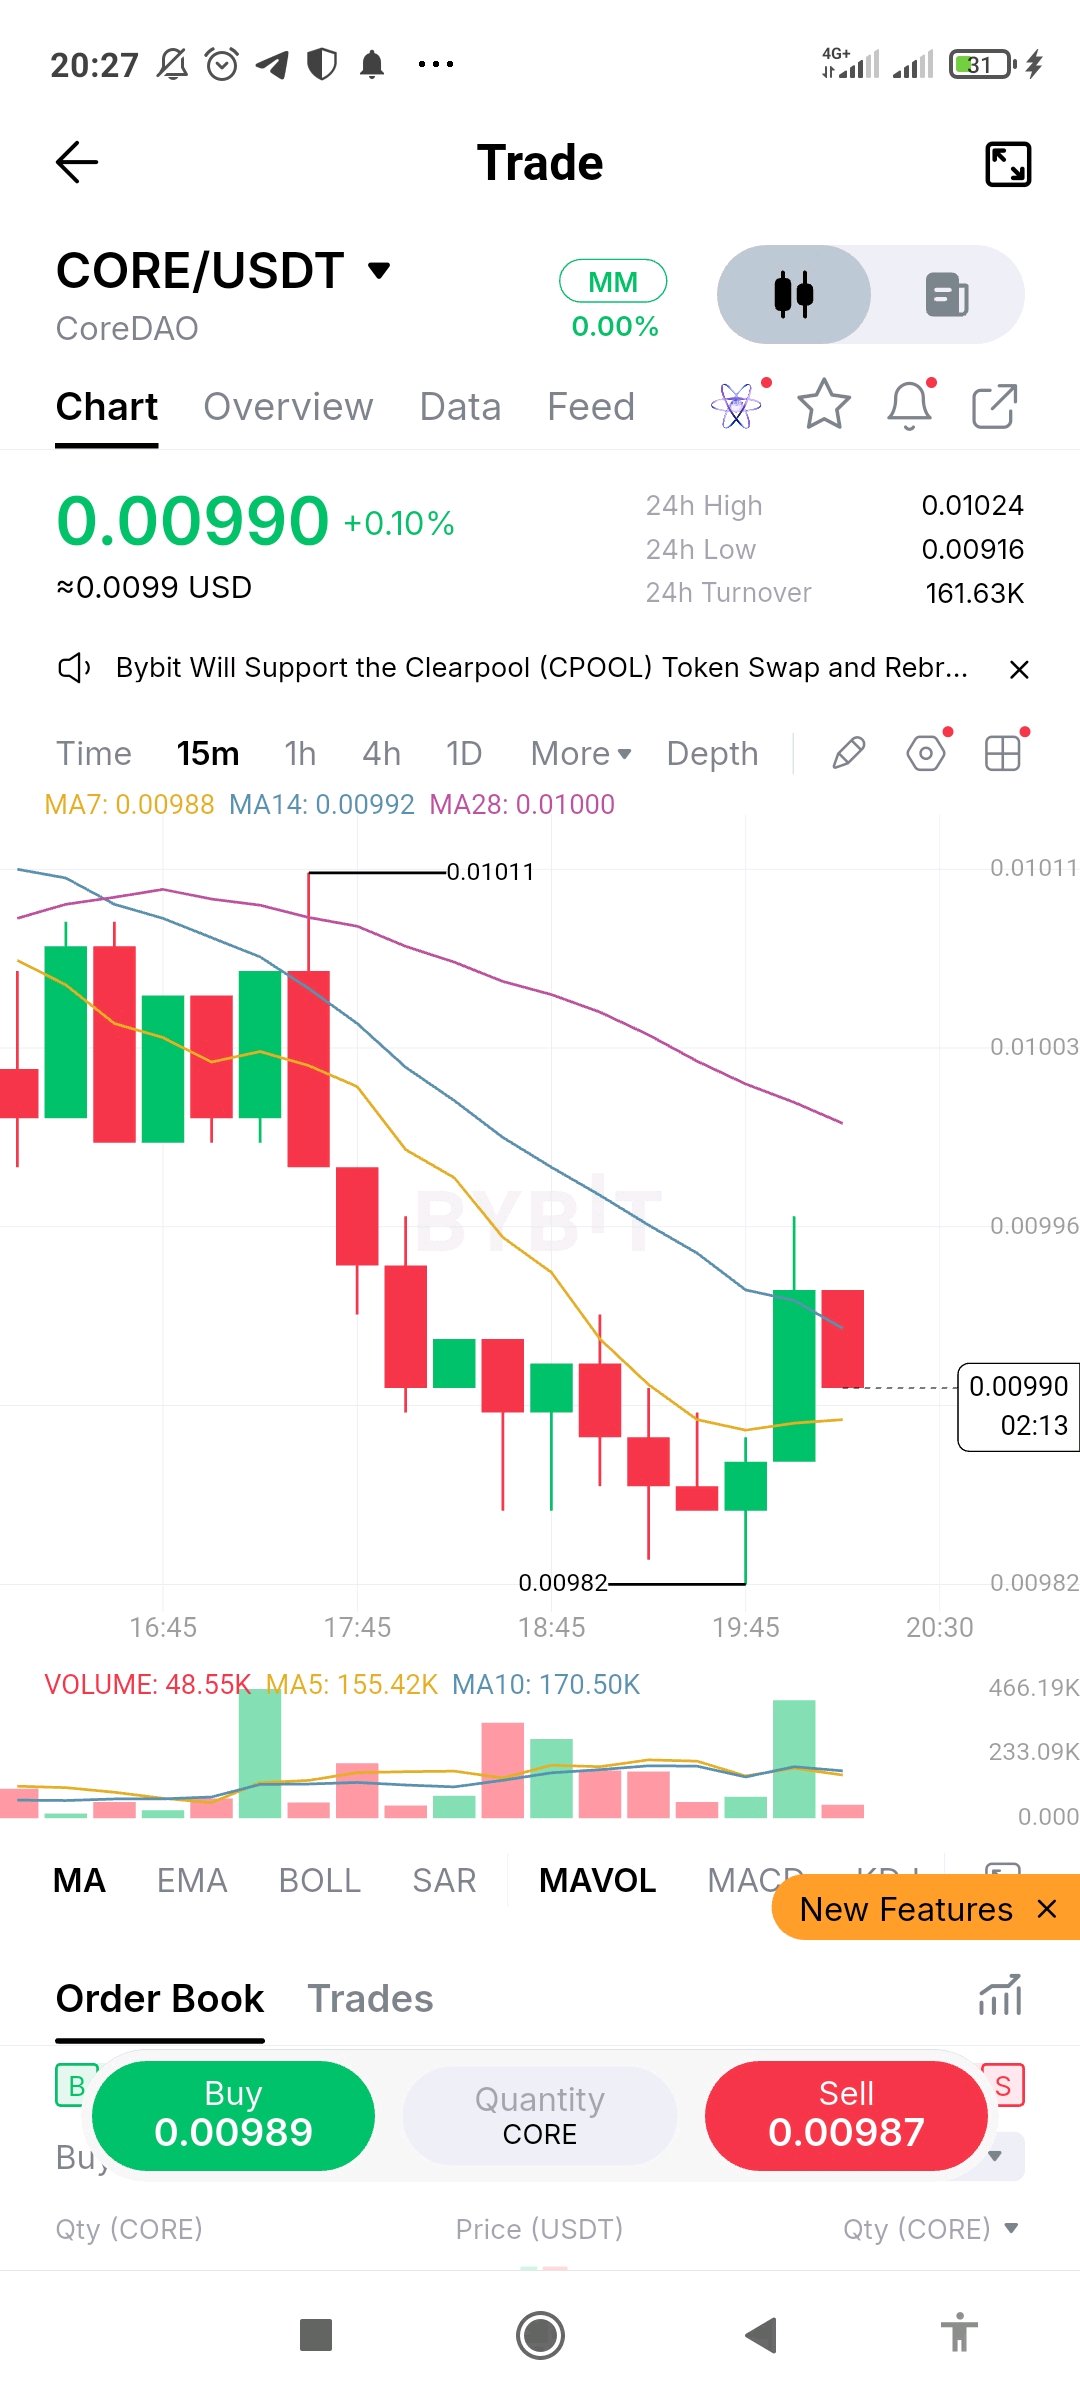
$COREUSDT is at 0.00990 on the 15m chart, up just 0.1% on the day, but the short-term trend is down. Price slid from the 0.01011 area to a low of 0.00982, bounced with one strong green candle, then printed a red candle right under the falling moving averages. MA7 (0.00988), MA14 (0.00992) and MA28 (0.01000) are stacked in bearish order and sloping down. The 0.00982 low is the level to watch. A break below it would show sellers still in control, while a close back above MA14 near 0.00992 would be the first sign the bounce has legs. Volume spiked on the bounce candle but faded on the red candle after it, so buyers have not followed through yet. Nothing here is confirmed. Lesson: a flat daily percentage can hide a chart that keeps making lower highs. A single green candle inside a downtrend is a bounce attempt, not a reversal, so wait for a higher low and keep your size small. #IMPACTbyTrade $COREUSDT $BTCUSDT

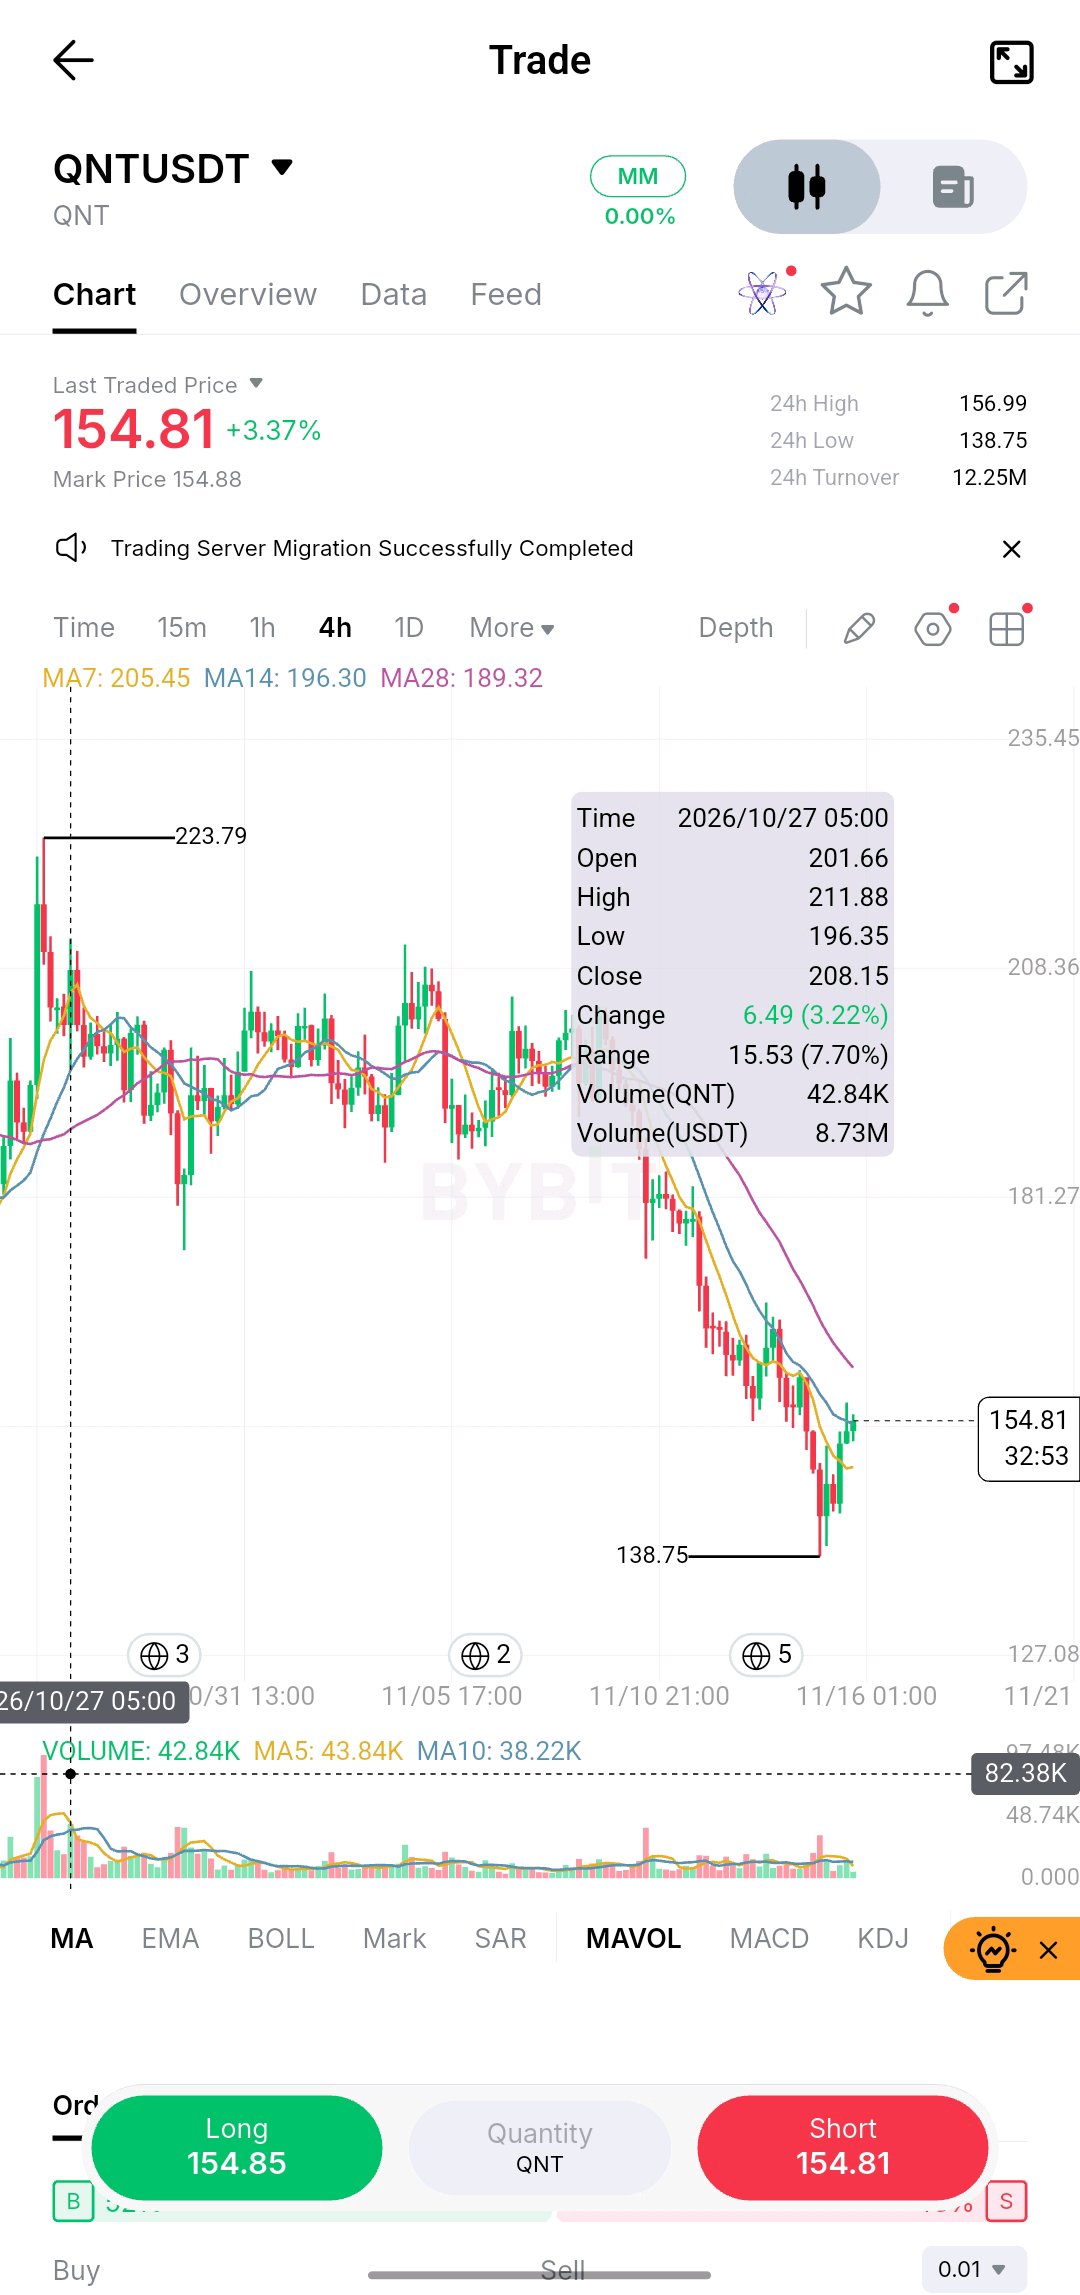
$QNT IS GETTING CLOSER TO THE BANKING SYSTEM. BUT IS THAT PROGRESS TRANSLATING INTO TOKEN DEMAND? Quant is building something that deserves attention beyond crypto-market speculation: infrastructure designed to connect traditional financial systems with multiple blockchains. And in 2026, that proposition has moved beyond conference presentations. In September, seven major UK banks participating in the Great British Tokenised Deposit initiative completed their first live customer transactions using tokenised sterling deposits on infrastructure built by Quant. The transactions included remortgage completions and a marketplace payment released when agreed conditions were met. On the same day, The Clearing House selected Quant to provide the interoperability and transaction-management layer for its US On-Chain Money Initiative, connecting tokenised deposit transactions with existing payment infrastructure, including RTP and CHIPS. The network is expected to become available to participating institutions in the first half of 2027. These are meaningful commercial developments. But there is an important distinction between a company winning institutional infrastructure contracts and its token capturing the economic value of that adoption. That is where QNT deserves closer examination. Quant's Fusion Rollup went live on mainnet in June, connecting 74 blockchain networks. QNT has documented utility across Overledger licensing, Fusion Rollup gas and trusted-node staking. Its fixed supply of 14,612,493 also makes the supply structure relatively straightforward. However, Overledger subscriptions can also be paid in US dollars. QNT is not a shareholder claim on Quant's business revenue, nor does it confer governance rights. Consequently, more institutional activity does not automatically mean proportional buying pressure on the token. I think this is the most important question surrounding QNT's investment thesis: how much actual usage will translate into recurring token demand? The chart is currently telling a much less optimistic short-term story. On the Bybit 4H snapshot, QNT is trading at $154.81, recovering 3.37% after falling to $138.75. The previous marked high was $223.79. That is a substantial correction, and the current rebound has not yet repaired the structure. Price remains below MA7 at $205.45, MA14 at $196.30 and MA28 at $189.32. The $189–$196 region is therefore an important overhead recovery zone, while $156.99 is the immediate breakout reference. Volume is also worth watching. Current volume reads 42.84K QNT, slightly below MA5 at 43.84K but above MA10 at 38.22K. Participation has improved relative to the ten-period average, but there is not yet enough evidence to call this a confirmed accumulation phase. My approach is to separate the long-term business opportunity from the immediate trading setup. If QNT clears $156.99 and sustains the recovery, buyers can begin working toward the higher resistance levels. A reclaim of $189–$196 would represent a much more meaningful improvement in the 4H structure. If the rebound fails and price loses the recovery region, $138.75 remains the critical downside reference. I am interested in Quant's institutional progress, but I would not value QNT solely on the number of banks using its infrastructure. The next stage of this story needs measurable network activity, recurring commercial usage and clearer evidence of how that activity flows through to the token. Quant may be solving an important problem for traditional finance. The investment question is whether QNT becomes an equally important part of the economic solution. #QNTUSDT #QuantNetwork #Tokenization #ByXIMPACT$QNTUSDT #ByXIMPACT

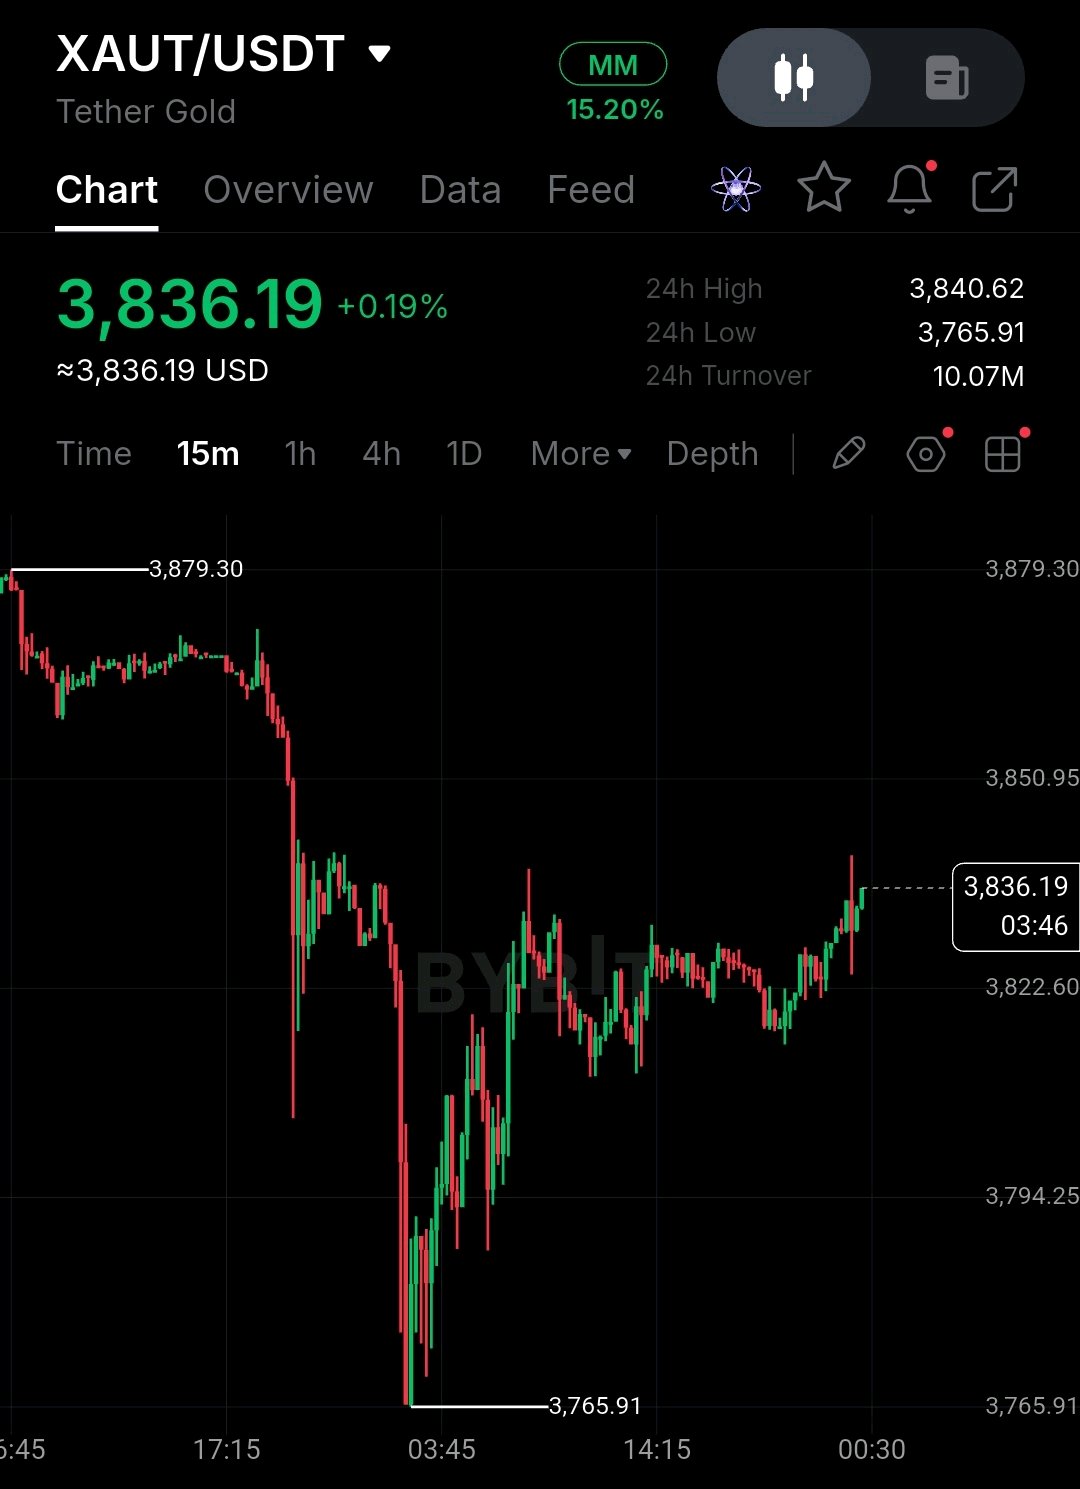
$XAUTUSDT — A bounce off a fresh low is not the same as a trend change. That's the detail I'm paying attention to. Look at the 4H structure. XAUT fell from the $4,185.95 high through late October, bounced to the $4,080 area in early November, and that bounce failed at a lower high. The earlier $3,805.00 low has held so far, but price has made a fresh low at $3,765.91 below it. It is now at about $3,836, up roughly 0.2% on the day. The $3,870.92 level on the 4H is overhead, and the larger structure remains firmly bearish. I'm not calling a bottom just because the day is flat. On the 15m chart, the 24h range is $3,765.91 to $3,840.62. Price drifted down from $3,879.30, then dropped sharply through $3,850.95 and $3,822.60 into $3,765.91 and recovered in a sharp V back above $3,822.60. Since then it has chopped between roughly $3,815 and $3,840, with a rejection wick near $3,855 and a push up to $3,836. That is a higher low after the sweep, which is constructive, but price is still below $3,850.95 and has not made a higher high. It's a relief bounce inside a downtrend, not a breakout. The 30 minute fund flow leans bearish. Inflow is about 19.75 XAUT against 25.20 XAUT outflow, a net outflow of roughly 5.5 XAUT. Large orders favor sellers (15.26 in vs 21.69 out). The absolute size is small, so a few orders can distort it. It's one 30 minute window, so it's a clue, not confirmation. What I actually want is price holding above $3,822.60, then a convincing close above $3,850.95, then above $3,870.92, followed by a higher low that holds. That would tell me the sweep was absorbed and the bounce has structure, not just a squeeze. If buyers build that structure, $3,879.30 and then $3,975.93 on the 4H become worth reassessing. Those are potential destinations, not confirmed targets. Risk Management For now, $3,822.60 is the first level buyers need to keep, with $3,794.25 below it, and $3,765.91 central to my outlook. A close back below $3,794.25 would weaken the higher-low idea, and a 4H close below $3,765.91 would confirm continuation. Since there is no visible support beneath it on these charts, I'd treat that as open space instead of guessing a level. I haven't identified a confirmed long entry. Buying a bounce under resistance with bearish flow, inside a 4H downtrend, gives little edge, so I'd rather wait for a reclaim of $3,850.95 and a retest before defining an entry and protective stop. Without those values, quoting a risk-to-reward ratio would be misleading. Shorting right after a swept low also carries risk, since reversals often start there. A swept low is information. A reclaim with structure is confirmation. #ByXIMPACT
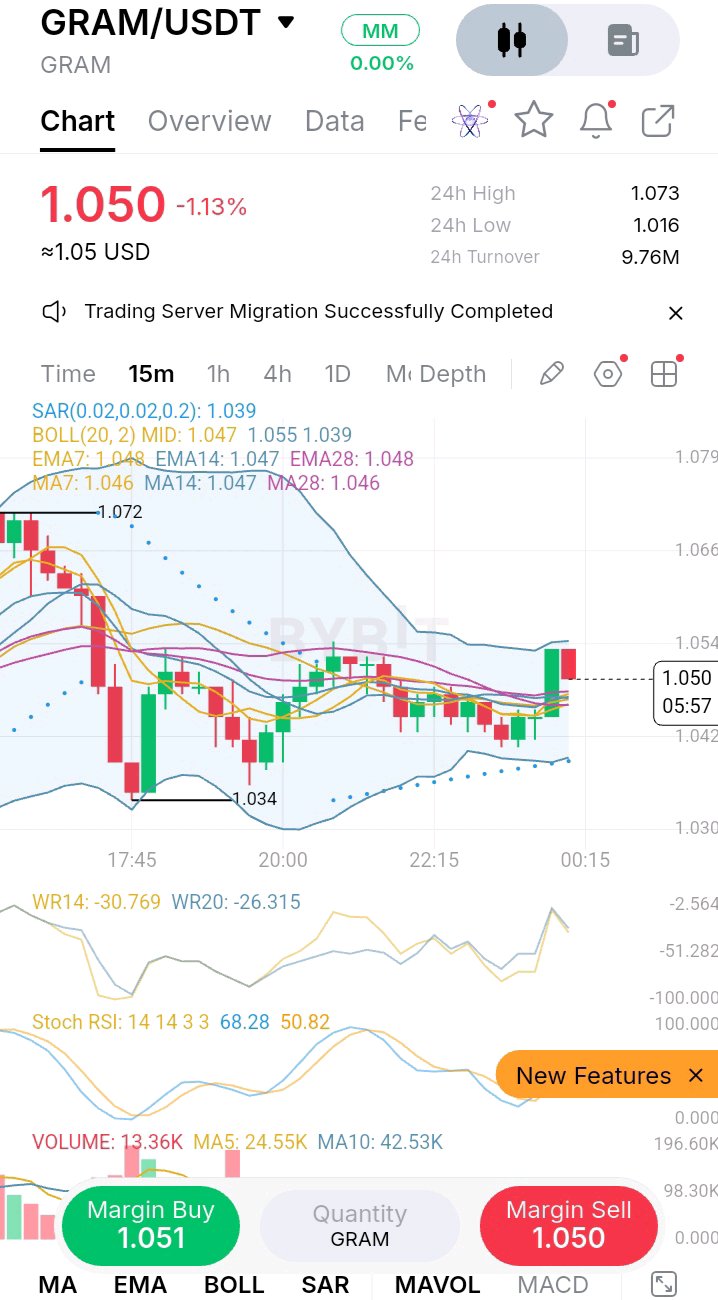
GRAM/USDT Market Analysis 15m chart
🚀 GRAM/USDT Trade Setup: The "Stealth Grind" – Pushing Through the MA Web, But a Major Volume Vacuum Looms! 🚀 The Snapshot (TL;DR) GRAM (Gram) is currently trading at $1.050** (-1.13%), staging a slow, grinding recovery after a violent flash crash to **$1.034. The price is currently sandwiched in a dense, tangled web of moving averages, fighting to push higher. However, the volume has completely flatlined, flashing a warning sign for bulls. The market is at a critical pivot point. The Battlefield: Bull vs. Bear · 🐂 The Bull Case (The Stealth Recovery): The Parabolic SAR dots have flipped below the price ($1.039), indicating a shift to short-term bullish momentum. The price is successfully holding above the tight EMA/MA cluster ($1.046 - $1.048). The Stoch RSI has crossed upward (68.28) and has plenty of room to run before hitting overbought levels. · 🐻 The Bear Case (The Heavy Ceiling): The trend is still structurally heavy after the drop from $1.072. The price is running directly into the **Upper Bollinger Band ($1.055)**, which is acting as immediate resistance. More concerning is the volume: this entire upward grind is happening on dying volume, meaning there is very little aggressive spot buying backing this move. --- 📉 The Trader's Playbook (How to Trade It) This is a "wait and see" environment. Do not buy in the middle of the moving average web. Let the price prove it can break the resistance or fail and drop. 🟢 The Long Setup (Bullish Breakout) · Trigger: A strong 15-minute candle close above the Upper Bollinger Band ($1.055) and the local structural high. · Confirmation: You must see a sudden surge in green volume. If it breaks out on this current dead volume, it's a bull trap. · Target 1: $1.065 (Psychological resistance). · Target 2: $1.073 (24H High). · Stop Loss: A strict stop just below the MA cluster at $1.045. 🔴 The Short Setup (Rejection / Breakdown) · Trigger: A rejection at the Upper Bollinger Band ($1.055) followed by a decisive break below the Bollinger Midline and MA web (**$1.047**). · Confirmation: Expanding red volume. · Target: A retest of the Parabolic SAR at $1.039**, and eventually a flush to the **$1.034 local low. · Stop Loss: Above the recent push at $1.052. --- 🎯 Key Levels to Watch (The Heatmap) · $1.073 — 24H High (The Ultimate Target) · $1.055 — Upper Bollinger Band (Immediate Breakout Line) · $1.050 — Current Price (Testing Resistance) · $1.047 — The MA Web (Bollinger Midline / Pivot / Line in the Sand) · $1.039 — Immediate Support (Parabolic SAR) · $1.034 — Local Flash-Crash Low (The Floor) · $1.016 — 24H Low (Extreme Deep Discount Zone) 💡 The Pro Trader's Edge Look at the volume indicator at the bottom. The current volume is a mere 13.36K, compared to the MA5 of 24.55K and the MA10 of 42.53K. This is a massive Volume Divergence. The price is going up, but the participation is going down. In technical analysis, this usually means the upward move is driven by a lack of sellers rather than aggressive buyers. When this happens, price can drift higher, but it is highly susceptible to a sudden snap-back. Bottom Line GRAM is putting up a fight and reclaiming its moving averages, but the lack of volume makes this a dangerous chase. Do not buy the green candles here. Set your alerts at $1.056** (Bullish Breakout) and **$1.046 (Bearish Breakdown). Wait for a high-volume candle to dictate the real direction, and protect your capital. Not financial advice. #ByXIMPACT $GRAMUSDT


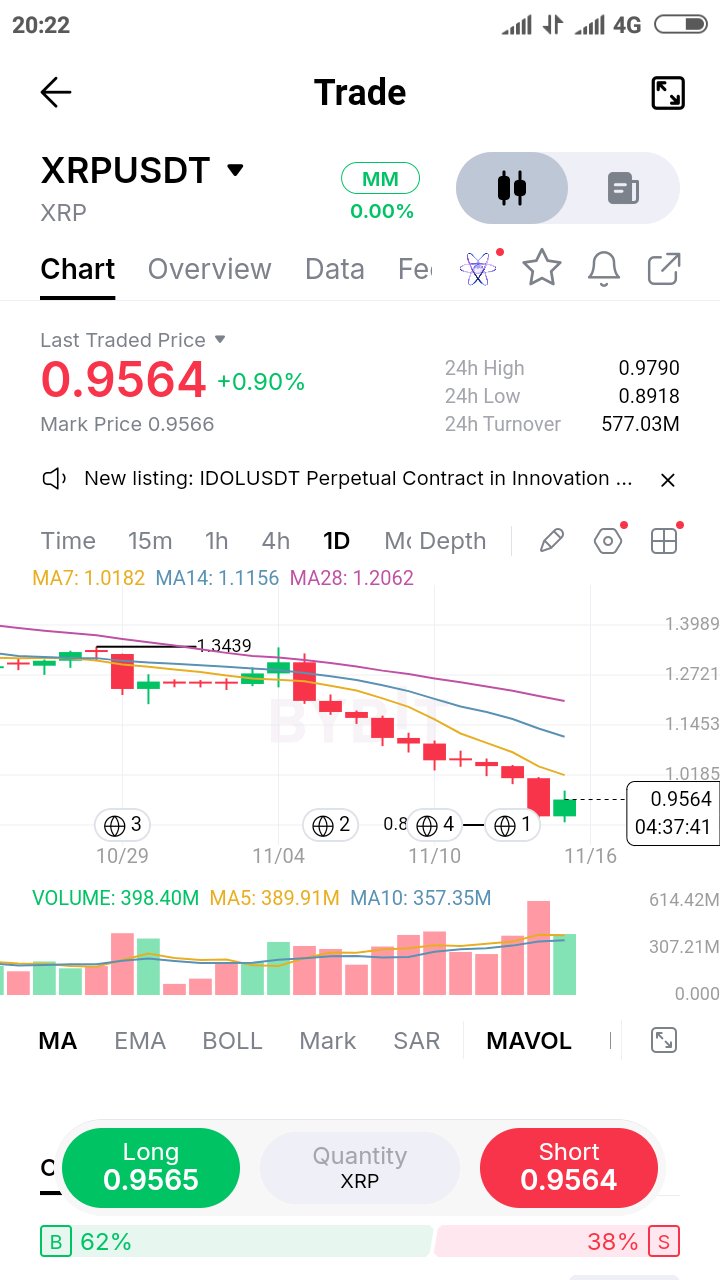
$XRPUSDT DAILY MARKET ANALYSIS Current Price: $0.9564 Market Trend: BEARISH 🔴 1. BEARISH SCENARIO 🔴 If XRP fails to reclaim the $1.0185 resistance zone, selling pressure could continue. Potential Downside Targets: - TP1: $0.9200 - TP2: $0.8918 - TP3: $0.8500 Bearish Confirmation: A strong daily candle close below $0.8918 could expose further downside. 2. BULLISH SCENARIO 🟢 If buyers regain control and break above $1.0185 with strong volume, XRP could attempt a recovery. Potential Upside Targets: - TP1: $1.0182 - TP2: $1.1156 - TP3: $1.2062 Bullish Confirmation: A strong daily candle close above $1.0185, followed by a successful retest. 3. RISK MANAGEMENT 🛡️ - Risk only 0.5–1% of your trading capital per trade. - Always use a stop-loss. - Maintain a minimum 1:2 risk-to-reward ratio. - Avoid entering trades without confirmation. - Never risk your entire capital on one position. - Avoid emotional trading and revenge trading. 4. FINAL VERDICT 🎯 XRP remains bearish on the daily timeframe despite the latest green candle. The $1.0185 resistance level is an important area to watch. Trading Preference: Wait for confirmation before considering LONG or SHORT positions. Capital protection comes first. ⚠️ Analysis based on the chart snapshot. Educational purposes only, not financial advice. $XRPUSDT #ByXIMPACT

🚨$BTC: $2.6B OF LONGS SIT BELOW 60K,🚨
more than $2.6 billion in long positions get liquidated if BTC loses 60,000, that the cascade would be unstoppable, and that this flush is where cycle bottoms form. I can't see the liquidation map, so I can't verify the $2.6B number. The idea itself is real: leveraged longs stack up near round numbers, and when price hits them, forced selling pushes it down faster. $BTCUSDT Our charts show why 60K matters. BTC tapped 61,899 on Nov 14 and bounced to about 64,770, and the weekly chart's next big support is the 57,755 summer low. That means 60K sits just above the last real floor, and a break could reach it quickly. $ETHUSDT But the claims around it need care. "I called every top and bottom for 15 years" can't be checked. "This is the only right moment to buy" is a big claim, because a liquidation flush can end in a bounce, or it can keep falling for days. Telling people to buy during a cascade is how people get liquidated themselves. The "turn notifications on" lines are engagement bait. What I'm watching: 61,899 is the floor, then 60,000. If 60K breaks, expect a fast move toward 57,755. If BTC bounces, 66,000 to 67,500 is where sellers wait. A daily close above 70,000 would be the first real sign of recovery. A liquidity pool is a magnet, not a guarantee. I'm not buying into a cascade and I'm not shorting the floor. I'd wait for 60K to either break and bounce hard, or for BTC to base above 64K. #ByXIMPACT

XAUT: Gold's Safe-Haven Bid Is Under Pressure
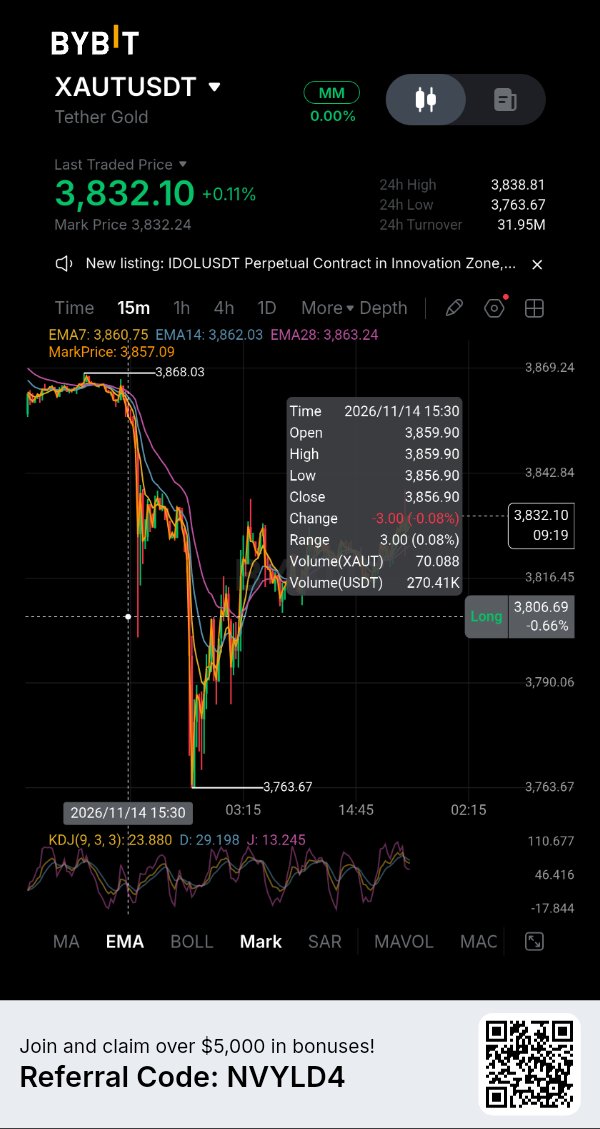
Tether Gold faces a test as investors reassess US interest rates. Spot gold closed Friday near $3,880 an ounce after falling about 4.5% for the week, its steepest weekly decline since early June. A brief recovery after softer producer inflation did little to reverse Thursday’s 3% sell-off. The pressure is coming from monetary policy. US consumer inflation and producer-price details have kept rate-hike expectations alive, while the 10-year Treasury yield has moved above 5%. Fed official Jeff Schmid said on November 15 that inflation remains above the 2% target. Higher yields raise the opportunity cost of holding gold, which pays no interest. That helps explain why geopolitical uncertainty has not protected bullion from selling. Bybit’s $XAUTUSDT perpetual was quoted near $3,823, down about 1% over 24 hours in the latest exchange-data snapshot. Its 24-hour contract volume was around $43.36 million, with funding at +0.0012% per four-hour period. Positive funding means longs are paying shorts, but the rate is modest and does not prove crowded longs. Perpetual prices can also differ from spot gold references because of trading hours, liquidity and contract pricing. There is a separate development worth watching beyond the chart. Tether’s September 30 reserve report states that 827,417.63 XAUT were in circulation, backed by the same number of fine troy ounces held in custody. That represented about 25.7 tonnes of gold. On November 11, Anchorage announced institutional custody, trading and collateral services for eligible clients holding XAUT. The expansion may improve institutional access, but it does not make every token holder eligible for direct issuer redemption or guarantee immediate cash liquidity. For now, XAUT’s direction remains tied to gold’s response to yields and the dollar. A sustained move back above $3,900 in bullion would help stabilise sentiment; another break lower would keep pressure on the token. The institutional-access story is developing, but it has not cancelled the macro risk. Key questions: 1. Can gold reclaim $3,900 while Treasury yields remain elevated? 2. Will institutional access translate into deeper, more reliable XAUT liquidity? 3. Is the current decline a correction, or the start of a longer repricing of gold? #IMPACTbyTrade


🩸 $BTC Bleeds to $62K: The 5 Macro Factors Creating a Liquidity Vacuum. (And Why CZ is Buying). Panic is in the air. **$BTC** just wicked down to a brutal $62,006, and retail traders are getting liquidated across the board. But while the crowd is panicking, Binance founder CZ just dropped a masterclass in market psychology on X. He stated clearly: "I didn't sell. I only bought; I made regular daily purchases." He even joked that his stablecoin DCA (Dollar Cost Averaging) might be the reason for the drop. As a professional Spot trader, I don't react to the red candles; I analyze the mechanics behind the move. Here is the breakdown of the 5 factors CZ highlighted and how I am trading this liquidity vacuum. 🔍 CZ’s 5-Point Breakdown of the Drop: 1. The Anthropic IPO Liquidity Drain: Investors are selling risk assets to free up cash for the massive Anthropic IPO ($64.35B offering, pricing on Nov 18th, trading Nov 19th). Capital is rotating. 2. Massive ETF Outflows: Spot Bitcoin ETFs saw 7 consecutive days of outflows totaling **$1.91 billion** (with $1.42B leaving BlackRock’s IBIT). Spot ETH ETFs lost another $592 million. 3. Security & Infrastructure FUD: The recent Binance attack, emptying iPhone-linked wallets, Chrome vulnerabilities, and Microsoft outages have shaken retail confidence. 4. Fed & Macro Pressures: High US inflation has revived fears of another rate hike. Rising bond yields and a strong dollar are actively draining liquidity from risk assets. 5. Political Uncertainty: Fears that crypto policy might tighten following the US midterm elections. 🧠 The "Smart Money" Psychology: Notice the dichotomy. While retail is selling in fear of the 5 factors above, CZ is DCA'ing with stablecoins. He explicitly stated that the crypto sector will continue to grow in the medium to long term. This is the difference between trading on emotion and trading on structural reality. 🎯 My Actionable Spot Execution Plan (Navigating the Dip): I am not catching this falling knife blindly. I am adopting CZ's mindset but using strict technical confirmation. I trade strictly Spot, meaning I have zero liquidation risk while the market finds its bottom. · The Waiting Game: I am not buying the current price. The ETF outflows and the upcoming Anthropic IPO will keep pressure on the market until at least Nov 19th. · My Accumulation Zone: I have laddered limit buy orders sitting at the deep macro support levels (the $60,000 - $61,500 zone). If the IPO liquidity drain sweeps the lows, I want to be there to catch the wick. · My First Target (TP1): $65,000 (Reclaiming the psychological level and local resistance). I will scale out a portion here. · My Hard Invalidation: If Bitcoin prints a daily close below $58,000, the macro structure is severely broken, and we are likely heading into a deeper bear cycle. I will hold my USDT and wait. 💡 Let's Build a Real Community (ByX IMPACT): Liquidity vacuums are terrifying, but they create generational entry points for Spot traders. CZ is buying the dip; the question is, are you going to panic sell, or are you going to manage your risk and scale in? Are you buying this $62K BTC dip, or waiting for the Anthropic IPO to pass before entering? Let’s discuss real Spot strategies below. 👇 $BTCUSDT $BTCUSDC #ByXIMPACT


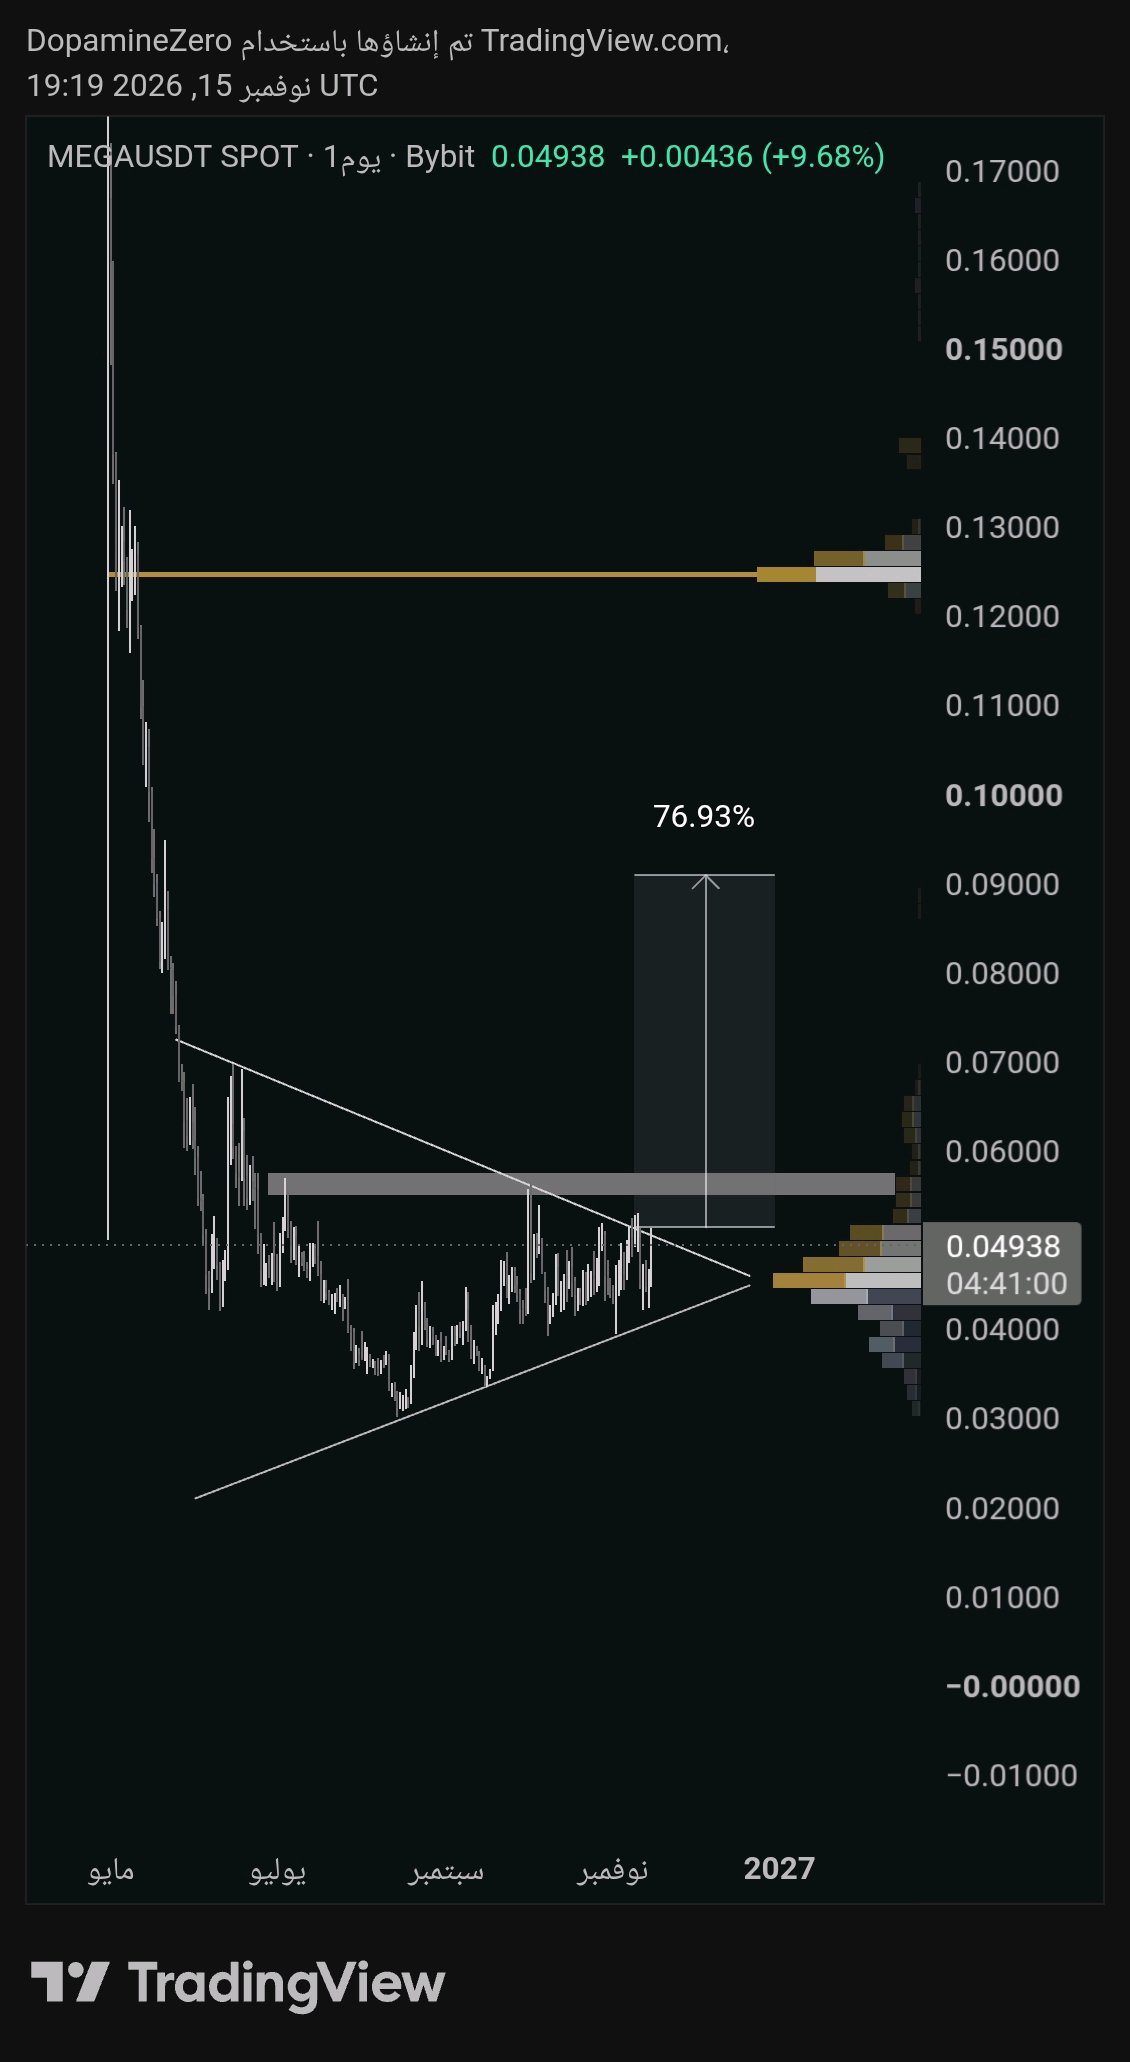
For this setup to be valid, we need a breakout above 0.053 backed by strong volume. No entry until confirmation. $MEGAUSDT #WSOT2026 #JensenHuangExitTestsNvidiasAILeadership

Market Update
Market Update $ONDOUSDT is trading near $0.304, facing bearish pressure. RSI around 30 indicates weak momentum, while MACD remains bearish. Support stands at $0.290 and $0.275. Resistance is near $0.320 and $0.335. Watch for a confirmed recovery before DCA accumulation. Manage your risk. #WSOT2026 #WSOTShowYourAITradeToEarn10USDT #JensenHuangExitTestsNvidiasAILeadership #USPPITestsTheHigherForLongerTrade #USInflationRunsHotAndRateHikeBetsRise

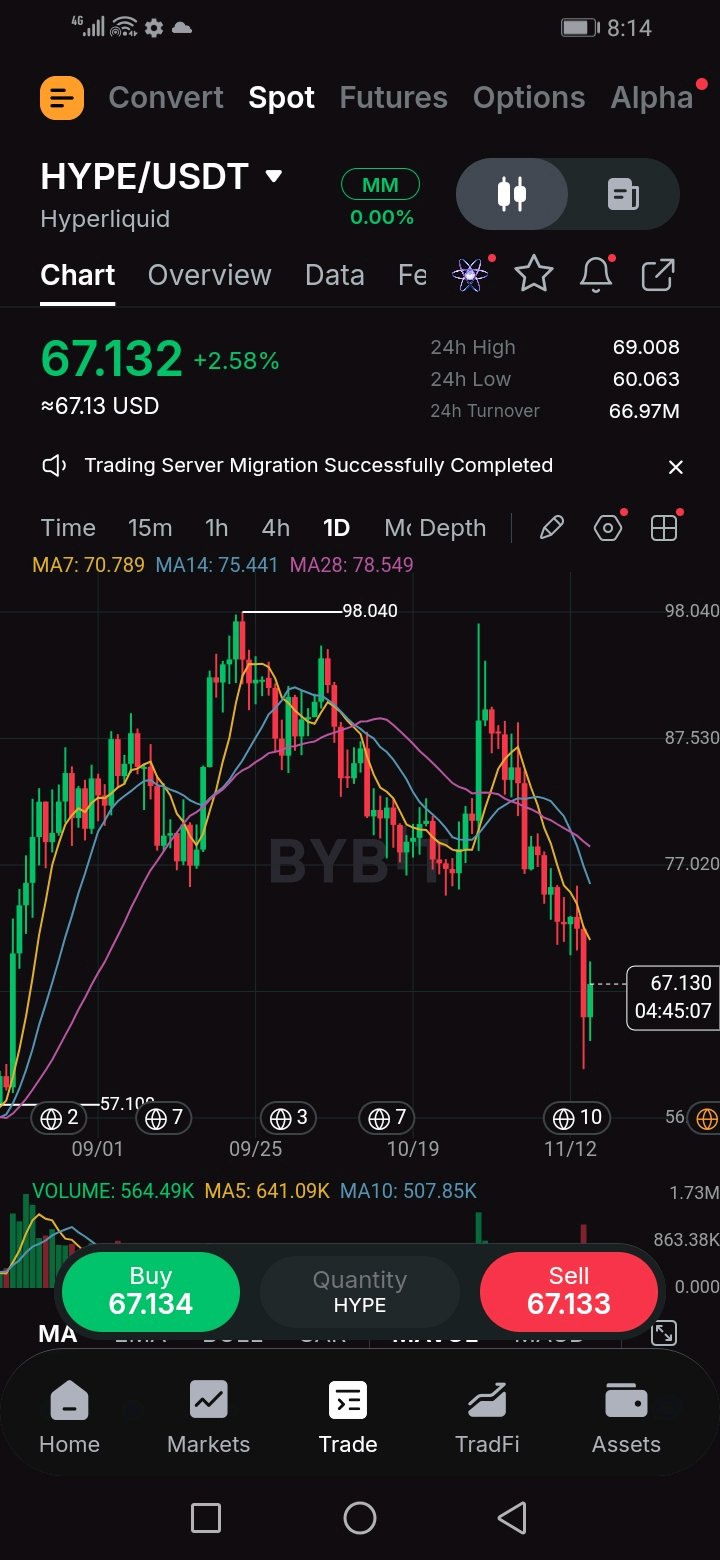
$HYPEUSDT wicked through the 0.786 on the heaviest turnover of the whole decline, then ripped 12% off the low. The next level up is the old range floor at 69, and until that's reclaimed it's only a bounce. Context HYPE is about 32% off its 98.04 high. Today it swept into the 0.786 retracement (61.18) of the 51.15 to 98.04 run, printing 60.063, about 1.8% under it, and bounced roughly 11.8% to 67.132. That's a long lower wick on a daily candle. Price is still under MA7 (70.79), MA14 (75.44) and MA28 (78.55), all falling, and just below the old 0.618 at 69.06, which was the floor of the range that broke on Friday and is now the first resistance. Turnover and volume 24h turnover is 67.0M USDT, about 1.0M HYPE, the biggest reading of this selloff, above the 52.7M and 53.9M of the previous two days. The 5-day volume average (641K) has moved above the 10-day (508K). Today's candle shows 564K with about four and three-quarter hours left. The wick came on the heaviest turnover of the whole decline, and the bounce kept the volume up. That's what capitulation tends to look like. It isn't confirmed until price takes back 69.0 on a close. Support and resistance Support: 60.06 (today's low), 61.18 (0.786), 56.50 (0.886), 51.15 (the base). Resistance: 69.01 (24h high), 69.06 (0.618), 70.79 (MA7), 74.60 (0.5), 75.44 (MA14), 78.55 (MA28), 80.13 (0.382). Level to watch Upside: 69.0-69.06. A daily close above it reclaims the old range floor and puts 74.6 in play. Downside: 60.06-61.18. A daily close under today's low opens 56.5. Trade plan Wick-low retest: buy 60.5-62.5, stop under 59.2. That's about 2.3 of risk from 61.5. Targets 69.06 and 74.6, roughly 3.3R and 5.7R. Reclaim: wait for a daily close above 69.06, buy the retest of 68.6-69.2, stop under 66.8. Targets 74.6 and 80.1, roughly 2.5R and 5.1R from 69.0. Perp traders can fade 69.0-70.8 with a stop above 71.6, aiming at 64.5, roughly 3.2R. On spot, that side means standing aside. I'm not buying 67.13 under the old floor. With a stop under 59.2, the reward to 69.06 is only about 0.25R. Invalid if Wick-low idea: a daily close under 59.2 and I stand aside, with 56.5 and the 51.15 base next. Reclaim idea: a daily close back under 66.8. Risk note HYPE has been moving 10% in a day, and it's the weekend, so thinner liquidity can exaggerate it. Today's candle is still open and can change shape before the close. Fibs are zones, not guarantees, and the levels are read off my chart. Size smaller than usual. Idea only, not financial advice. Capitulation low at 60, or a bounce into 69 that fails? #ByXIMPACT

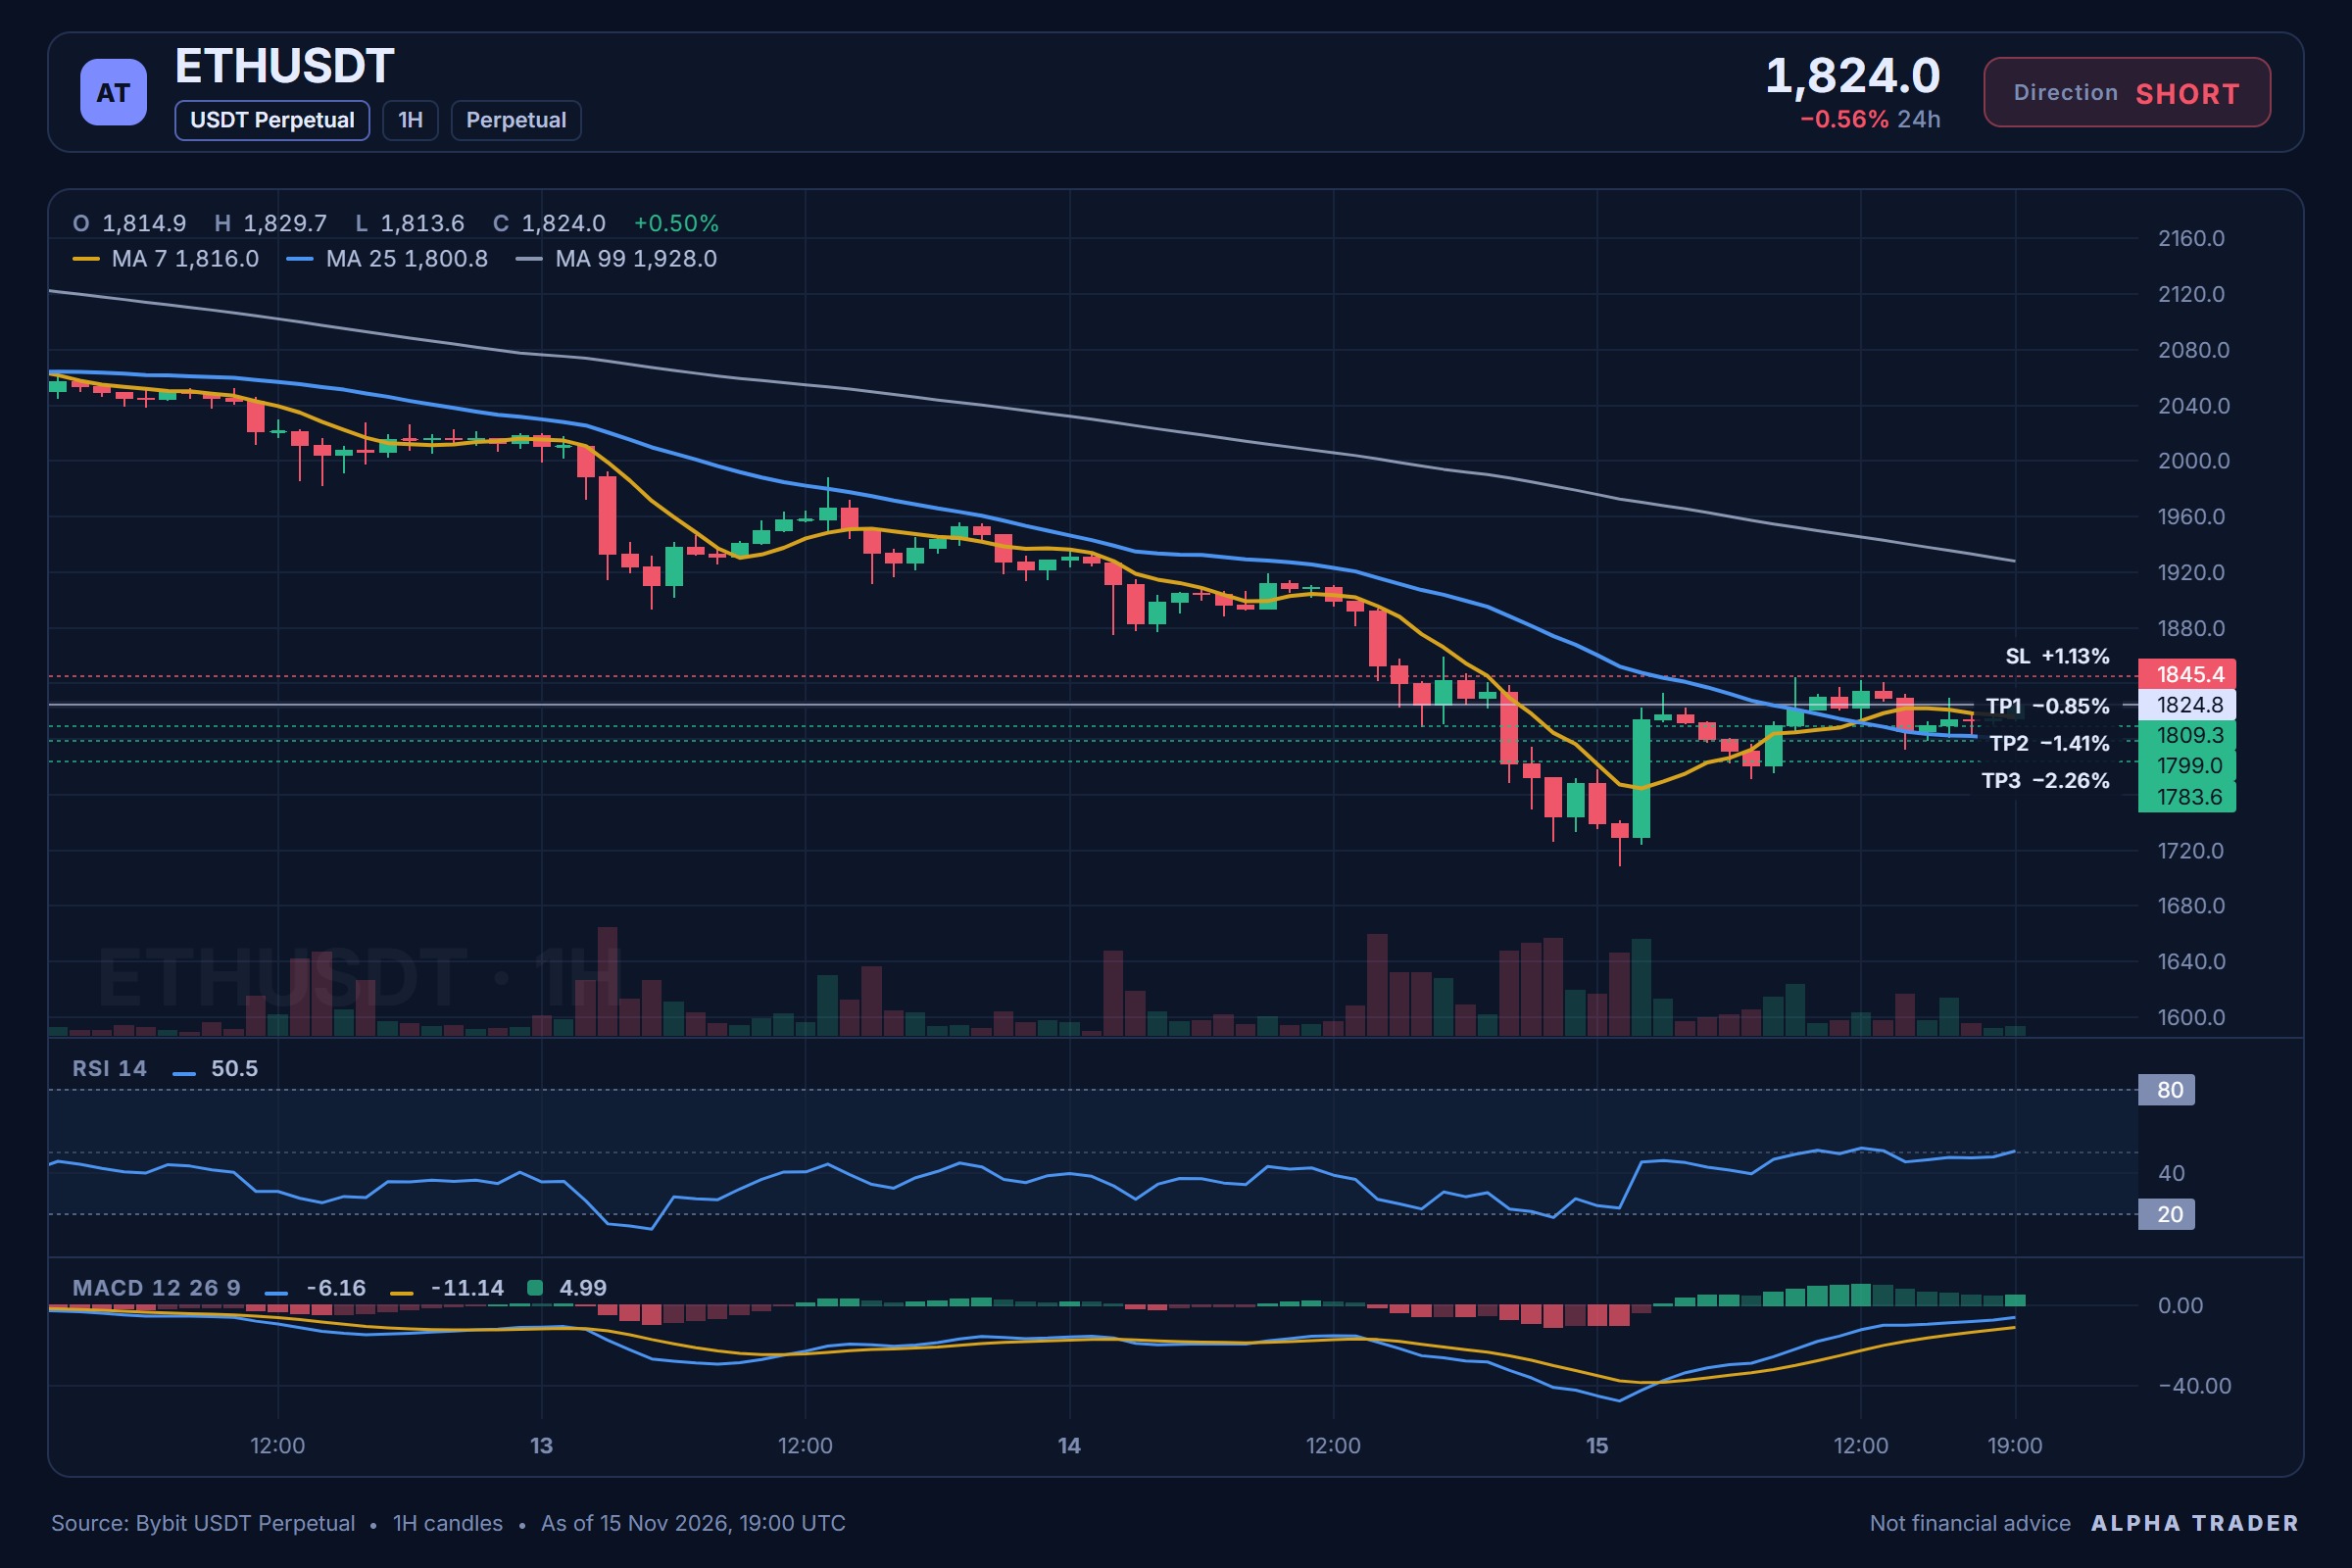
Why $ETHUSDC is hinting at a short bias while $BTCUSDC leans lower. — SHORT Entry: 1822.2 - 1827.4 SL: 1845.4 TP1: 1809.3 TP2: 1799.0 TP3: 1783.6 I am watching from the short side because the broader trend remains bearish and the 15m RSI at 58.53 still has room to roll. A move from 1824.8 toward the 1799.0 and 1783.6 zones would align with that momentum, while 1845.4 serves as the level that would invalidate the setup. If you are in this short, would you hold for TP2 or scale out near TP3? ⚠️ Personal market analysis only. NFA — manage risk and DYOR. Educational content, not investment advice or a recommendation to buy, sell, deposit, or withdraw any asset. No paid promotion or referral/affiliate links.

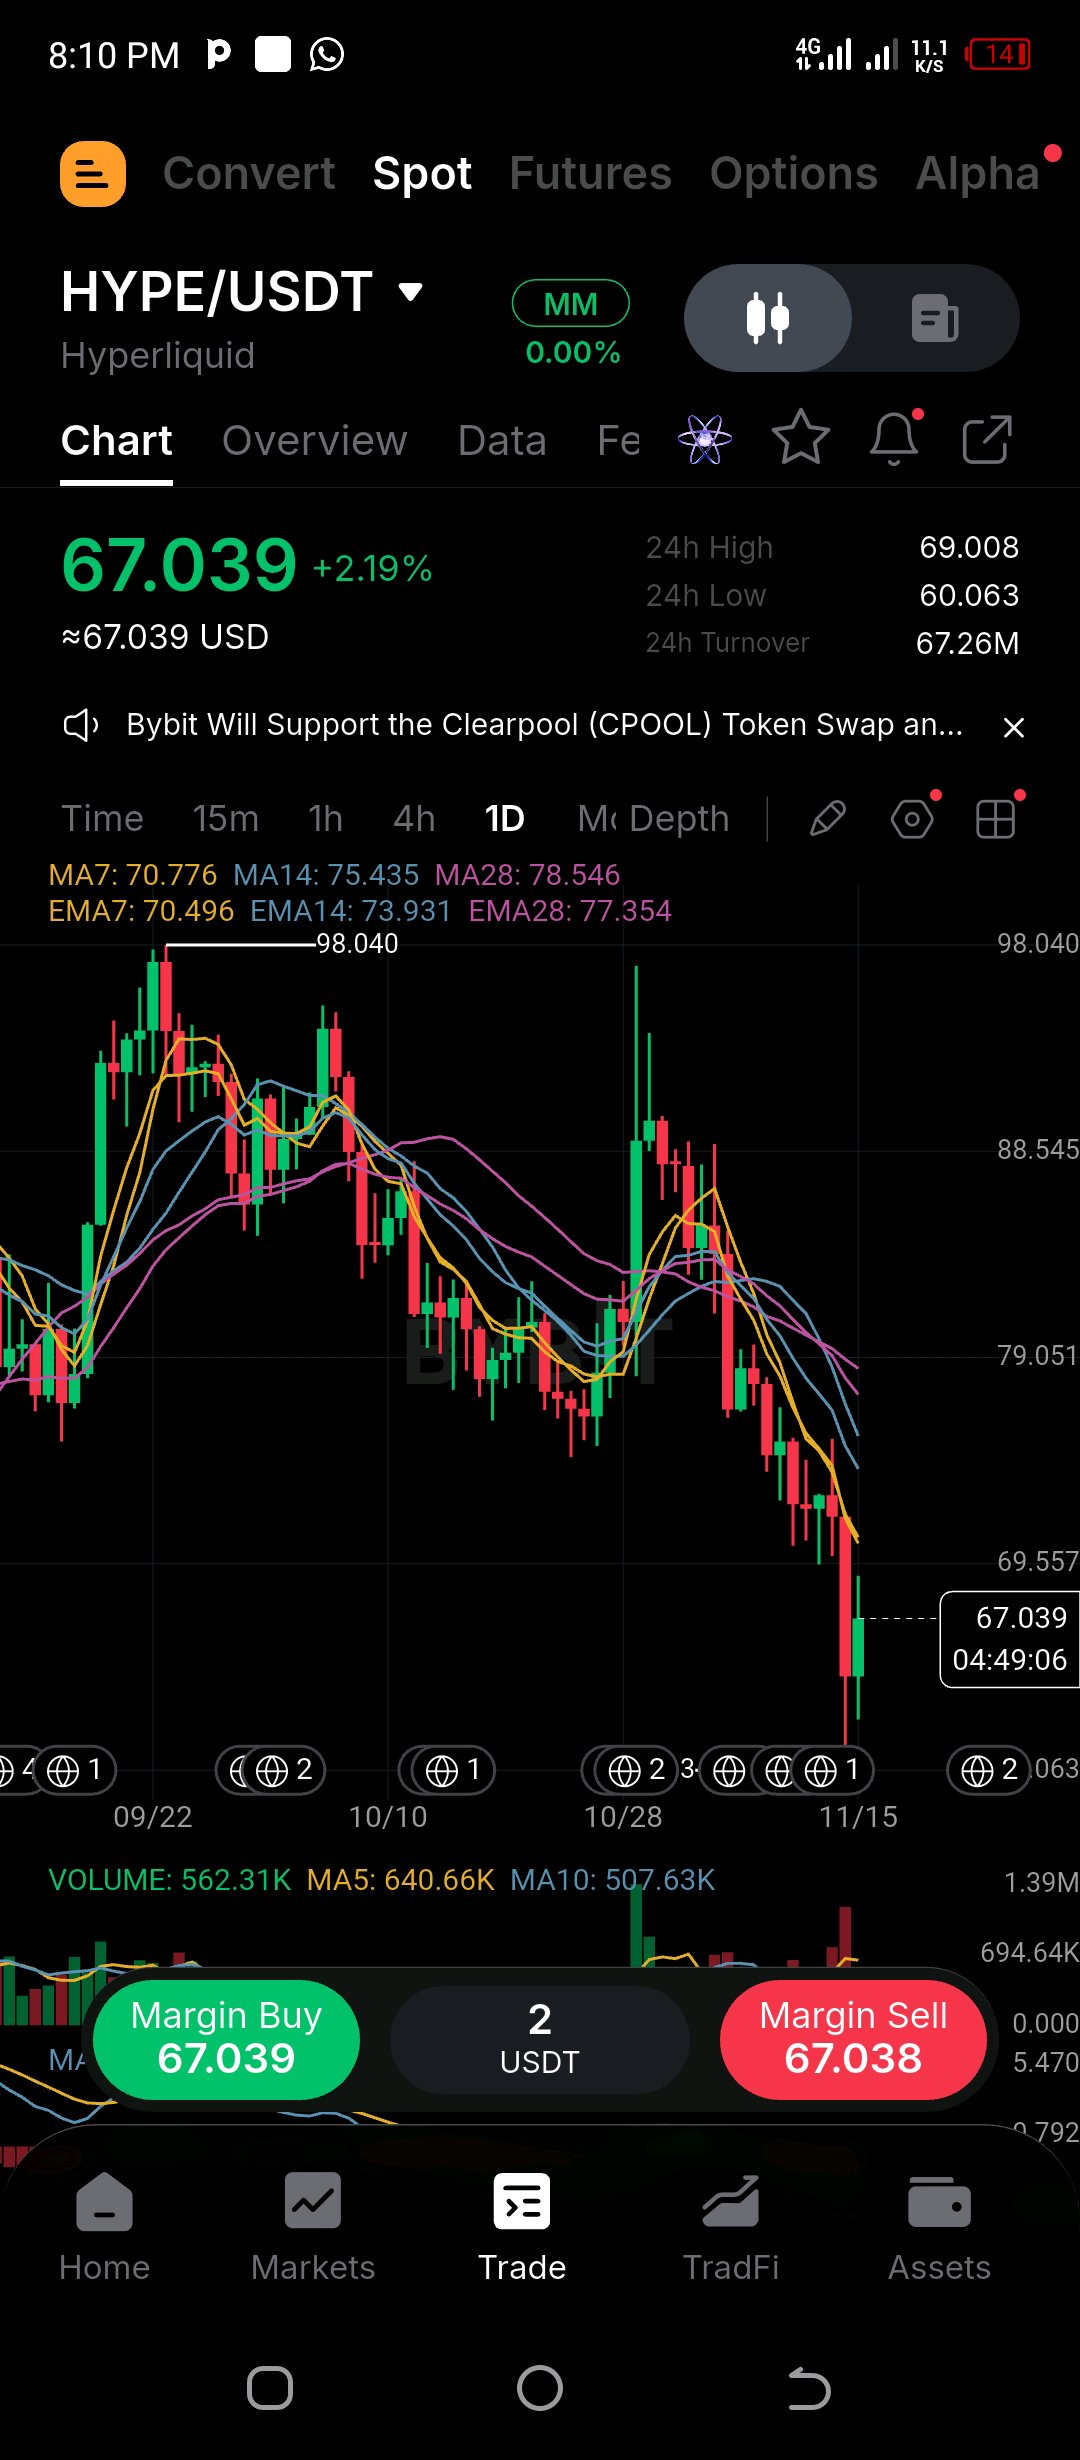
$HYPEUSDT wicked to 60.06, just above the 60 round number, swept under the 0.786 and was bought back almost 12% off the low, stalling right at the flipped 0.618 (69.06). The close in about 5 hours decides whether this is a hammer or a dead-cat bounce. Context HYPE is about 32% off the 98.04 high. Price is 67.04 (+2.2%) after a low of 60.063, the lowest on this chart, and a high of 69.008 that stopped right under the 0.618. It's under all six averages: EMA7 (70.50) and MA7 (70.78) are 5–6% overhead, then EMA14 (73.93), MA14 (75.44), EMA28 (77.35) and MA28 (78.55), all stacked in bearish order. It's a Sunday, and the daily candle has about 5 hours left. Turnover and volume 24h turnover is about 67.3M USDT, roughly 1.0M HYPE, about 1.6x the 5-day average of 641K and 2x the 10-day (508K), and up about 26% from 53.5M a day earlier. Today's volume is 562K with about 5 hours left, on pace for roughly 700K, 1.1x the 5-day average. That's the heaviest turnover this week, which is what capitulation tends to look like, though it takes a daily close and follow-through to confirm. Consideration A hammer, a long lower wick with a close near the highs, after an extended decline on peak volume is a classic exhaustion signal. It only counts if the daily close holds and the next day doesn't give it back. The 0.618 at 69.06 and the 7-day averages at 70.5–70.8 are the wall. Support and resistance Support: 61.19 (0.786), 60.06 (wick low) with the 60 round number beside it, then 51.15 (swing low). Resistance: 69.01 (24h high), 69.06 (0.618), 70.5–70.8 (EMA7, MA7), 73.9 (EMA14), 74.6 (0.5), 75.4 (MA14), 77.4–78.5 (EMA28, MA28). Level to watch 69.0–69.1 is the cap, with the 24h high and the flipped 0.618 together. A daily close above it clears the first wall. On the downside, 60.06–61.19 is the floor, and a daily close under 58.6 would give it up. Trade plan Wick retest: buy 60.1–62.0 only on a reaction (a rejection wick or a daily close back above 62.5), stop under 58.6. Targets are 69.06 and 70.8, roughly 3.4R and 4.1R from 61.0. Reclaim: wait for a daily close above 69.1, buy the retest of 68.0–69.1, stop under 66.5. Targets are 73.9 and 77.4, roughly 2.5R and 4.2R from 68.6, with 70.8 as the first place to trim. I'm not buying 67 under the 0.618. The stop belongs under 59.8, about 7 away, and the first resistance at 69.06 is only about 2 above, so it pays about a quarter of the risk. Invalid if Wick retest: a daily close under 58.6 gives up the 0.786 and the 60 round number. The next structure is the 51.15 swing low, and I'd stand aside instead of buying lower. Reclaim: a daily close back under 66.5 means it failed. Risk note HYPE ranged about 15% in the last 24 hours (60.06 to 69.01), weekend liquidity is thinner, and wicks can run through any level, so size matters more than entry. Fib levels are zones, not exact lines. Levels come from my own chart. Not financial advice. Hammer that holds, or a dead-cat bounce into the wall? The daily close and the reaction at 69 will say. #ByXIMPACT
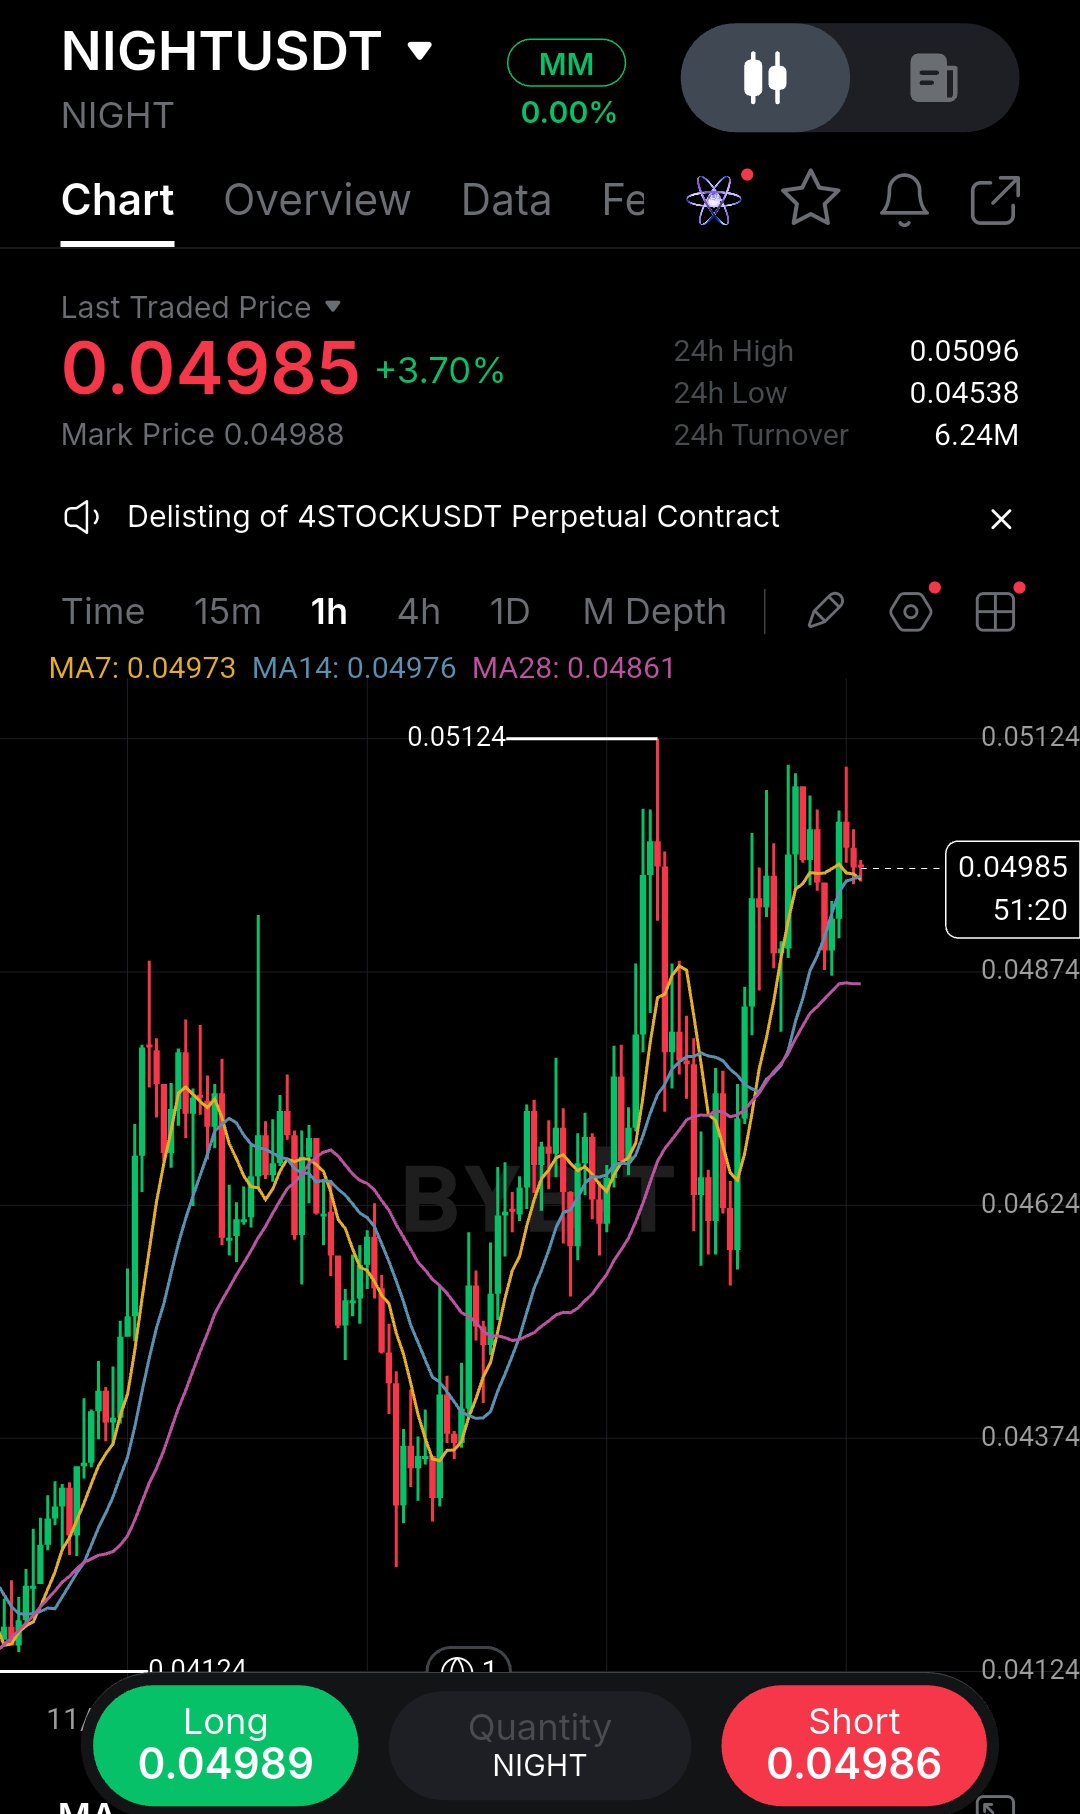
I’ve learned the hard way that buying right into a resistance cluster usually ends with me staring at a red candle, so this NIGHT 1h chart has my full attention. Price is pushing 0.04985, but it’s running directly into the 0.05124 swing high while the 7 and 14 MAs are flattening out. The real story is the 28 MA way down at 0.04861.Momentum is slowing, and buyers are losing their early drive. I’m not chasing this vertical move. Let me break down exactly what I see. The recovery from the 0.04124 low was aggressive and clean, but the rally is now stalling just beneath the previous swing high at 0.05124. That’s not a coincidence. That level was a rejection point before, and it’s likely to act as supply again. Meanwhile, the 7 MA at 0.04973 and the 14 MA at 0.04976 are curling over, which tells me short-term momentum has peaked. The 28 MA at 0.04861 is the true trend anchor, and it’s still rising, so the broader uptrend isn’t broken .it’s just overheated. This is a classic pullback setup waiting to happen, not a breakout entry. What supports the bullish case? The higher low structure is intact, the 28 MA is sloping upward, and the 24h low at 0.04538 shows buyers defended the dip aggressively. If price pulls back to the 28 MA and holds, that would be a textbook continuation setup with the trend. What supports the bearish case? The 0.05124 level is a clear rejection point, the short-term MAs are flattening, and the current candle is showing exhaustion near resistance. If buyers fail here, price could roll over and test the 28 MA as support or break through it entirely. My read is that the highest-probability trade is a long on the pullback, not a chase at current price. I’d rather wait for price to come to me, into the 0.04870–0.04900 zone where the 28 MA offers actual structural support. If we get a clear bullish rejection candle there, I’ll take the long. Entry: 0.04880 (on confirmation candle) SL: 0.04820 (below the 28 MA) TP1: 0.05050 TP2: 0.05120 Invalidation: A strong close below 0.04820 means the trend is broken and I step aside. I used to enter on the first green candle after a drop, and it taught me to let price prove itself. If it pumps without me, I accept it. Where are you watching for the retest? #ByXIMPACT #WSOT2026 $NIGHTUSDT $SPCXXUSDT

XAUT /GOLD 👉 BUY THE DIP 🚀
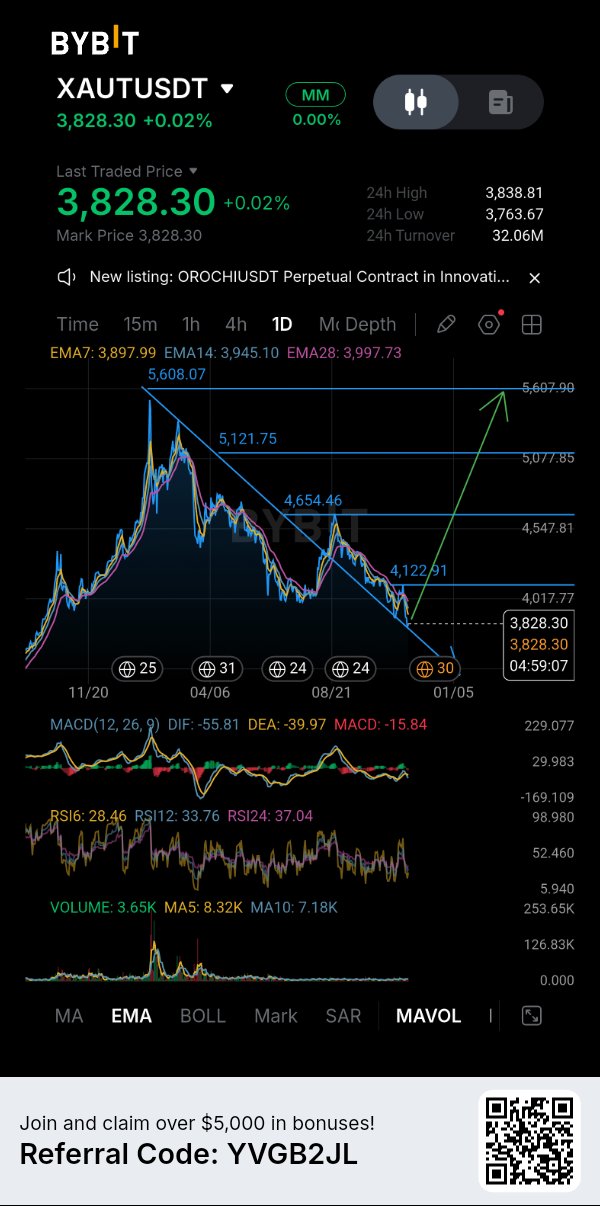
$XAUT UPDATE : GOLD IS LOSING MOMENTUM, BUT A RECOVERY COULD STILL BE ON THE TABLE. $XAUTUSDT is currently trading around $3,828, and the daily chart is showing some clear signs of weakness. The broader structure has been moving downward, with a sequence of lower highs and lower lows developing from the previous peak near $5,608. However, I don't think this is the right moment to completely dismiss a potential recovery. The price is aproaching an important short-term area, and I want to see how buyers react before making any strong directional assumption. Daily Market Structure📊 Most noticeable issue is that XAUT remains below all three visible EMAs. EMA7 is at $3,897.99, EMA14 at $3,945.10, and EMA28 at $3,997.73. This alignment tells me sellers still have the advantage, at least on the daily timeframe. descending trendline also remains an important obstacle. Until price breaks above it and establishes a stronger structure, I wouldn't consider the recovery confirmed. Momentum & Volume: RSI readings are worth watching. RSI6 is at 28.46, RSI12 at 33.76, and RSI24 at 37.04. short-term RSI is already in oversold territory, which could create room for a relief bounce. But oversold conditions alone don't guarantee a reversal. MACD is also still negative, with DIF at -55.81 and DEA at -39.97. The histogram remains below zero, suggesting bearish momentum hasn't fully disappeared. Volume is currently 3.65K, below both MA5 at 8.32K and MA10 at 7.18K. I would like to see stronger buying participation before trusting a sustained recovery. Bullish Scenario🟢 The first thing I want to see is buyers defending the recent low around $3,763.67. If that area holds and price starts reclaiming the EMA7 near $3,898, the next important recovery levels are $3,945 and $3,998. A stronger move above the EMA cluster, followed by a break of the descending trendline, would improve the daily outlook. Beyond that, $4,122.91 becomes an important higher resistance reference. Bearish Scenario🔴 If buyers fail to defend $3,763.67, another downward move becomes possible. In that situation, I wouldn't rush into buying simply because RSI is oversold. I'd rather wait for price to stabilize and show an actual change in momentum. For Traders Already Holding XAUT🎯 I'd personally pay close attention to the $3,898–$3,998 recovery zone. If price reaches this area, partial profit-taking could be worth considering depending on the entry and position size. I wouldn't assume the larger recovery projection toward $5,608 is guaranteed. That remains a possibility illustrated on the chart, not a confirmed target. Risk Management⚠️ recent low at $3,763.67 is the immediate level I'm watching. A breakdown below it would weaken the short-term recovery thesis. A bounce without confirmation is not a reliable entry. Entry, stop-loss, and risk-to-reward should be established before entering, with position sizing reflecting the risk involved. My overall view: XAUT is showing weakness, but oversold momentum could create an opportunity if buyers finaly step in. I'm more interested in confirmation than trying to catch the exact bottom. Would you consider buying a recovery above $3,898, or would you rather wait for a confirmed break of the descending trendline? #ByXIMPACT #WSOT2026 #WSOTShowYourAITradeToEarn10USDT #JensenHuangExitTestsNvidiasAILeadership #USPPITestsTheHigherForLongerTrade


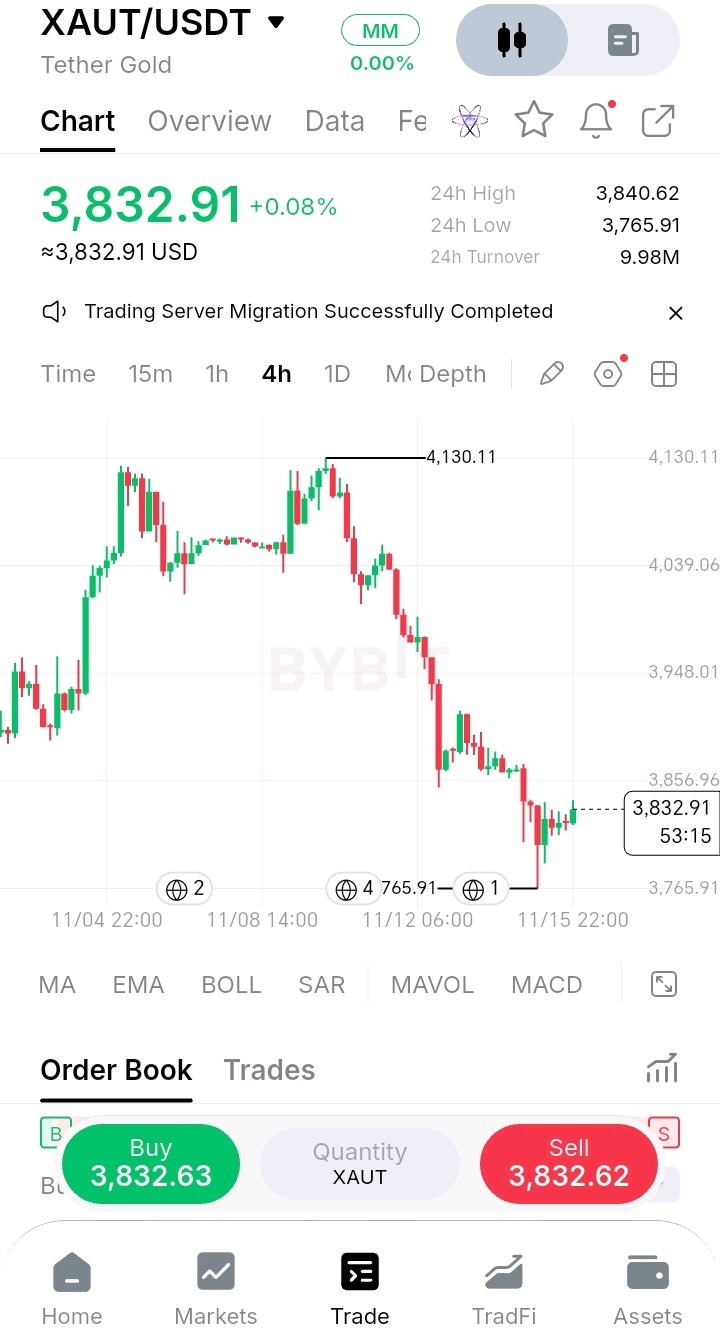
🏔️ The double top worked, and then it kept going. I don't want to call a bottom on $XAUT just because the first bounce looks tidy. I want to see a 4H close above 3,872.51, because that's the old base that is now acting as resistance. Here's what the 4H chart shows: 🔹 The double top: Gold peaked near 4,125, dipped to about 4,005, then came back and topped again at 4,130.11. Two highs at the same level with a dip between them is a classic double top. 🔹 The break: When price fell under the 4,005 neckline, the pattern was confirmed. The usual measured target from a pattern this size is roughly 3,880. 🔹 The overshoot: Gold went well past that, to a low of 3,765.91, about 8.8% under the 4,130 high. The move ran further than the textbook target. 🔹 The bounce: From the low, price has recovered about 1.8% to 3,832.91. The first bounce reached the 3,910 area, then 3,870, and the latest ones are smaller and tighter. 🔹 The old base: The 3,872.51 level from earlier is now above price. Broken support often turns into resistance on the first retest. 🔹 The range: 24H high 3,840.62 and low 3,765.91, with turnover at 9.98M. The market has calmed compared to the sell-off. 🟢 Bullish: a 4H close above 3,872.51, then 3,948. That would show buyers reclaiming the area the breakdown started from. 🔴 Bearish: a 4H close under 3,765.91, with no marked support below it on this chart. Patterns give targets, not guarantees. Once price overshoots one, the next level to read is the one it just lost. Are you watching $XAUT or another coin? #XAUT #Gold #Crypto #BinanceSquare #WSOT2026 #WSOTShowYourAITradeToEarn10USDT #JensenHuangExitTestsNvidiasAILeadership #USPPITestsTheHigherForLongerTrade #USInflationRunsHotAndRateHikeBetsRise $XAUTUSDT $BTCUSDT

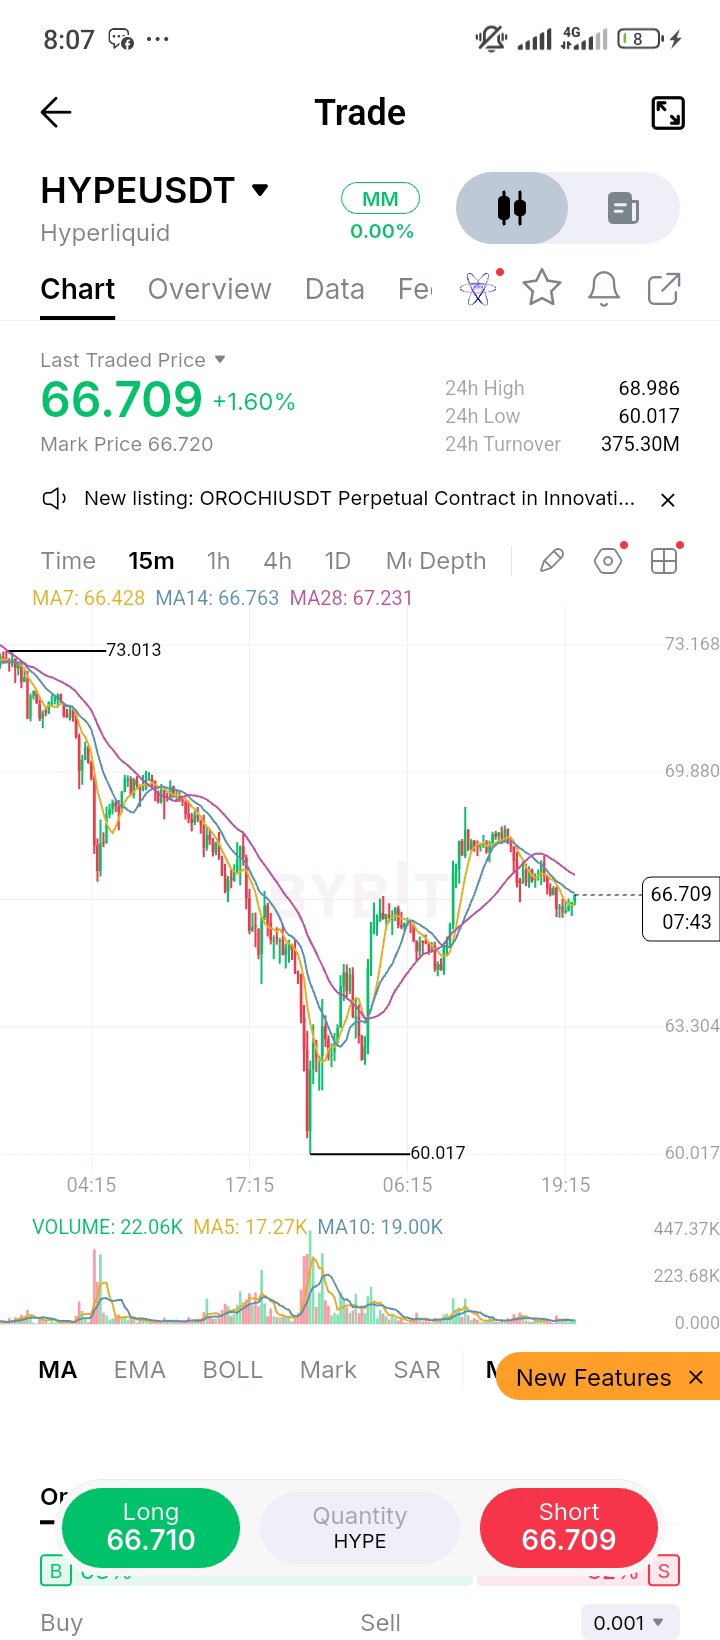
$HYPEUSDT The V-shaped bounce is losing steam. HYPE is starting to roll over, and the 15m structure is printing a clear rejection pattern. After the massive capitulation to 60.01, the recovery was strong, but it hit a brick wall right below 69.00. Look at the price action since then—we are making lower highs. Right now, price is stuck at 66.70, wedged between the 7 and 14 MAs, while the 28 MA (67.23) has flattened out above as a heavy ceiling. The volume tells the story. The aggressive green volume that fueled the bounce has completely vanished. This is turning into a bear flag. The buyers are exhausted, and the market is struggling to find any momentum to push back toward the highs. The Play: I am watching this MA cluster closely for a breakdown. The Short Trigger: A clean 15m close below 66.40. If we lose the 7 MA support, the trapdoor opens for a retest of the mid-60s, with a target of 64.00. The Bull Trigger: Bulls need a sudden volume injection to push us above 67.30 and reclaim the 28 MA. Invalidation: A high-volume spike that completely engulfs the current red candles. The market tried to recover, failed the test at 69, and is now looking heavy. Are you shorting this rollover, or holding out hope for another leg up?#ByXIMPACT

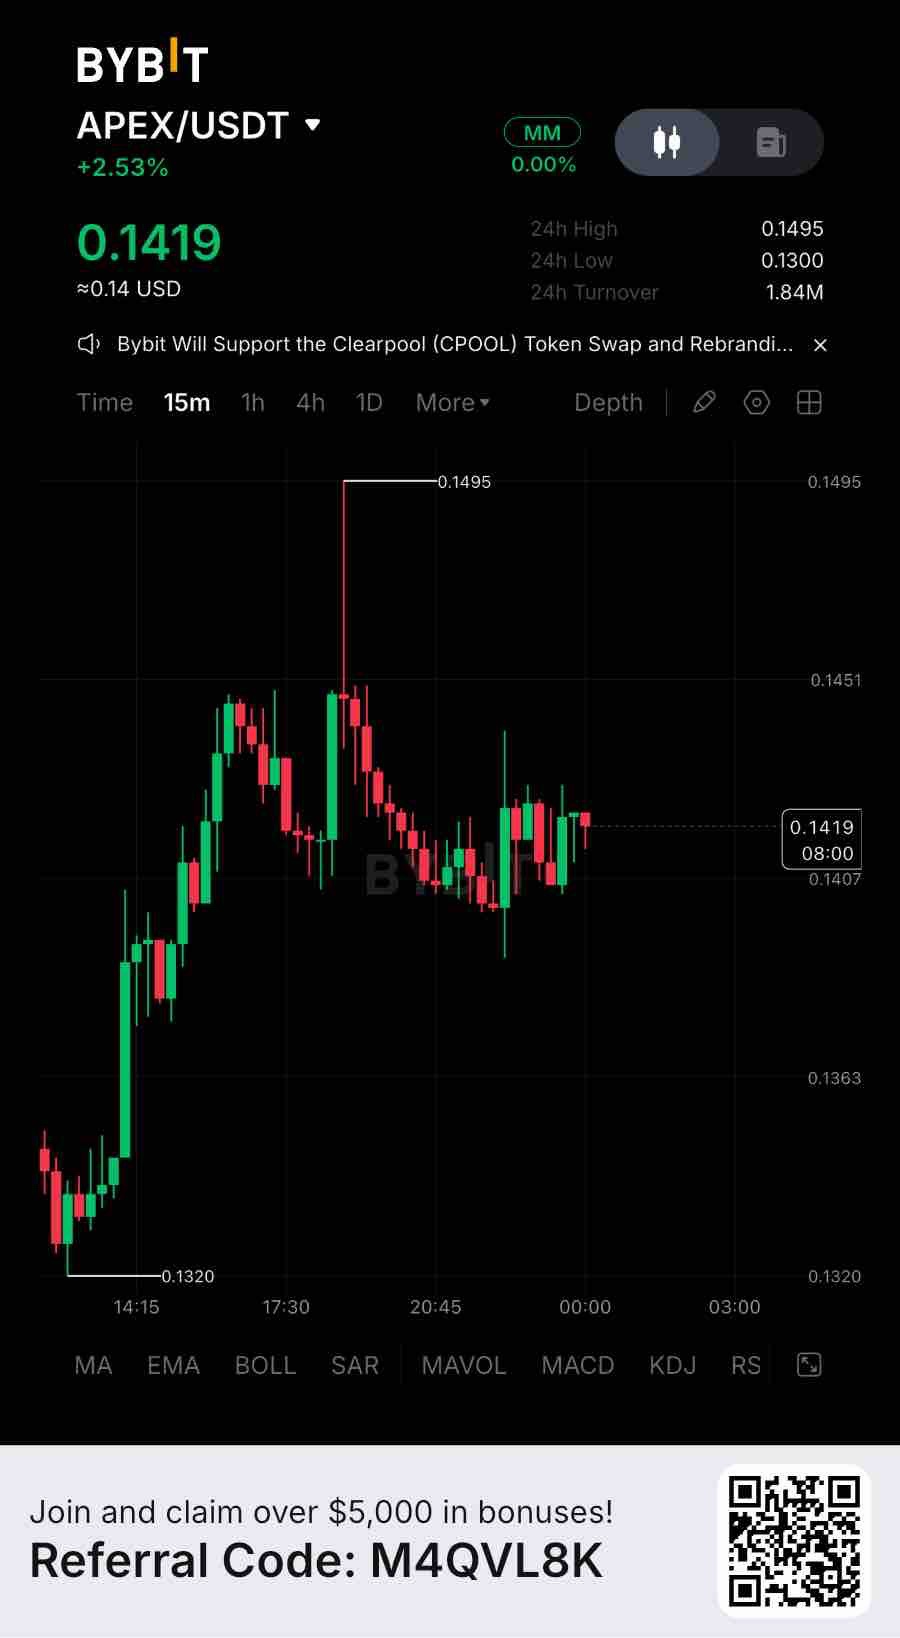
ApeX Protocol currently holds approximately $28.58M in TVL and processed $9.482B in perpetual trading volume over the last 30 days. That’s real usage, not narrative. The valuation is where things become interesting. APEX carries a circulating market cap of approximately $22.27M, equivalent to 0.78x TVL. Compared with GMX, which trades around 0.37x TVL, APEX carries roughly 2.1x the valuation multiple. The difference becomes more important when comparing actual holder revenue rather than trading activity alone. The underlying footprint is not insignificant. ApeX operates across eight chains, with approximately $12.85M on Arbitrum, $8.87M on Ethereum, $3.06M on Base, $2.63M on BSC and $1.17M on Mantle. Its combined products, ApeX Pro and ApeX Omni, have generated $41.62M in cumulative fees. The latest 30-day figures show approximately $326,641 in fees and $163,320 in reported holder revenue. ApeX Omni also directs 50% of trading fees toward APEX buybacks, creating a direct mechanism connecting protocol activity with token demand. The quiet concern is that trading activity has not translated into expanding TVL. A $9.48B notional volume figure looks substantial, but leveraged turnover is not the same as capital retained in the protocol. If TVL continues declining while fee generation remains dependent on trading activity, the current valuation premium becomes harder to justify. For the trade, APEX is hovering around $0.1413, with immediate support near $0.1380 and stronger downside support around $0.1310–$0.1280. Recovery resistance sits near $0.1420, followed by $0.1490. I’m watching this zone closely and would not chase a bounce without confirmation. The bullish setup becomes more interesting after a confirmed 4H close above $0.1420 and a successful retest, potentially opening the way toward $0.1490 and $0.1520. A 4H breakdown below $0.1310 would weaken the recovery structure, with the broader $0.1280 area becoming the next reference zone. None of this says the token is wrong. It says the on-chain growth story and the price story are running on separate clocks right now. Worth asking which one catches up to the other first — and whether more chains, higher volume and continued buybacks are enough to close a valuation premium that large. #ByXIMPACT $APEXUSDT

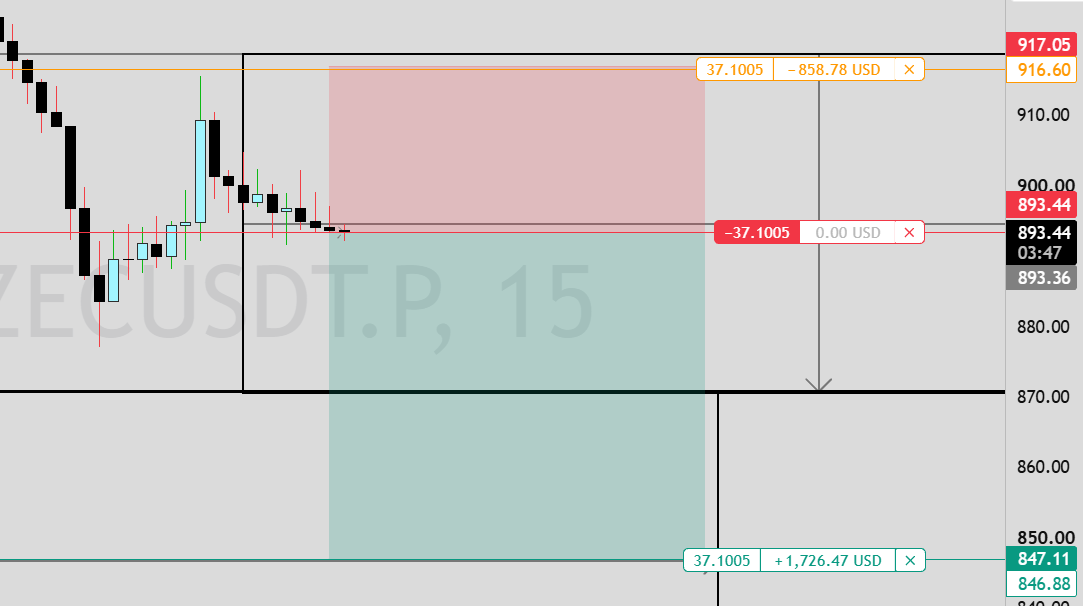
ZEC Short setup. 15m chart. 📉
Price is showing rejection after a pullback. I'm expecting a move down toward the target. Entry: 893.44 SL: 916.60 TP: 847.11 Trade is active now. Are you taking this short? $zec $BTCUSDT$VELOUSDT#WSOT2026 #WSOTShowYourAITradeToEarn10USDT #JensenHuangExitTestsNvidiasAILeadership #USPPITestsTheHigherForLongerTrade #USInflationRunsHotAndRateHikeBetsRise