MidtermsMarketWatch
The 2026 U.S. midterms are approaching. How could shifting policy expectations, market sentiment, and macroeconomic signals influence BTC, ETH, and other risk assets? Share your market outlook, key indicators, trading scenarios, and the evidence behind your views. Different perspectives. Real insights. Better market discussions.

Goldman Added A March Hike. Check Its Gold Call.
Goldman Sachs now expects two more 25 basis point Fed hikes. One in December. One in March 2027. Chief US economist David Mericle wrote it after the hot CPI. That would bring the cycle's total to three hikes, including September's. The March move could even come in January. And Goldman pushed its first cut back a quarter, to December 2027. Two details first. It's a reversal. In late October, Goldman had taken the March hike out of its base case. Three hot CPI prints later, it's back, per investingLive. It still sees December as 25. Not the 50 Waller floated. In the Fed's December dot plot, its quarterly projections of where rates are headed, Goldman expects most FOMC members to signal a third hike. Dallas Fed President Logan, who sees at least two more 25 basis point hikes, is on a similar page. Now the part I can't stop thinking about. Goldman's gold team cut its targets on November 5. $4,150 for end-2026. $4,800 for end-2027. In that same note, it listed a March 2027 hike, delayed cuts or a higher terminal rate as downside risks. In that case, gold ends 2027 near $4,660. Not $4,800. Five days later, its economists put two of those three triggers, the March hike and the later cuts, into their base case. I haven't seen the gold forecast updated. Is that a contradiction? Not exactly. These are different teams. The gold note may already assume a hawkish December. And the gap is small. $4,660 is 2.9% below $4,800 (my math). Measured from $4,055, where spot gold traded after the CPI release on November 10 per Kitco, even the downside case implies roughly 15% upside. The base case, about 18% (my math). Prices have moved since. So Goldman's view reads like this: flat near term, helped later by central bank buying. For markets, higher for longer is now the base case. Bitcoin and gold both traded on hike odds this week. I'm watching three things. Whether Goldman's gold team revises. October PCE on November 25. And whether November and December inflation prints really run as mild as Goldman expects. If they do, the March hike could come out again. #WSOT2026 #Oracle20BFundingPlanTestsTheAITrade #MidtermsMarketWatch #AnthropicIPOTestsTheAIBoom #BOERateDecision



After unlock, $FHE did NOT dip. That is the real story today. Bitcoin fell to near $73,750. Ethereum fell to near $2,042. Solana, XRP, Dogecoin, Cardano — almost all altcoins are in red. Market fear is at 29, CPI was hot, liquidations crossed $718 million. Everything is under pressure. But $FHE held its ground. Even after millions of tokens unlocked, price did not collapse. No panic dump. No weak hands crash. That means sellers are done, and holders are strong. In crypto, coins that survive unlock + BTC dip together are usually the first to move when market turns green. I am holding 9,000+ $FHE. My view: if BTC just stabilizes above $73,500, $FHE has a clean path to $0.03, then $0.05. This is not financial advice. Just my observation — strength in fear is rare. And rare strength often gets rewarded. Are you watching FHE too? Drop your target below. #AnthropicIPOTestsTheAIBoom #Oracle20BFundingPlanTestsTheAITrade #MidtermsMarketWatch #BybitAIEvolving #OilVolatilityTracksIranPeaceTalks $SOLUSDT $FHEUSDT
🔥 THE SILENT GIANT NO ONE IS WATCHING — YET Read this before you sell $FHE. While other coins tweet 10x a day, post memes, and beg for attention, $FHE team has been silent since August. No hype. No noise. No fake announcements. And still — it did NOT die. It survived unlock. It survived BTC crash to $73,750. It survived Fear at 29. That is not weakness. That is strength. Why? Because $FHE is not a meme. It is infrastructure. Fully Homomorphic Encryption for AI agents, private data, quantum-resistant future. Real tech. Real partnerships. Clean tokenomics with limited supply pressure after unlock. Look at history: $ZEC pumped 300%+ when privacy narrative returned. $XMR held strong in bear markets. Privacy never dies. It waits. Then it explodes. $FHE is that same story, but for AI era. One real update — one partnership, one mainnet news, one Binance push — and this silent coin can wake up fast. From $0.016, even $1 is not fantasy, it is math + narrative + patience. I hold 9,000+ $FHE. I am not selling silence. I am buying it. Not financial advice. Conviction. #BybitAIEvolving #BOERateDecision #OilVolatilityTracksIranPeaceTalks #MidtermsMarketWatch #AnthropicIPOTestsTheAIBoom $MNTUSDT $FHEUSDT

Good Morning 🌞 | BTC, ETH & SOL Update
$BTCUSDT : ~74,000 (-1.28%) 📉 · 24h low: 73,748 | High: 75,431 · Red for 5 weeks now, testing the 73K support. $ETHUSDT : ~2,044 (-3.90%) 📉 · The $2,000 support is very close. · Heavy short liquidations occurred. SOL: ~82.9 (-4.54%) 📉 · Holding the $83.5 support. · A bounce could come if it closes above $84.4. My Portfolio: Total: 697.14 PKR ✅ 6M PnL: +Rs16,163.40 (+1,526.41%) 🚀 The market is red, but the long-term portfolio remains strong. What are you holding today? 👇 #NovUSCPIWatch #Oracle20BFundingPlanTestsTheAITrade #MidtermsMarketWatch #AnthropicIPOTestsTheAIBoom #BybitAIEvolving

🏭 Who Is Reportedly Investing?**
⚠️ **Anthropic's IPO Backers Read Like an AI Supply-Chain Checklist** 🤖 Anthropic's IPO plans are drawing attention, and not only for the size of the offering. The list of reported backers covers nearly every layer of the AI stack. 📊 **🏭 Who Is Reportedly Investing?** According to reports, Google, Nvidia, AMD, Broadcom, Micron, Microsoft and TSMC plan to invest a combined $26B through a private placement at the IPO price. 💰 That puts chipmakers, memory suppliers, cloud providers and a leading foundry on the same cap table. 🧩 **🔗 More Than a Bet on Claude** These companies aren't only backing a product. They are backing a customer. 🛒 As Anthropic grows, it needs more of everything these suppliers sell: - 🧠 **Chips:** GPUs and custom accelerators to train and run models - 💾 **Memory:** High-bandwidth memory for AI workloads - ☁️ **Cloud capacity:** Data center space and compute at scale - 🏗️ **Manufacturing:** Advanced chip fabrication For suppliers, equity in Anthropic is partly a way to secure long-term demand for their own products. 🔄 **💵 The Valuation Question** Anthropic is reportedly targeting an IPO valuation of roughly $1T, or $1.4T on a fully diluted basis. 🚀 That is an enormous number, and it raises the key question for public investors: how much growth is already built into the price? 🤔 **⚖️ Who Gets What?** - 🏢 **Suppliers** get equity and a stake in a fast-growing customer. - 🧪 **Anthropic** gets funding to expand its compute and capacity. - 📈 **Public investors** get to decide how much this relationship is worth. **⚠️ Risks to Consider** Circular financing is a real concern. 🔁 When suppliers invest in a customer who then spends that money back with them, demand can look stronger than it is. Investors should also watch spending commitments, competition, and how the market reacts to such a large valuation. 🔍 **🎯 Final Takeaway** The IPO is a test of how the market values the AI supply chain as a whole, not just one company. Treat reported figures with care until official filings confirm them. 📑 *This is not financial advice. Always do your own research.* 🙏 **:** #AnthropicIPO 🚀 #AIStocks 🤖 #Nvidia 💚 #TechInvesting 📊 #IPONews 🔔 --- #NovUSCPIWatch #Oracle20BFundingPlanTestsTheAITrade #MidtermsMarketWatch #AnthropicIPOTestsTheAIBoom #BOERateDecision


$BTCUSDT is down, but Open Interest is going up. That's an unusual combination. Instead of leverage leaving the market, more positions are building as Bitcoin makes new lows. This could create the perfect setup for a major liquidation event. Something big could be brewing. 👀 #MidtermsMarketWatch
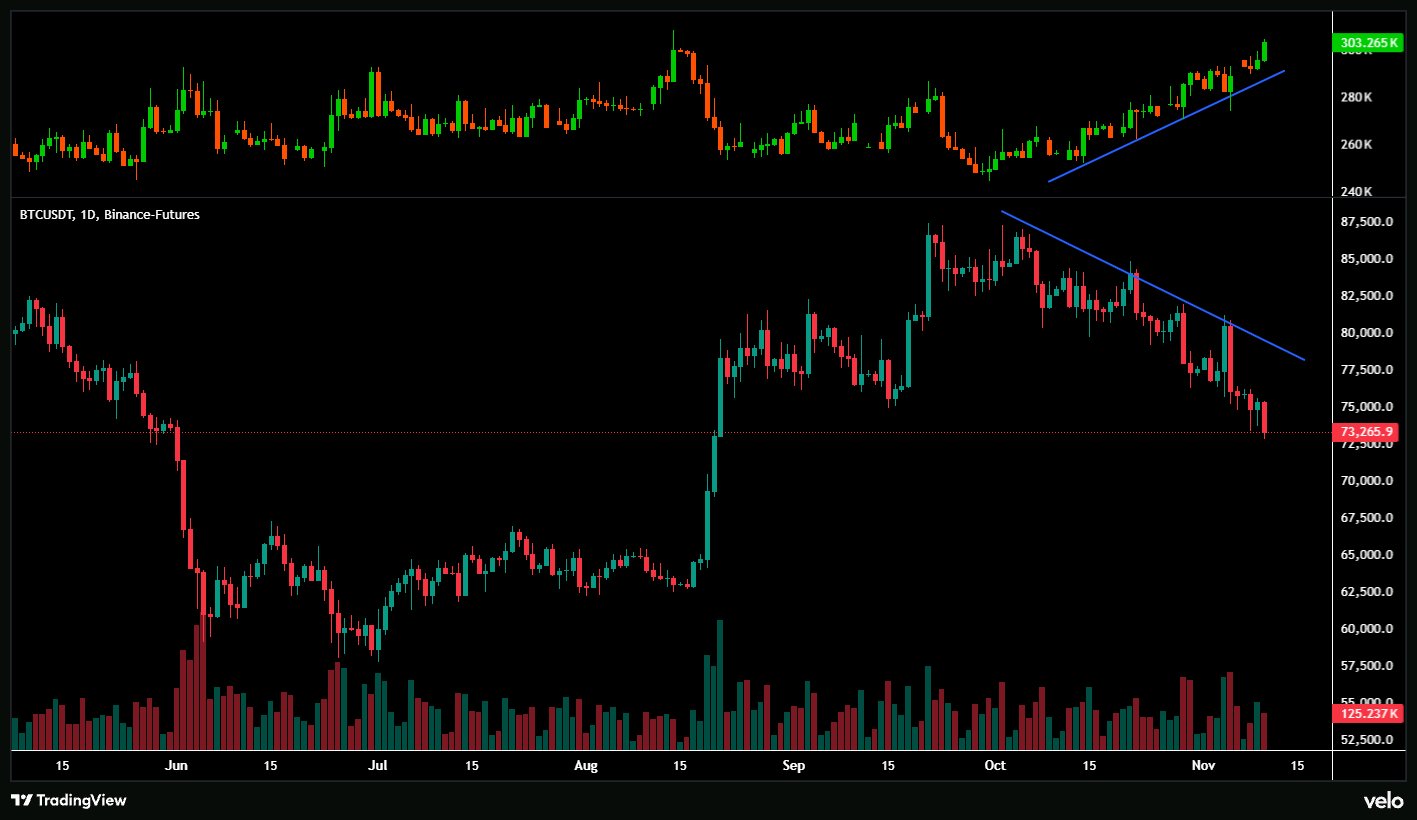

https://www.bybit.com/press/community/6341068275339510360 #BybitAIEvolving #BOERateDecision #AnthropicIPOTestsTheAIBoom #MidtermsMarketWatch

🚨 $TRUMP at All-Time Lows: Squeeze or Trap? 📉
The tension on $TRUMP has reached a boiling point as the token tests its macro floor while derivatives data paints an aggressive divergence. Trading around $1.132 following a sharp rejection from $1.152, price action is hovering dangerously close to the historical low support near $1.102. This isn’t a standard dip—it is a critical test of whether spot buyers will defend the base or allow price discovery to the downside. 🔍 Derivatives Divergence vs. Spot Pressure: * Aggressive Short Stacking: Futures Open Interest climbed over 6% to ~$155.7M even as spot price continued bleeding, while 8-hour funding flipped negative to -0.0103%. This setup confirms aggressive short-side momentum, not organic spot accumulation. * Liquidation Asymmetry: Over 82% of recent liquidations came from leveraged longs. With futures volume (~$238.6M) dwarfing spot turnover (~$29.8M) by roughly 8x, leveraged speculation is driving the entire tape. * Structural Dilution: Only 281.9M tokens are in circulation out of the 1B maximum supply. The gap between current market cap ($315M) and FDV ($1.12B) keeps traders cautious regarding future unlock overhang. 🎯 Critical Technical Roadmap ($TRUMPUSDT): 🔴 Bearish Invalidation ($1.100 – $1.102): A decisive 1H/4H breakdown beneath $1.102 with rising OI removes the last visible support floor, exposing the chart to an aggressive liquidation cascade into uncharted territory. 🟢 Bullish Reversal & Short Squeeze: To invalidate the downward channel, bulls must reclaim the $1.137–$1.153 resistance band on real spot volume. Negative funding creates high fuel for a violent short squeeze, but sustained upside requires genuine spot absorption, not just covering rallies. Political sentiment volatility and Senate regulatory inquiries continue to test narrative-driven tokens. Protect capital, respect your stops, and avoid overleveraging. Are you bidding the $1.10 historical floor for a squeeze bounce, or waiting for a breakdown flush? Share your thesis below! 👇 $TRUMPUSDT #ByXIMPACT
https://www.bybit.com/press/community/7205759403794315717 #BOERateDecision #AnthropicIPOTestsTheAIBoom #MidtermsMarketWatch #Oracle20BFundingPlanTestsTheAITrade #OilVolatilityTracksIranPeaceTalks $SOLUSDT $DOGEUSDT @

https://www.bybit.com/press/community/8070450532248647485 #USPayrollsAndRateDecisionsDriveMacroWeek #Oracle20BFundingPlanTestsTheAITrade #MidtermsMarketWatch #AnthropicIPOTestsTheAIBoom #BybitAIEvolving $SOLUSDT @$DOGEUSDT

Bom dia pessoal alguém pode me ajuda com lucro bybit

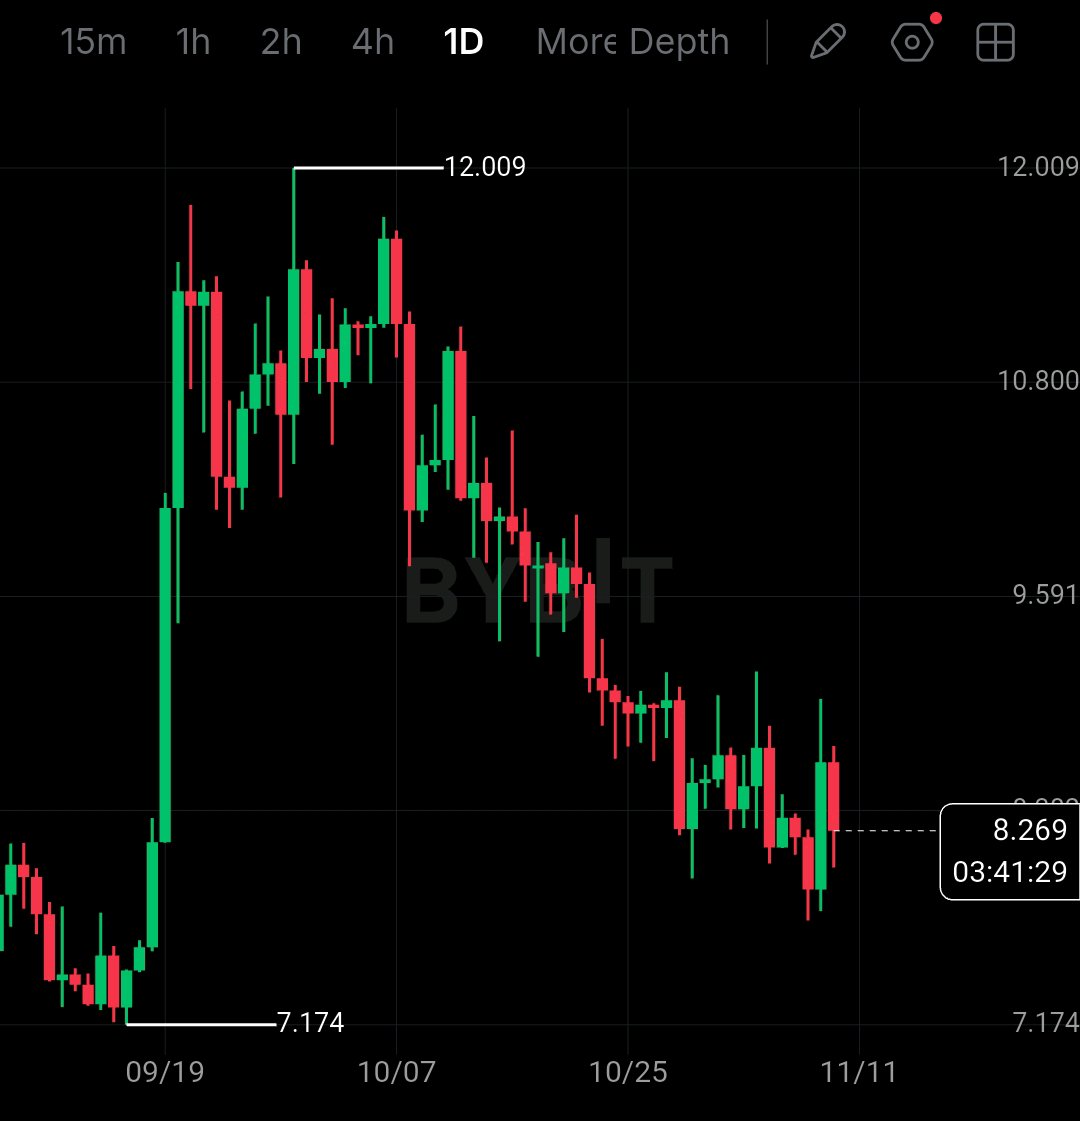
$AVAXUSDT just lost $8.54 and now $8.06 is all that is left, AVAX fell from $12.009 to $8.26. It is not bouncing. It is bleeding slow. The chart tells the real story. Price is stuck below EMA200 at $9.117. It also lost Fib $8.549. That was the last support to hold. RSI is near 41, not oversold, just weak. MACD is flat at 0.008, no momentum at all. If $8.062 breaks with a close below, the next leg down opens to $7.763 then $7.528. If $8.549 reclaims with volume, the breakdown fails and $9.117 opens. My plan is simple. I am not buying the middle. Short below $8.062, stop above $8.549, target $7.763 and $7.528. Long only if $8.549 reclaims. Risk 1 to 2%, 5x to 10x isolated max. Tell me, does $8.062 break or $8.549 reclaim? Comment DOWN if $8.062 breaks, UP if $8.549 reclaims. Tap $AVAXUSDT to trade this $8.062 test, trade on this same coin @BybitX @Bybit Learn @PRADO @JonyDong 509 @Jiji715 @Annnn #Oracle20BFundingPlanTestsTheAITrade #MidtermsMarketWatch #AnthropicIPOTestsTheAIBoom #BOERateDecision #BybitAIEvolving

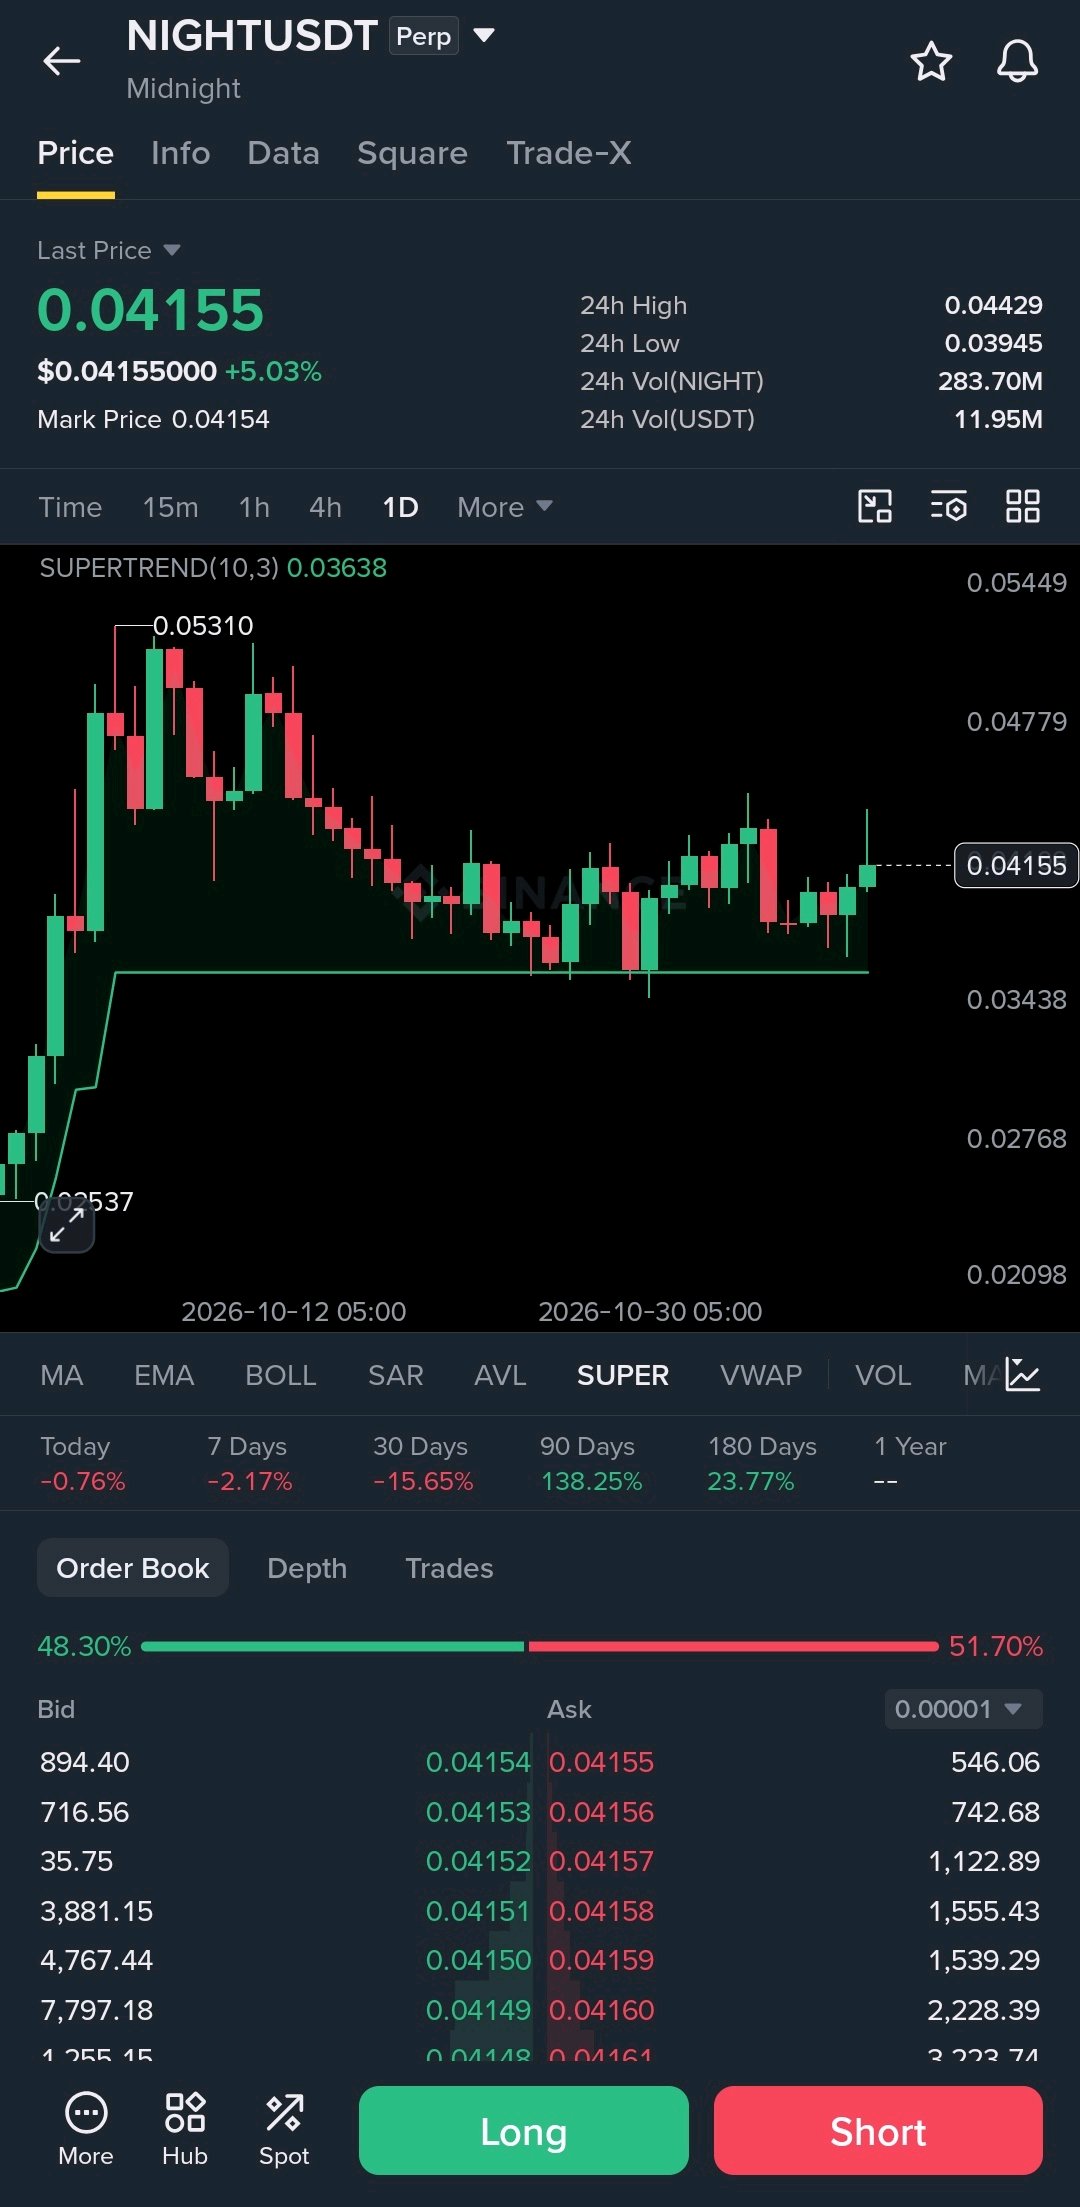
Something interesting is happening with $NIGHTUSDT , and the key level is getting closer. After pulling back from $0.0531, Midnight has started building a decent base around $0.04. Price is holding above the daily Supertrend at $0.03638, which keeps the recovery setup looking constructive. Levels I'm watching: Support: $0.0395 to $0.0364 Resistance: $0.0443 Breakout zone: $0.0478 Major level: $0.0531 A convincing move above $0.0443 could give buyers room to push higher. Losing $0.0364 would put this structure under pressure. Credit where it's due, NIGHT is showing resilience after the pullback. Now a clean breakout would be the next step. #MidtermsMarketWatch #AnthropicIPOTestsTheAIBoom
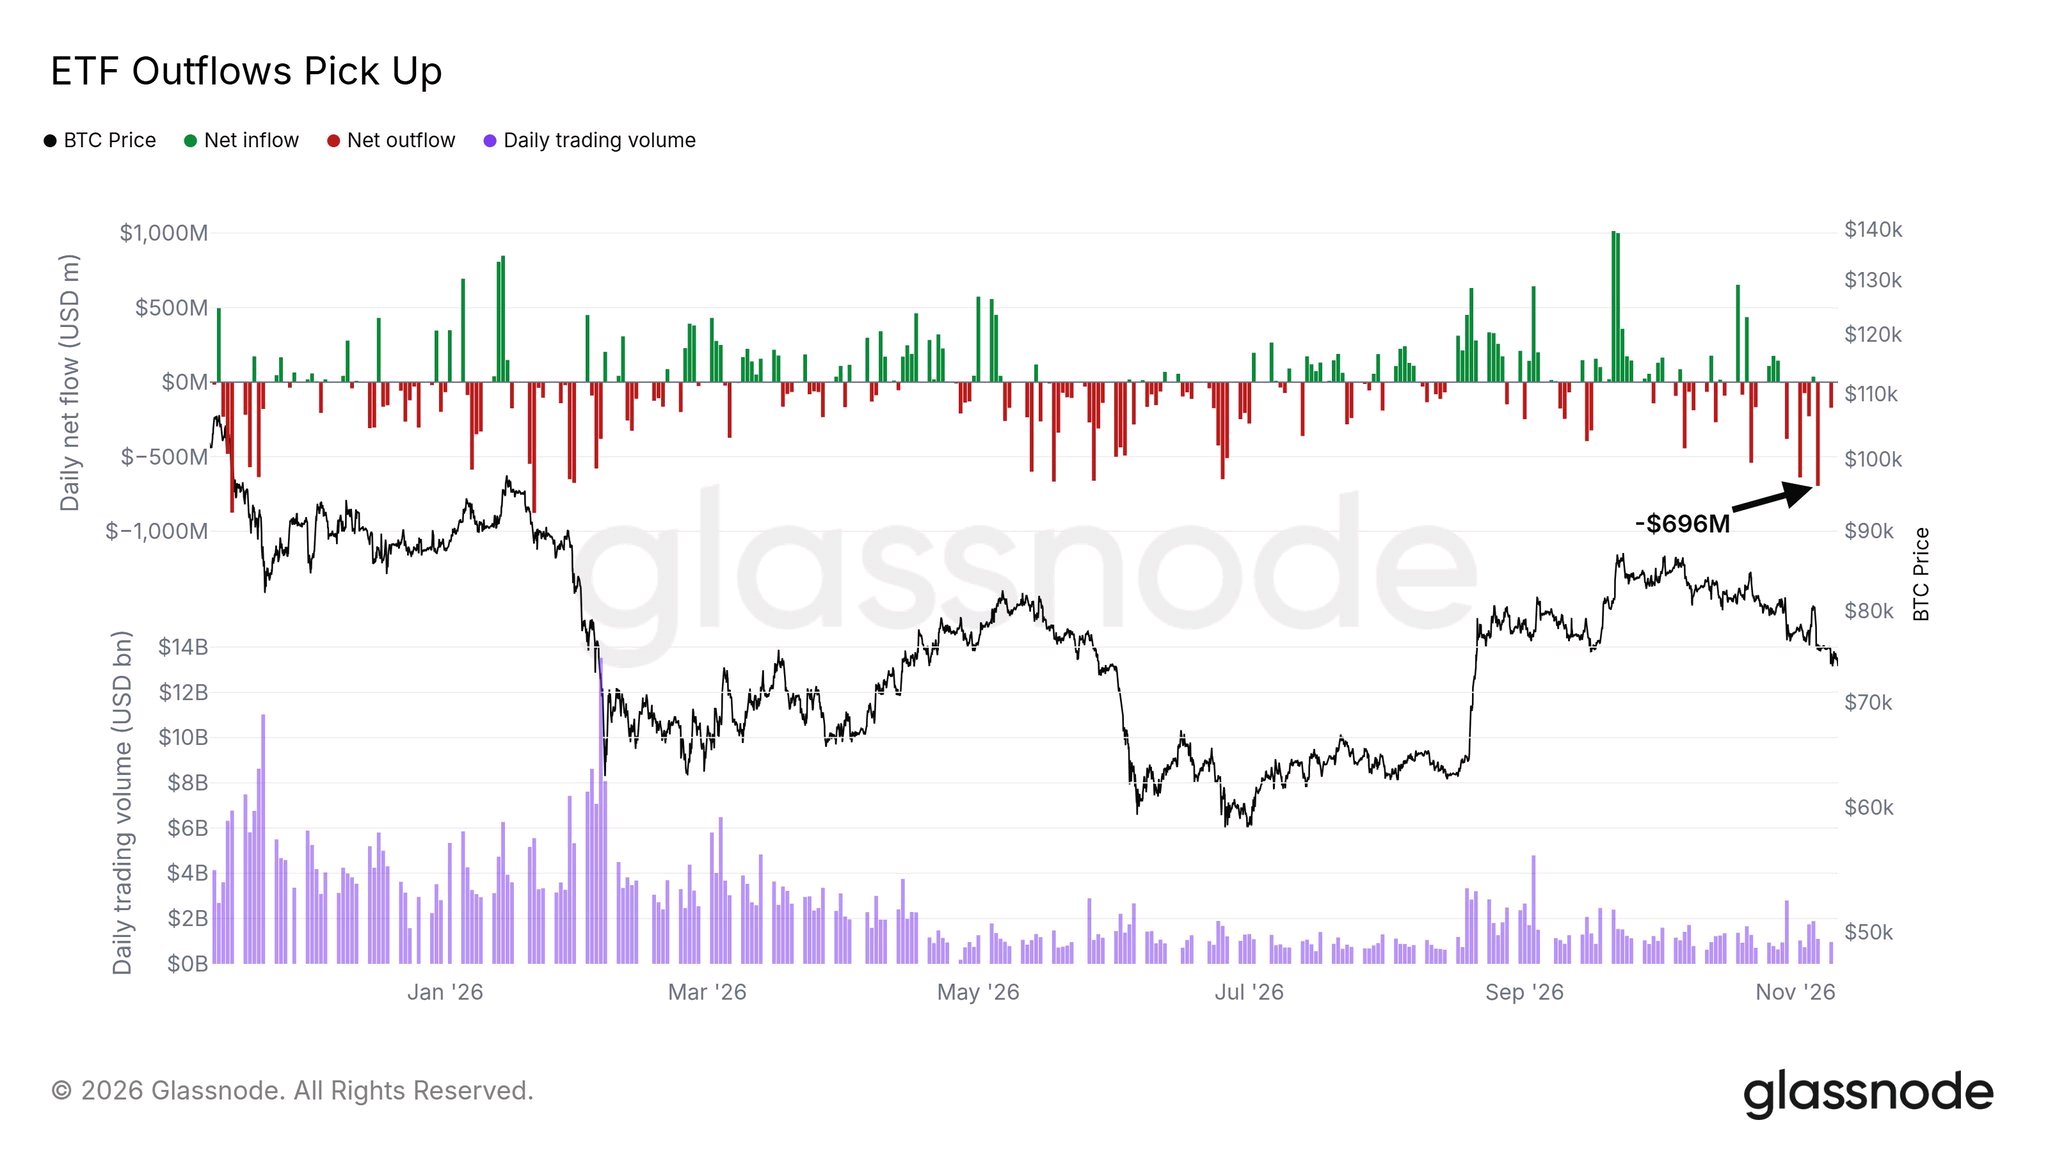
Bitcoin ETFs Turned Negative For 2026: -$1.1B
US spot Bitcoin ETFs are now in the red for 2026. Farside data, cited by Cointelegraph, puts net outflows at about $1.1 billion through November 9.$BTCUSDT By early November in both 2024 and 2025, these funds had taken in roughly $25 billion. The slide was fast. SoSoValue had 2026 at -$502 million through November 5. The Block put it at -$914 million after Friday's -$411.9 million. Monday's -$201 million brings it to about -$1.1 billion. Three numbers. Three dates. One slide (my math). A viral tweet says Friday saw $696 million of outflows, the biggest since January. I couldn't verify that. $696.3 million is the June 25 figure. The biggest recent day I can confirm is $643.3 million on October 30. That was the largest since June 25 and the 12th largest since launch, per SoSoValue via CoinDesk. IBIT has now had outflows for seven straight sessions since October 30. About $1.66 billion in total, per Farside. But it isn't one-way. Fidelity's FBTC took in money on two of those days. Morgan Stanley's MSBT has drawn $783 million this year. Money is moving between funds as well as out of them. For scale, the funds still hold about $95.9 billion, 6.28% of Bitcoin's market cap. A -$1.1 billion year is about 1.1% of that (my math). "A return to steady inflows would ease the pressure" is fair. It's also circular. Flows have tracked price this autumn. I'm watching two things. Whether a single inflow day turns into a streak. And whether IBIT's run of outflows finally ends. #WSOT2026 #NovUSCPIWatch #Oracle20BFundingPlanTestsTheAITrade #MidtermsMarketWatch #AnthropicIPOTestsTheAIBoom


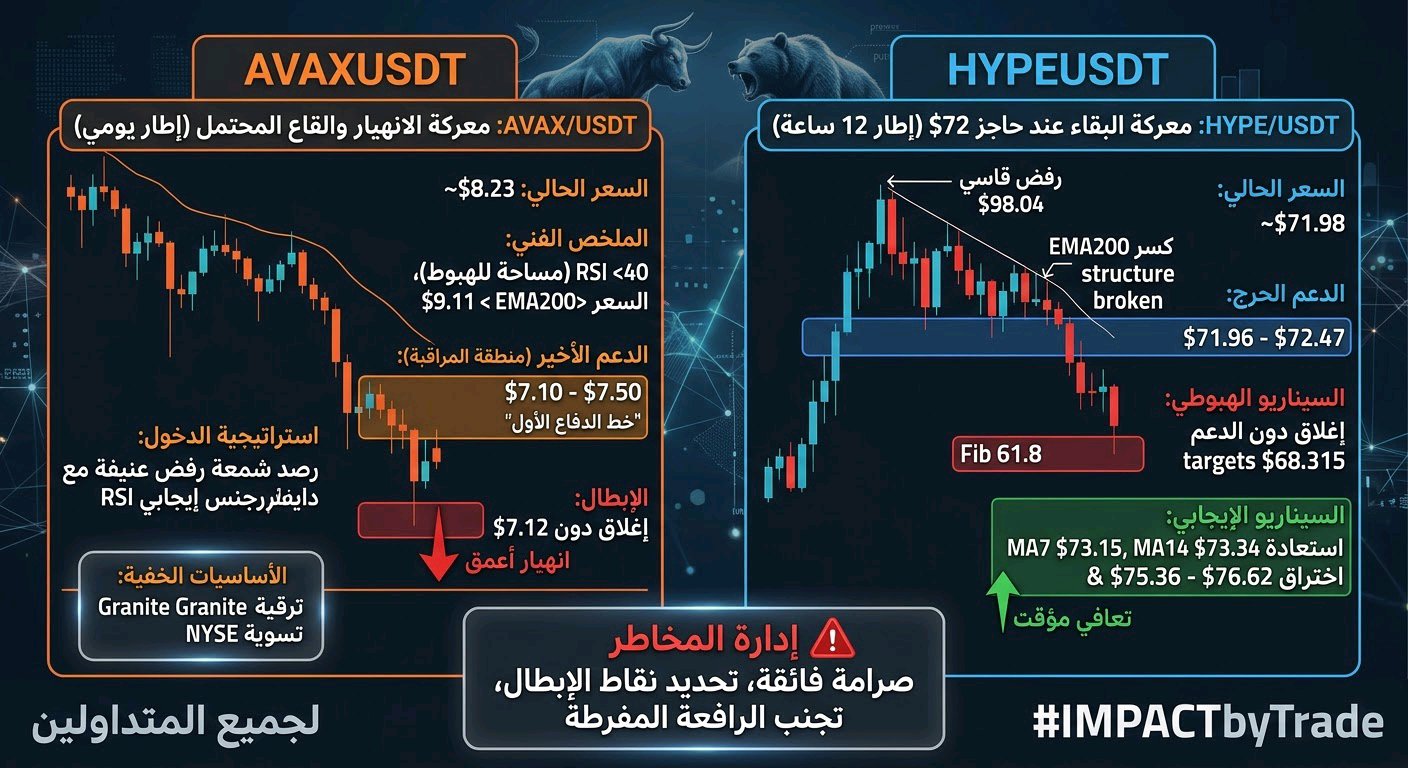
A battle for survival! Will the bottoms hold, or will we wait for the deeper "bleeding"? 🩸📉 AVAXUSDT$AVAXUSDT is teetering on edge of a major Breakdown, is the bottom finally in? Avalanche is trading around $8.23, down a brutal 7.48%, as entire altcoin market bleeds out and sellers relentlessly hammer price lower. chart looks ugly, sentiment is in the gutter, and the bulls are nowhere to be found. 👀 but chart is starting to show a setup worth watching. 😋 what stands out on the 1D chart. RSI hovering near 40, showing that momentum is weak but not yet fully oversold, there is still room for another leg down before a meaningful bounce. eMA200 at $9.11, and price is trading well below it, this is a massive bearish signal, confirming that the macro trend has flipped. support around $7.12-$7.50 green zone that buyers absolutely must defend. 🌊 break below this and it is a freefall. resistance $9.11 (EMA200) overhead ceiling that has been rejecting price for weeks. mACD deep in negative territory with a bearish histogram, confirming that sellers are still in full control. 📰 news nobody is talking about. Avalanche has been rolling out major upgrades, the Granite upgrade introduced sub-second confirmations and biometric authentication for dApps. avalanche foundation is even pursuing a $1 billion institutional capital raise through U.S. corporate treasuries. just recently, reports surfaced that the New York Stock Exchange will settle tokenized stocks on the Avalanche blockchain, a massive validation of the network's infrastructure. yet despite this barrage of bullish fundamentals, the price keeps bleeding, this is the ultimate bearish divergence. good news is being sold, market is telling us that the path of least resistance remains down, at least for now. My trading plan: I'm watching the $7.10-$7.50 green zone closely. This is the last line of defense. If AVAX breaks below $8.00 with volume, I expect a rapid flush into the green zone. That is where I will be watching for a reaction. if price reaches the green zone and shows a violent rejection wick with a bullish divergence on the RSI, that is when start building a position. confirmed breakout above the local resistance after defending this zone would be the signal that the tide has finally turned. however, a clear break and close below $7.12 would invalidate the entire setup and could open the door to a deeper capitulation toward $6. opportunity isn't catching a falling knife. It's waiting for the market to flush out the weak hands and confirm that the green zone is a hard floor. would you consider accumulating AVAX near the $7.50 green zone, or wait for a confirmed breakout above $9.11? 😋 #IMPACTbyTrade 🚨 HYPE at the Edge: Will the $72 Floor Hold? 📉 The battle for HYPE is reaching a make-or-break $HYPEUSDT moment as the token directly tests its most critical support of the season. Currently trading at $71.98 (-5.59% in the 24h cycle on a 46.38M volume), HYPE is staring right down the barrel of a massive trend-continuation or breakdown. There is a deeply concerning, higher-timeframe bearish pattern that most retail traders are failing to acknowledge. The Hidden 12-Hour Trap 🔍 The Failed Reclamation: After its brutal rejection from the $98.04 peak, HYPE attempted a recovery but was aggressively pushed back, printing a prominent lower high directly into a heavy supply zone. The Structure Break: This drop wasn't just a simple rejection. The key trigger was when the price broke down from the EMA 200, severely damaging its daily market structure. Volume and Price: Volume compression alongside sustained lower highs indicates that sell-side pressure on relief bounces is far outpacing new buyers. HYPE recently fell right through its $73.57 intraday target and is now actively testing the $71.96–$72.47 floor. Critical Trading Scenarios & Invalidation 🎯 ($HYPE$HYPEUSDT USDT) 📉 Bearish Target ($68.315) 🔴 If HYPE fails to gain buy-side traction here and suffers a decisive close below the $72.00–$72.47 zone, the macro bullish case is delayed. This failure would strongly confirm a deeper slide down to the $68.315 Fibonacci target, sweeping historical liquidity. Bullish Invalidation & Relief Target ($75.36 – $76.62) 🟢 To invalidate the downward channel, bulls must orchestrate a high-volume reversal, reclaiming MA7 ($73.15) and MA14 ($73.34) to force a daily breakout above the $75.362–$76.62 resistance cluster. That's where the actual target for a temporary recovery sits, but this requires genuine spot absorption. Mindset Warning 💡 HYPE has shown how quickly its momentum can evaporate. Always preserve capital, manage your leverage defensively, and identify your invalidation mark before you enter a position. Are we witnessing the final flush before a relief bounce, or is HYPE about to lose the $72 floor and tumble deeper? Drop your setup below 👇! #IMPACTbyTrade #WSOT2026 #WSOTPicktoEarn10U #BybitAIEvolving #مراقبة سوق الانتخابات النصفية #ByXIMPACT

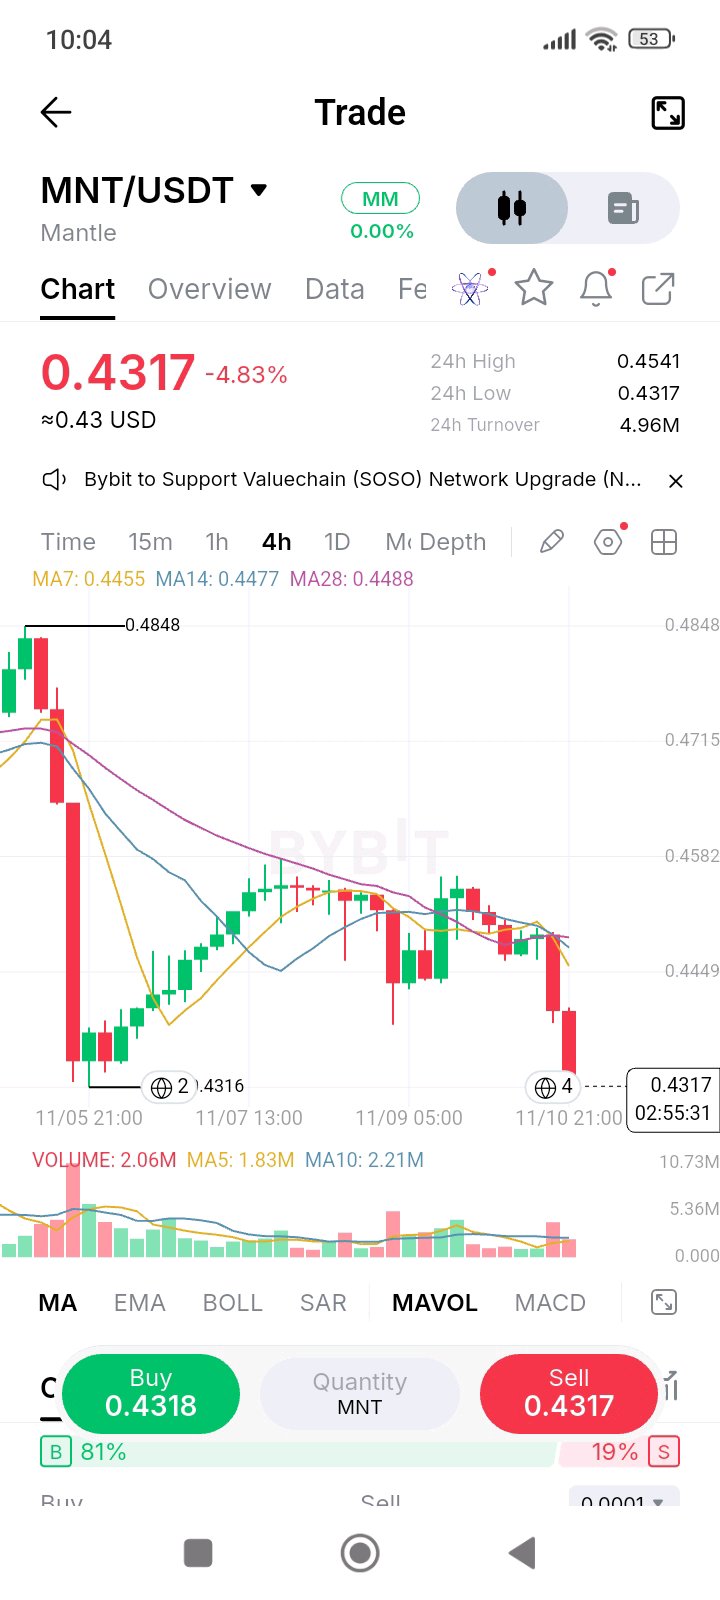
$MNT at $0.4317: Will Buyers Defend Support?
$MNT Under Pressure! Can Buyers Defend $0.4316? 👀 I’ve been watching $MNT closely, and this latest move is definitely not something I want to ignore. Mantle has faced serious selling pressure after failing to sustain its recovery, and now the market is testing an important support zone. $MNT is trading around $0.4317, down nearly 4.83%. After recovering from the previous sharp drop, price spent time consolidating around $0.445–$0.455, but sellers have stepped back in and pushed it toward the recent low. This tells me buyers are losing short-term control. 📊 The technical picture isn't looking comfortable. On the 4H chart, MA7 sits at $0.4455, MA14 at $0.4477, and MA28 at $0.4488. Price is below all three averages, showing bearish momentum. 🐋 I don't have confirmed whale-flow or token-unlock data, so I'm not going to invent a story. Volume and buyer absorption around support are what I want to monitor next. 🎯 Key levels I'm watching: * Support: $0.4316 * Resistance: $0.4455–$0.4488 * Breakout level: $0.4541 * Next upside target: $0.4541 on a successful recovery. 🔥 If $0.4316 breaks decisively, further downside pressure could follow. But if buyers defend this zone and reclaim the moving averages, a recovery becomes interesting. I'm still watching $MNT. No blind entries, no chasing candles. Will buyers defend this support, or are sellers preparing another leg down? #WSOTPicktoEarn10U #OilVolatilityTracksIranPeaceTalks #Oracle20BFundingPlanTestsTheAITrade #MidtermsMarketWatch

Выбор NYSE для AVAX и взлет GRAM 🚀
Всем привет! Короткий вечерний дайджест рынка с самыми важными событиями из вашего списка, которые выделяются на фоне сегодняшней волатильности: AVAX демонстрирует уверенный рост на повышенных объемах вопреки общей коррекции рынка. Главным драйвером послужила новость о том, что Нью-Йоркская фондовая биржа (NYSE) выбрала блокчейн Avalanche в качестве расчетной сети для своей будущей круглосуточной платформы торговли токенизированными ценными бумагами. GRAM стал главным лидером дня среди альткоинов, прибавив почти 9% за последние 24 часа на фоне охлаждения остального рынка. Монета уверенно удерживает внимание трейдеров и демонстрирует лучшую суточную динамику среди отслеживаемых активов. Не финансовый совет, просто делюсь тем, что попало в поле зрения. Всем отличного вечера и профитных торгов! 👍 #Наблюдение за рынком в период промежуточных выборов #ByX $AVAXUSDT $GRAMUSDT
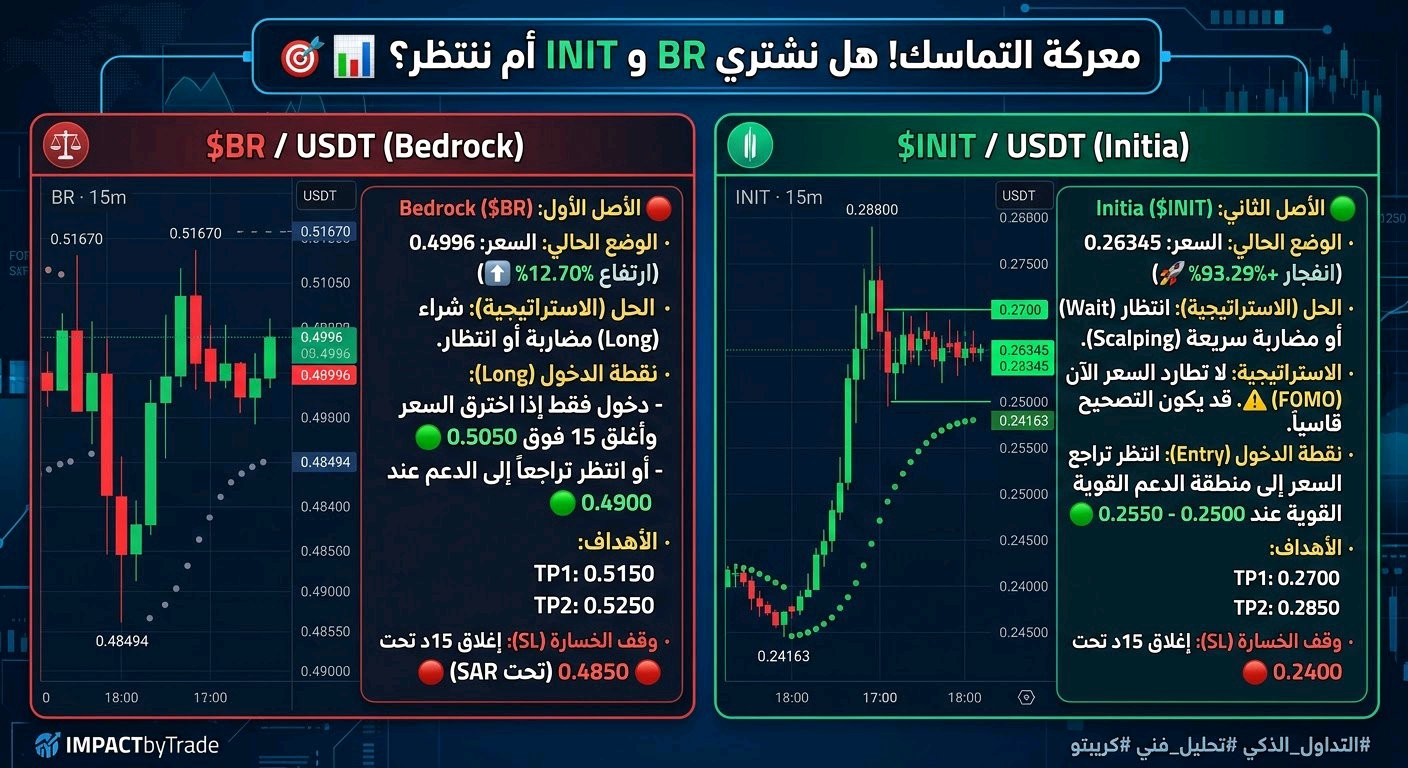
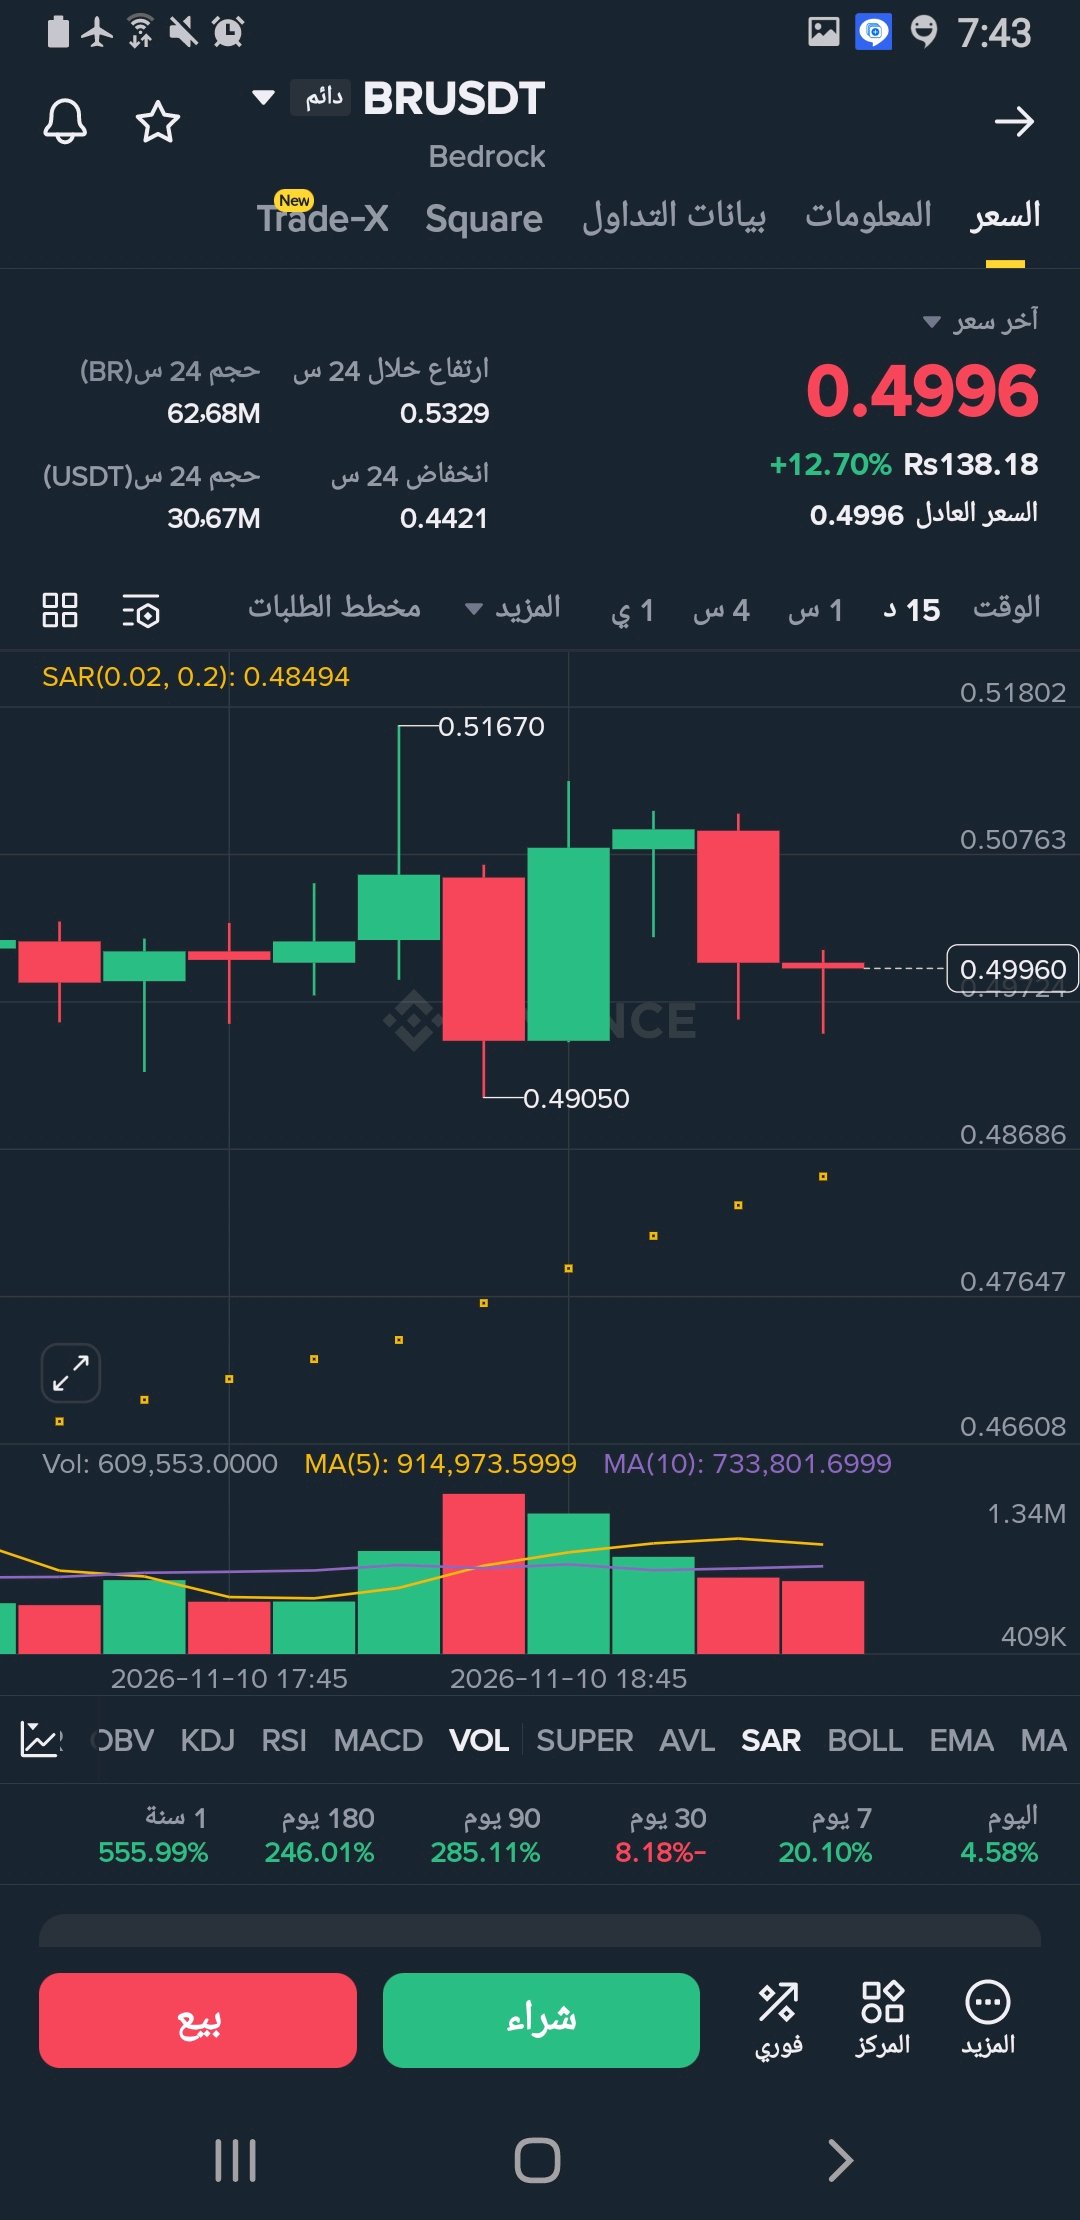
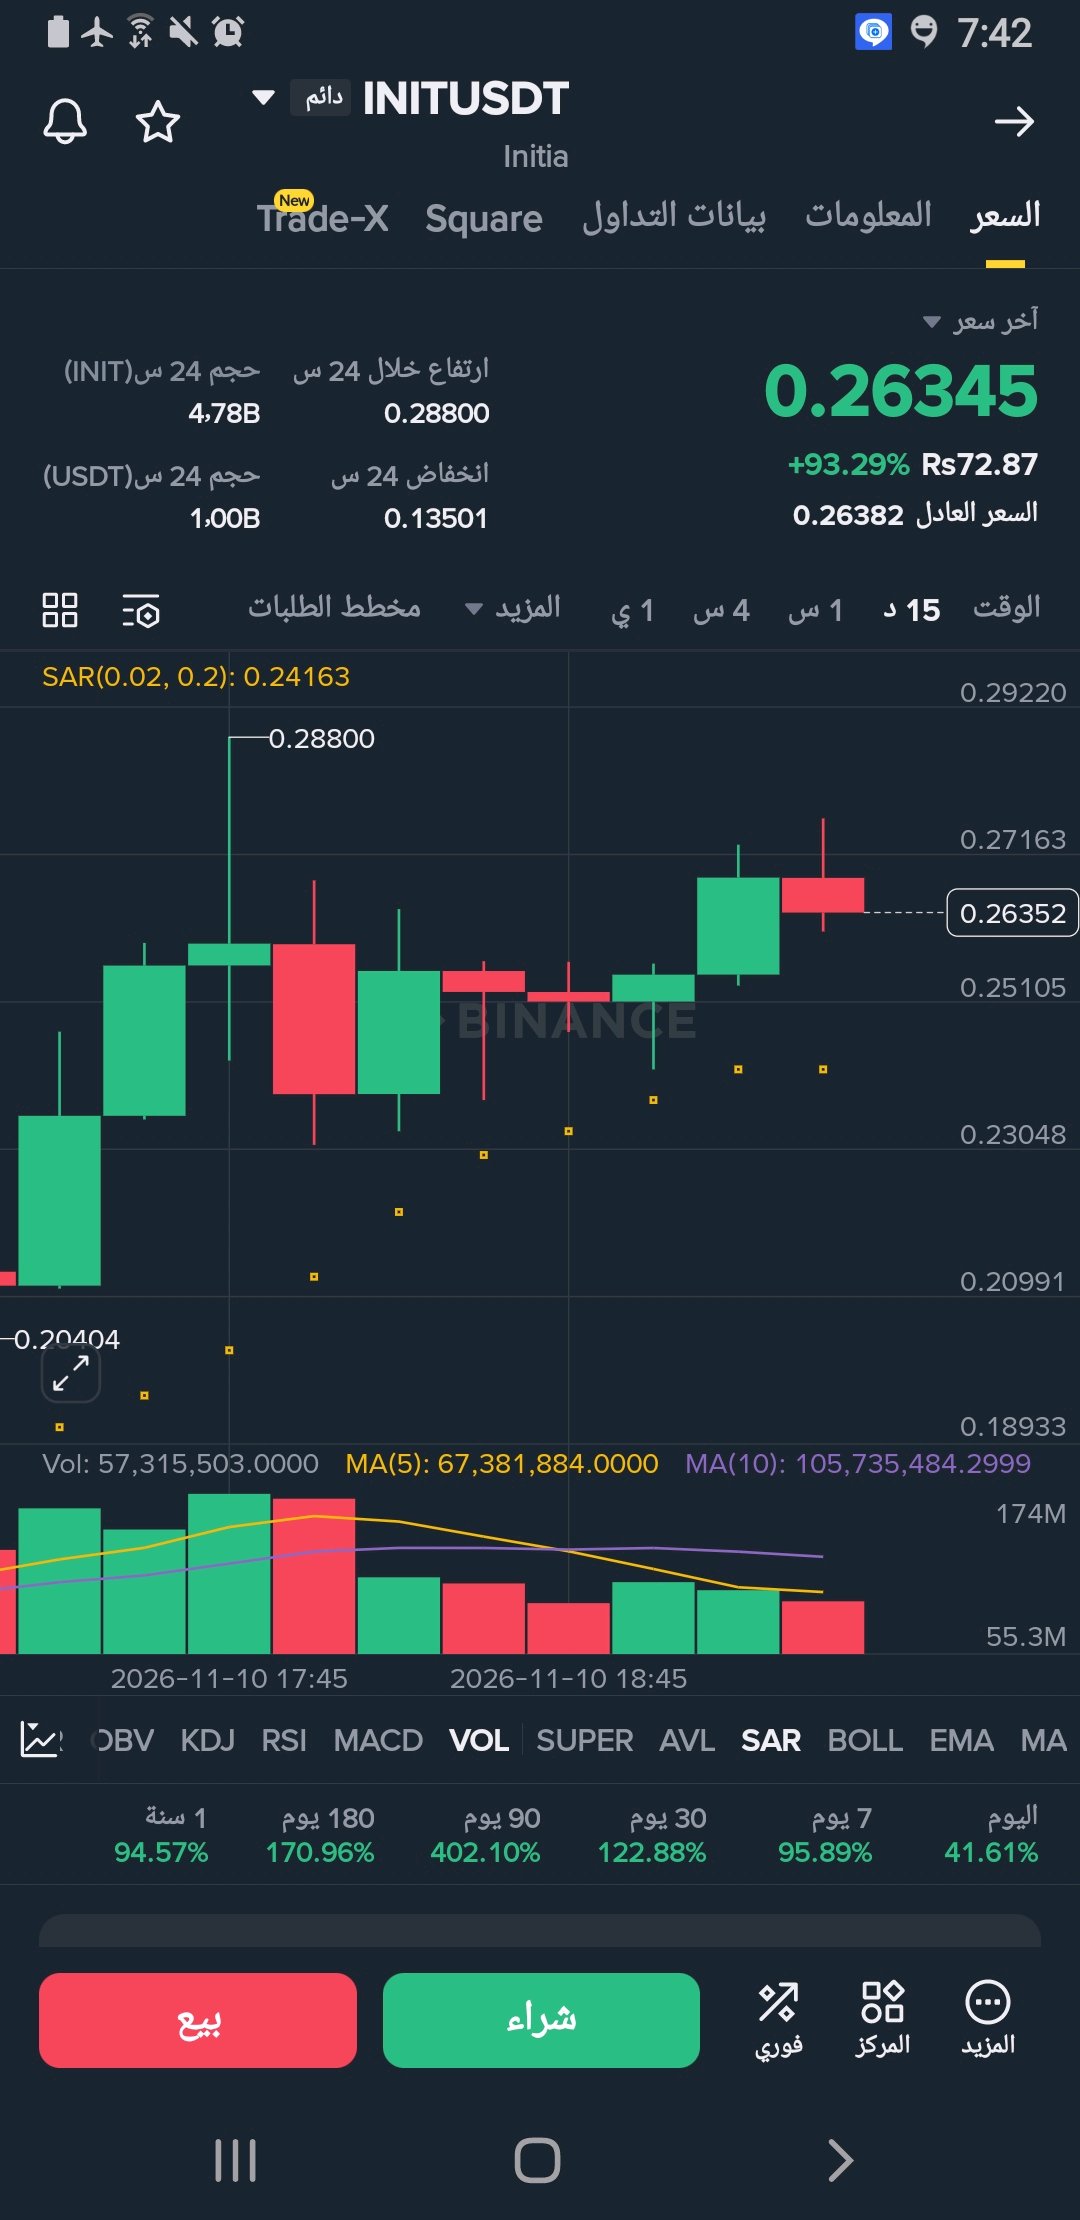
#IMPACTbyTrade The Battle for Consistency! Should we buy BR$BRUSDT and $INITUSDT INIT or wait? 🎯📊 Hello traders! Today we're reviewing two charts reflecting sharp fluctuations on the 15-minute timeframe. Both currencies are showing significant volatility, and the process requires precision and caution. Here's the trading solution (action plan) for each: 🔴 First Asset: $BR/USDT (Bedrock) · Current Situation: Price at 0.4996 (up +12.70%). · Technical Analysis: The currency has experienced extreme volatility, reaching a high of 0.51670 and then falling to a low of 0.49050. The current price is trading in a narrow range (small red candle). The Parabolic SAR indicator is below the price at 0.48494, supporting a bullish bounce scenario. Volume is average. · Solution (Strategy): Buy (Long) speculatively or wait. • Entry Point (Long): Only enter if the price breaks through and closes a 15-minute candle above 0.5050. Or wait for a pullback to support at 0.4900. • Target 1 (TP1): 0.5150. • Target 2 (TP2): 0.5250. • Stop Loss (SL): 15-minute candle closes below 0.4850 (below the SAR indicator). 🟢 Second Asset: $INIT/USDT (Initia) • Current Situation: Price at 0.26345 (+93.29% breakout). • Technical Analysis: Rocket Rise! Reached a high of 0.28800 and then corrected. Currently, the price is moving sideways between 0.2500 and 0.2700. The SAR indicator is still below the price at 0.24163 (positive signal). Volume has started to gradually decrease after the initial breakout. • Solution (Strategy): Wait or Scalping. Strategy: Don't chase the price now (FOMO). The currency is up +93% in one day, meaning a correction could be sharp. Entry Point: Wait for the price to pull back to the strong support zone at 0.2500-0.2550. Target 1 (TP1): 0.2700. Target 2 (TP2): 0.2850. Stop Loss (SL): 15-minute candle closes below 0.2400. #WSOT2026 #WSOTPicktoEarn10U #BybitAIEvolving #مراقبة سوق الانتخابات النصفية @

$ADA | Innovation attracts attention, but adoption is what gives a blockchain lasting relevance. Cardano takes a research-driven approach to development, using its Proof-of-Stake consensus mechanism to secure the network while supporting a growing smart contract ecosystem. Three areas deserve attention: → DeFi growth and active applications. → Developer activity and on-chain usage. → Governance participation and ecosystem expansion. The key challenge is converting technical progress into consistent user demand. For ADA, real adoption matters more than development headlines. #ADA #Cardano #Blockchain #Bybit #ByX #MidtermsMarketWatch
$BTC | Bitcoin's real strength goes beyond price. It's built on scarcity, security, and decentralization. With a fixed maximum supply of 21 million BTC, Bitcoin operates through a Proof-of-Work system that protects its network without central control. What matters now: → Institutional demand and capital flows. → ETF activity and broader market sentiment. → Whether buyers can defend key support levels. Entry zones to monitor: → $75K–$77K: Potential support area. → $72K–$74K: Deeper pullback zone. → $80K–$82K: Recovery and confirmation area. These are observation zones, not guaranteed entry signals. Wait for price confirmation before considering a spot position. Scarcity creates the foundation. Demand drives the market. #BTC #Bitcoin #Bybit #ByX #MidtermsMarketWatch

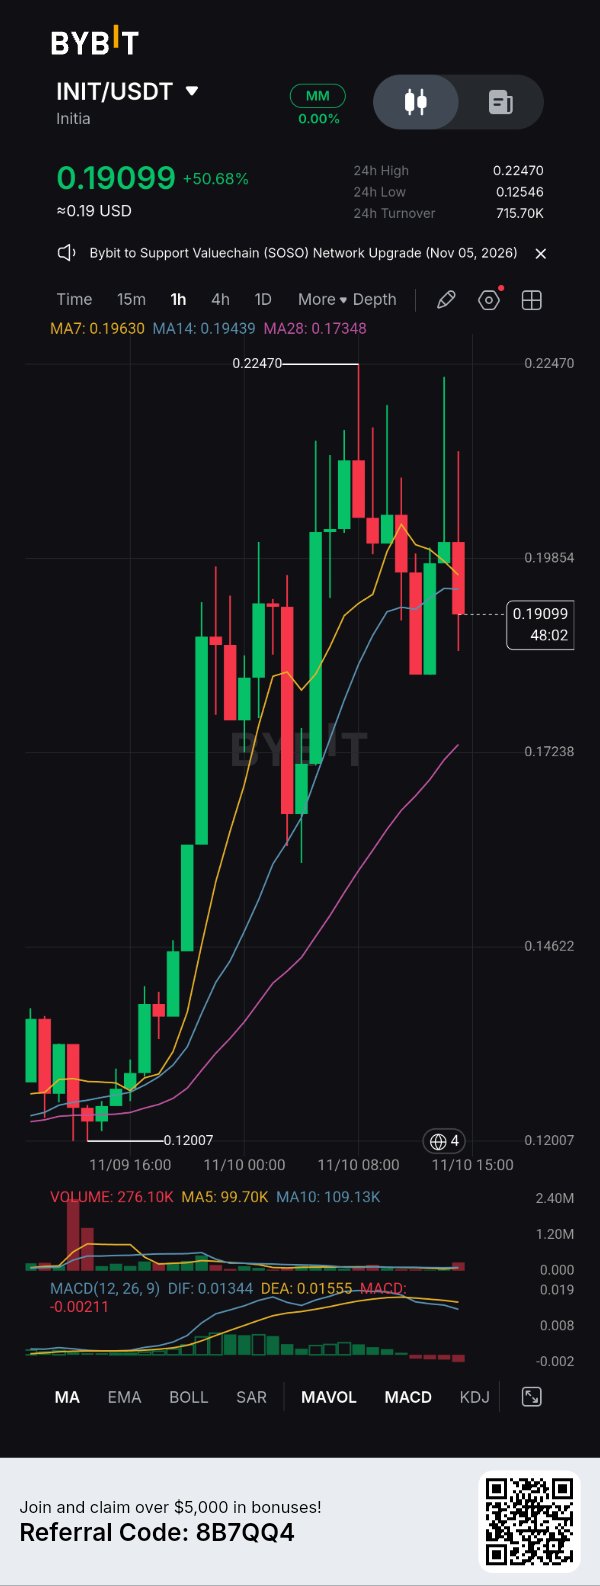
🚀 $INITUSDT: +50.68% — BUT THE NEXT MOVE COULD BE MORE INTERESTING THAN THE RALLY! Some traders celebrate a 50% move. Others immediately start asking one question: Who's still buying after the big move? 💰 Current price: $0.19099 📈 24H change: +50.68% 🔝 24H high: $0.22470 🔻 24H low: $0.12546 💵 24H turnover: $715.70K 🧾 THE RALLY AUDIT INIT has made an impressive move, climbing from the lower price region towards $0.22470 before pulling back. That tells us buyers have demonstrated considerable strength, but the rejection from the high deserves attention. The market is now deciding whether this is simply a cooling-off period or the beginning of a deeper correction. 🔍 WHAT THE INDICATORS SAY Moving averages: - MA7: $0.19630 - MA14: $0.19439 - MA28: $0.17348 Price is currently below MA7 and MA14 but remains above MA28. The broader recovery structure is still visible, although short-term pressure has increased. MACD: - DIF: 0.01344 - DEA: 0.01555 - Histogram: -0.00211 DIF has crossed below DEA, with a negative histogram. Short-term momentum is weakening. Volume: - Current: 276.10K - MA5: 99.70K - MA10: 109.13K Current volume is above both averages. That means activity remains elevated, but volume alone cannot tell us whether buyers or sellers will control the next move. 🎯 THE LEVELS ON MY RADAR 🟢 $0.19854: First important recovery area. 🚀 $0.22470: Previous high. A convincing breakout with sustained buying could reopen the upside. 🛡️ $0.19439–$0.19000: Area to monitor for a potential recovery attempt. 🔻 $0.17348: MA28, an important deeper support reference. A sustained move below this region would weaken the current recovery structure. 🧠 THE TRADER'S VERDICT INIT has already delivered a major move. The temptation now is to jump in because the chart looks exciting. But experienced traders know that missing an entry is better than forcing one. I'm watching for price to reclaim the short-term averages, MACD to improve and buying volume to support the recovery. The first rally gets attention. The next move reveals who really has control. INIT traders, are you waiting for a fresh breakout above $0.22470 or looking for a healthier pullback before considering an entry? 👀 Analysis based on the supplied 1H chart. These are technical observations, not guaranteed predictions or financial advice. #IMPACTbyTrade #BybitAIEvolving #WSOTPicktoEarn10U #MidtermsMarketWatch


SUI
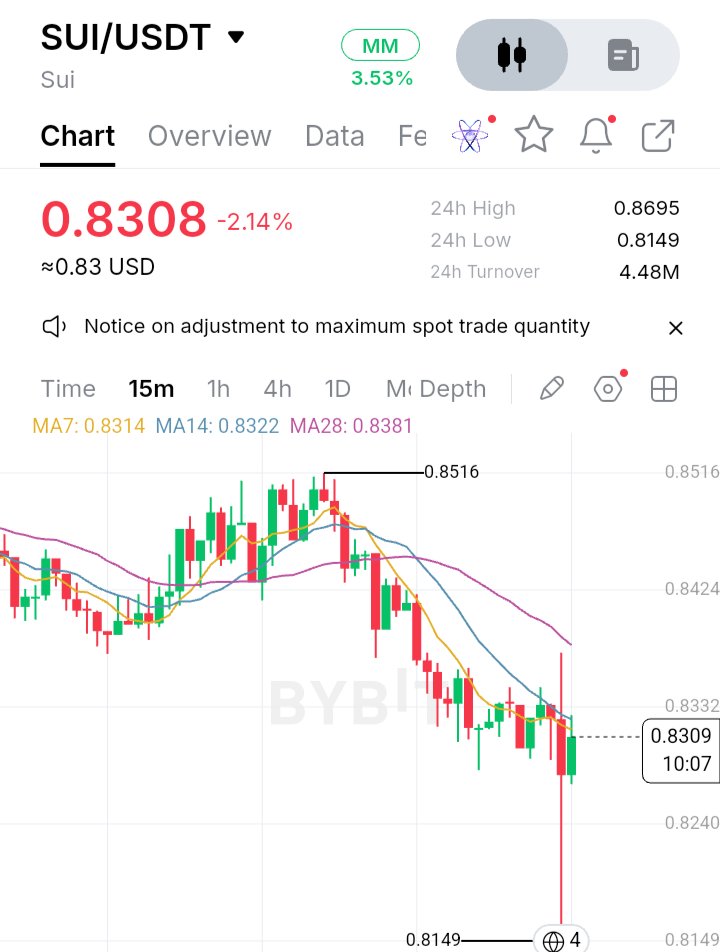
$SUIUSDT I used to think a falling price automatically meant sellers were winning. But looking at SUI's latest 15-minute chart, I'm paying closer attention to what happens after a sharp sell-off. SUI is trading around $0.8308, down 2.14%, after losing momentum from its recent high near $0.8516. What caught my attention is the aggressive downside move followed by a long lower wick reaching $0.8149. That wick is worth watching. It suggests price moved significantly lower before recovering, indicating that buyers responded at those levels. However, I wouldn't call it a confirmed reversal just yet. Another detail reinforces the cautious outlook. SUI is trading below its MA7 at $0.8314, MA14 at $0.8322 and MA28 at $0.8381. This alignment shows that short-term momentum remains under pressure. For me, $0.8149 is the important downside reference, while $0.8381 is the level bulls need to reclaim to improve the short-term structure. I want to see whether buyers can turn this initial reaction into sustained recovery. A single lower wick can attract attention, but follow-through is what gives it meaning. I'm watching the next few candles closely. #MidtermsMarketWatch #WSOTPicktoEarn10U #NovUSCPIWatch


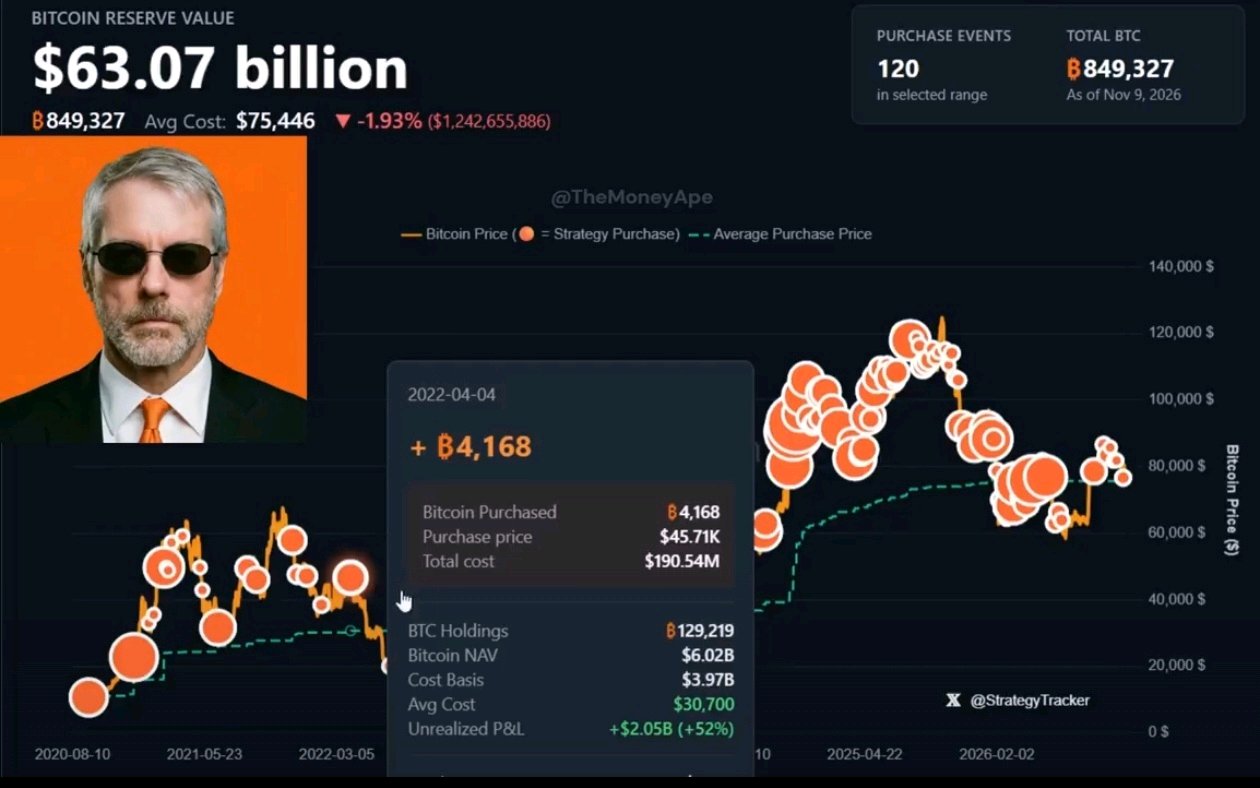
🚨 THE BIGGER THEY SELL, THE MORE SAYLOR BUYS! 🚀
1,037 $BTCUSDT added to the bag worth $77.60 MILLION! 💰 Strategy now holds a massive 850,364 BTC. While paper hands panic and sell, the long-term believers keep accumulating. 🔥 Every dip is an opportunity. 🔥 Every sell-off creates accumulation. 🔥 Bitcoin supply keeps getting tighter. FOR EVERY SELLER, THERE IS SAYLOR. 🧡 THE BTC BULLS ARE NOT DONE YET! 🚀📈 #WSOT2026 #WSOTPicktoEarn10U #MidtermsMarketWatch
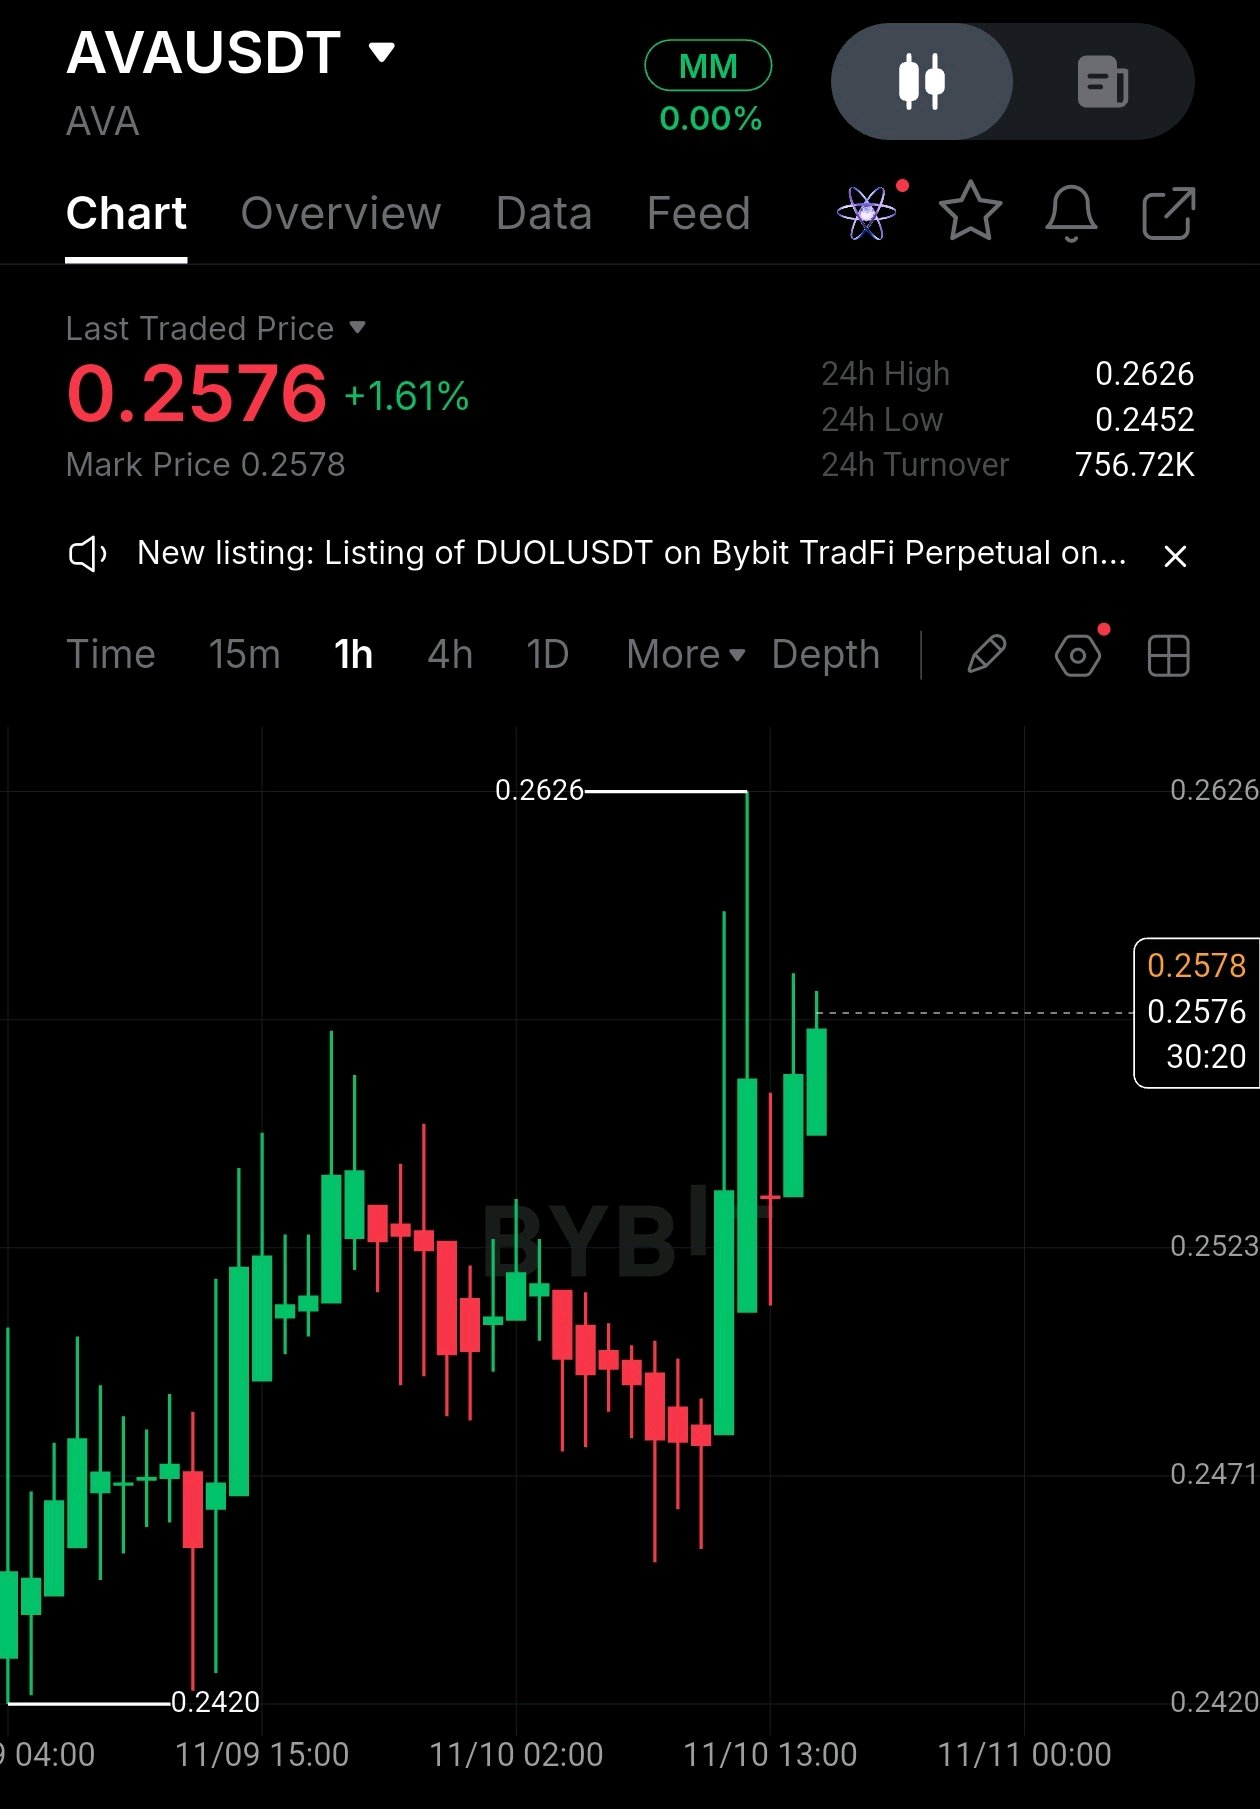
Guys, I'm watching a LONG setup on $AVA here. 👀🔥 $AVAUSDT | Perp 🎯 TP: 0.2620 🛑 SL: 0.2518 📍 Entry Zone: 0.2545 – 0.2560 What I like here is not just the bullish momentum, it's the way price reacted after the recent selling pressure. Sellers tried to push AVA lower, but buyers stepped in aggressively around the 0.2470–0.2480 area. Look at that recovery! 💥 Strong bullish candles appeared, pushing price back toward 0.2576. This suggests buyers are gaining control in the short-term structure. Now, the important resistance is around 0.2626. That's the previous high, and liquidity could be sitting above that level. Market makers may look toward that area if buying pressure continues. So my mindset is simple: If AVA holds above 0.2545 and buyers maintain momentum, I'm watching for another move toward 0.2620. A clean 1H breakout above 0.2626 could open the door for further upside. But if price loses 0.2520, the bullish setup becomes weak, and a deeper correction could follow. I'm not interested in chasing random green candles. I want to see how price reacts around the important levels. Patience first, execution second. 😮💨📈 What do you think? 👇 Is $AVA heading toward 0.2620 and a breakout, or are we getting a correction first? 🚀 #NovUSCPIWatch #MidtermsMarketWatch

PEPE Is Still on My Watchlist…🐸!!
Honestly, I think $PEPEUSDT is one of those coins people either love or completely ignore. When the market is green, everyone talks about it. When the market turns red, most people disappear. But here's what I'm curious about… Will PEPE surprise everyone again in the next bull run, or has its biggest moment already passed? I'm watching, not predicting. What's your opinion on PEPE? $HYPEUSDT #USPayrollsAndRateDecisionsDriveMacroWeek #MidtermsMarketWatch #Oracle20BFundingPlanTestsTheAITrade #WSOT2026 #OilVolatilityTracksIranPeaceTalks


$INJUSDT is up 10.34% over the last 7 days, but its derivatives market is telling a less convincing story: futures volume reached $235.69M against just $33.12M in spot volume on November 10. That is a 7.1x difference. The rally is attracting traders, but genuine spot demand is not keeping pace. There is a fundamental reason INJ remains interesting. According to its September 2026 SEC filing, Injective had approximately 90,000 daily active wallets during Q3 and had facilitated more than $75B in cumulative spot trading volume. Its community buyback mechanism also connects application-generated fees with INJ accumulation and redistribution. However, adoption does not automatically translate into immediate price appreciation. The current market structure needs attention. INJ is trading around $8.02, with a 24-hour range of $7.82–$8.29. Meanwhile, aggregate futures open interest has declined 5.42% to approximately $149.39M. For the next 24–72 hours, watch the $8.25 resistance zone. A convincing breakout with stronger spot participation could open $8.55, followed by $8.80. On the downside, $7.82 is the immediate support. A decisive break below it invalidates the recovery setup. Risk: leveraged positioning could unwind before spot buyers step in. INJ needs real spot demand to validate this recovery. Until then, the rally remains vulnerable to a derivatives-driven reversal. #MidtermsMarketWatch


NVDAXUSDT Bottom Formation & Resistance Retest
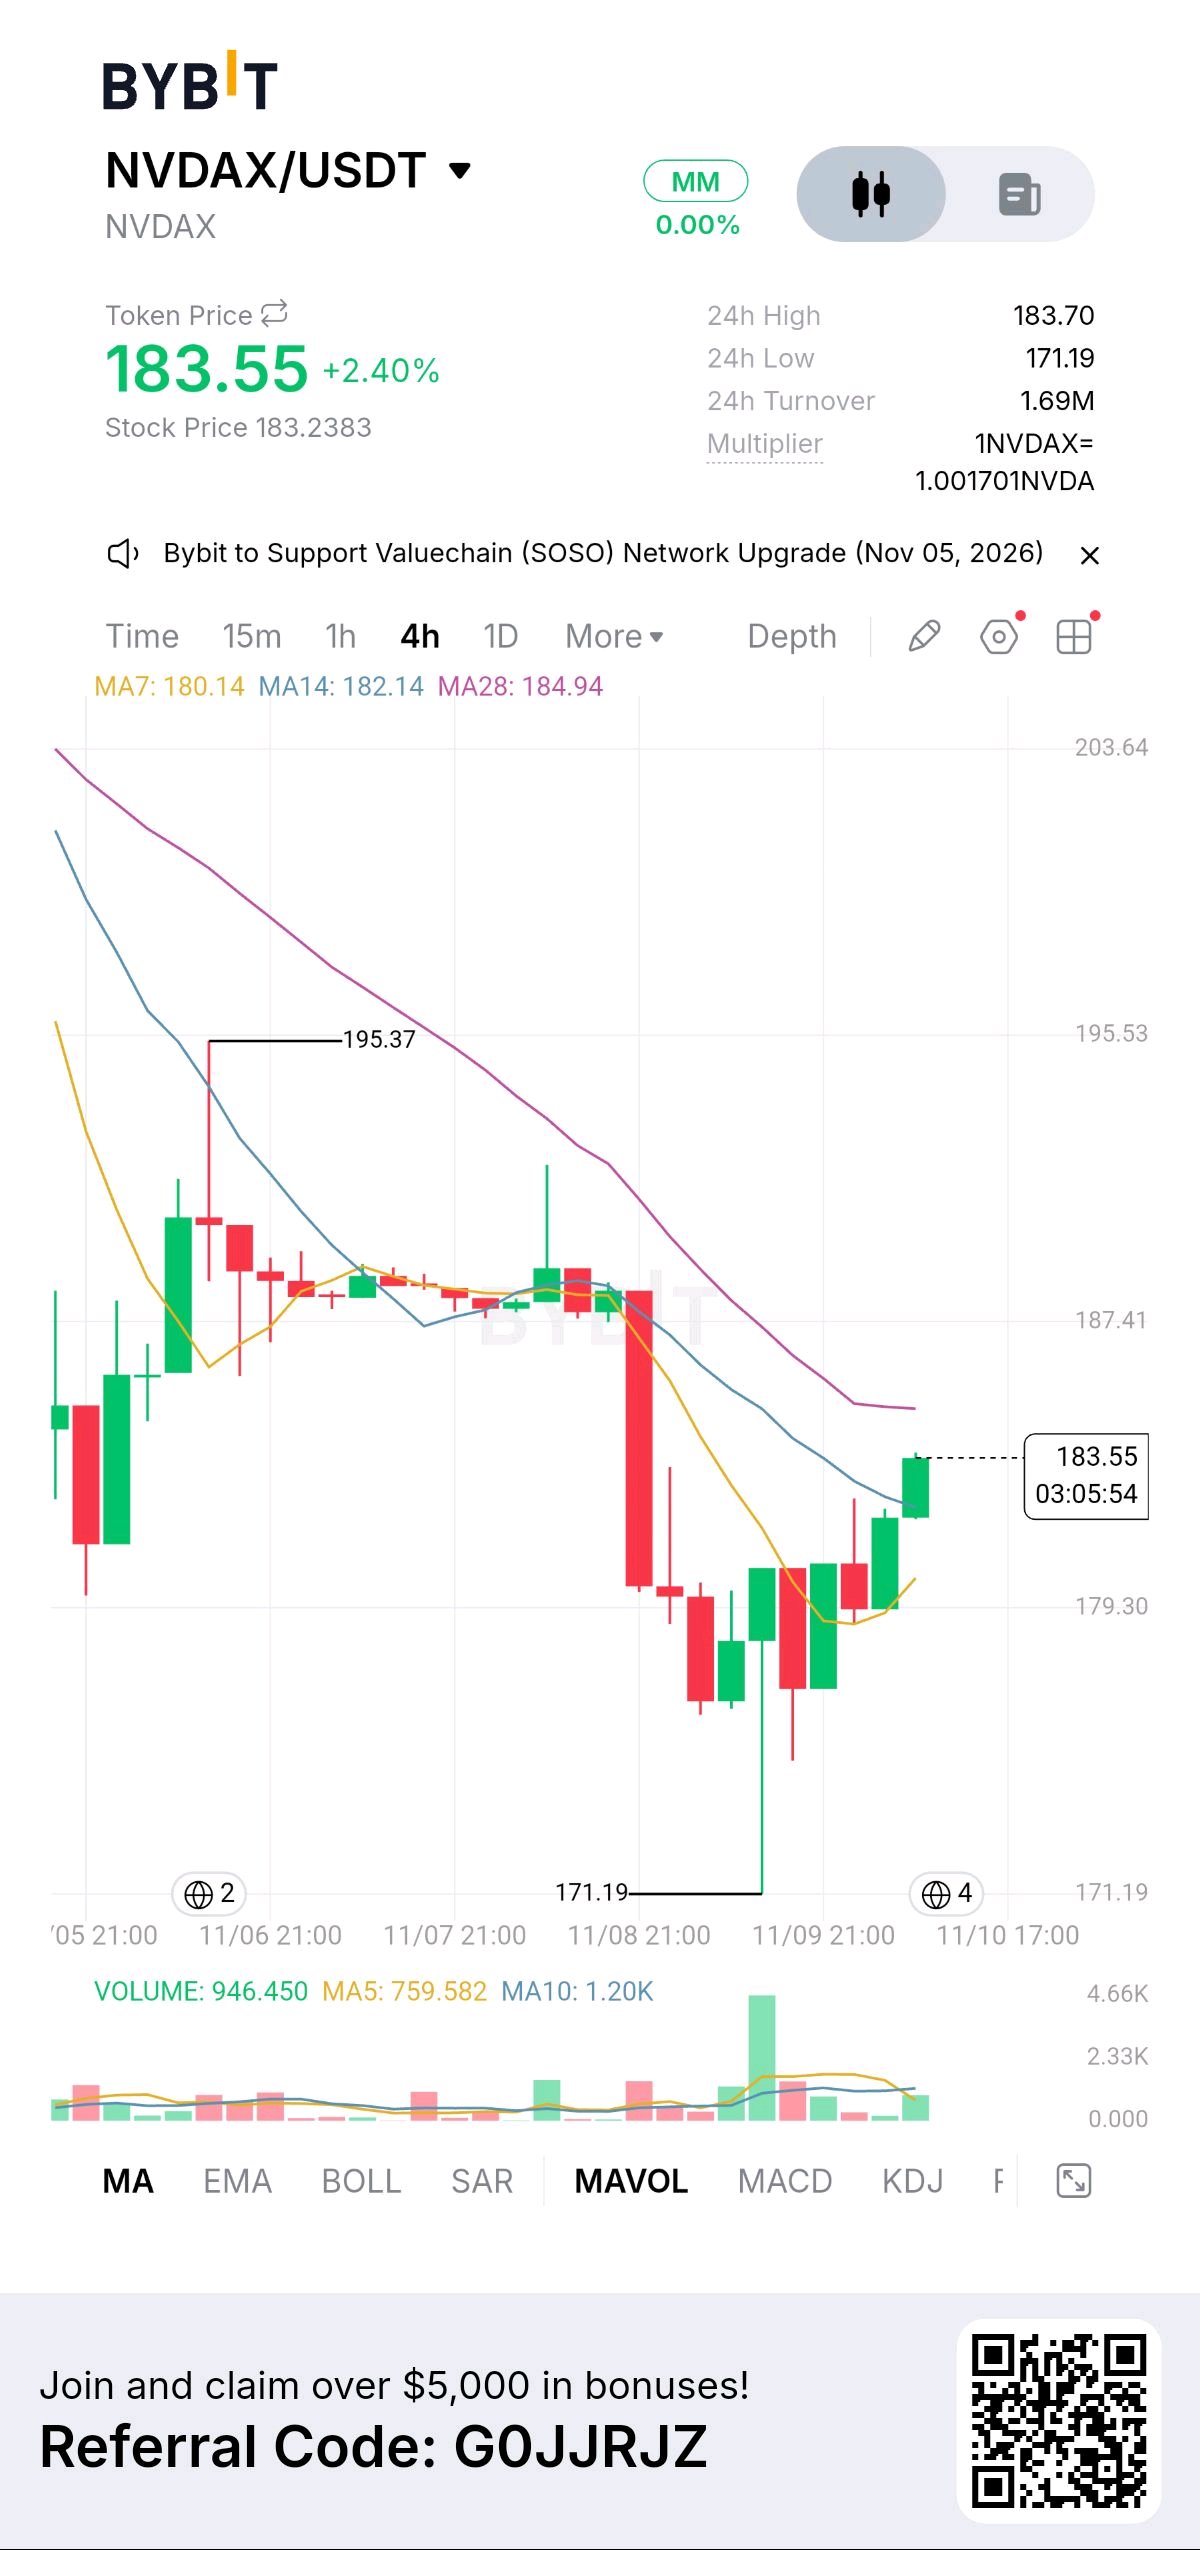
📈 $NVDAXUSDT is showing signs of a potential trend reversal on the 4-hour timeframe, currently trading at 183.55 (+2.40%). After a prolonged downtrend, the asset established a sharp local support floor at 171.19 and has staged a steady recovery, now testing immediate overhead resistance. ▪️ Technical Setup: The asset is attempting to reclaim its short-term moving averages. The price is currently trading above the MA7 (180.14) and MA14 (182.14), but faces immediate pressure from the MA28 at 184.94. The tight cluster of these MAs suggests a consolidation phase before the next major move. ▪️ Indicators: 24h turnover stands at 1.69M with a 24h low of 171.19. The volume profile shows a notable spike in buying volume during the initial bounce from the floor, indicating buyers are actively stepping in to defend the 180.00 psychological level. ▪️ Outlook: A clean 4-hour close above the 184.94 (MA28) ceiling is critical to confirm a bullish continuation toward the previous high of 195.37. Conversely, if rejected here, the price may retest the MA7 dynamic support to build further momentum. ⚠️ Risk Disclosure: High-volatility markets can experience rapid price swings. This analysis is for educational purposes only and does not constitute financial advice. #WSOT2026 #BybitAIEvolving #MidtermsMarketWatch


اخبار،
🇺🇸 وول ستريت تخسر.. هل أوروبا تكسب؟ 🇪🇺 مع استمرار الضغوط على أسهم الذكاء الاصطناعي الأمريكية، تتجه الأنظار إلى البورصات الأوروبية! Cap..ital Econ..omics تتوقع تفوق أوروبا نسبيًا إذا استمر انكماش فقاعة الذكاء الاصطناعي، بفضل تنوع قطاعاتها وقلة اعتمادها على عمالقة التكنولوجيا. فهل أوروبا هي الفرصة القادمة؟ #مراقبة سوق الانتخابات النصفية $NVDAXUSDT $XRPUSDT




$NIGHT: Breakout at the $0.0435 Line
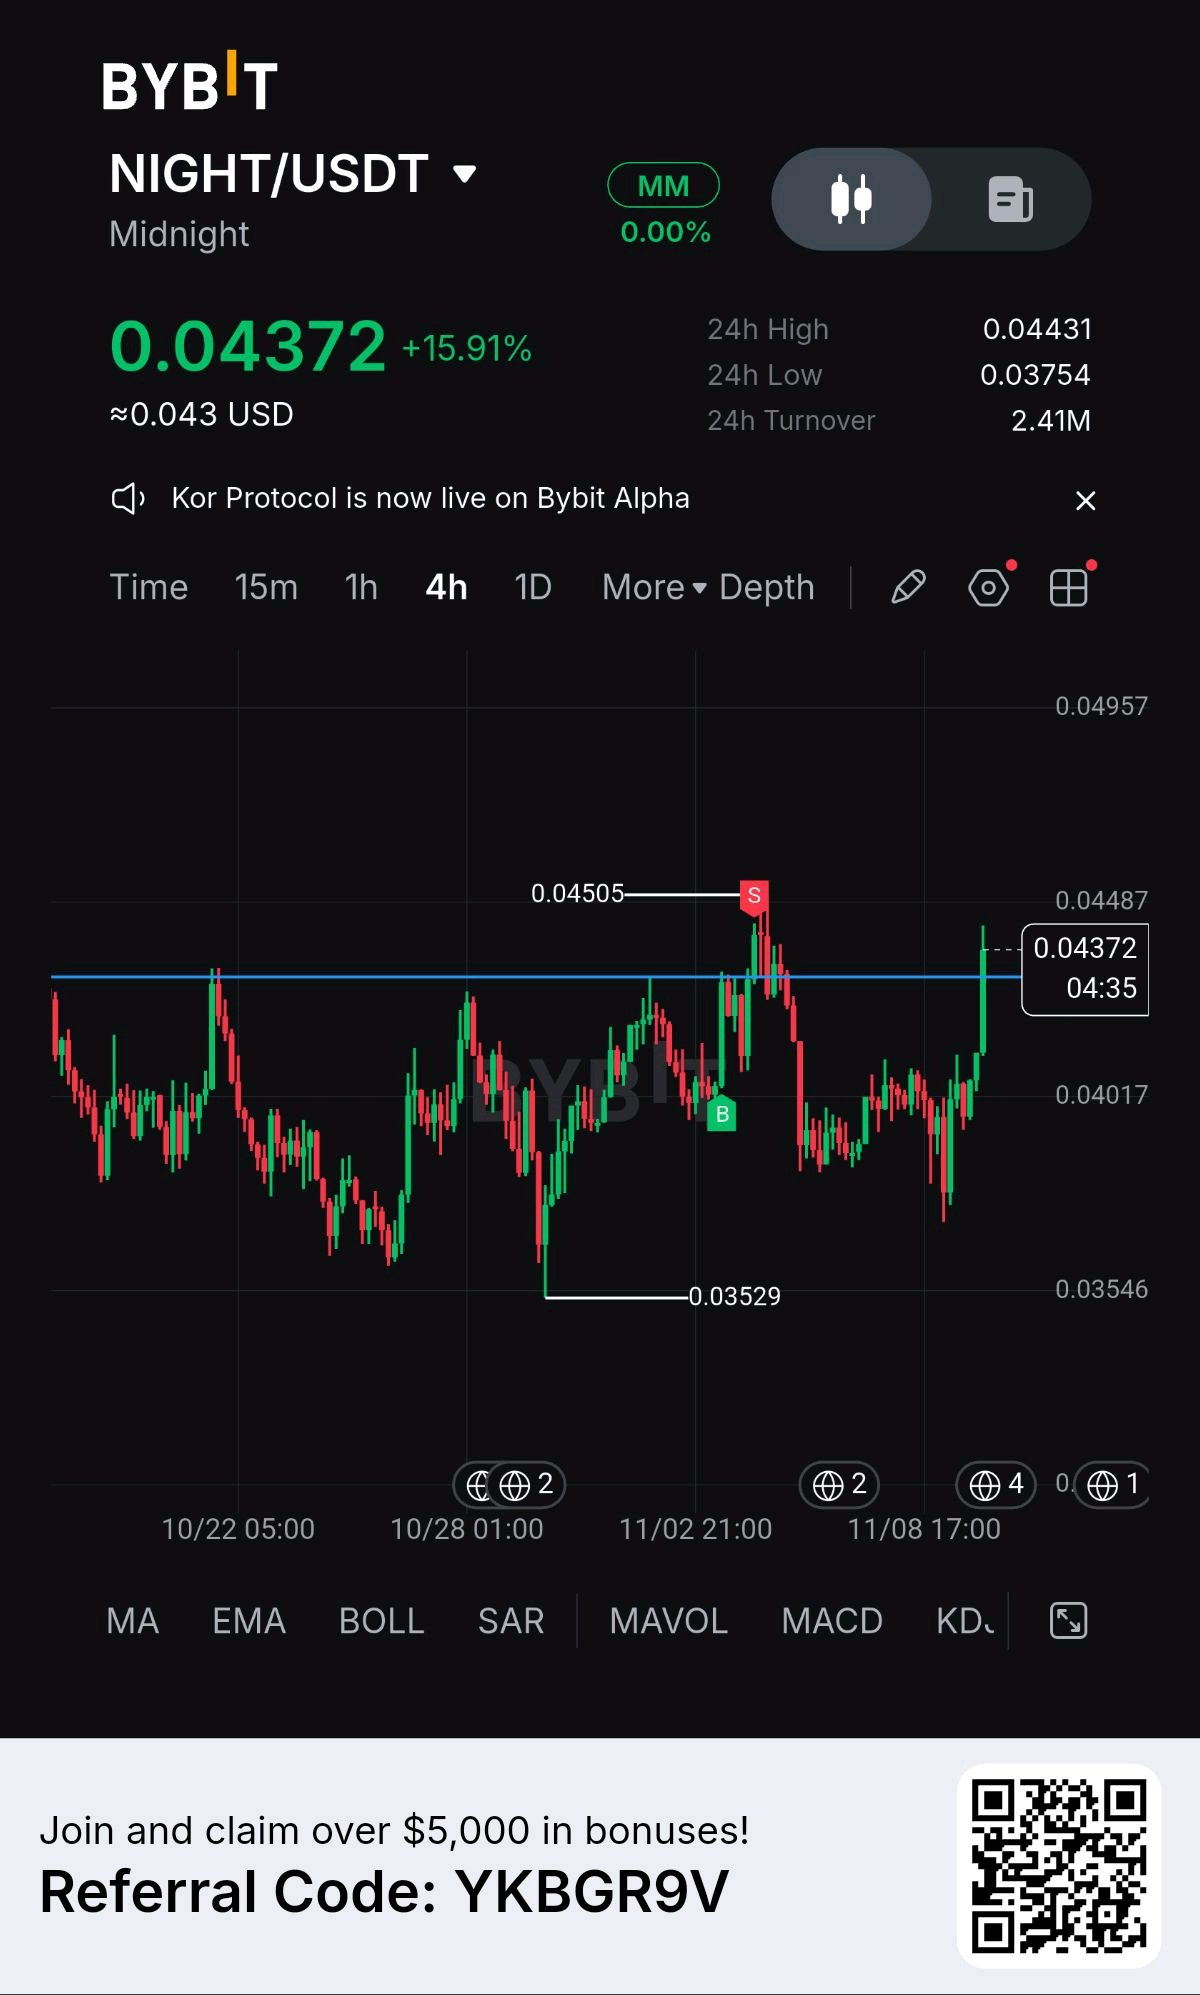
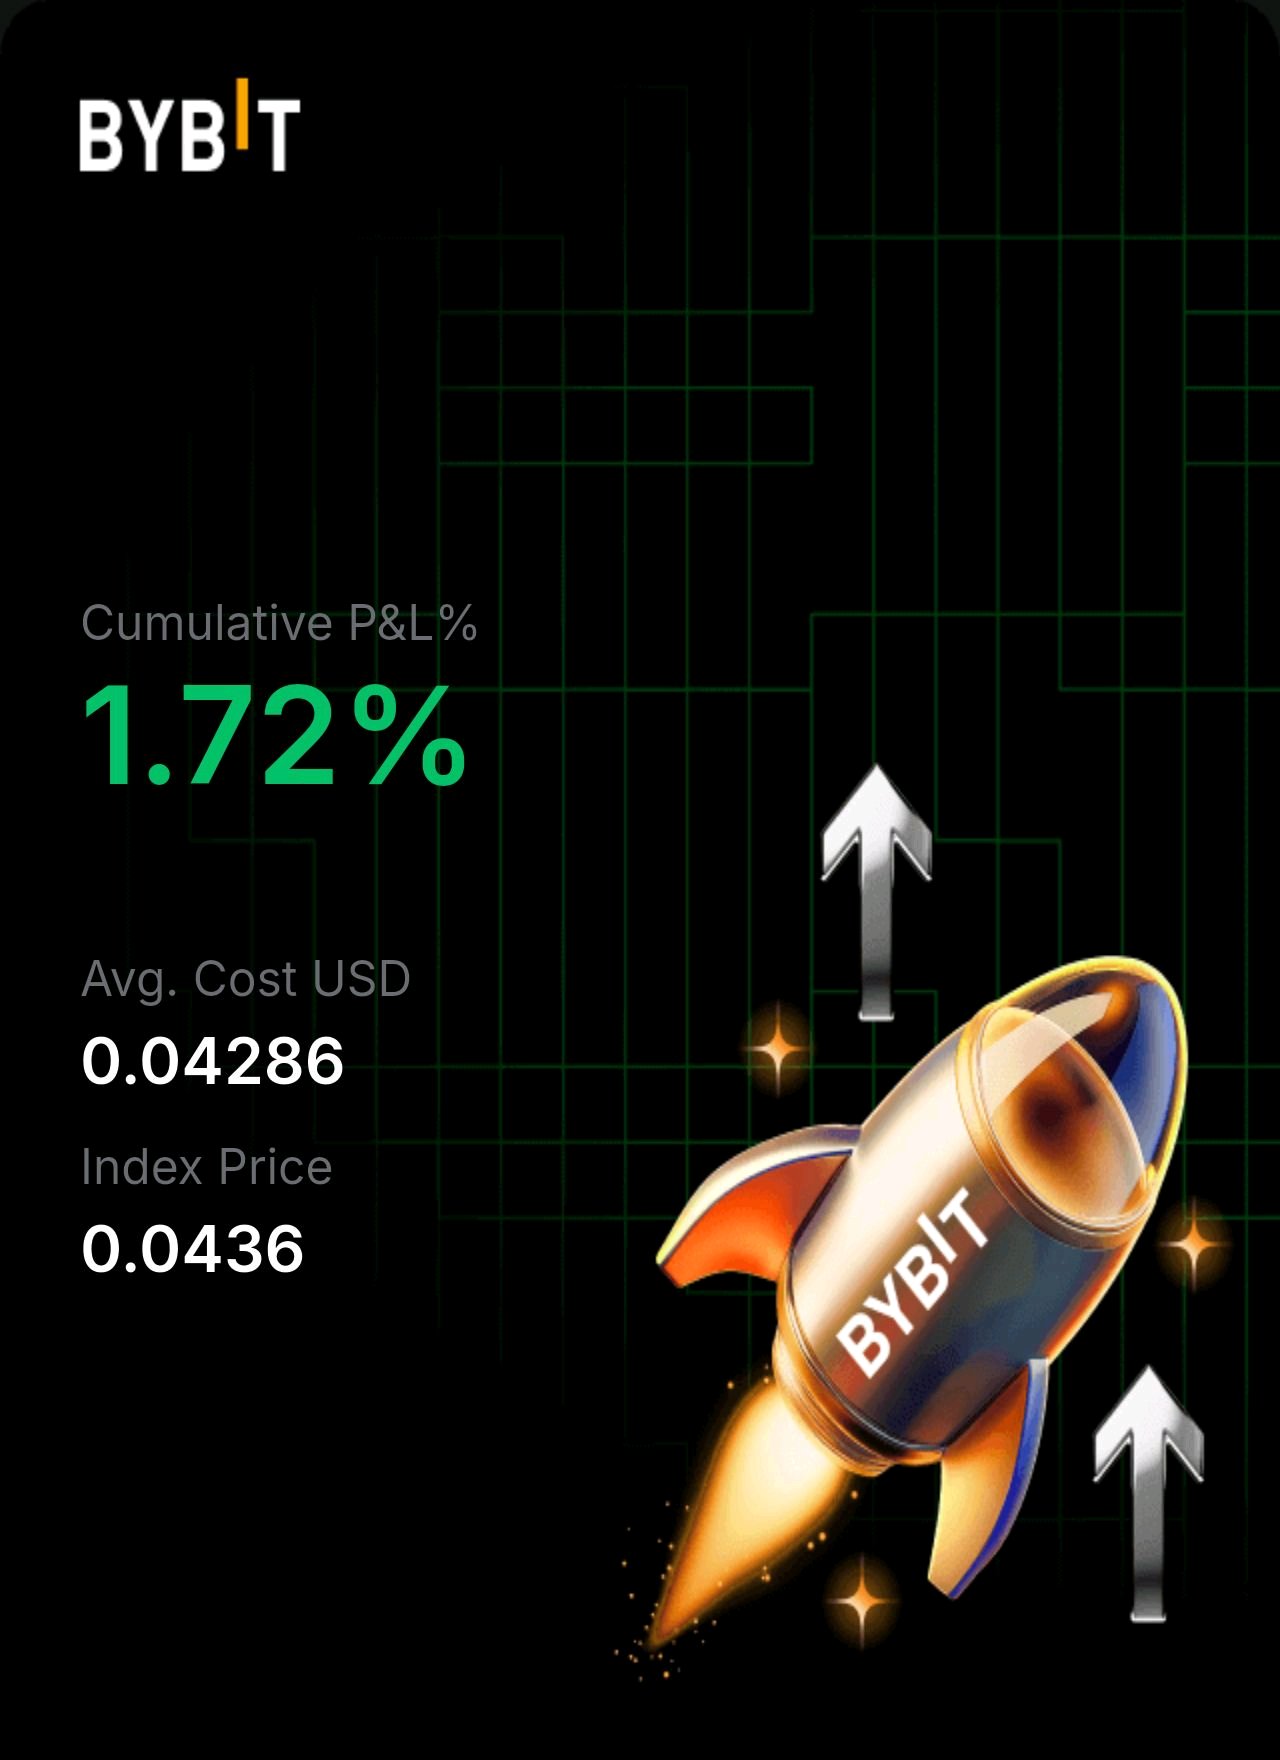
$NIGHT is up almost 16% and pressing against the same resistance that has capped it for two weeks. I'm holding a moonbag, so this level matters to me. What the 4H chart shows: Price is $0.04372 after bouncing from a 24h low of $0.03754. The bounce came with a strong green candle that pushed right into the $0.0435 area, which is the horizontal line that stopped the last two rallies. The high from Nov 4 to 5 was $0.04505, and the swing low is $0.03529 from late October. Price is still inside a two-week range, so this is a test of resistance, not a confirmed breakout. 24h turnover is $2.41M. What's happening: The news flow is strong. Charles Hoskinson said on Nov 8 that Midnight could surpass Cardano's market cap, and that kind of headline fuels speculation. On the fundamentals side, Midnight completed its Ledger 9 mainnet upgrade on Nov 6, adding tools for private cross-chain deposits. The Sig Network launched on Oct 29 to bring Ethereum assets in, and the mainnet has passed one million transactions. Monument Bank's plan to tokenize up to £250M in deposits on Midnight was delayed to November, so it is a potential catalyst this month. About 16.6B of the 24B NIGHT supply is circulating, so the market cap is over $700M. NIGHT is still more than 60% below its $0.1179 record. China and the global backdrop: China's Q3 GDP grew 4.5%, beating forecasts, and the yuan hit a 4-year high. For China, that means steadier policy and less need for emergency stimulus. For the world, stronger Asian growth supports risk appetite, and Asian exchange access matters for NIGHT, which listed on Japan's OKCoinJapan on Oct 13 and on S.BLOX, run by a Sony Group company, in August. The link is indirect, since China restricts crypto trading, and the beat is export-led with retail sales up only 1.1%. NIGHT trades closely with Cardano, so ADA and the Fed matter more than China data. Key levels: Support: $0.04017 first, then $0.03754 (the 24h low), then $0.03529 (the late-October low). Resistance: $0.0435 to $0.0440 first, then $0.04505, then a long gap toward the $0.0600 area before the $0.1179 record. I want a 4H close above $0.04505 on rising volume before I call this a real breakout. Scenarios: Bull: the Monument Bank launch or other Midnight news lands, buyers hold above $0.0435, and NIGHT breaks $0.04505. Base: NIGHT keeps ranging between $0.0375 and $0.0450 as the market waits for catalysts. Bear: the breakout fails at $0.0435, $0.04017 breaks, and NIGHT retests the $0.0375 to $0.0353 zone. Honest risk: the final thaw of the Glacier Drop and Scavenger Mine allocations ends around Nov 29 to Dec 4 (sources differ), which could add selling pressure from holders who have waited a year. Holder concentration on BNB Chain is also very high, and a 16% pump on a headline can reverse fast. Not financial advice. Will you hold the moonbag through the unlock? $NIGHTUSDT $SUIUSDT #WSOT2026 #WSOTPicktoEarn10U #NovUSCPIWatch #MidtermsMarketWatch

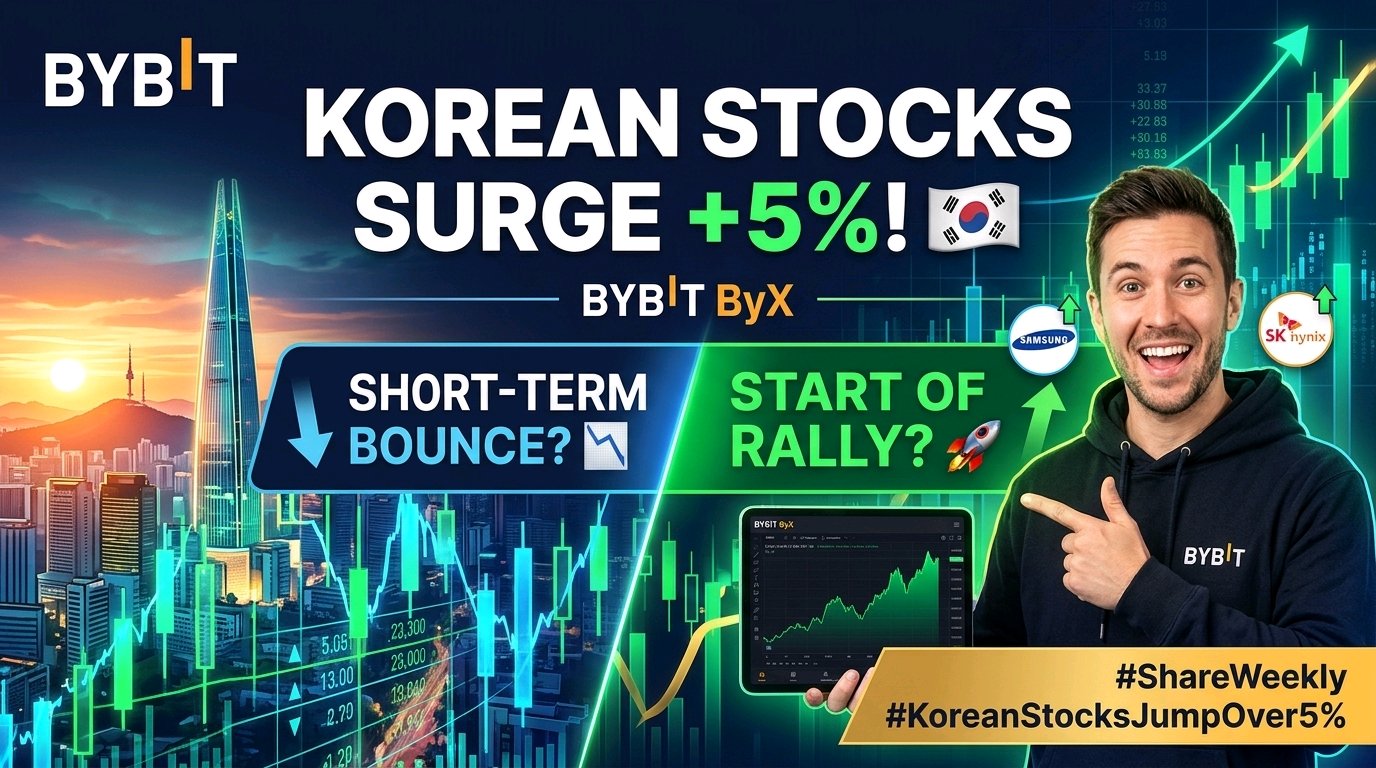
🚨 Today's Hot Topic | Korean Stocks Rebound: A Paradigm Shift or a Fleeting Bounce? The financial markets are buzzing as the KOSPI surged over 5% intraday, spearheaded powerhouse market leaders like Samsung Electronics and SK Hynix! Such a dramatic, high-volume upward movement has naturally ignited a fierce debate across global trading desks: Is this explosive move merely a short-term relief bounce, or is it the definitive kickoff of a major new structural rally? 📊 Deconstructing the Rally: Key Drivers Tech & Semiconductor Momentum: Samsung Electronics and SK Hynix are at the epicenter of global memory and AI-driven hardware demand. When these giants move violently to the upside, it acts as a massive liquidity wave lifting the entire index. Macro Sentiment & Institutional Flows: The sharp intraday reversal signals aggressive institutional accumulation. Are foreign capital flows returning to Asian equities, or are short-sellers aggressively unwinding positions? The Crypto & Tokenized Asset Correlation: In today's interconnected macro ecosystem, explosive liquidity in traditional equities often spills over into risk-on crypto assets, bridging traditional finance (TradFi) and decentralized finance (DeFi) sentiment. 🔍 Market Outlook: Short-Term Trap vs. Structural Bull Run The Bearish Case (Short-Term Bounce): Macro headwinds, fluctuating currency dynamics, and global liquidity tightening suggest this could be a classic "dead cat bounce" or liquidity sweep before another consolidation phase. Prudent traders are watching key resistance levels closely. The Bullish Case (New Rally Start): If this 5%+ surge breaks multi-week resistance structures with sustained volume, we could be witnessing the bottoming process and the early accumulation phase of a prolonged multi-month trend. 💬 Where Do You See the Best Opportunities ? How are you positioning your portfolio amidst this volatility? Are you scaling into tech majors, hedging your downside, or rotating capital into high-beta altcoins tracking the broader risk-on sentiment? Drop your trading strategies, analysis, and price targets in the comments below! 👇 #WSOT2026 #MidtermsMarketWatch $BTCUSDT $ETHUSDT

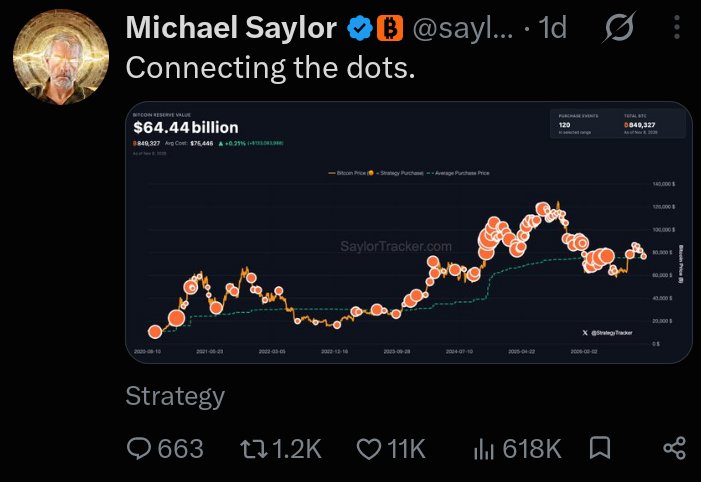
Michael Saylor dropped another Bitcoin tease!
"Connecting the dots" The Strategy chairman's latest X post has sparked speculation about another potential $BTCUSDT purchase. But there's a bigger story behind it. 🧵👇 🟠 Strategy reportedly holds 849,327 BTC, worth approximately $62.98 billion. 📉 Bitcoin falling below Strategy's average purchase price of $75,451 has pushed its holdings into roughly $1 billion in unrealized losses. Just a month ago, Strategy was reportedly sitting on nearly $10 billion in unrealized profits. A dramatic market reversal! 🐻 Bitcoin's Q4 2026 weakness is drawing comparisons with previous bearish cycles in 2014, 2018 and 2022. 📊 Analysts are also warning about weakening momentum, with BTC approaching its fifth consecutive weekly red candle. 💰 Despite the pressure, Strategy reportedly maintains $4.9 billion in USD reserves and recently acquired $208 million worth of STRC. 👀 Now everyone's watching Michael Saylor. Does "Connecting the dots" hint at another Bitcoin purchase? Or is it simply another message about his long term BTC conviction? One thing is clear that Strategy's Bitcoin strategy is facing another major market test. #IMPACTbyTrade #MidtermsMarketWatch

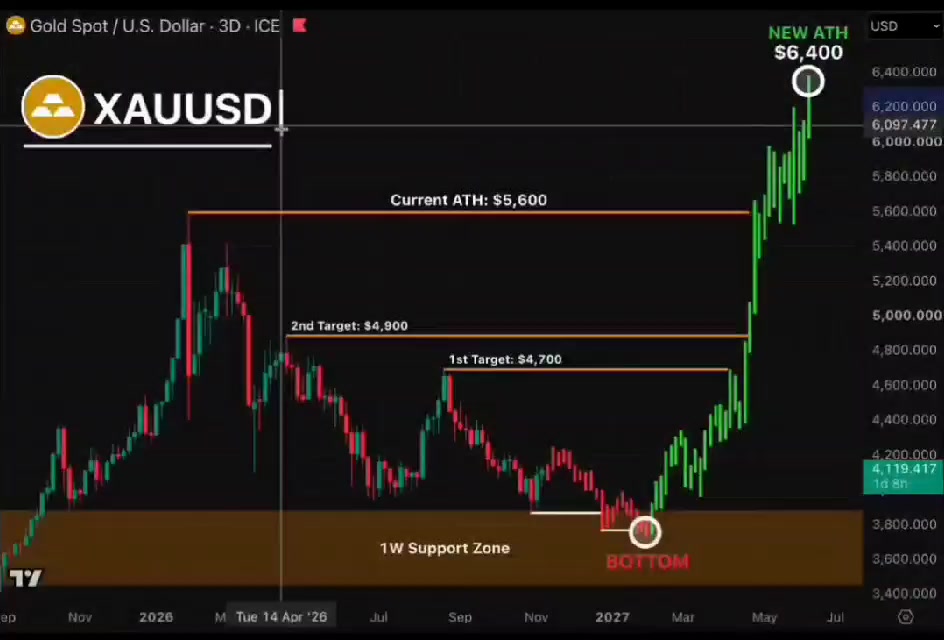
🚨 GOLD IS PREPARING ITS FINAL SHAKEOUT Gold is down ~30% from its $5,600 ATH. Everyone expects an even BIGGER crash I see the opposite: the last flush before the next leg up My roadmap: → $3,800-3,900: final wash into 1W support → CAPITULATION: weak hands get wiped out → $4,700 → $4,900: first targets → $5,600 → $6,400: breakout to NEW ATH That's a ~50% rise from the bottom to the old ATH Fear is building, weak hands are selling. This is exactly how major cycle bottoms form I'm not chasing here. I'm waiting for the capitulation $XAUTUSDT #MidtermsMarketWatch

Wait for Confirmation! 🚀
$MNTUSDT #WSOT2026 #WSOTPicktoEarn10U #BybitAIEvolving #MidtermsMarketWatch #Oracle20BFundingPlanTestsTheAITrade


Bitcoin's Historical Pattern Worth Watching
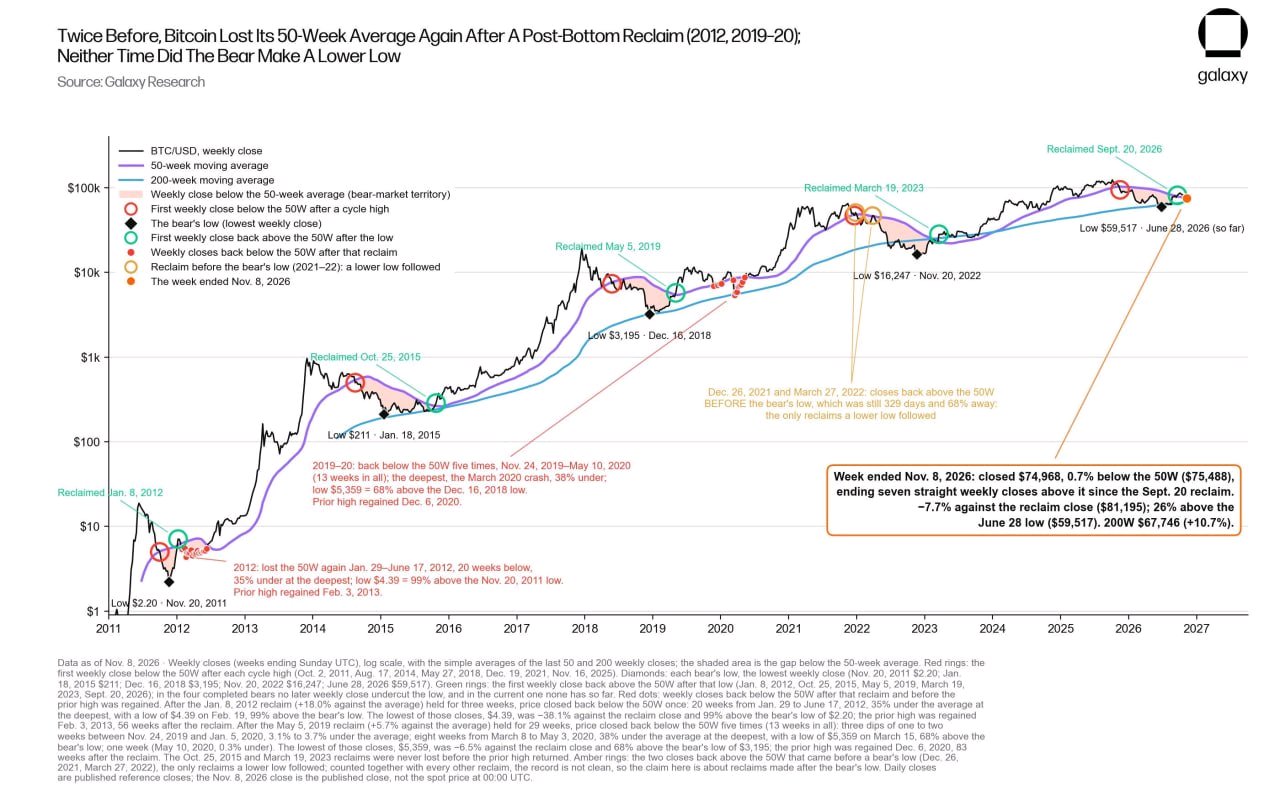
Bitcoin is back below its 50-week average, but the historical context is worth paying attention to. According to Galaxy’s Alex Thorn, the last two times $BTCUSDT lost this level after a bear-market bottom, it never made a lower low. A bearish-looking chart doesn't always lead to a bearish outcome. #NovUSCPIWatch #USPayrollsAndRateDecisionsDriveMacroWeek #BybitAIEvolving #BOERateDecision #MidtermsMarketWatch

$INIT MIGHT BE COOLING OFF
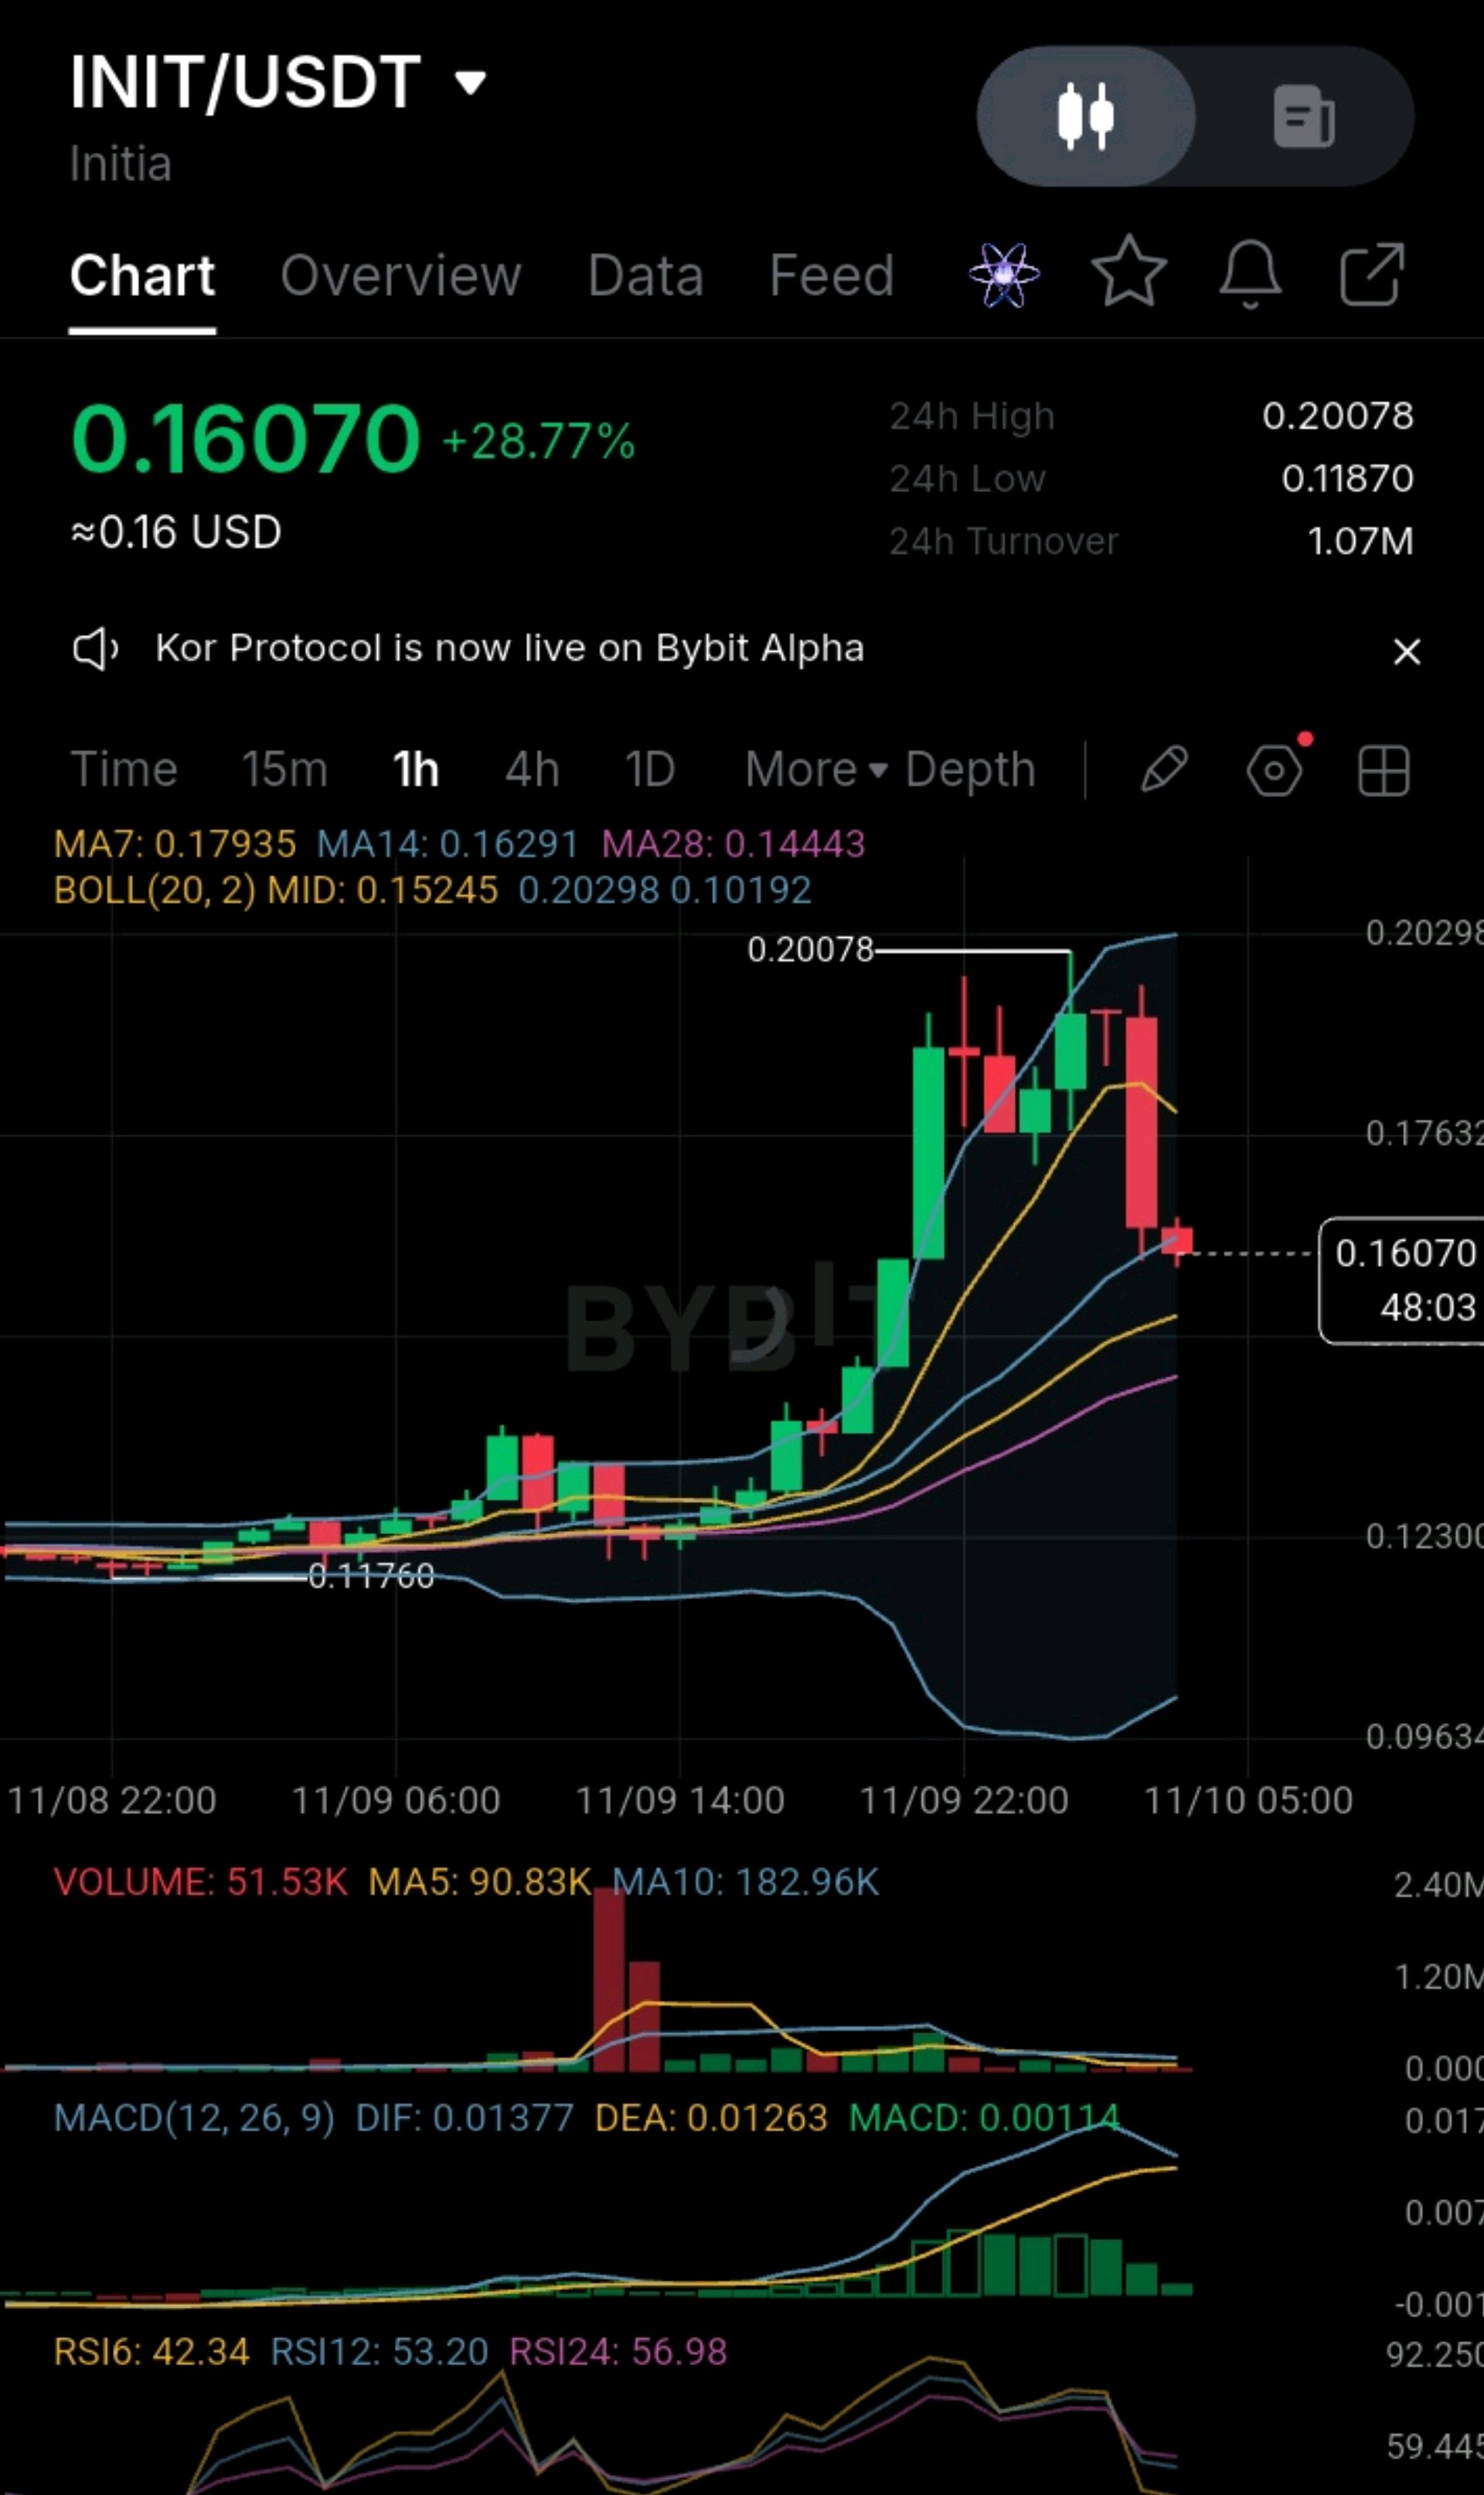
#ByXIMPACT #WSOTPicktoEarn10U #NovUSCPIWatch #MidtermsMarketWatch #BybitAIEvolving ⚡$INIT MIGHT BE COOLING OFF AFTER A BIG RUN. INITUSDT: A PULLBACK IS NOT A BREAKDOWN. HERE'S WHAT I'M WATCHING. 📊 $INIT has pulled back from 0.20078 to around 0.1607, losing its MA7 after a vertical breakout. But is this the start of a deeper reversal, or simply a healthy retest within a broader uptrend? That distinction is why I'm watching the next support levels as closely as the recent rejection. I'm not relying on red candles alone. I'm looking at market structure, moving-average alignment, momentum, volume, and the levels that would weaken or strengthen the bullish case. 1. MARKET STRUCTURE: PULLBACK AFTER A VERTICAL RUN Following the base near 0.1176, price ripped to a high of 0.20078 and was rejected with long upper wicks. The latest big red candle shows sellers have regained some short-term control, but the broader breakout structure still needs a break of support to be considered invalidated. 2. MOVING AVERAGES: A SHORT-TERM DETERIORATION At the time of the screenshot: MA7: 0.17935 MA14: 0.16291 MA28: 0.14443 Price has lost the MA7 and is testing the MA14, which is the near-term line to defend. However, it remains above the MA28 and the BB midline (0.15245), so the broader breakout structure has not been invalidated. 0.17935 is now the key resistance reference. 3. MOMENTUM AND VOLUME MACD is still positive (DIF 0.01377 vs DEA 0.01263), but the histogram is shrinking and DIF is curling over, so a bearish cross is close. RSI6 is around 42.34, while RSI12 is 53.20 and RSI24 is 56.98. This suggests short-term momentum has turned down faster than the broader readings. Displayed volume is approximately 51.53K, below the MA5 (90.83K) and MA10 (182.96K). The big volume came on the earlier candles, so the move is losing fuel. The current candle is still open, so judge it at the close. 4. KEY LEVELS AND INVALIDATION 🔹 0.20078: 24-hour high and major resistance. 🔹 0.17935: MA7; reclaiming it could strengthen the recovery case. 🔹 0.16291: MA14; the level being tested right now. 🔹 0.15245: Hourly middle Bollinger Band and the dip-entry area. 🔹 0.14443: MA28; a break below it would weaken the breakout structure. A sustained reclaim of the MA7 with stronger volume would support the bullish thesis. Rejection followed by a loss of the MA14 would call for reassessment. 5. THE REASON BEHIND THE TRADE Illustrative plan: a bounce entry around 0.1525-0.1560 (BB mid area), a stop-loss at 0.1440 below the MA28, and take-profit levels at 0.1629 and 0.1794. These are planned levels, not guaranteed outcomes. Risk only 1-2% of the account on the stop distance. Leverage magnifies both gains and losses. Unrealized P&L is not realized profit, and a large unrealized return does not eliminate reversal risk. Catching a falling knife between the MA14 and MA28 is poor risk/reward, so patience matters here. MY VIEW: INIT is showing a short-term pullback after a +28% day, but holding the MA14 and reclaiming the MA7 on volume would provide better evidence that the breakout is intact. Until then, confirmation matters more than prediction. 🤝 Community question: Do you think INIT will hold the MA14 at 0.1629 and retest 0.1794, or will fading volume send it down to the 0.1525 midline and 0.1444? $INITUSDT $INITUSDT This is technical analysis for discussion, not financial advice.

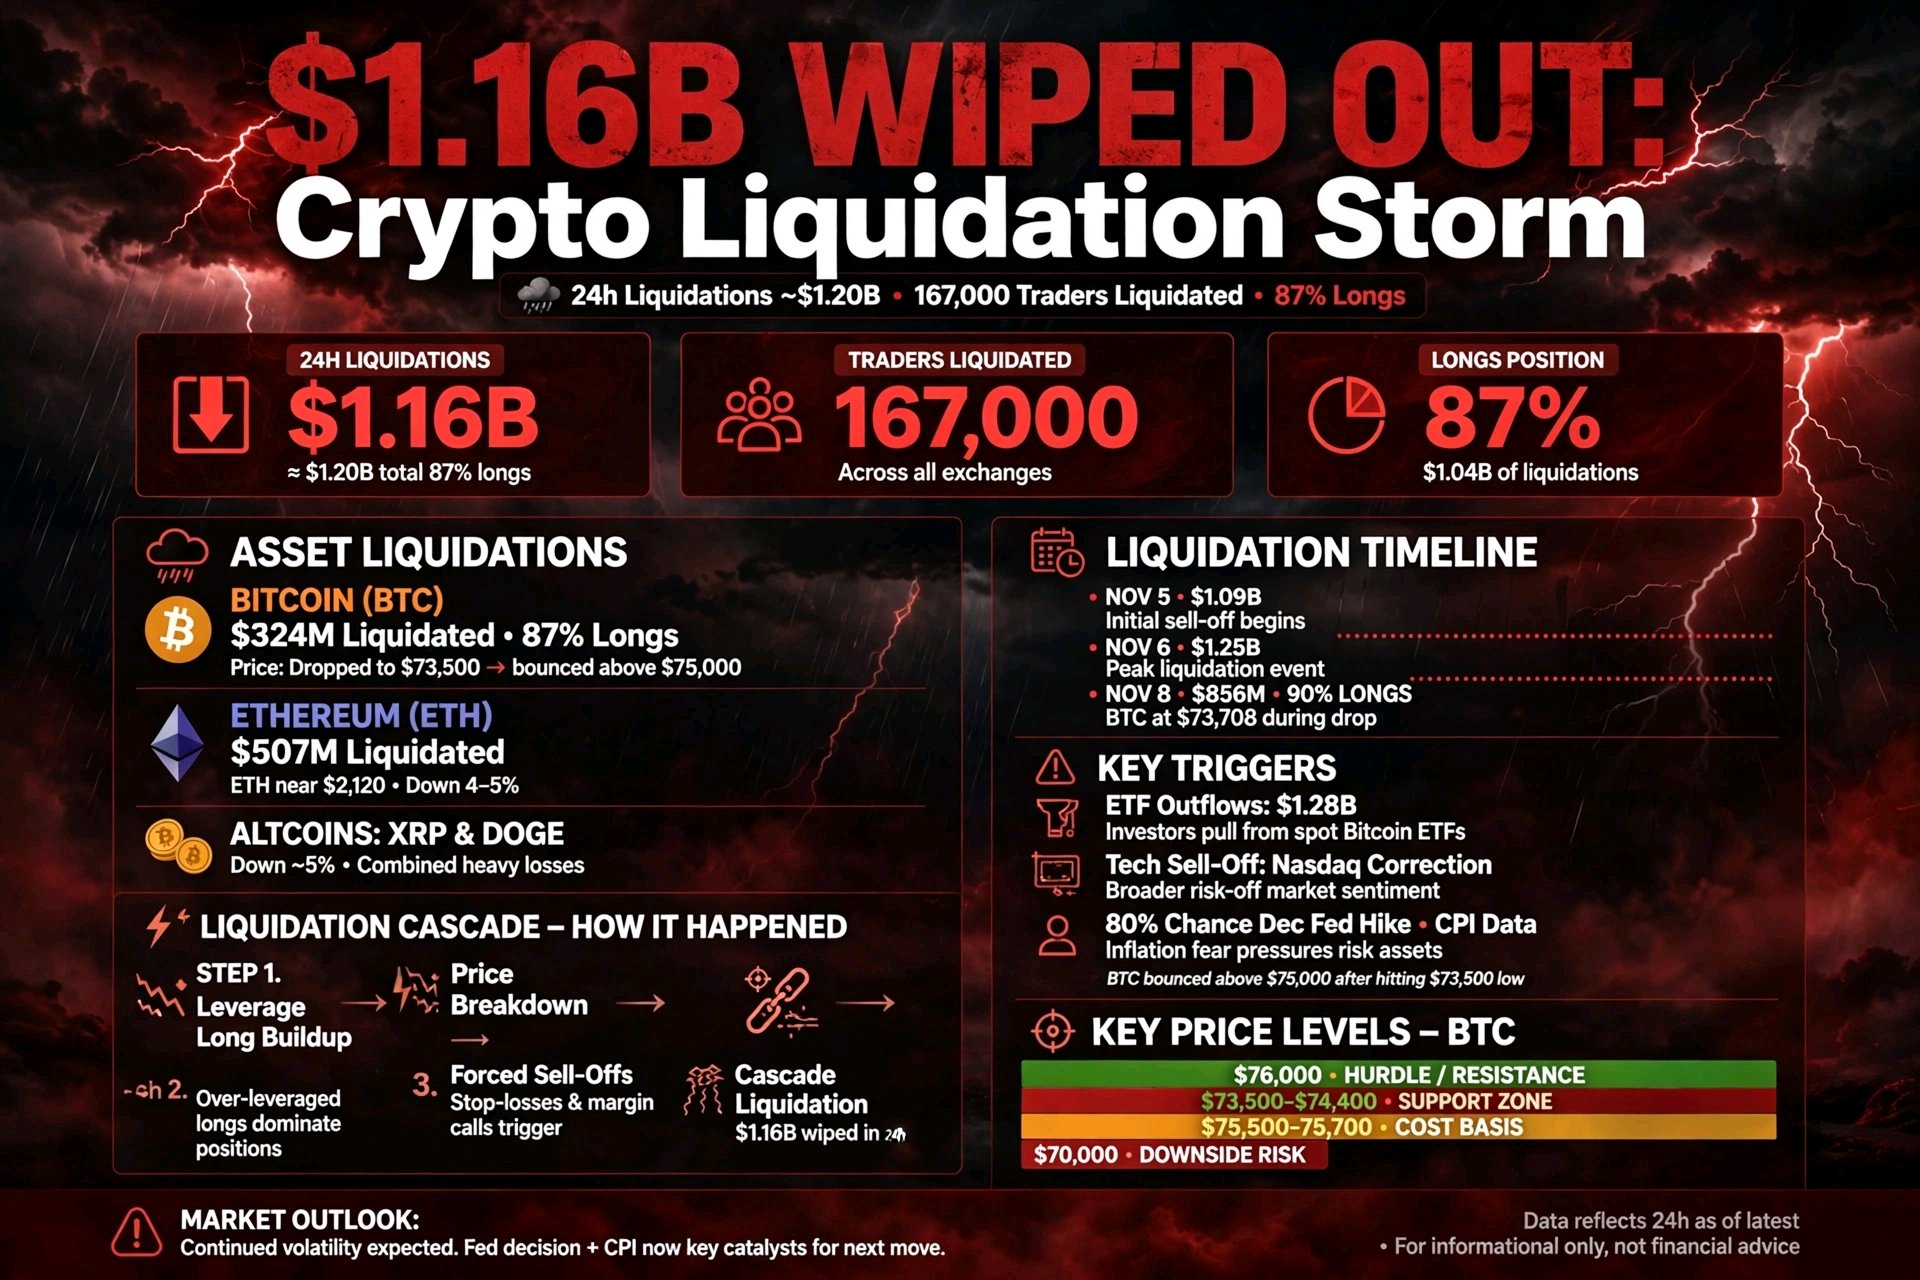
🚨 $1.16 BILLION VANISHED INTO THIN AIR. 😱
The crypto market is facing an absolute systemic meltdown, and if you think it’s just because of the tech market, you are missing the real story. While the global tech bloodbath—triggered by shocking personal headlines around Nvidia CEO Jensen Huang—started the panic, smart money is fleeing due to a toxic mix of macro disasters. Here is what the mainstream media isn't putting together yet: - The Tech Spillover: Nvidia's crash is actively draining massive liquidity out of speculative assets. - The $6.34B Binance Shock: The psychological trauma of the historic Binance exploit is keeping whale capital locked away. - The Midterm Freeze: Institutional giants are aggressively de-risking and moving to cash ahead of the high-stakes US Midterm Elections. The 24-Hour Damage Report: Leverage traders got completely wiped out clean, resulting in a staggering $1.16 Billion in total liquidations. - Bitcoin ( $BTCUSDT ): Cracked under immense pressure, now desperately fighting to hold the $74,860 zone. - Ethereum ( $ETHUSDT ): Taking a brutal beating, collapsing 5.9% straight down to $2,124. This is no longer a simple correction. This is a battle for the next macro trend. Are you buying this historic bloodbath, or are you sitting on the sidelines? Drop your survival strategy below. 👇 #MidtermsMarketWatch #BybitAIEvolving

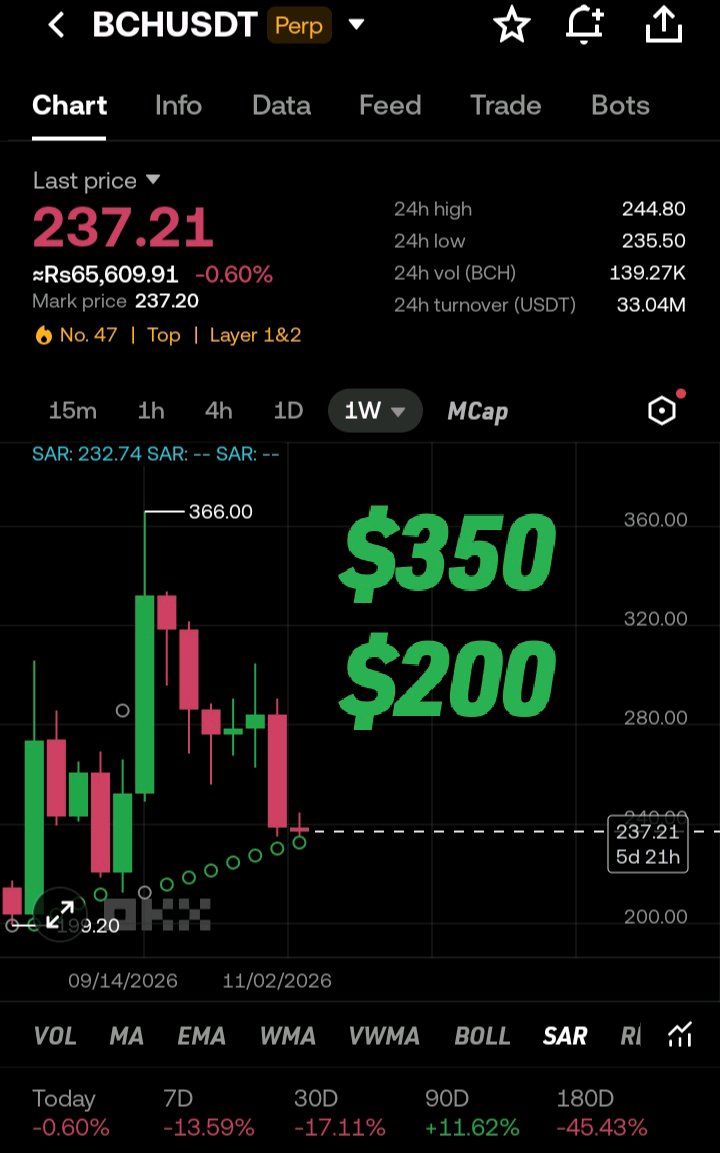
BCHUSDT – Buy Now or Wait for $200? 🤔
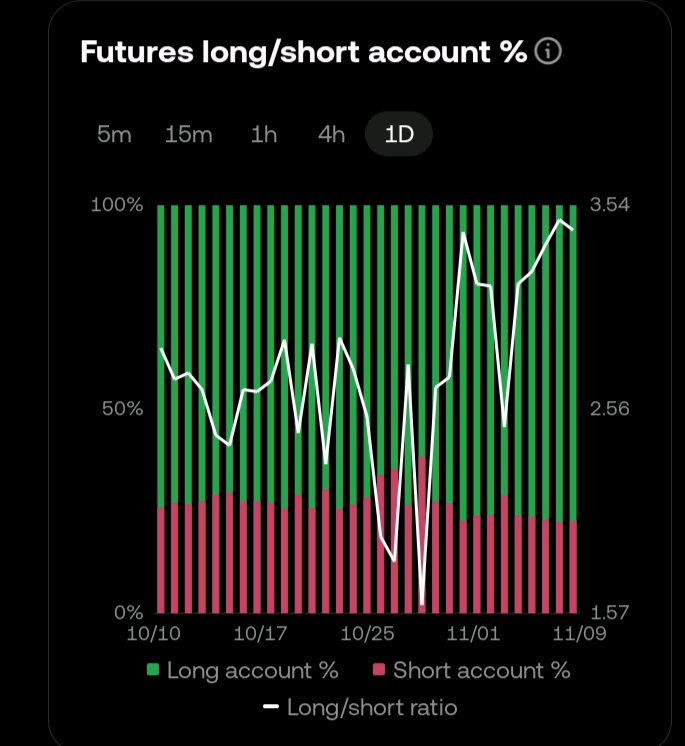
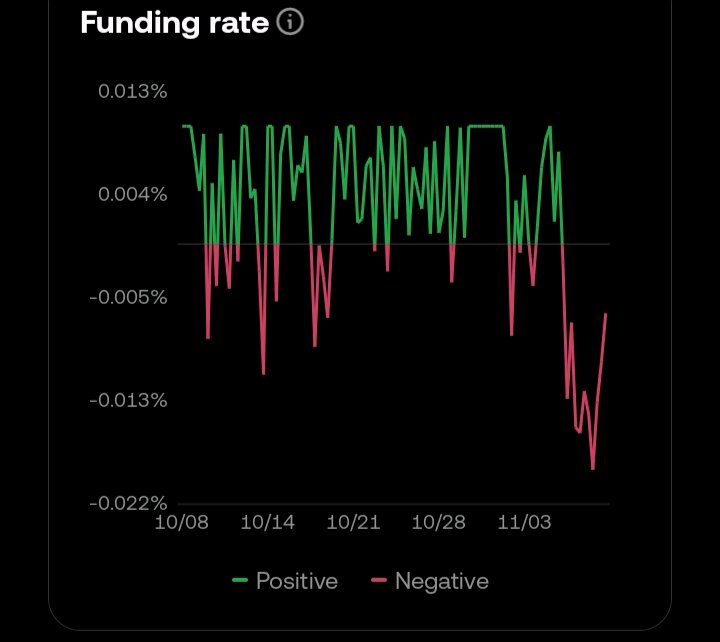
$BCHUSDT Current: 237.21 📉 | Target: $350 🎯 Chart & Data: · Weekly SAR is right at 232.74 (Key support). · Funding Rate: Deep negative. Shorts are paying longs (Short squeeze potential). · Long Ratio: Very high at 3.54. Retail is heavily long. My View: If SAR holds, a bounce to $350 is possible. However, the high Long ratio means the market might drop to liquidate them first. Plan: Consider DCA (partial buying) to balance the risk. Buy now or wait for $200? 👇 #WSOTPicktoEarn10U #USPayrollsAndRateDecisionsDriveMacroWeek #Oracle20BFundingPlanTestsTheAITrade #MidtermsMarketWatch #AnthropicIPOTestsTheAIBoom $BTCUSDT
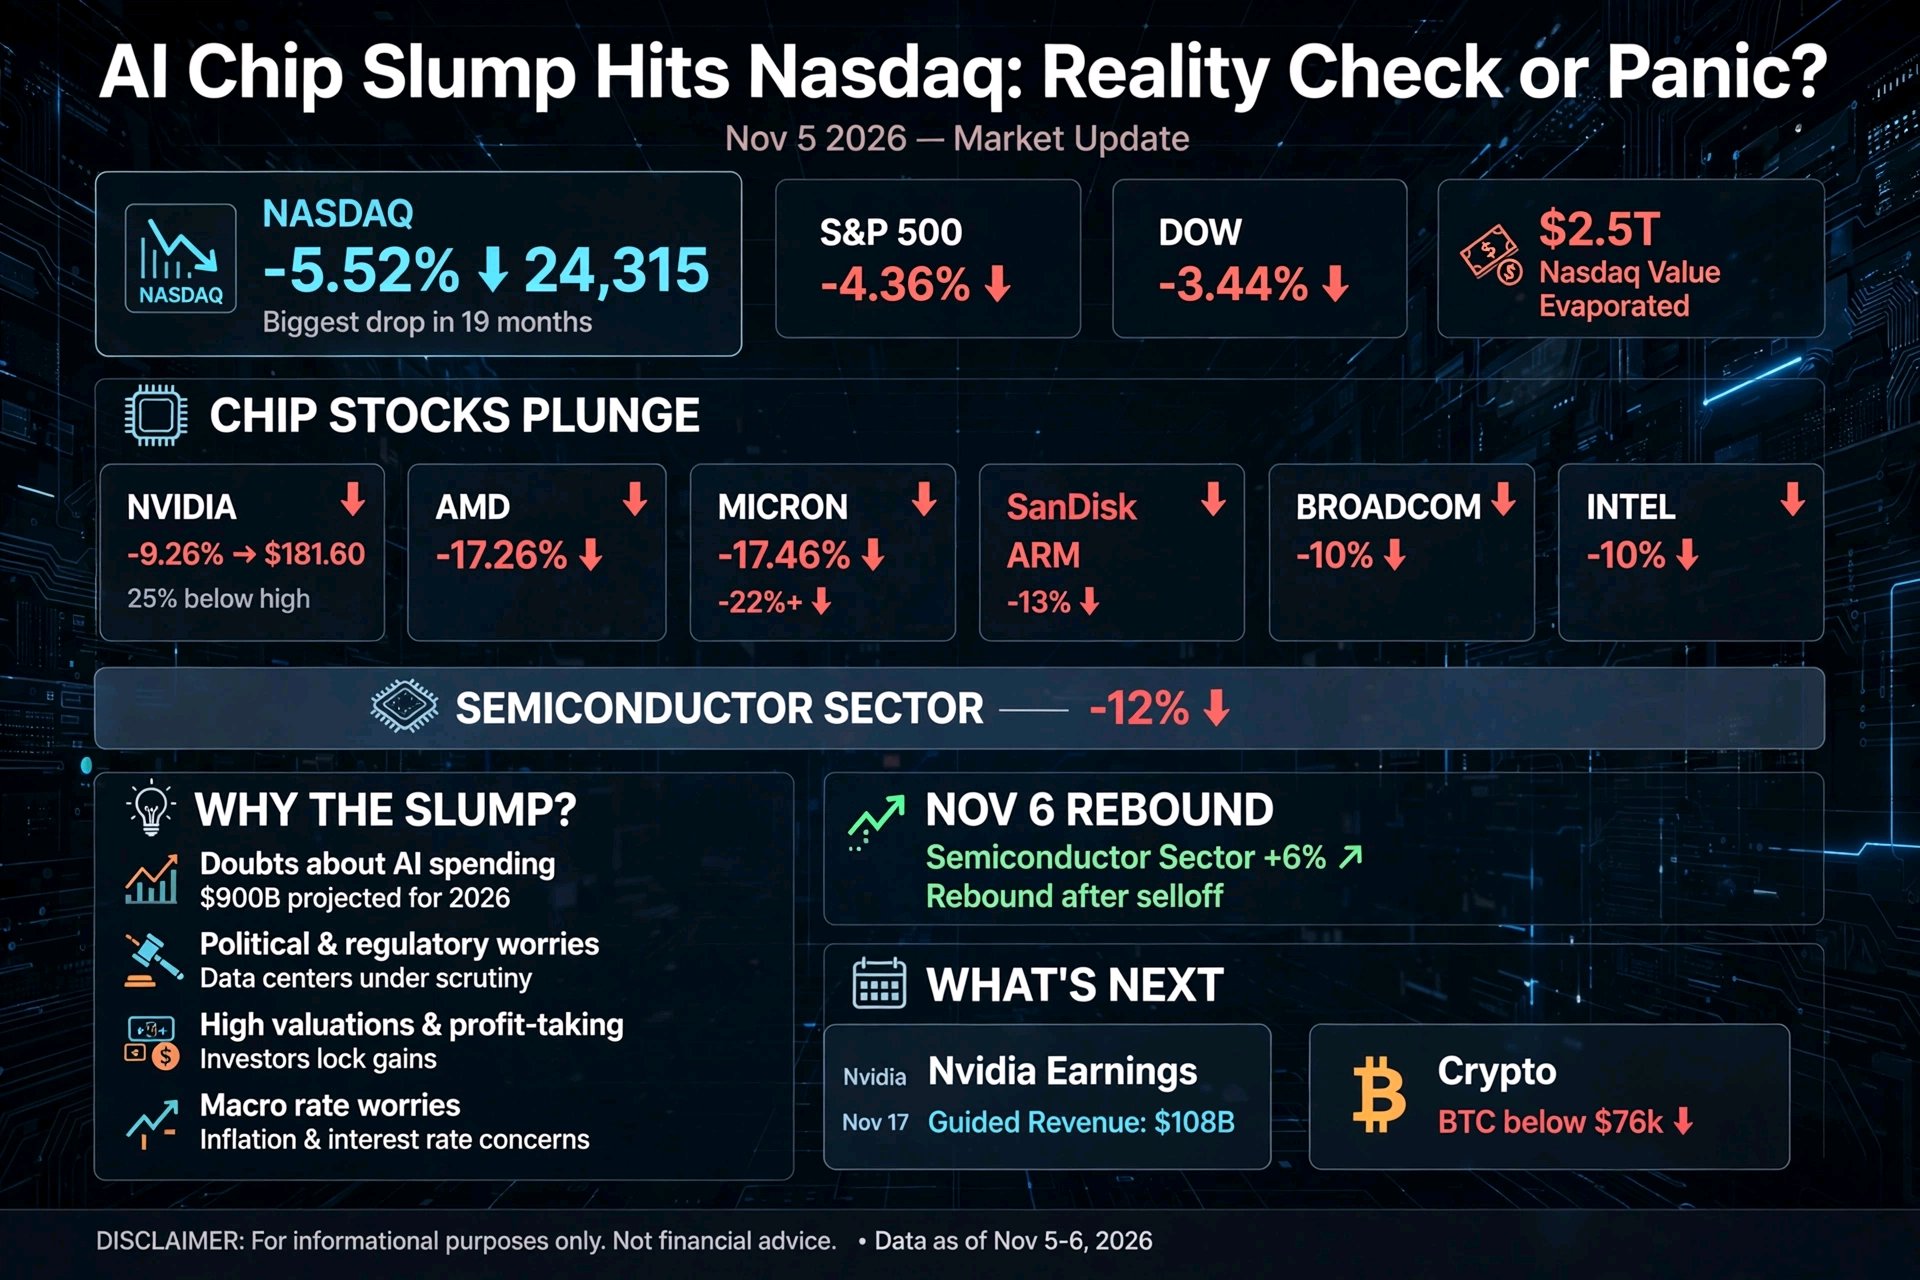
AI Chip Slump Hits the Nasdaq
: Reality Check or Panic? 🚨 The Day Wall Street Flinched On Thursday, November 5, 2026, the Nasdaq Composite fell 5.52% to 24,315, its biggest daily drop in 19 months. 😱 The S&P 500 fell 4.36% and the Dow fell 3.44%. The sell-off pushed the Nasdaq into correction territory, more than 10% below its peak. 📉 Reuters estimated roughly $2.5 trillion in Nasdaq market value evaporated in a single session. 💸 🔥 Chip Stocks Led the Fall The damage was heaviest in AI and semiconductor names: 👇 🟢➡️🔴 Nvidia: −9.26% to $181.60, about 25% below its 52-week high 🔻 AMD: −17.26% 🔻 Micron: −17.46% 🔻 SanDisk: over −22% 🔻 Arm: −13%, Broadcom: −10%, Intel: −10% The semiconductor sector fell about 12% in a day, one of its worst sell-offs in years. 😳 🧠 Why Did It Happen? 💰 1. Doubts About AI Spending Investors questioned the pace, cost and financing of the AI boom. 🏗️ One analysis noted that JPMorgan expects about $900 billion of AI spending worldwide in 2026, and investors want to know when that money pays back. 🤔 🏛️ 2. Political and Regulatory Worries Some coverage linked the fall to worries about US data-center policies after the midterm elections. 🗳️ One outlet argued the market was pricing political risk on land, energy and permits for AI infrastructure, not just on valuations. ⚡ 📊 3. High Valuations and Profit-Taking Stocks had run up for months, so even small bad news could trigger heavy selling. 🎢 Analysts say investors want clear proof of long-term profits before paying today's prices. 🧾 🏦 4. Macro Pressure Rate worries remain in the background, with markets watching the Fed and today's CPI report. 📅 That makes expensive growth stocks more sensitive to bad news. ⚠️ 🔄 The Partial Rebound The next day, November 6, chip stocks bounced. 📈 The broader semiconductor index rose over 6%, and AMD, Intel and Micron were up roughly 7% to 13%. A Jefferies strategist called the sell-off reactionary, not a fundamental reset, according to Reuters. 🧐 But analysts warned that volatility may continue, and a bounce is not a verdict. 🎯 ⚠️ A Reality Check One report stressed that these moves reflect a repricing of share prices, not cash leaving company bank accounts or a collapse in chip shipments or data-center orders. 📌 So this looks like a valuation reset, not proof that AI demand has vanished. Still, if spending flattens, comparisons with the 2022 chip slump may return. 😬 🗓️ The Next Big Test: Nvidia Earnings Nvidia reports on Tuesday, November 17. 📣 It guided revenue to about $108 billion this quarter. Markets will watch for strong results and confident guidance. A beat may calm nerves, while a miss could deepen the slump. 🎯 ₿ What This Means for Crypto ($BTC $SOL $ARB) Crypto has been trading closely with tech lately. 🔗 Bitcoin slid below $76,000 around the sell-off, so it offered no safe haven. 😬 In general, altcoins like SOL and ARB tend to move harder than BTC in both directions, so a weak Nasdaq can hit them more. ⚖️ If tech stabilizes, crypto may find relief, but if the AI sell-off returns, expect more volatility. 🎢 🧭 What Traders Can Do 📌 Avoid panic and FOMO. Wild swings trap both buyers and sellers. 🪤 📌 Watch key dates. Today's CPI and Nvidia's November 17 earnings can move markets. 📅 📌 Spread entries. Don't go all-in on one day's move. 🪜 📌 Mind leverage. Fast drops can liquidate over-leveraged positions. 🛡️ 📌 Follow the proof. Earnings and spending data matter more than headlines. 🔍 🎯 Final Thought The AI boom is moving from hype to proof. 💡 Big winners can fall fast when expectations are high, and rebounds can be just as sharp. Whether this is a healthy reset or the start of something bigger, the next few weeks will tell. 🌍 #Oracle20BFundingPlanTestsTheAITrade #MidtermsMarketWatch #BOERateDecision #AnthropicIPOTestsTheAIBoom #OilVolatilityTracksIranPeaceTalks $BTCUSDT @jalekhakhatun
1.16 Billion Wiped Out:
Crypto's Liquidation Storm Hits Leveraged Traders ⚡🩸 🚨 A Brutal 24 Hours The crypto market just delivered a painful lesson in leverage. 😬 Within 24 hours, more than $1 billion in leveraged positions were wiped out. Coinglass data showed about $1.2 billion in liquidations, and $1.04 billion of that came from long positions, meaning bets on higher prices. 📉 Roughly 167,000 traders were liquidated. 😱 ⚙️ What Is a Liquidation? A quick refresher for newer traders. 👇 When you trade with leverage, you borrow to open a bigger position. If the price moves against you and your collateral can no longer cover the loss, the exchange automatically closes your trade. That forced selling can push prices down further, which triggers more liquidations. This chain reaction is called a liquidation cascade. 🌊 📊 Who Got Hit Hardest? ₿ Bitcoin: about $324 million liquidated, nearly 87% of it longs. BTC briefly dropped to about $73,500 before bouncing above $75,000. Ξ Ethereum: over $507 million liquidated, more than Bitcoin. ETH is trading near $2,120 and fell about 4–5% on the day. 🔻 Other majors: XRP, Dogecoin and others also dropped about 5%. The pain was one-sided. 🎯 Longs were crushed while shorts barely mattered. That tells us traders were heavily positioned for a bounce that never came. 🪤 📅 This Is Not the First Wave This week has been rough. 😮💨 📆 November 5: about $1.09 billion liquidated, as Bitcoin fell roughly 6% from above $80,000 to about $75,700. 📆 November 6: about $1.25 billion liquidated. 📆 November 8: about $856 million liquidated, about 90% longs, as Bitcoin hit $73,708, its lowest since August. 📆 Now: another $1B+ wave. Repeated flushes show that over-leveraged longs keep getting cleared out. 🧹 🧠 What Triggered the Selling? 🏦 1. Heavy ETF Outflows US spot Bitcoin ETFs lost $1.28 billion last week, their worst week since late June. 📤 That removed a major source of steady buying. 📉 2. Tech Stock Sell-Off A sharp AI and chip-stock sell-off pushed the Nasdaq into correction territory, and crypto has been trading like a high-risk tech asset. 🤖⛈️ 🗳️ 3. Macro and Political Pressure Traders are also pricing in rate worries. Markets see roughly an 80% chance of a December Fed rate hike, so today's CPI report could shake things again. 📊⚠️ 🔓 4. Exchange Security Worries One report mentioned a Binance hack among the pressures on sentiment. I couldn't verify details, so treat that with caution until Binance or other reliable sources confirm what happened. 🔍 🔍 Key Levels Traders Are Watching 📍 $73,500–$74,400: recent lows and weekly support. 📍 ~$75,500–$75,700: short-term holder cost basis and Strategy's average buy price. Bitcoin is trading just below it, so many recent buyers are underwater. 😬 📍 ~$76,000: the first upside hurdle. 📍 ~$70,000: a level some analysts flagged as a downside target if support fails. 🔻 ⚖️ Is This Bullish or Bearish? Both views exist. 🤔 🐂 Bull case: Big liquidation flushes can clear excess leverage and help set a bottom. 🐻 Bear case: ETF outflows, weak equities and rate-hike risk could keep pressure on prices. Remember that a liquidation event shows the damage already done. It does not tell you what comes next. 🎯 🛡️ Lessons for Traders 📌 Respect leverage. High leverage turns normal swings into account-killers. 💀 📌 Use stop-losses and small sizes. Never risk more than you can lose. 🧯 📌 Avoid chasing. Don't buy every dip or short every bounce blindly. 🪤 #Oracle20BFundingPlanTestsTheAITrade #MidtermsMarketWatch #BOERateDecision #AnthropicIPOTestsTheAIBoom #OilVolatilityTracksIranPeaceTalks $BTCUSDT @jalekhakhatun