WSOTPicktoEarn10U
用 #WSOTPick2Earn 支持您最喜愛的戰隊與隊長!分享您對他們的看法:他們最擅長的交易市場是什麼?是什麼定義了他們的交易基因?獲選的優質貼文每篇將獲得 10 USDT。得獎者將從符合資格的參賽者中隨機抽出。Bybit 保留最終解釋權。

100 美元至 10 萬美元挑戰 | 餘額:722.87 USDT 💲
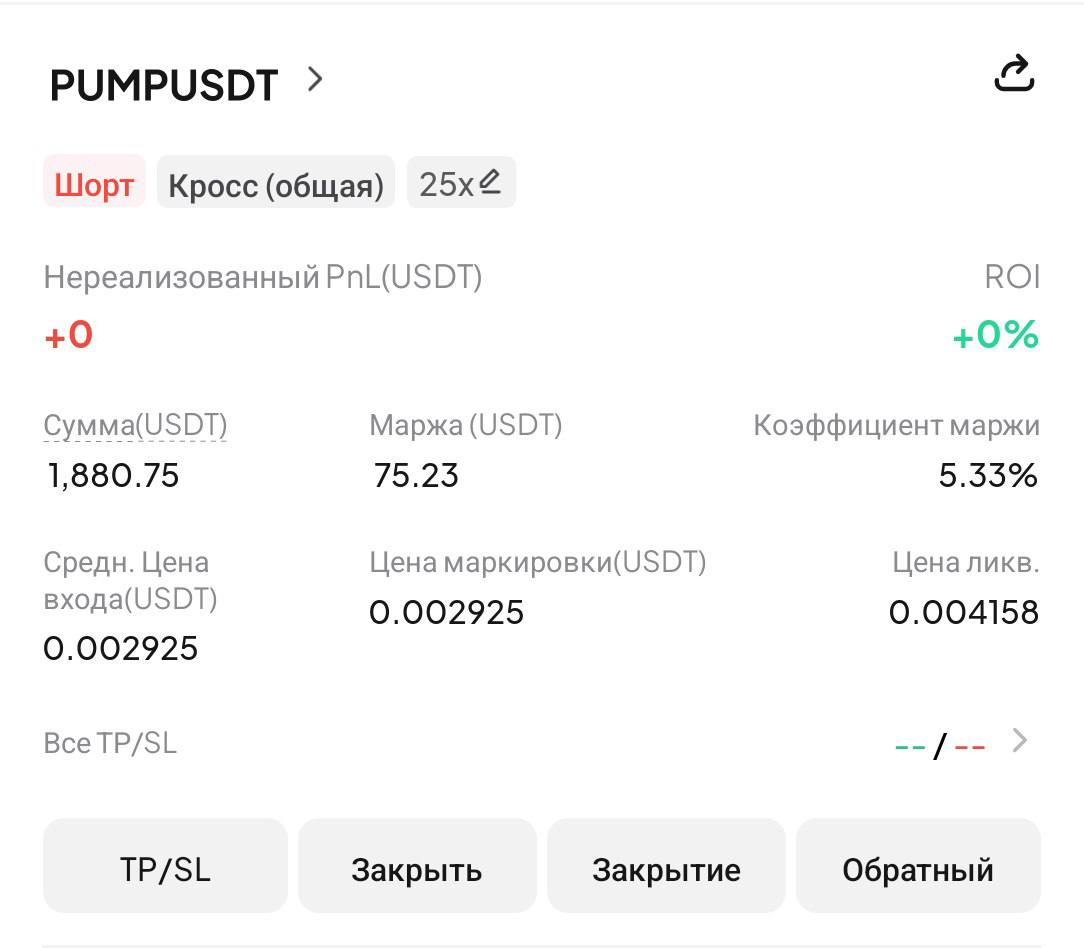
📊 $PUMPUSDT| 空單 | 25x 🟢 進場價格 : $0.002925 🟢 目標價格 : $0.002895 $0.002864 $0.002699 🔴 止損價格 : $0.003080 💳 保證金 : 75 USDT 💲 💰 錢包餘額 : 722.87 USDT 💲 ⚠️ 避免追高/追低。每筆交易都會提早分享給 @Kryptent 社群。 🔥 #WSOT2026 #NovUSCPIWatch #Bybit 8 週年 #BybitAIEvolving #WSOTPicktoEarn10U

🎉 #WSOTPickToEarn10USDT 得獎名單已公佈!
恭喜我們的 10 位獲獎者,感謝你們發佈了如此出色的貼文,展現出對戰隊的強力支持: - Crypto BOSS - Rufiweb3 - RoYoK - ton***@**** - MAYA_ - CoinGru - CRIPTO PROFESIONAL - Crypto bean - wei***@**** - AlphaSaylor 在 ByX,我們致力於尋找原創、具備洞察力且引人入勝的內容,幫助社群做出更明智的交易決策。 WSOT 主戰隊競賽今日開跑! 你支持的戰隊能脫穎而出,瓜分高達 3,200,000 USDT 的獎金池嗎?👀 #WSOT2026 #WSOTPicktoEarn10U


$TSLAXUSDT Is Tokenized Tesla 's future is increasingly connected to artificial intelligence, autonomous transportation and robotics. At the same time, tokenized stocks are creating a new way for investors to access traditional equities through blockchain infrastructure. TSLAX sits directly at the intersection of these two developments. But can this tokenized Tesla exposure attract meaningful demand? Market Overview — November 11, 2026 Based on the latest available market snapshot: - Price: $384.24 - 24H Change: +2.00% - Market Cap: $69.94M - 24H Volume: $8.67M - 24H High: $386.88 - 24H Low: $370.60 - All-Time High: $496.55 - Distance from ATH: -22.6% Technical Analysis TSLAX is approaching an important resistance zone after recovering from recent weakness. Key levels to watch: - Immediate Support: $370–$374 - Strong Support: $350–$360 - Immediate Resistance: $386–$391 - Major Resistance: $395–$408 A sustained breakout above $391 could strengthen bullish momentum toward $408. However, losing $370 could expose the lower support region. Fundamental Development Tesla's strategic transition toward autonomous transportation and Cybercab production is an important development to watch. Its energy storage business and AI ambitions also contribute to the longer-term investment narrative. For TSLAX, the distinction is important: investors are getting tokenized exposure to Tesla's equity rather than investing in a conventional cryptocurrency ecosystem. Tokenomics and Risk TSLAX operates through a tokenized equity structure. Its value is linked to Tesla shares, while issuer arrangements, custody, redemption access, regulatory restrictions and secondary-market liquidity remain important considerations. My Market Outlook Bullish scenario: Holding $370–$374 and breaking above $391 could create an opportunity to test $395–$408. Bearish scenario: A breakdown below $370 could weaken the recovery and bring $350–$360 into focus. The bigger question is whether tokenized real-world assets will become a meaningful part of global financial markets. Community Question: Would you rather hold traditional Tesla shares or blockchain-based Tesla exposure through TSLAX? Share your thoughts below. #ByXIMPACT #WSOT2026 #BitcoinHitsTwoMonthLowAfterUSMidterms #WSOTPicktoEarn10U #BybitAIEvolving @

#ByXIMPACTHyper Marketing & Analytics (For Crypto‑Focused Projects like Hyperliquid / HYPE) Disclaimer: This is market‑education content only, not financial advice. 📌 Core Definition Hyper marketing means high‑speed, community‑first promotion tailored for fast‑moving crypto audiences — paired with analytics to track what works, who engages, and how market sentiment shifts. For projects such as Hyperliquid (HYPE), it focuses on highlighting network updates, token‑burn events, trading volume growth, and ecosystem expansion. 📊 Key Analytics Areas - On‑chain analytics: Token burn volume, wallet growth, staking activity, supply changes - Market analytics: Price trends, trading volume, liquidation levels, order‑book flow - Marketing analytics: Social reach, engagement rate, hashtag performance, new follower growth, sentiment score (positive / neutral / negative) ✅ Hyper Marketing Focus Points for HYPE 1. Share key milestones: mainnet upgrades, burn announcements, new exchange listings 2. Use short, bold posts for trading communities & WSOT squads 3. Pair every update with simple data points (e.g. “Total HYPE burned: …”) 4. Track which posts get the most views to refine future messaging 📈 Sample Good‑News Marketing Snippet “Hyperliquid keeps building momentum! Latest analytics show rising user activity + large token‑burn events reducing circulating supply. Traders & community members are watching closely as the ecosystem expands — stay tuned for next updates!” $HYPEUSDT #WSOT2026 #WSOTPicktoEarn10U #NovUSCPIWatch #BybitAIEvolving

BITCOIN
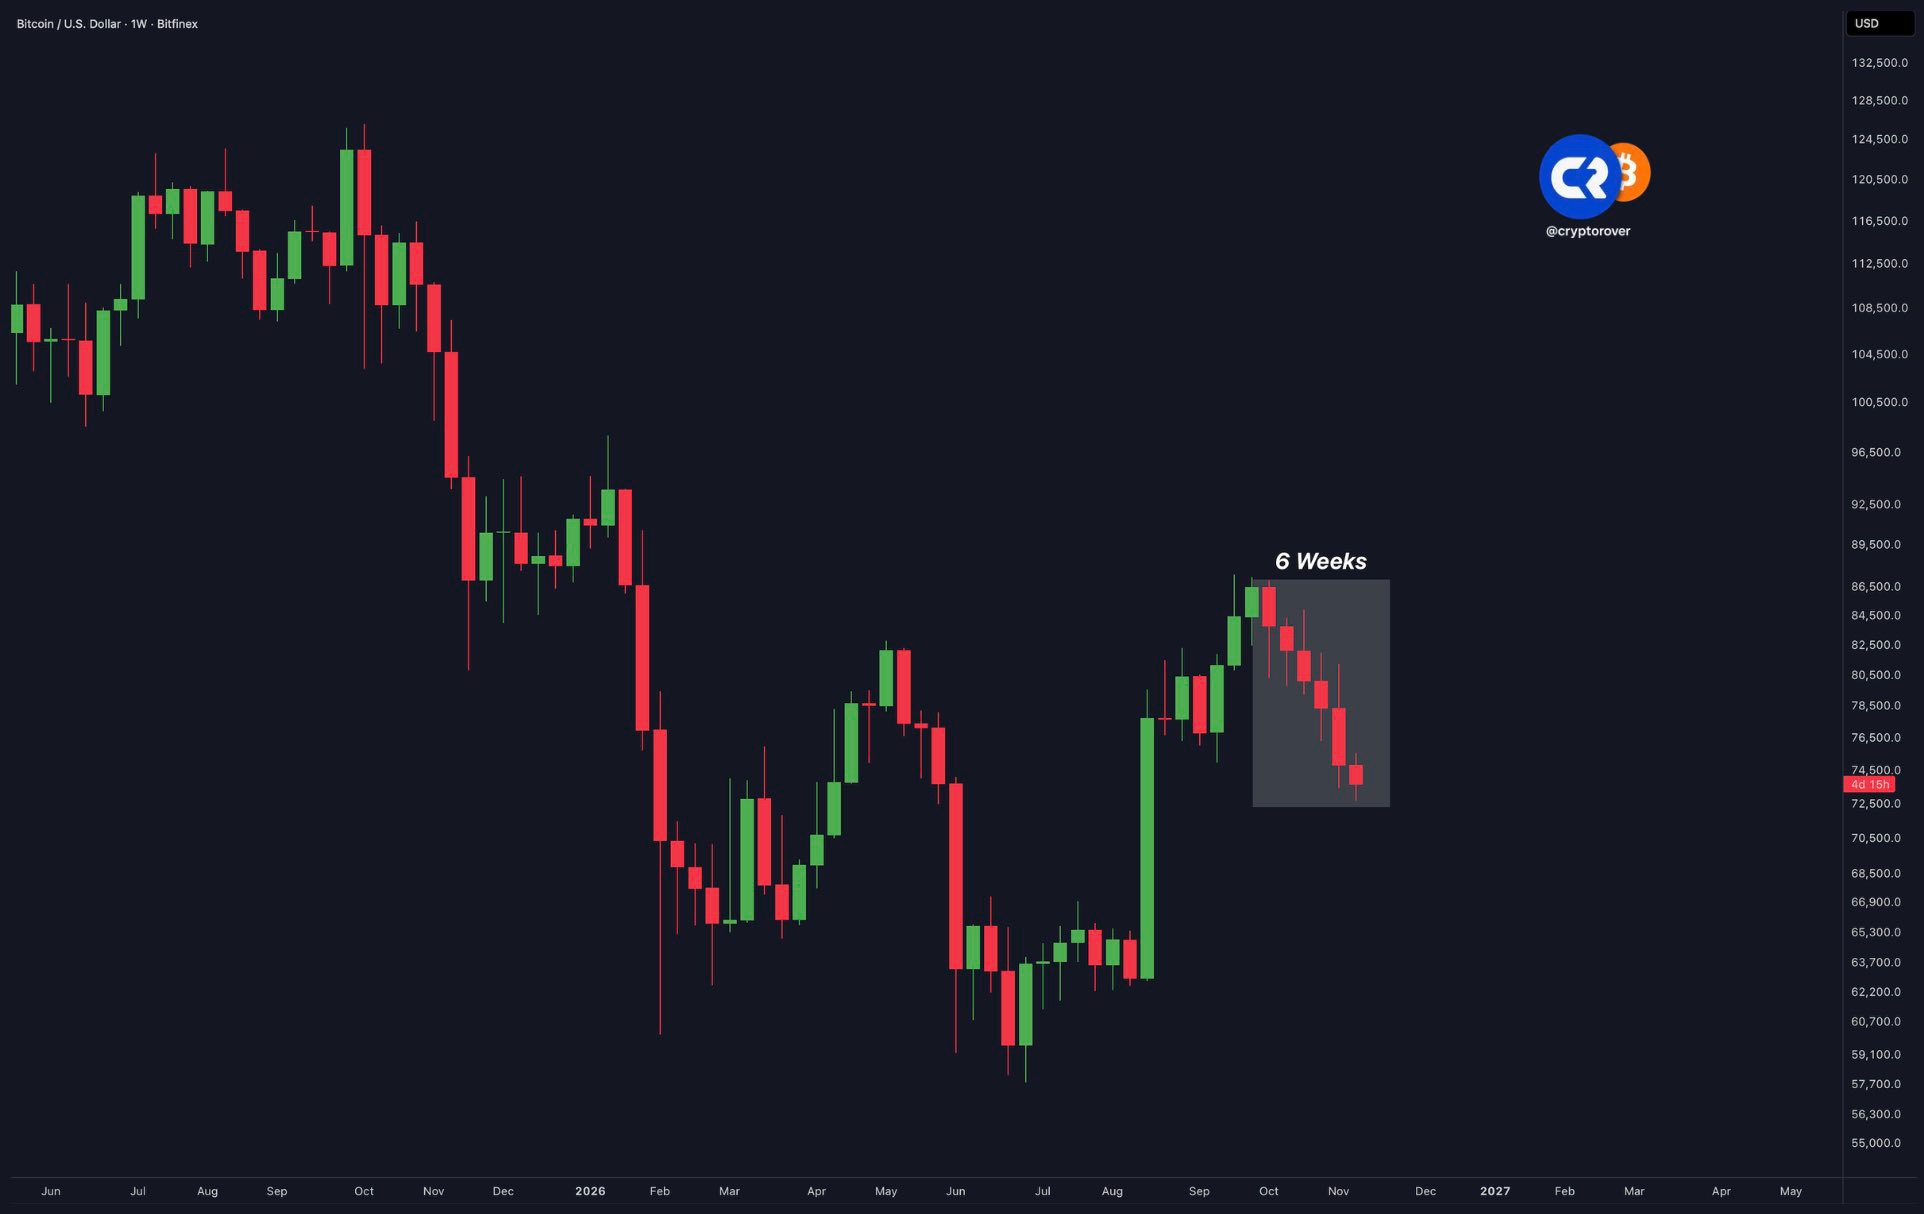
#USPayrollsAndRateDecisionsDriveMacroWeek 🔴 Bitcoin is about to close 6 RED weeks in a row. Bitcoin is experiencing one of the longest losing streaks in its history... Could this mean the longest winning streak in history is coming next? #WSOT2026 #WSOTPicktoEarn10U #OilVolatilityTracksIranPeaceTalks #NovUSCPIWatch
Trading
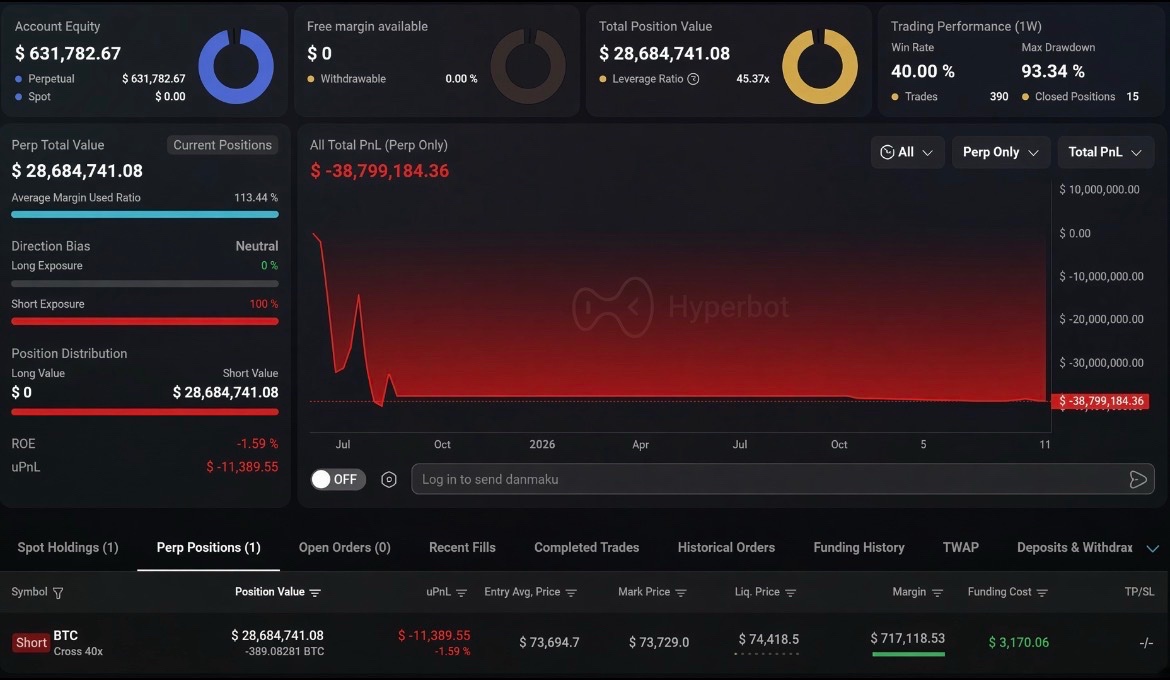
Someone just opened a 40x $BTC short worth ~$30M. His all-time PnL: -$38.8M When people start gambling on the last bit of downside, you know it’s time to go long #WSOT2026 #WSOTPicktoEarn10U #NovUSCPIWatch #USPayrollsAndRateDecisionsDriveMacroWeek #BybitAIEvolving

⚡️ NOW: Ripple CTO Emeritus David Schwartz 💰
Says he has sold nearly all his crypto due to his low risk tolerance. His holdings are down from about 26M $XRPUSDT , 1,500 $BTCUSDT and 40,000 ETH to roughly 3M XRP, 1 BTC and 6 ETH. #NovUSCPIWatch #WSOTPicktoEarn10U #USPayrollsAndRateDecisionsDriveMacroWeek #OilVolatilityTracksIranPeaceTalks #BybitAIEvolving



🚨 戰術簡報:壓縮區,平靜期
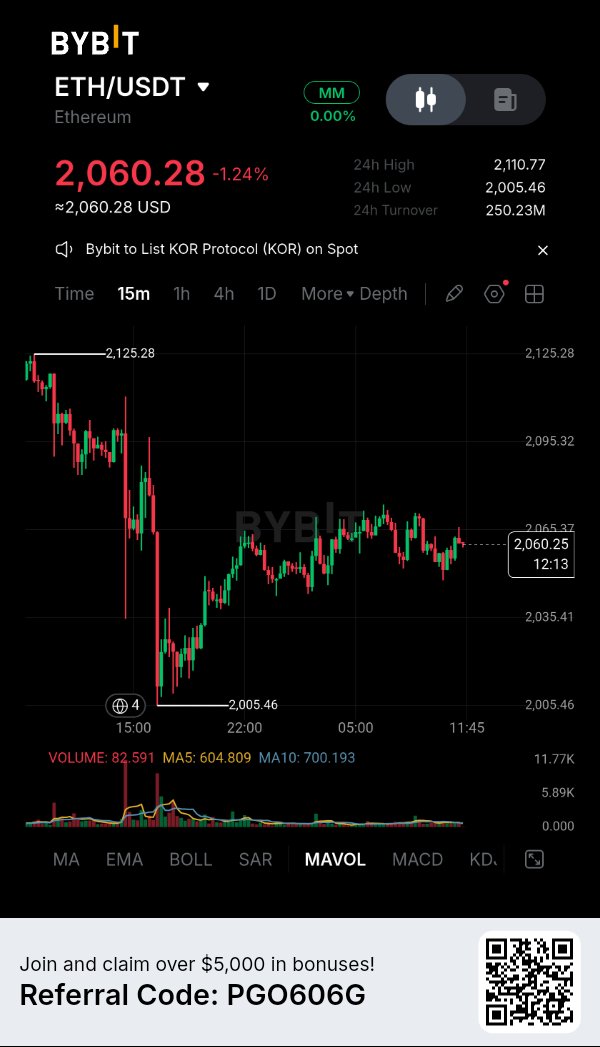
看看 15 分鐘線圖。市場剛剛遭受重創。我們目睹了從 2,125 高點開始的一波無情下跌,最終在 2,005.46 的底部經歷了一次激烈的流動性掃蕩。這是一次經典的洗盤,旨在清理過度槓桿的多頭部位,並嚇跑散戶交易者。 但看看後續反應。買方不僅守住了底部,還吸收了恐慌情緒,並立即將價格推了回來。我們目前處於 2,060.28,日內僅下跌 1.24%,價格正在狹幅區間內橫盤震盪。這不是疲軟,而是一個巨大的壓縮區。市場正在為下一次走勢蓄勢待發。 技術解讀(為什麼這很重要): · 成交量真空:看看底部的成交量柱。最初下跌時的大量紅色柱狀圖已經消失。賣盤成交量已完全枯竭。空頭目前已沒有彈藥將價格進一步推低。 · 高點不斷抬高(Higher-Low)的結構:儘管震盪劇烈,價格拒絕回落至 2,005 的低點。我們正在形成一個穩固的更高低點結構,在價格下方建立起堅實的底部。 · 擠壓:我們被緊緊壓縮在 2,035 的支撐位和 2,065 的阻力位之間。移動平均線正在匯合。向某一方向的劇烈擴張已不可避免。 執行計畫(嚴格遵守規則): 我不會交易這種死氣沉沉的震盪行情。我會等待市場攤牌,然後精準出擊。 🎯 觸發點:我正在觀察 15 分鐘 K 線是否能強勢收在 2,065.00 的局部阻力位上方。一旦多頭在成交量激增的配合下將該水平轉化為支撐,機會之門就打開了。 🛑 無效化(風險):必須精準執行。如果價格在此處遭到強烈拒絕並失守近期的結構性支撐位 2,035.00,則看漲觀點失效。我會立即離場。沒有情緒,只有價格行為。 💰 目標價: · TP1:2,095.00(即時局部阻力) · TP2:2,110.00(回測 24 小時高點) 總結: 市場像彈簧一樣在蓄力。陷阱已為空頭設好。我已鎖定目標,保持耐心,準備在成交量回歸且多頭突破天花板的瞬間果斷出擊。 你是在交易這波震盪,還是在等待 2,065 以上的突破? $ETHUSDT #ByXIMPACT #WSOT2026 #NovUSCPIWatch #WSOTPicktoEarn10U #美國就業數據與利率決策主導本週宏觀市場


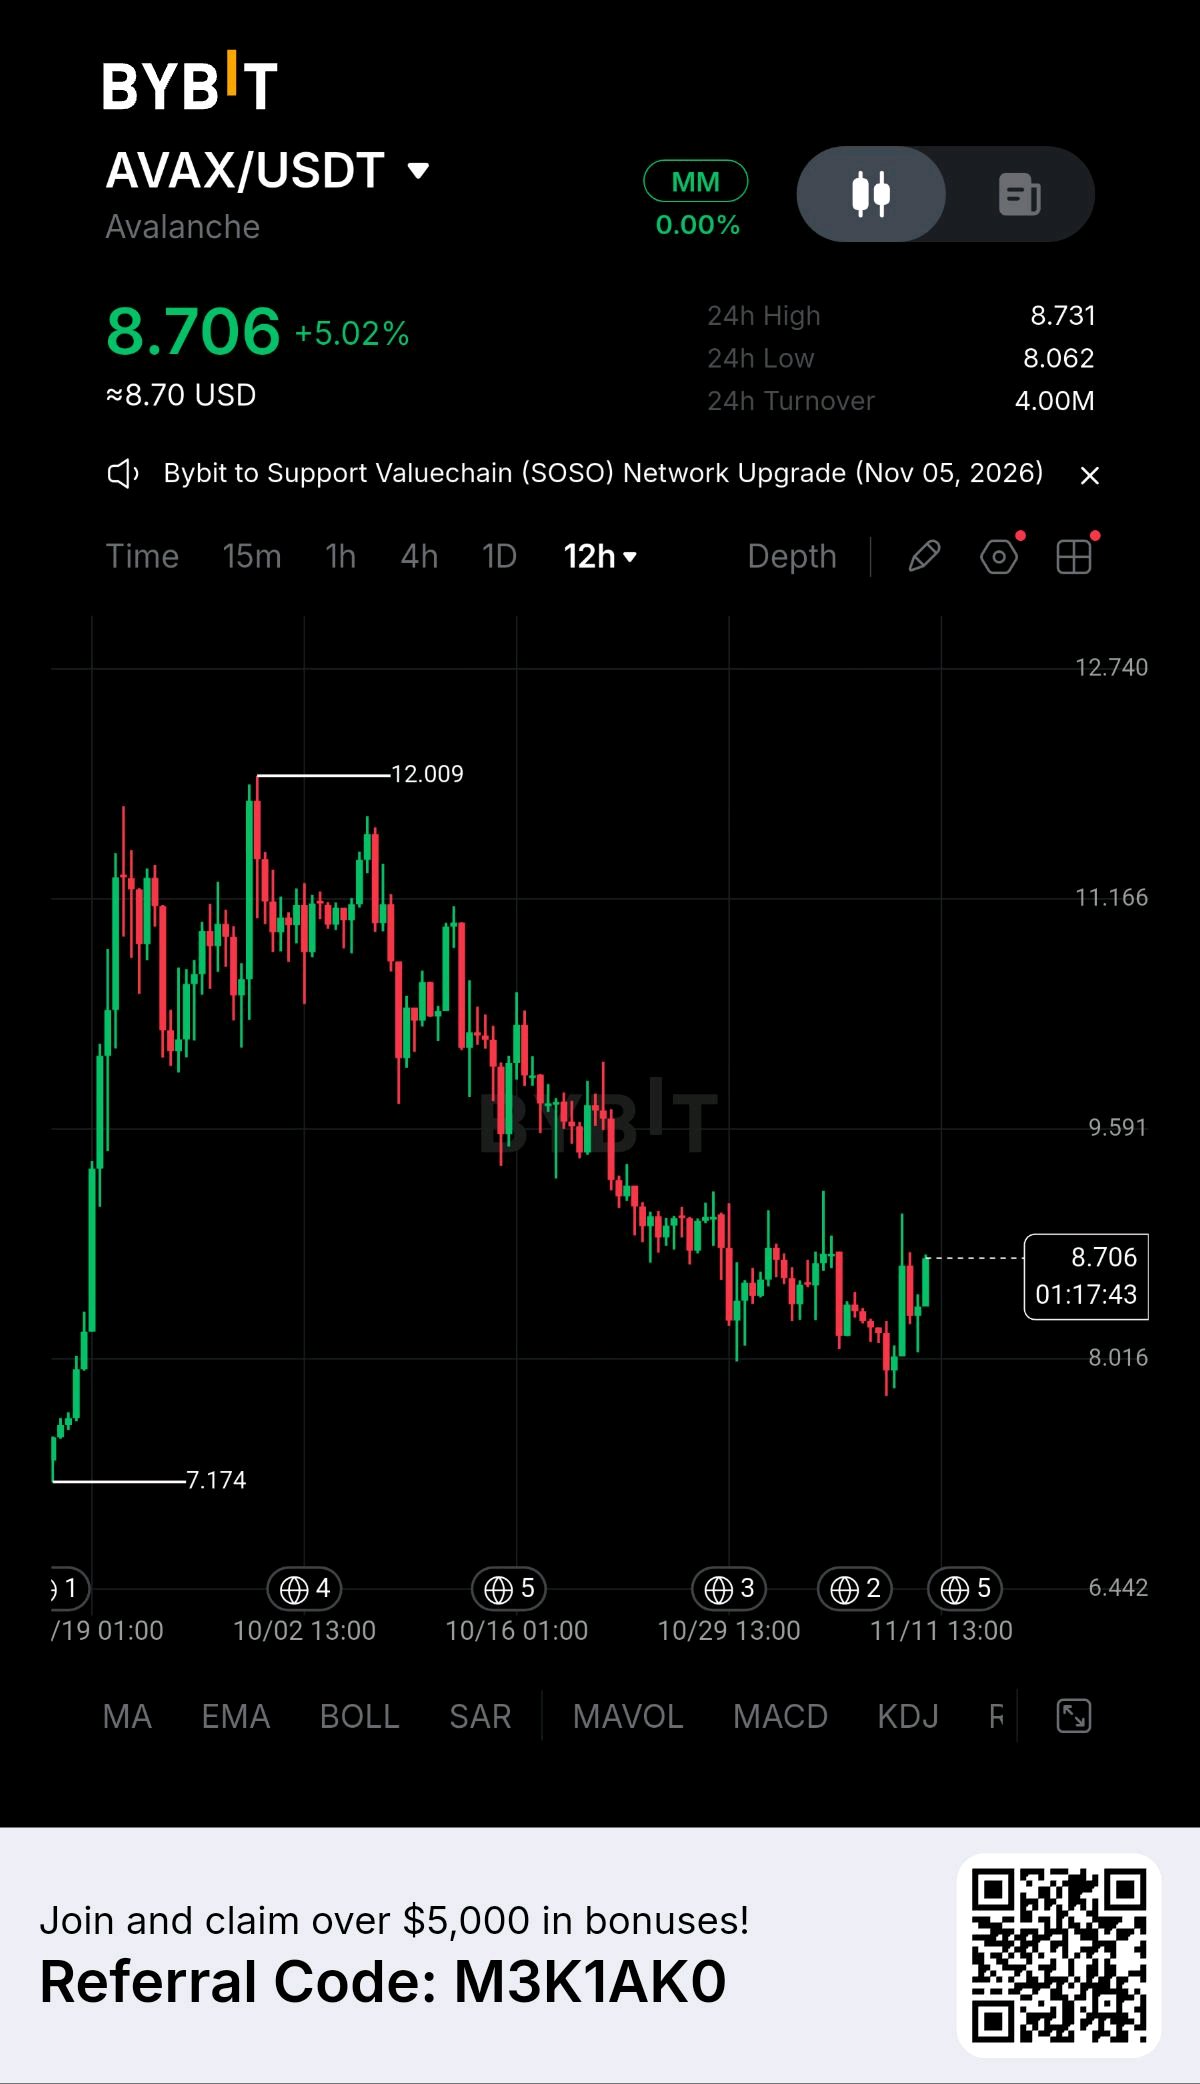
$AVAX 子網與反彈測試
最新消息與生態系催化劑 ➠ 子網擴展性與企業採用:Avalanche 持續擴展其客製化子網架構,推動機構資產代幣化以及在模組化應用鏈上的高吞吐量部署。 ➠ 網路升級整合:生態系驗證者更新與跨鏈訊息橋接改善了交易最終性與用戶入金效率。 ➠ 交易所成交額擴張:隨著 Layer-1 替代幣交易對市場量能回升,Bybit 上的 24 小時交易額達到 400 萬美元。 巨鯨與機構資金流向 ➠ 訂單簿買單聚合:強勁的結構性買方量能聚集,防守住 8.016 美元至 8.062 美元的需球區間,成功吸收了多週以來的回調壓力。 ➠ 聰明錢吸籌:鏈上指標顯示,在成功守住 7.174 美元附近的數日波段低點後,大型錢包進入了吸籌階段。 流動性與量能動態 ➠ 現貨價格與成交額走勢:Bybit 上 $AVAX 現貨價格為 8.706 美元(+5.02%)。24 小時成交額為 400 萬美元,今日價格在 8.062 美元的低點與 8.731 美元的高點之間震盪。 ➠ 技術面反彈動能:價格走勢呈現衝擊性的復甦腳步,在經歷了從 12.009 美元高點回落的長期修正後,正在測試局部阻力邊界。 代幣經濟學與結構性供給 ➠ 通縮質押模型:基礎費用銷毀機制與驗證者鎖倉要求,在網路高活躍度期間持續減少市場流通供給量。 敘事與市場板塊 ➠ 模組化子網基礎設施:定位為首屈一指的可客製化 Layer-1 網路,專為機構金融、企業子網部署及高效能去中心化遊戲量身打造。 關鍵技術設置(12 小時圖) ➠ 主要阻力位:$9.591 | $11.166 | $12.009 ➠ 核心支撐位:$8.016 | $7.174 | $6.442 風險報酬比 ➠ 風險/報酬概況:在 8.05 至 8.45 美元的回測區間附近建立動能延續的波段倉位,風險報酬比為 1:3.2,目標看向 9.591 與 11.166 美元。 交易員策略 ➠ 支撐位回測進場策略:在 8.016–8.400 美元支撐帶出現健康回調時,積累多頭部位,並將嚴格停損設置在 7.100 美元下方。 ➠ 突破擴展策略:當 12 小時 K 線確認收盤於局部阻力位 8.731 美元上方時,觸發動能多單設置,目標推升至 9.591 美元。 投資人觀點 ➠ 策略性 Layer-1 配置:在結構性需求底部附近進行紀律性的建倉,能在山寨幣板塊輪動期間提供極高的非對稱上漲曝險。 以上內容不構成財務建議。 $AVAXUSDT $LITUSDT #WSOT2026 #NovUSCPIWatch #WSOTPicktoEarn10U
📈標普500指數 (SPX) 展現出強勁的看漲方向強度,儘管隱含波動率極高且 GEX 定位為負值,但仍有 71.7% 的上漲機率。由於聯準會升息預期及去美元化擔憂等總體經濟逆風因素,市場情緒顯得謹慎。鑑於您目前主要持有穩定資產,或許可以考慮針對 SPX 現貨進行小規模、謹慎的佈局,以獲取短期收益。💡 行動建議:考量到高波動性與總體經濟的不確定性,建議採輕倉現貨買入並嚴格控管風險。⚠️ 風險警示:- 極高的隱含波動率顯示價格波動風險極大- 包括聯準會政策與全球去美元化在內的總體經濟不確定性正壓抑市場情緒- GEX 為負值暗示造市商可能會對沖下行風險,進而增加波動風險 $SPXUSDT #ByXIMPACT #WSOT2026 #WSOTPicktoEarn10U #NovUSCPIWatch #BybitAIEvolving

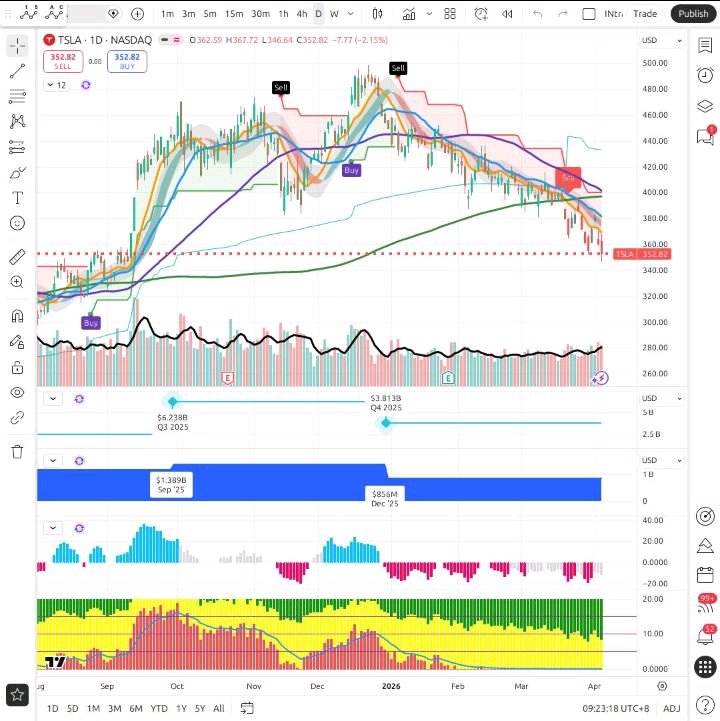
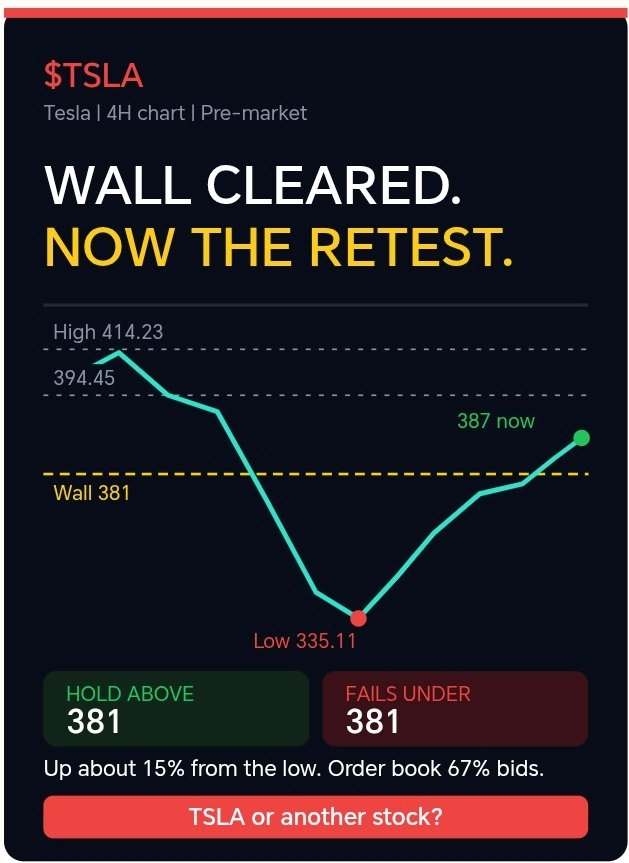
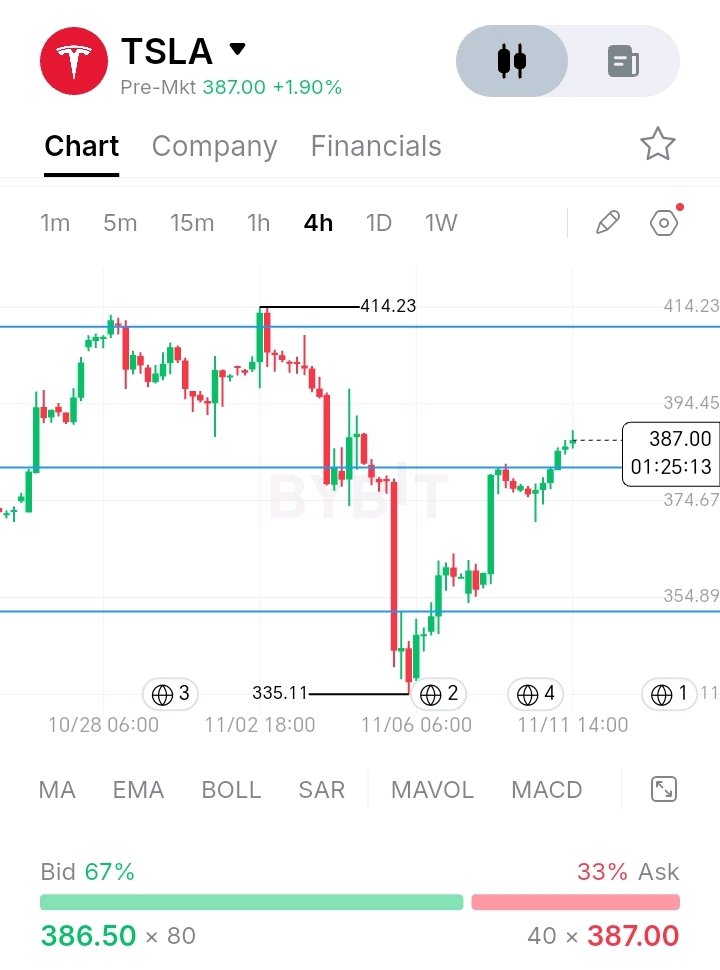
🧗 盤前交易已經突破壓力位。現在迎來了更艱難的部分。 在 $TSLA 證明自己之前,我不想過早慶祝它的復甦。我想看到 4 小時線收在 381 關卡之上,因為一個點位必須經過回測考驗,才能真正轉化為支撐。 以下是 4 小時圖表顯示的內容: 🔹 復甦:從 335.11 的低點算起,$TSLA 已經上漲了約 15%,一路出現高點墊高和強勁的陽線。它已經收復了從 414.23 下跌幅度的約三分之二。 🔹 壓力牆:381 這條線之前曾多次阻擋價格。盤前價格現在已來到該水準之上,這是復甦以來的第一個真正突破。 🔹 下一個目標位:圖表上方不遠處是 394.45,更大的參考目標則是 414.23 的高點。這大約比當前的盤前價格高出 7%。 🔹 訂單簿:買單約佔 67%,賣單佔 33%,買方力量較強。不過盤前掛單較薄,這僅供參考,並非鐵證。 🔹 風險:在經歷了 15% 的快速反彈後,價格經常會回調去測試剛剛突破的點位。那個回測才是決定 381 是否已轉為支撐的關鍵。 🟢 看漲:4 小時線收在 381 之上,隨後挑戰 394.45 和 414.23。如果回調幅度較淺且在 381 處守住,將是一個強烈的看漲訊號。 🔴 看跌:如果 4 小時線收回 381 以下,則視為突破失敗,下方將看 352 和 335.11 的低點。 突破只是第一步,回測才是真正的考驗。 你關注的是 TSLA 還是其他股票? #TSLA #股票 #BinanceSquare #WSOT2026 #WSOTPicktoEarn10U #美國就業數據與利率決策主導本週宏觀市場 #石油波動追蹤伊朗和平談判 #BybitAIEvolving $TSLAXUSDT$BTCUSDT

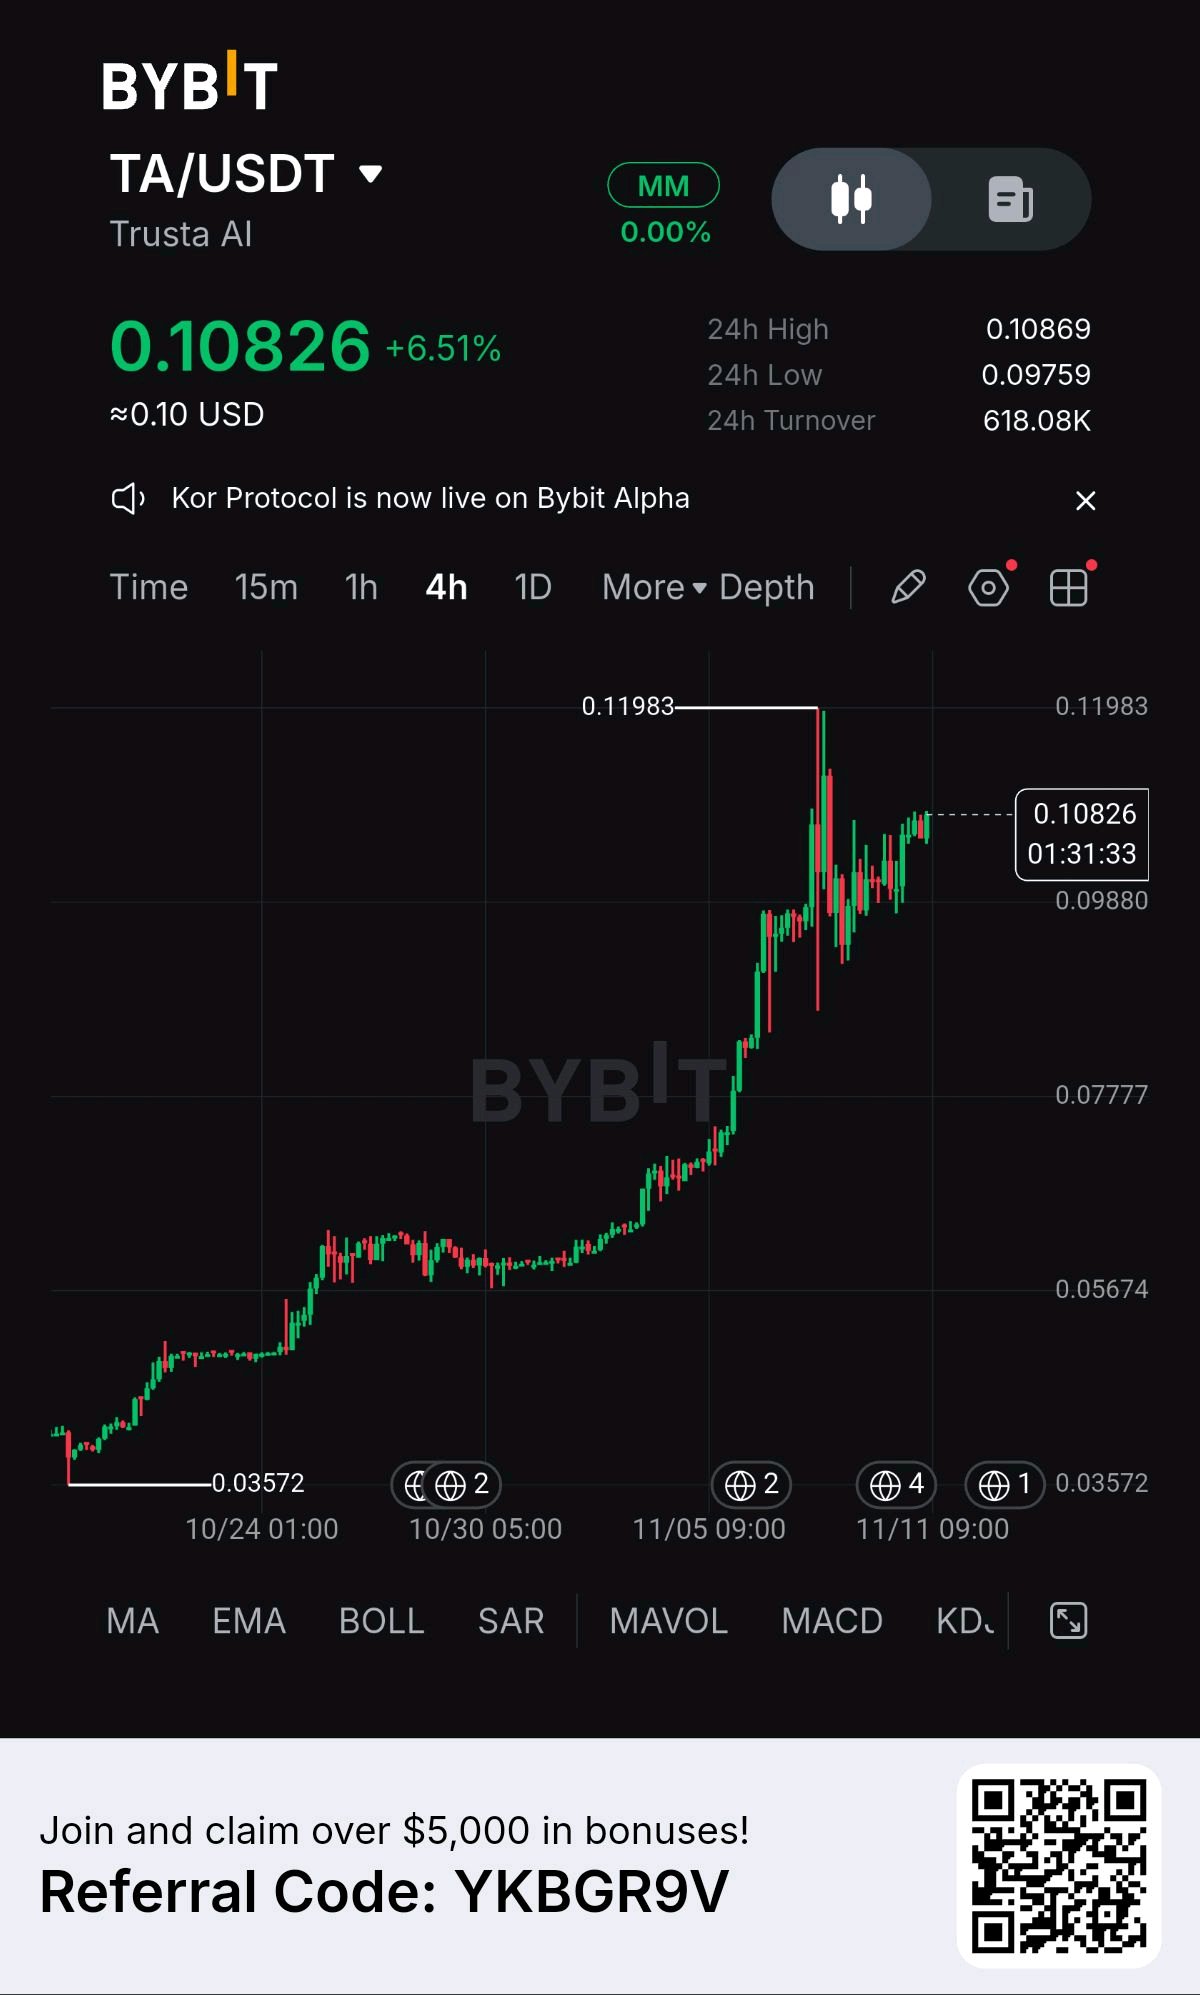
$0.15 目標重申:$TA 拋物線擴張與 AI 資料庫 市場新聞與宏觀催化劑 ✔ Bybit 現貨流動性與成交額:Trusta AI ($TA) 在 Bybit 盤中上漲 +6.51%,交易價格為 $0.10826,24 小時交易成交額為 $618,080。 ✔ AI 身份與鏈上信譽基礎設施:Trusta AI 的核心評分引擎持續擴大在 Layer-1 和 Layer-2 生態系統中的採用,為 Web3 協議提供女巫攻擊防禦與可驗證的身份指標。 ✔ Bybit 生態輪動:Kor Protocol 在 Bybit Alpha 的首次亮相,帶動了交易所內早期 AI 代理與數據管理協議的投機性流動性輪動。 ✔ 盤中區間穩定性:價格走勢在 $0.09759(盤中低點)與 $0.10869(高點)之間建立了穩固的 4 小時交易基準,維持著脫離近期積累區間後的結構性上升趨勢。 市場分析與價格走勢 拋物線趨勢向量:$TA 在 $0.10826 的 4 小時價格走勢顯示,一波強勁的宏觀趨勢擴張正源自 $0.03572 的積累基礎。 上方供應測試:在急劇飆升至 $0.11983 的局部波段高點後,價格走勢在 $0.09880 處盤整出更高的低點,隨後恢復上行軌跡,再次測試局部高位供應。 當前動能:市場結構極為看漲,買方捍衛階梯式支撐位($0.03572 → $0.05674 → $0.07777 → $0.09880),以維持上行勢頭。 流動性目標:下方的賣方流動性位於 $0.09880 下方。在上行方面,即時的買方流動性位於 $0.11983,二次宏觀擴張目標鎖定在 $0.13500 和 $0.15000。 支撐位與阻力位 ✔ 即時支撐:$0.09880 – $0.10200(4 小時局部盤整平台與更高低點的需求底部) ✔ 失效支撐:$0.07777(主要的結構性波段破位點) ✔ 第一阻力目標:$0.11983 – $0.13500(即時局部高點與擴張供應區) ✔ 宏觀阻力目標:$0.15000 – $0.18000(主要的歷史價格探索目標區) 風險管理規則:4 小時收盤價若低於 $0.07777,將導致即時拋物線延續論點失效,並引發向 $0.05674 等更低流動性區間回落的風險。請務必將倉位規模嚴格控制在總交易資產的 1%–2% 以內。 $TAUSDT $COREUSDT #WSOT2026 #WSOTPicktoEarn10U #NovUSCPIWatch

Altcoin Opportunities
Research Before Following the Crowd! The altcoin market offers many innovative projects, but popularity alone does not establish long-term value. I prefer to examine tokenomics, development progress, liquidity, partnerships, and actual product usage before evaluating any project. Understanding the risks is just as important as identifying potential opportunities. Which altcoin deserves more attention for its technology and real-world utility? This is my personal market analysis, not financial advice. Always do your own research (DYOR). #Altcoins #CryptoResearch #Tokenomics #Blockchain #Bybit #DYOR #BybitAIEvolving #WSOT2026 #NovUSCPIWatch #WSOTPicktoEarn10U #USPayrollsAndRateDecisionsDriveMacroWeek
Solana ($SOL)
Can Ecosystem Expansion Strengthen Its Position? Solana has built a growing ecosystem around decentralized finance, applications, and digital assets. Its ability to attract developers, maintain network reliability, and increase real user activity will be important factors to watch. I believe long-term adoption is more meaningful than temporary market excitement. What should Solana prioritize next: network stability, developer growth, or wider adoption? This is my personal market analysis, not financial advice. Always do your own research (DYOR). #Solana #SOL #Blockchain #CryptoAnalysis #Bybit #DYOR$SOLUSDT #WSOTPicktoEarn10U #NovUSCPIWatch #WSOT2026 #USPayrollsAndRateDecisionsDriveMacroWeek #BybitAIEvolving

GRAM Gains 10%: Can Bulls Break $1.20?
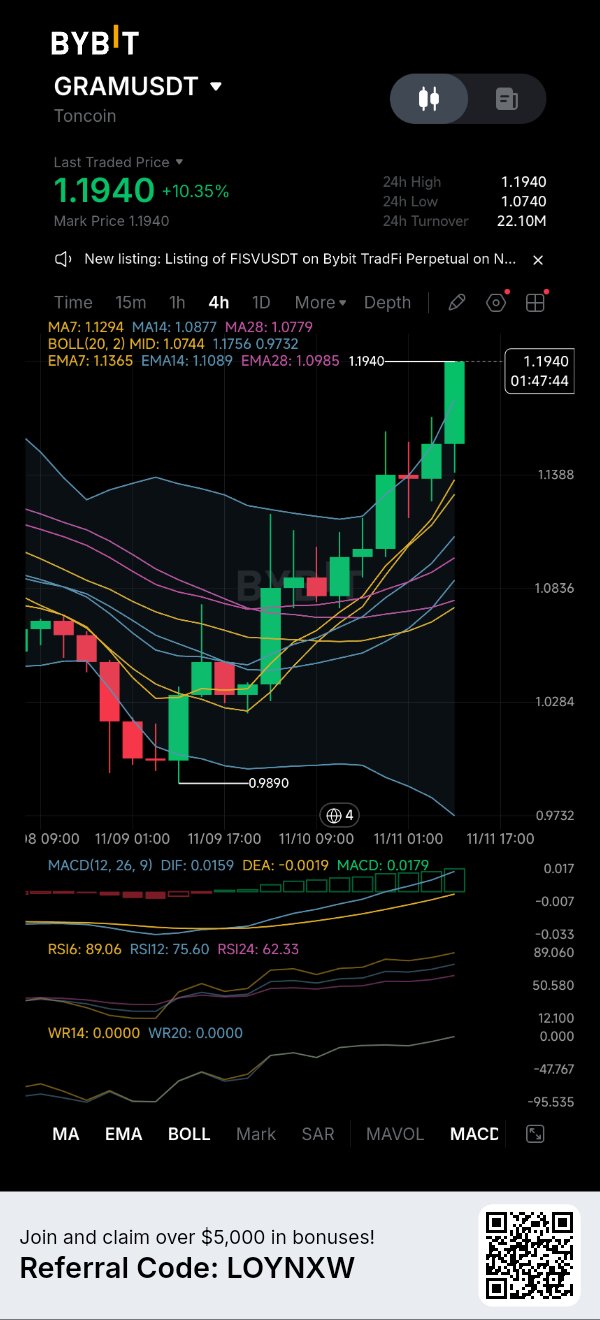
$GRAMUSDT is showing impressive momentum after recovering from its recent $0.9890 low. Price is now trading around $1.1940, up 10.35%, with consecutive bullish candles pushing toward the $1.20 psychological resistance. The 4H structure has turned decisively bullish: • Price is above MA7 ($1.1294), MA14 ($1.0877) and MA28 ($1.0779). • MACD is bullish, with DIF at 0.0159 above DEA at -0.0019. • The MACD histogram has expanded to 0.0179, confirming strengthening momentum. • RSI6 stands at 89.06, while RSI12 is at 75.60, indicating an extremely overbought market. There is strong buying pressure, but the distance between price and the moving averages suggests that the rally may need a cooling-off period. Key levels to watch: - Immediate resistance: $1.1940 - Psychological resistance: $1.2000 - First support: $1.1756 - Secondary support: $1.1365–$1.1294 - Stronger support: $1.1089–$1.0985 A sustained breakout above $1.1940 could bring $1.20 into focus. However, rejection near this level could trigger profit-taking, with $1.1756 becoming the first important support to monitor. The bullish momentum is clear, but an RSI above 89 is a warning against chasing the current candle. Trading focus: Watch for consolidation, a controlled pullback or a confirmed breakout retest. Check liquidity, define invalidation and assess risk-to-reward before considering a position. Can GRAM sustain its momentum above $1.20, or will buyers take a breather first? Not financial advice. DYOR. #WSOT2026 #NovUSCPIWatch #WSOTPicktoEarn10U #USPayrollsAndRateDecisionsDriveMacroWeek #OilVolatilityTracksIranPeaceTalks $GRAMUSDC

BTC & ETH
The Two Pillars of the Crypto Market Bitcoin and Ethereum continue to serve different but important roles in the digital asset industry. Bitcoin is known for its limited supply and decentralized value, while Ethereum supports smart contracts and a wide range of blockchain applications. Their future development depends on adoption, investor confidence, and technological progress. Which one do you believe has stronger long-term potential: $BTC or $ETH? This is my personal market analysis, not financial advice. Always do your own research (DYOR). #Bitcoin #BTC #Ethereum #ETH #CryptoMarket #Bybit #DYOR #WSOT2026 #NovUSCPIWatch #WSOTPicktoEarn10U #USPayrollsAndRateDecisionsDriveMacroWeek #OilVolatilityTracksIranPeaceTalks $BTCUSDT $ETHUSDT

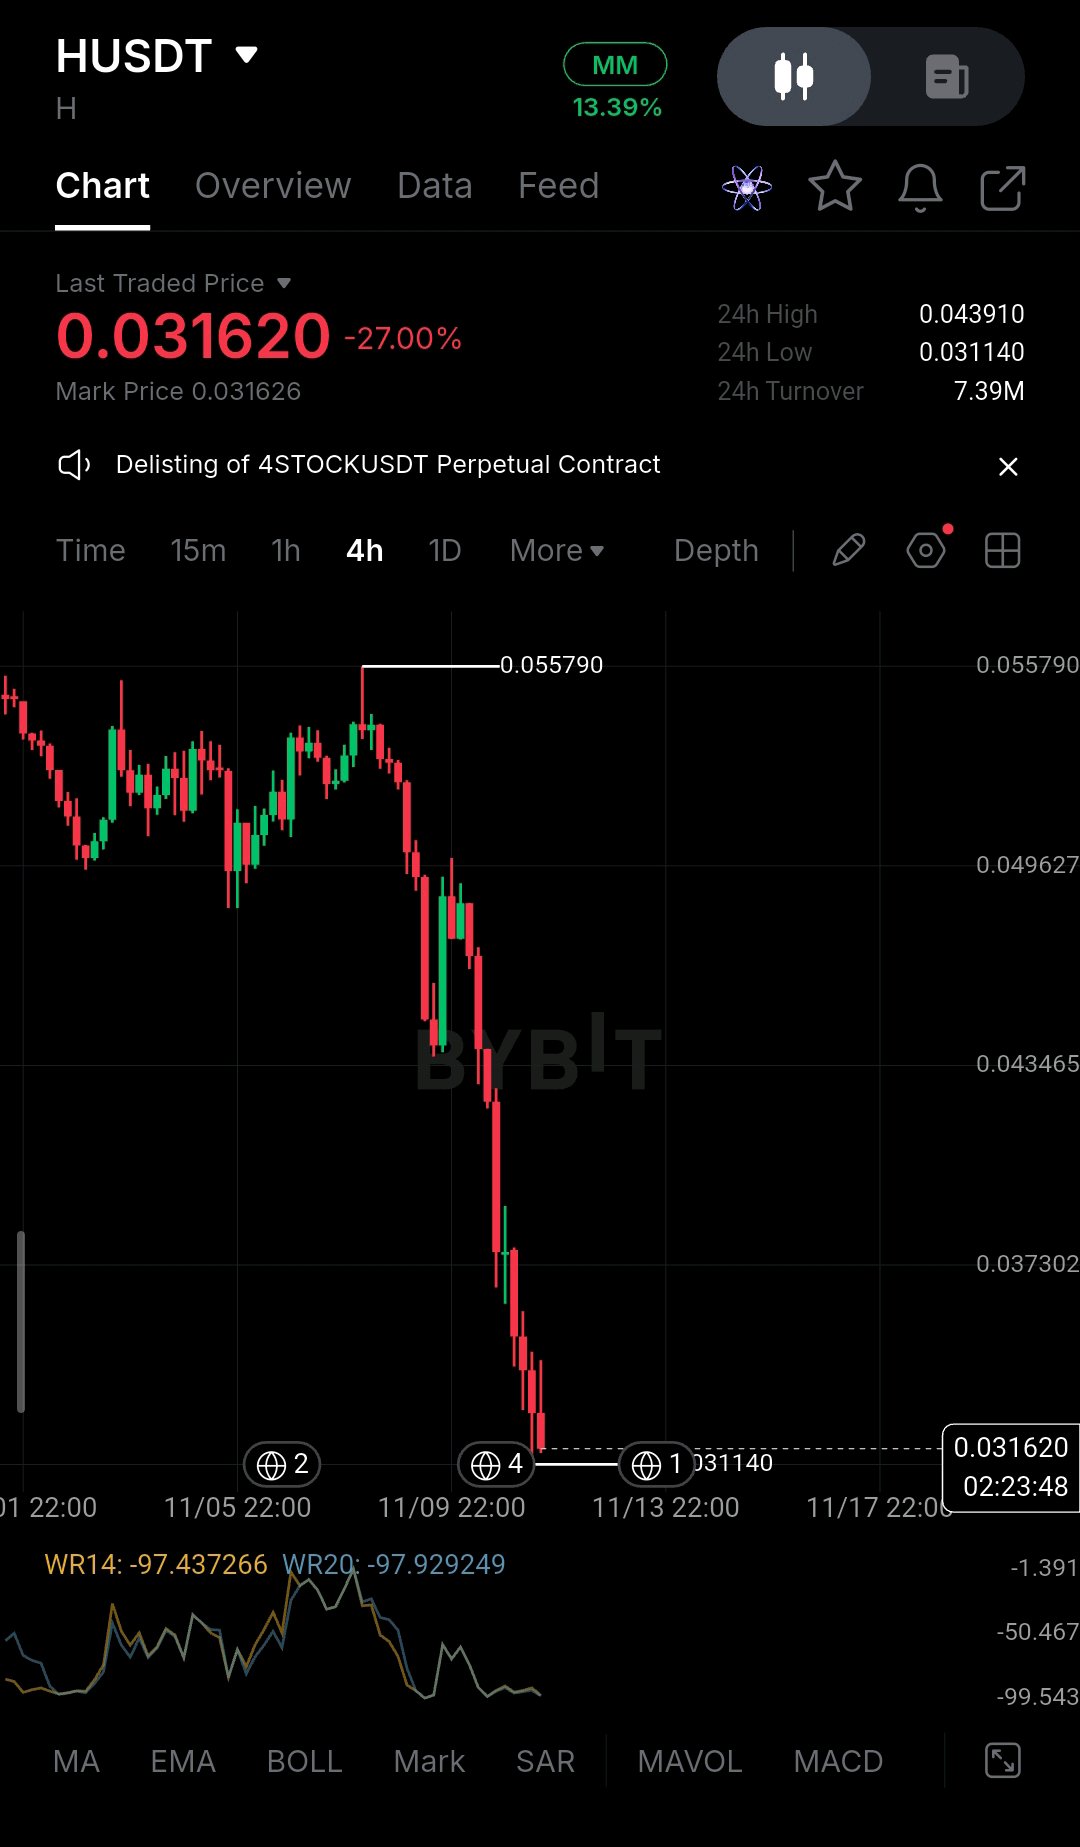
😳📉 $HUSDT Humanity Protocol is bleeding again, and the chart is heading underground ⚰️ 🩸 Market cap is down from over $1B at the peak to roughly $70-80M now (my estimate) 💥 🧨 The June $36M private-key hack never healed. It crashed the token about 90% and forced a full token migration 🔑 🔓 The next unlock is Nov 25: 266M H, about $8M at today's price. Traders are front-running the sell pressure 📉 👀 GoPlus flags the new token contract as upgradeable, so the owner can change code, including minting 🚨 Is this the bottom, or is the unlock about to push it lower? 🕳️ Which one scares you more: the unlock or the contract? 👇 ➕ Follow for more #NovUSCPIWatch #USPayrollsAndRateDecisionsDriveMacroWeek #WSOTPicktoEarn10U @BybitX @killer901 @WhaleX🐳 @DON'T JUDGE ME

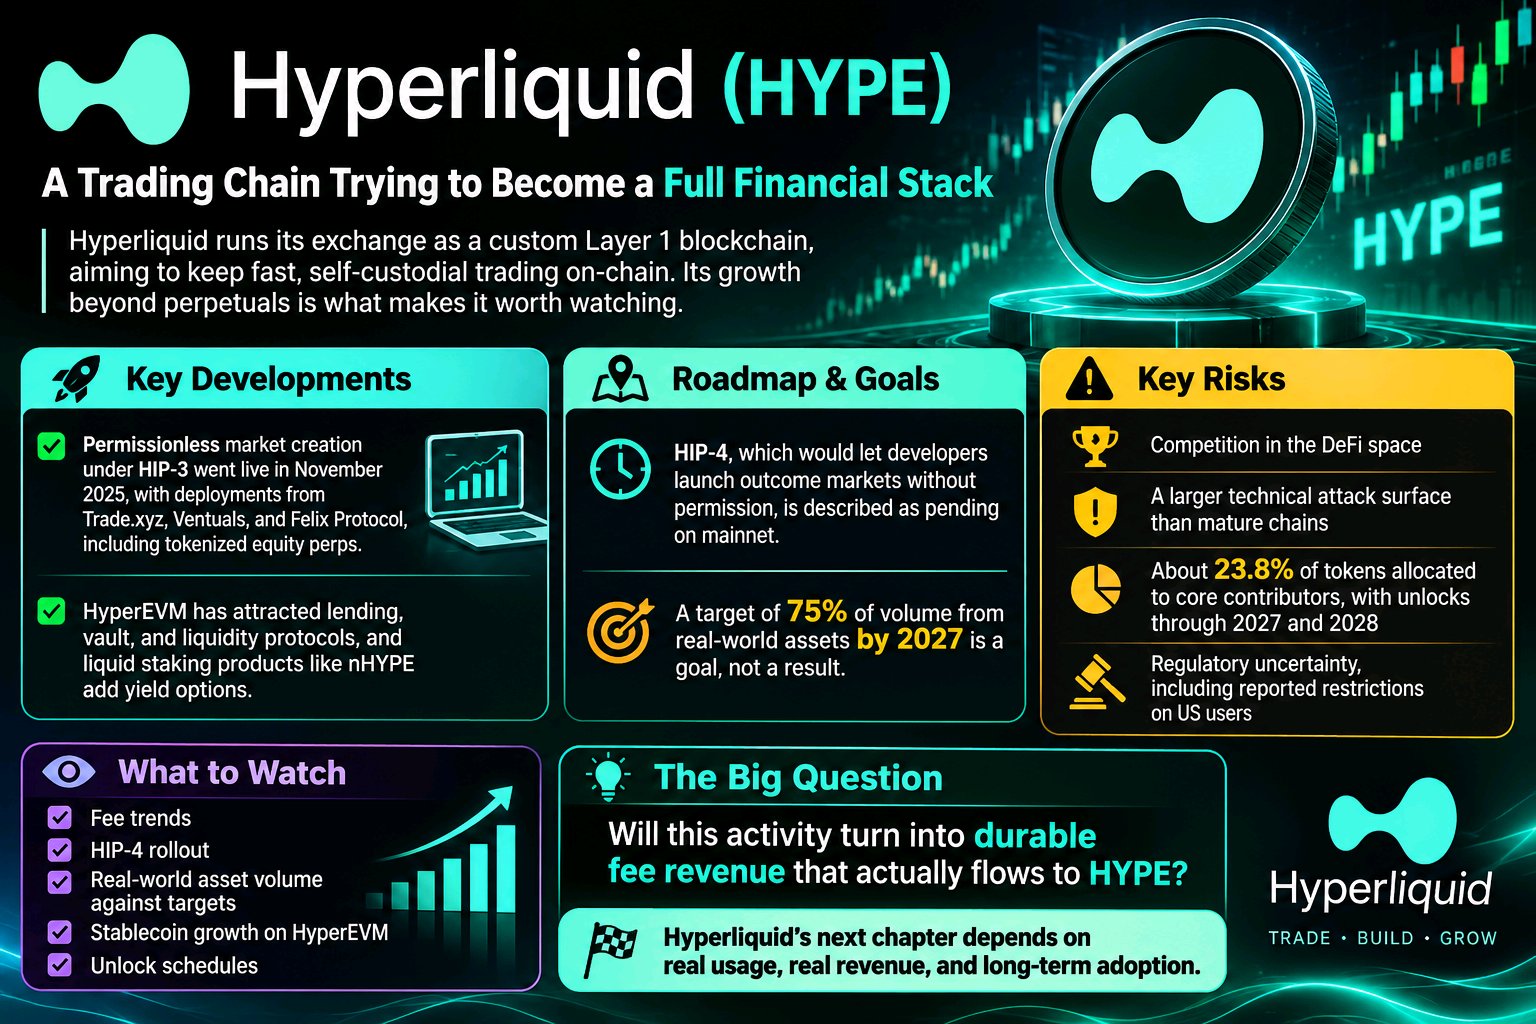
Hyperliquid (HYPE):一條試圖成為完整金融堆疊的交易鏈 Hyperliquid 以客製化的 Layer 1 區塊鏈運行其交易所,旨在保持鏈上快速且自我託管的交易體驗。它超越永續合約的成長潛力,正是值得關注的原因。 根據 HIP-3 的無須許可市場創建功能已於 2025 年 11 月上線,並由 Trade.xyz、Ventuals 和 Felix Protocol 進行部署,其中包括代幣化權益永續合約。HyperEVM 吸引了借貸、金庫和流動性協議,而 nHYPE 等流動性質押產品則增加了收益選項。 有些項目仍處於展望階段。旨在讓開發者無需許可即可推出預測市場的 HIP-4 目前被描述為等待在主網部署;而 2027 年將 75% 的交易量來自現實世界資產(RWA)的目標,目前僅是目標而非結果。 更大的問題在於,這些活動是否能轉化為真正流向 HYPE 的持久手續費收入。風險包括競爭、相較於成熟鏈更大的技術攻擊面、約 23.8% 分配給核心貢獻者並將於 2027 年及 2028 年逐步解鎖的代幣,以及監管的不確定性,包括據報導對美國用戶的限制。 密切關注手續費趨勢、HIP-4 的推行進度、現實世界資產交易量與目標的對比、HyperEVM 上的穩定幣成長,以及代幣解鎖時間表。 #IMPACTbyTrade $HYPEUSDT $BTCUSDT #Oracle20B 資金計劃測試 TheAITrade #WSOT2026 #WSOTPicktoEarn10U

🚨 $AVAX IS WAKING UP — IS $9 NEXT? 👀
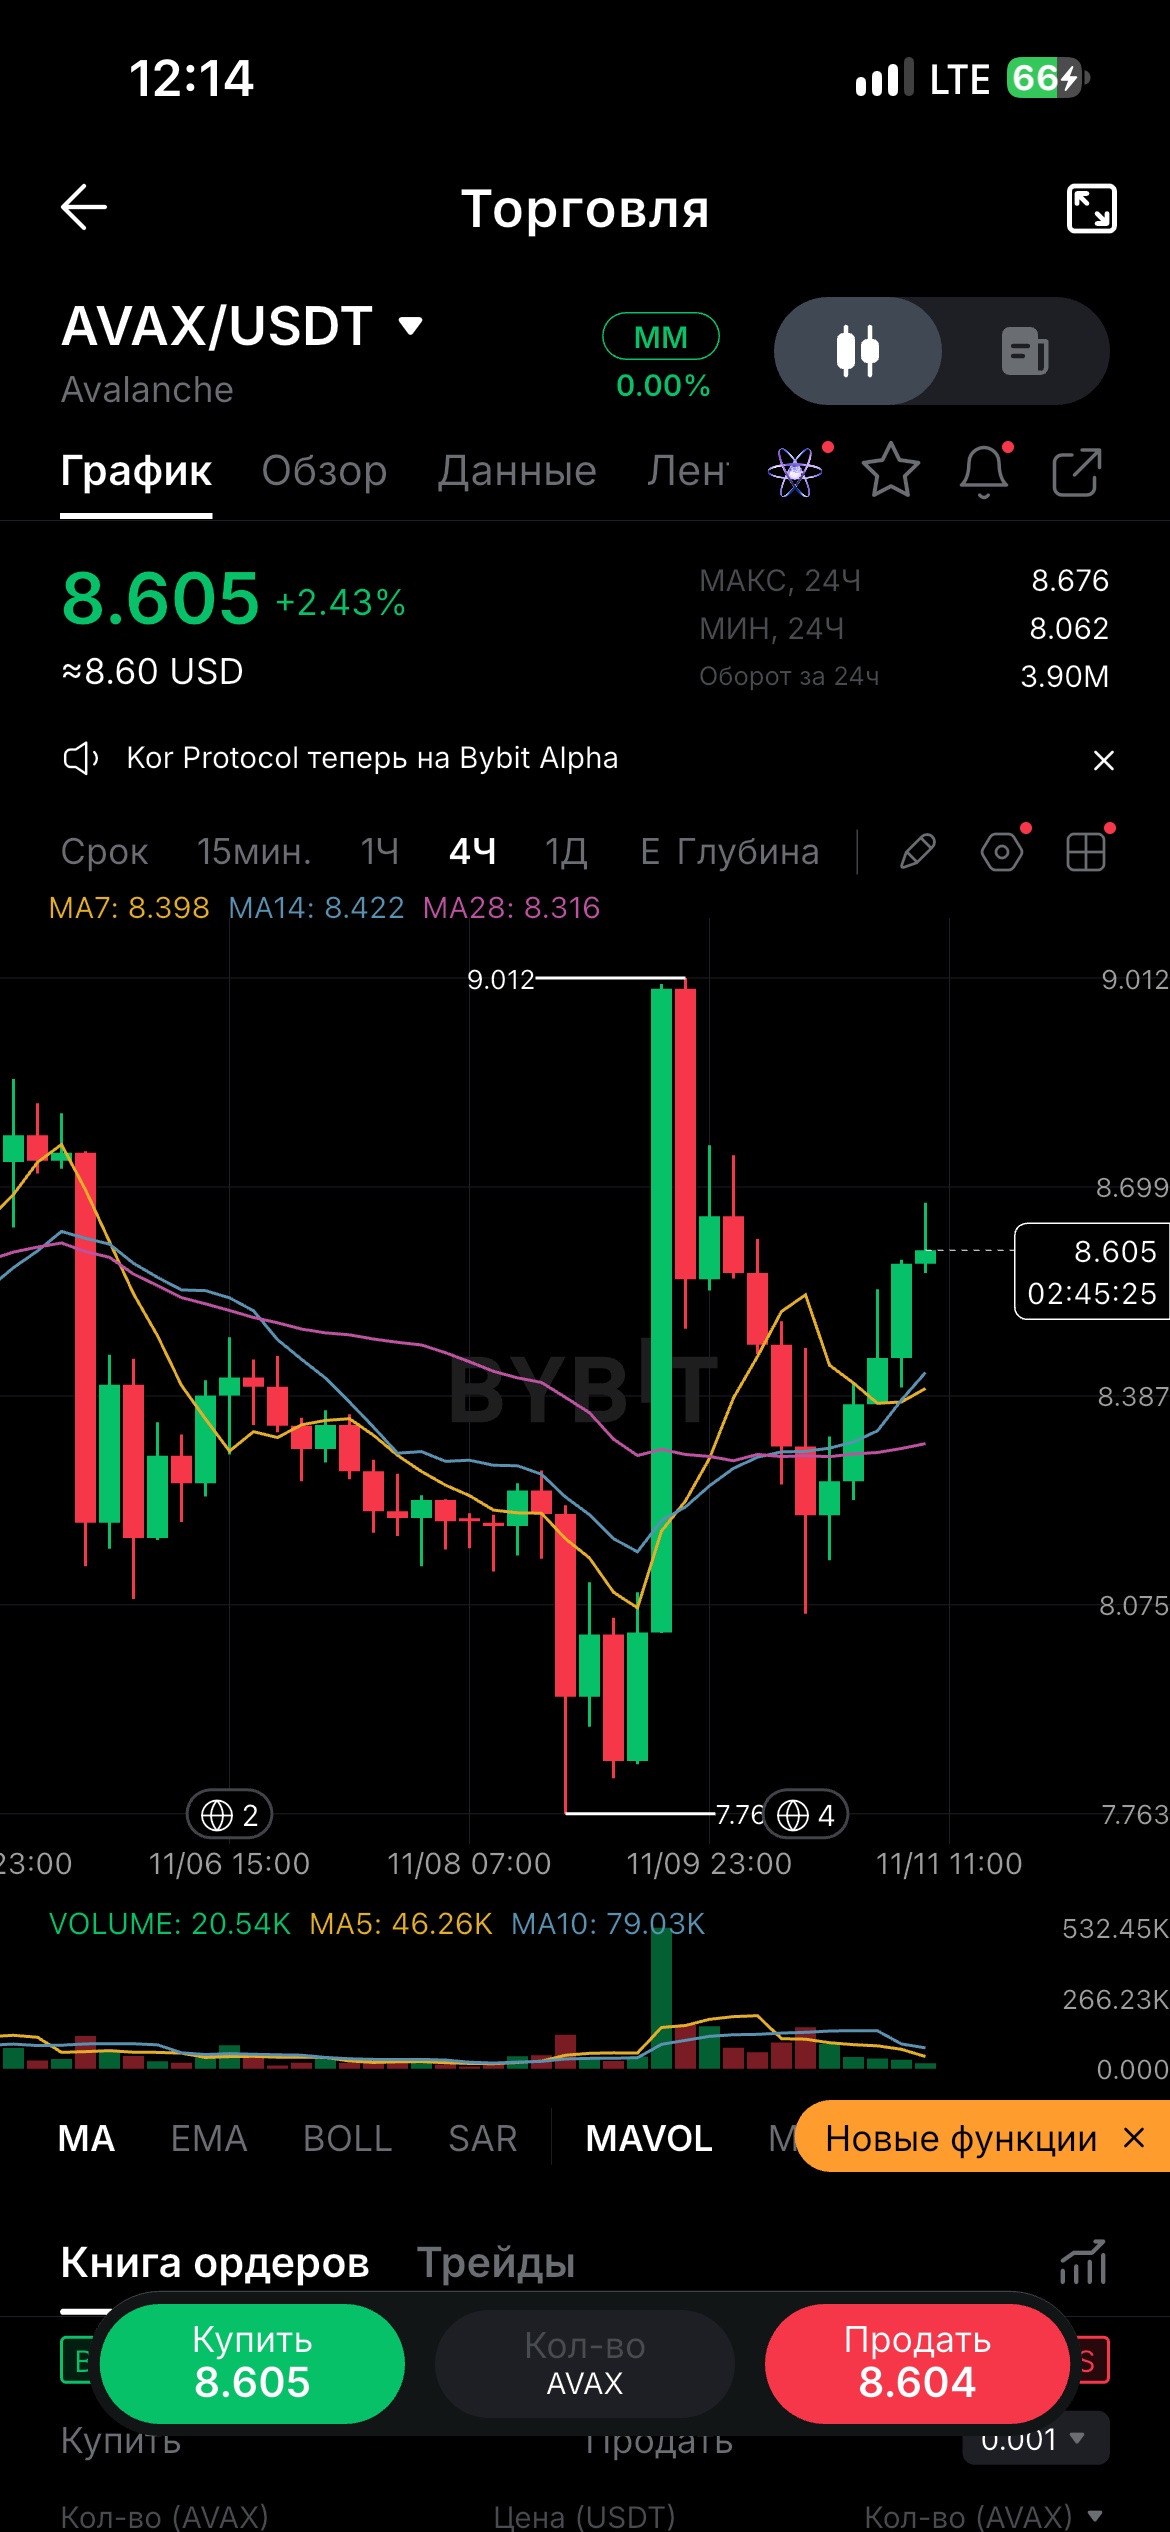
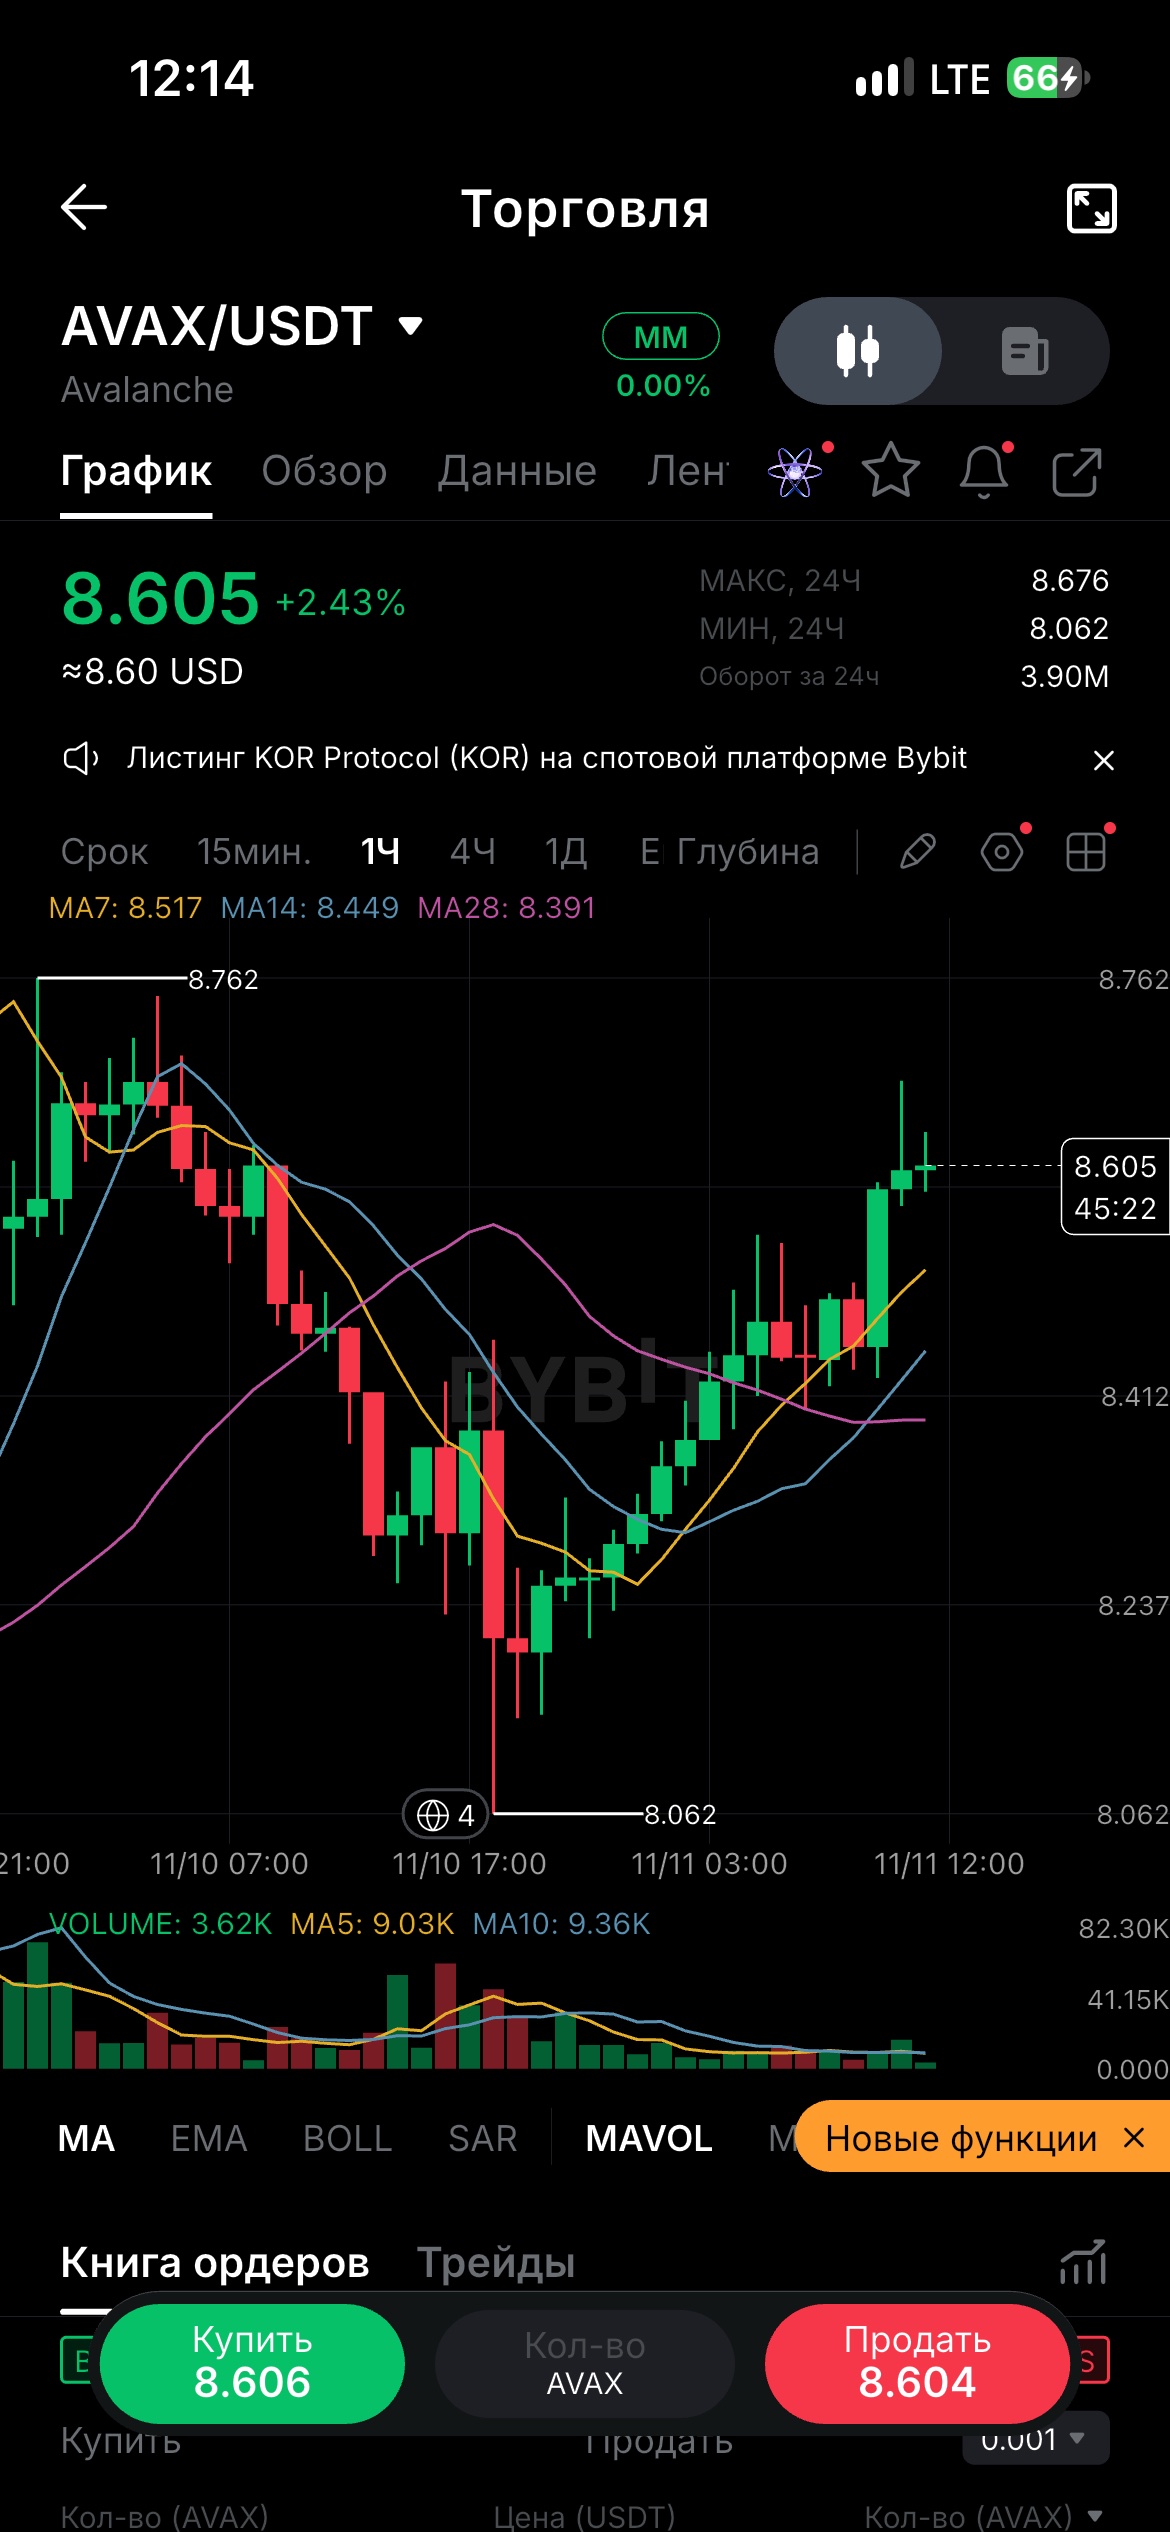
While traders are watching BTC, $AVAXUSDT is quietly building momentum. 🟢 Price: $8.60 (+2.43%) 📈 1H: Trading above MA7, MA14 & MA28 🔥 4H: Buyers pushing price higher KEY LEVELS: 🎯 $8.68 — immediate resistance 🚀 $9.00 — next bullish target 🛡️ $8.40 — important support A breakout above $8.68 could open the door to $9. But is this a real reversal or just another bull trap? 💬 to $9 or back to $8? 👇 #WSOT2026 #NovUSCPIWatch #WSOTPicktoEarn10U #USPayrollsAndRateDecisionsDriveMacroWeek #Волатильность нефти отслеживает мирные переговоры по Ирану
🟢 ETH — Good‑News Focus & Market Analysis (Nov 11 2026) Even as short‑term price action remains choppy (ETH currently ~$2,050, down ~3.8 % 24‑hr), several structural positive catalysts are building behind the recent pullback. ✅ Key Good News for Ethereum 1. Strong long‑term staking loyalty Nearly 36.4 % of circulating ETH — about 44.5 million tokens — remains locked in staking contracts, with no large‑scale unstaking rush amid volatility. This shrinking liquid supply acts as a structural floor: fewer coins available for immediate sale during dips, while yield‑seeking holders continue to accumulate for multi‑cycle positions. 2. Whale smart‑money buying at support zones On‑chain data shows large‑cap wallets have stepped in to accumulate near the $2,000‑$2,050 range — one notable group purchased over 20 000 ETH in recent sessions at average prices close to current levels. Many analysts view this weekly 0.618 Fibonacci retracement zone as a historically reliable accumulation window for medium‑term ETH cycles . 3. Upcoming Glamsterdam upgrade pipeline The highly anticipated Glamsterdam upgrade is scheduled for late‑Q4 2026, bringing parallel transaction execution and ePBS (proposer‑builder separation) — designed to boost base‑layer throughput, lower Layer‑1 congestion, and further strengthen decentralization for the fast‑growing Layer‑2 ecosystem . Layer‑2 transaction volumes have stayed resilient through market softness, keeping Ethereum’s position as the leading home for real‑world‑asset (RWA) and stablecoin settlement. 4. Broader global regulatory progress Outside the US, clearer frameworks for ETH‑linked investment products are emerging across Asia and Europe, opening new institutional access channels that could offset near‑term US spot‑ETF outflows over time . 📊 Balanced Technical & Macro Outlook Short‑term headwinds remain: hotter‑than‑expected US inflation data keeps Fed‑rate‑hike expectations elevated, pressuring risk assets, while US ETH spot ETFs have seen several days of net outflows recently. - Immediate support zone: $2,000‑$2,020 - First bullish trigger: Sustained close above $2,130‑$2,200, which would signal a shift back toward recovery momentum The positive story here is not about an instant price jump — it is about fundamentals holding firm while sentiment wavers. For longer‑term observers, the current pullback is being framed as a chance to focus on Ethereum’s expanding utility pipeline rather than short‑term volatility. $ETHUSDT $BTCUSDT #ByXIMPACT #WSOT2026 #WSOTPicktoEarn10U #BybitAIEvolving
🚨 $HYPE — 是多頭陷阱還是反轉的開始?
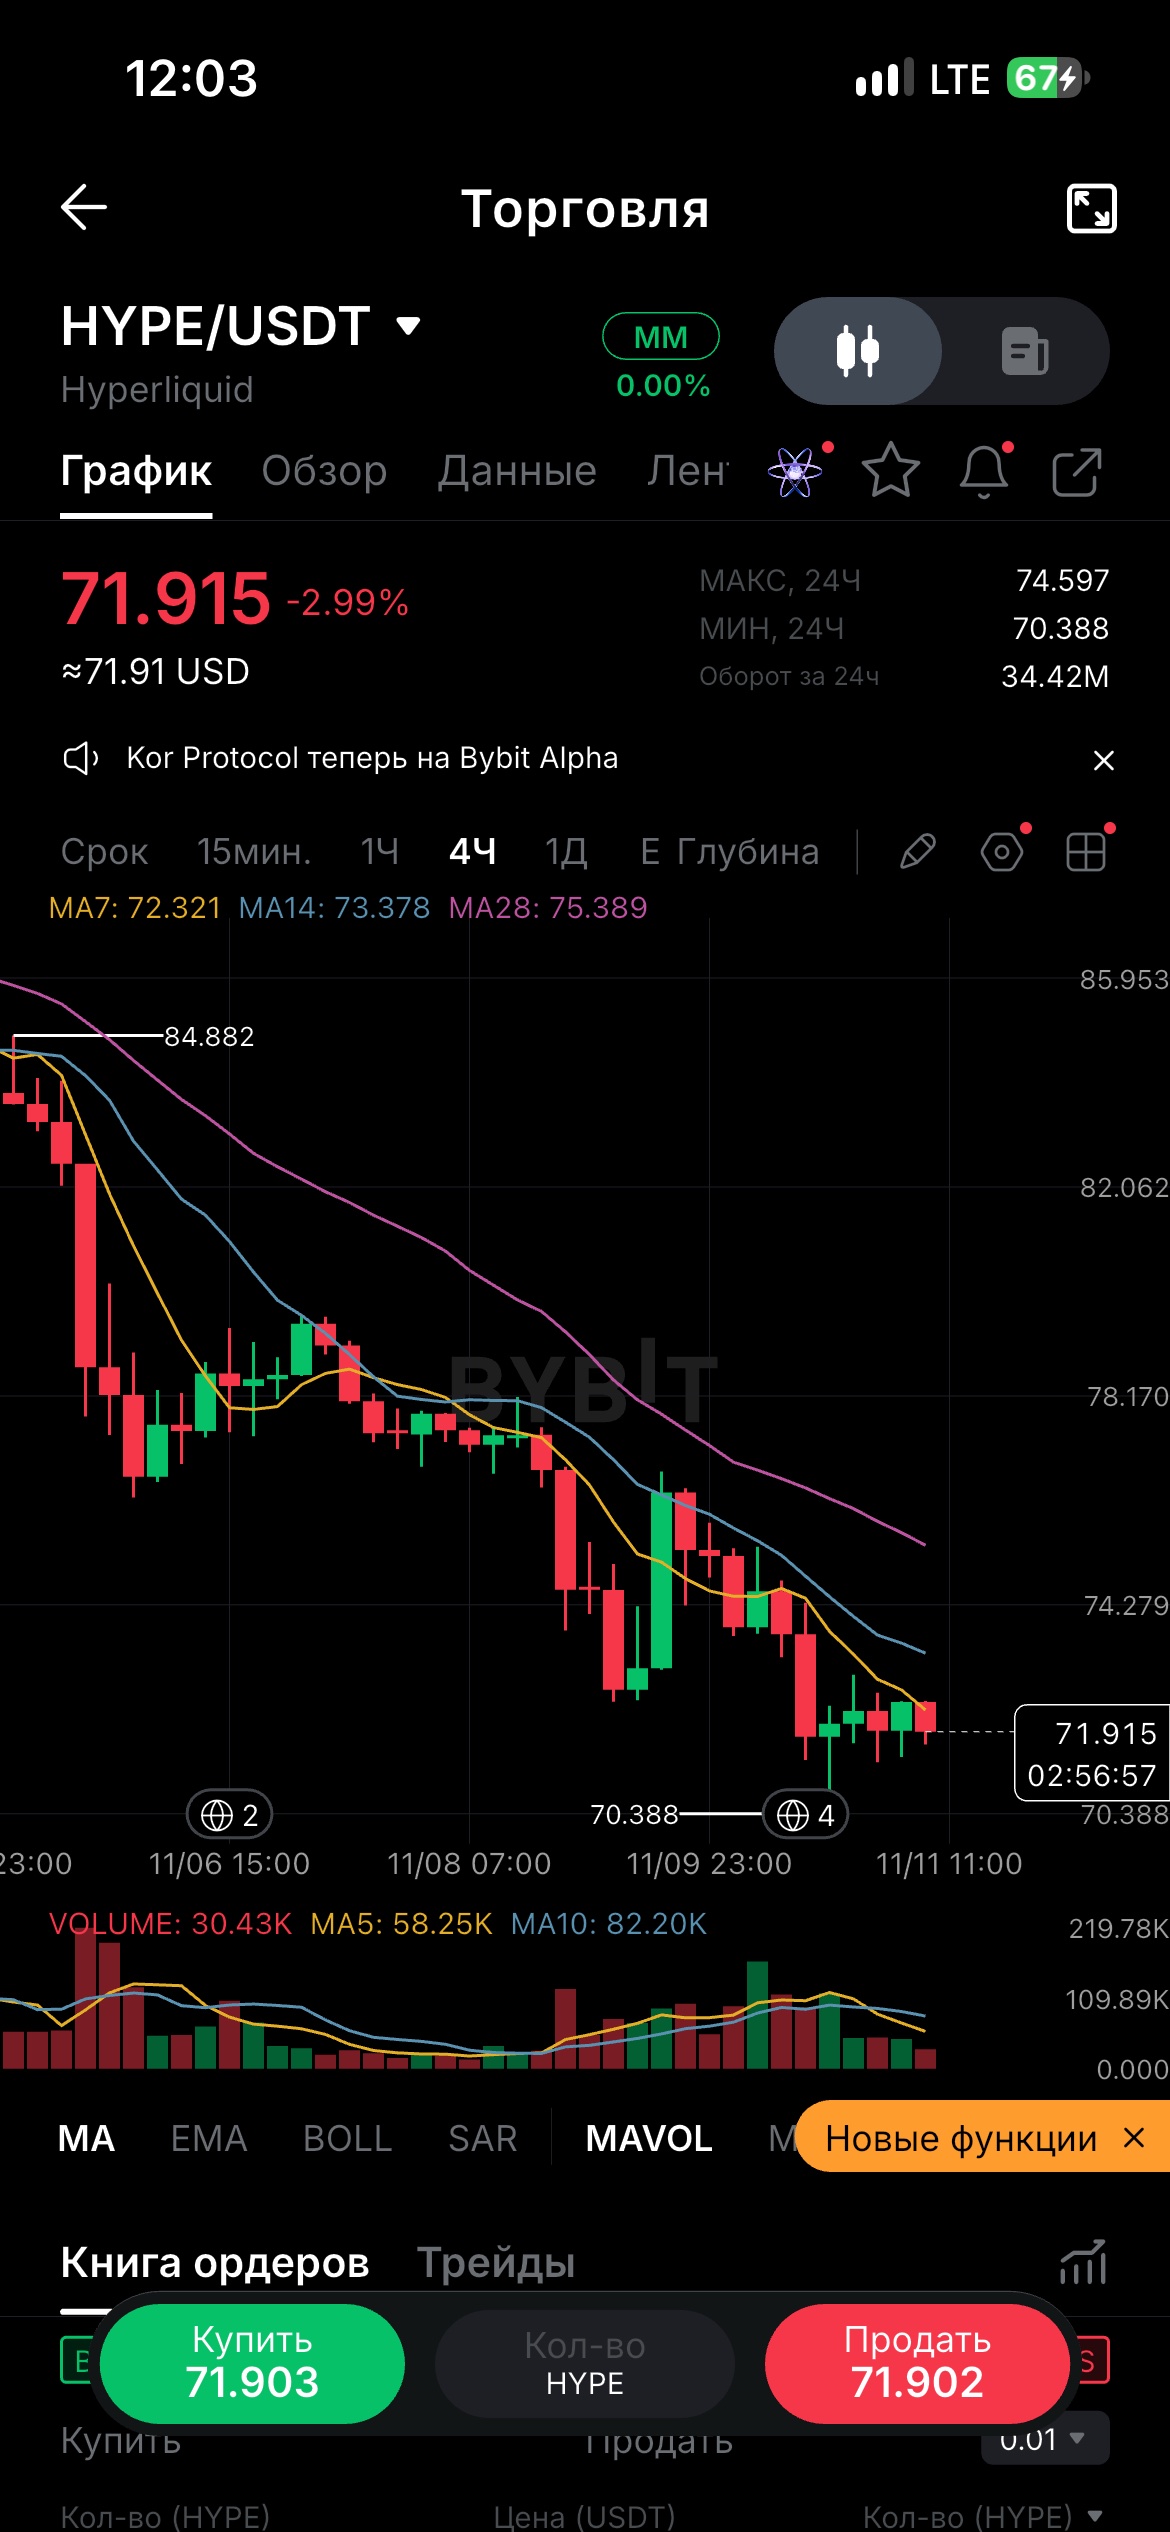
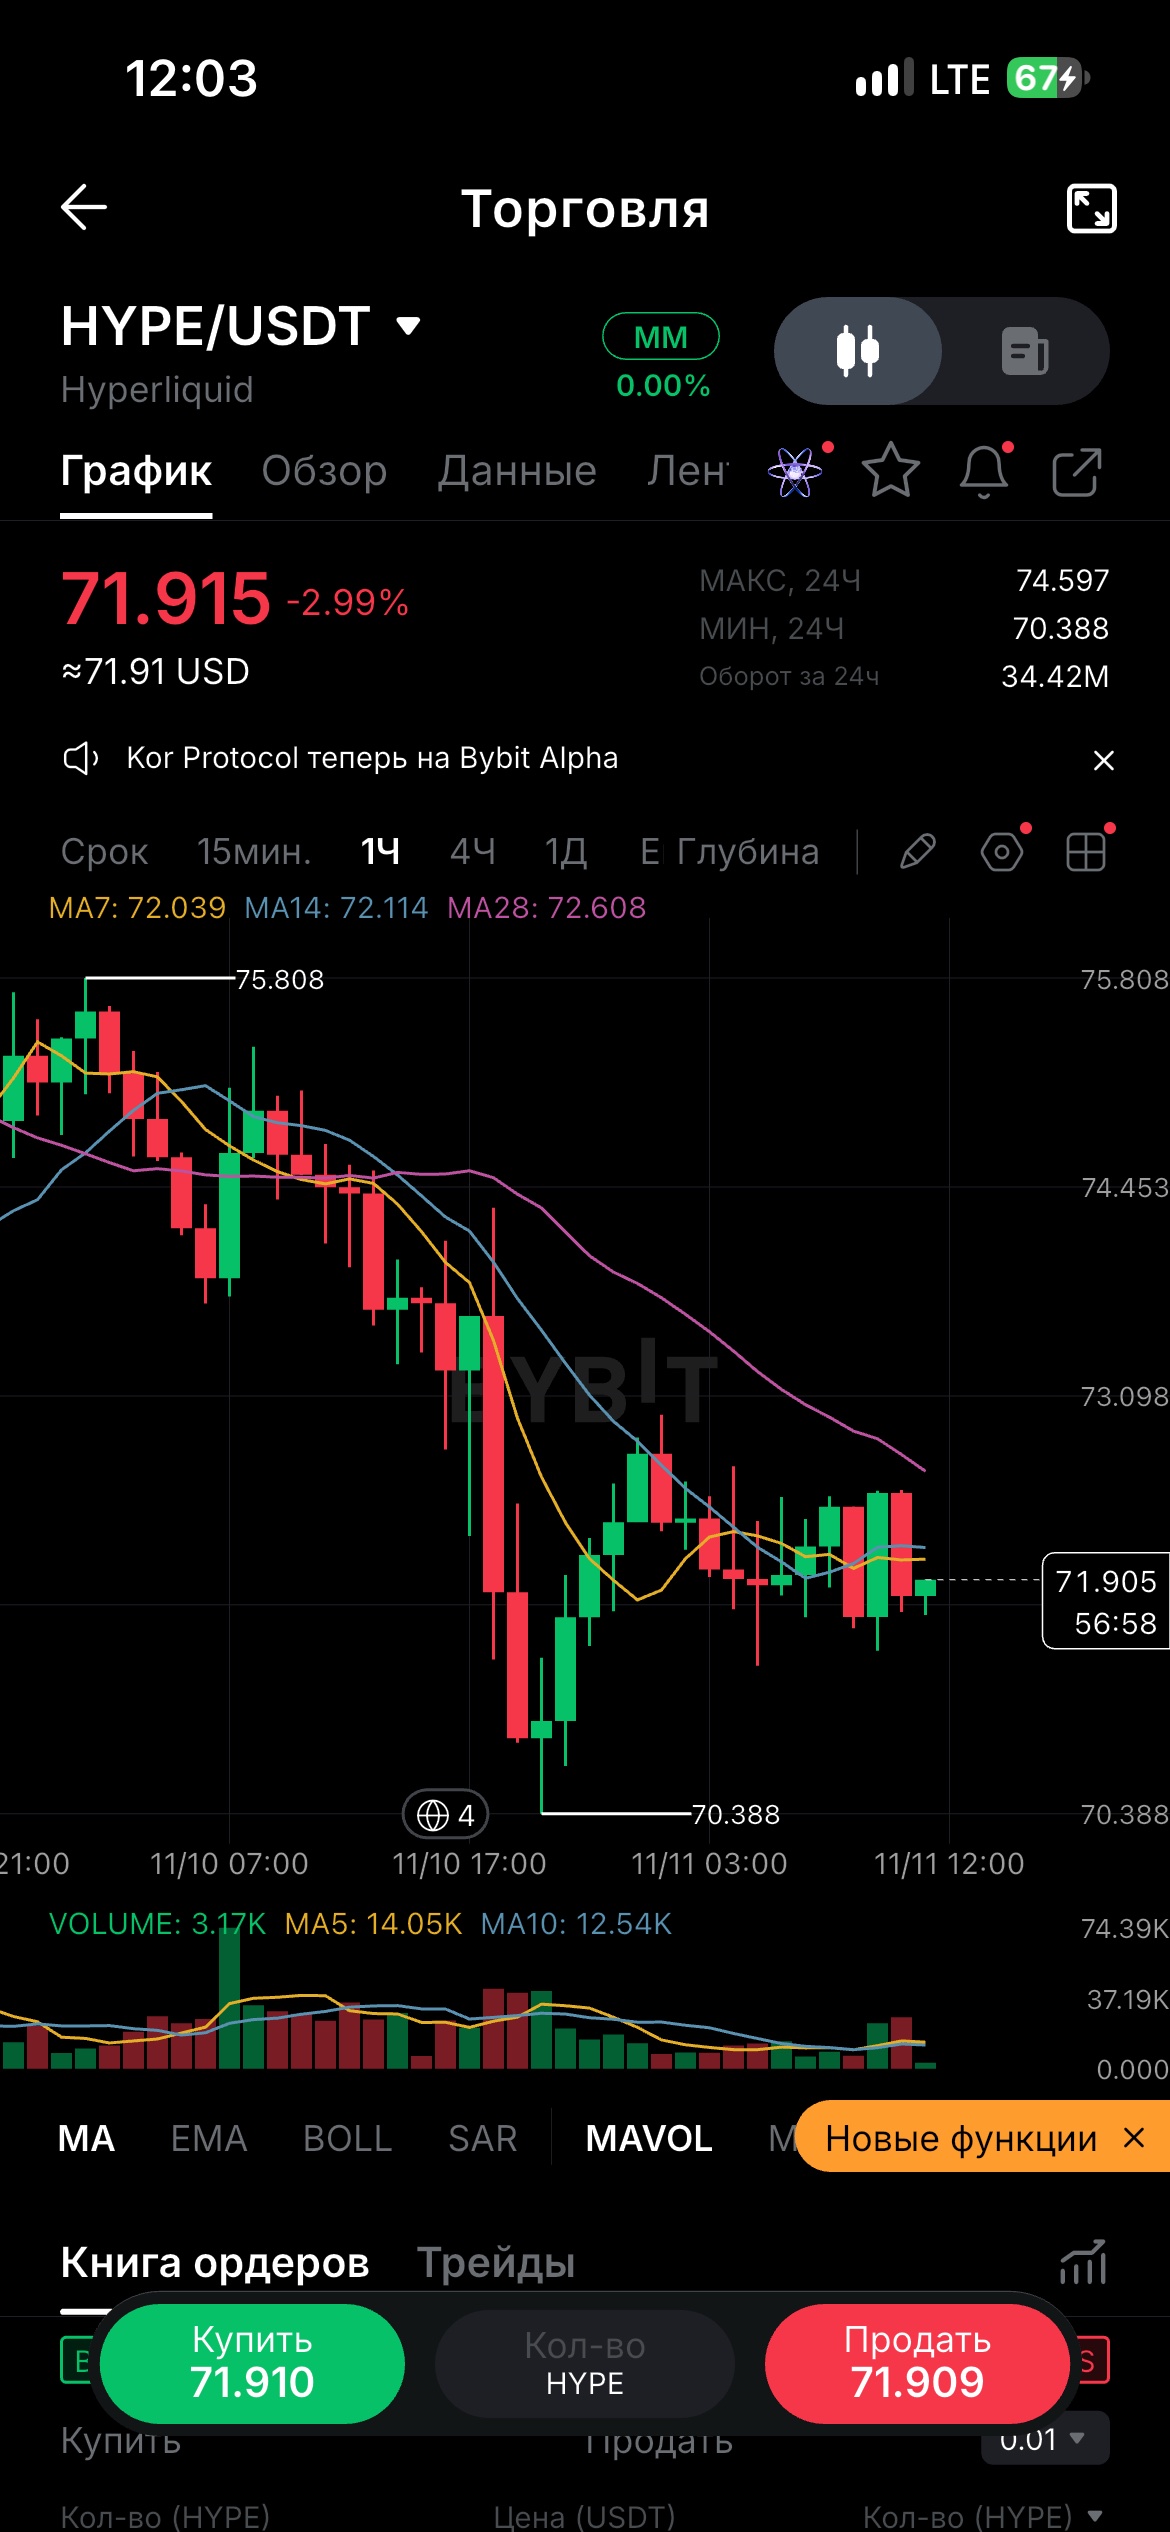
$HYPEUSDT 目前在 $71.9 附近交易,先前曾從 $70.38 反彈。 📉 4小時線走勢依然看跌。 🟢 突破 $72.6 → 多頭可能上看 $73.4 🔴 跌破 $71.35 → 將再次回測 $70.38 👀 巨鯨是在吸籌還是準備再次拋售? 你的下一步是什麼 — 做多還是做空?👇 #WSOT2026 #NovUSCPIWatch #WSOTPicktoEarn10U #美國就業數據與利率決策主導本週宏觀市場 #AnthropicIPOValuationTest
📊Current BTC snapshot Bitcoin (BTC) is trading around $73,700 (‑~2.1 % 24‑hr), after dipping to an intraday low near $72,700 overnight . Total crypto‑market liquidations hit ~$723 M in the past 24 h, with most from long‑position forced closes . Key drivers behind the pullback - Hot US inflation data: October CPI rose 0.4 % month‑over‑month (above forecasts), lifting market odds of another Fed interest‑rate hike in December — higher rates tend to weigh on non‑yielding assets like BTC . - ETF outflows: US spot Bitcoin ETFs saw net outflows for a third straight session as institutional investors reduced exposure . - Regulatory uncertainty: Post‑US‑election policy outlook + Fed‑crypto banking disputes added risk‑off sentiment . Technical levels being watched - Near‑term support zone: $72,700‑$73,000 - First resistance to reclaim: $74,500‑$75,000 - A break below main support could open a move toward $70,000, per technical analysts . Quick altcoin update - ETH: ~$2,050 (‑~3.8 % 24 h) - XRP: ~$1.05 (‑~4.2 % 24 h) Upcoming catalysts to monitor - Fed officials’ speeches & December rate‑hike signalling - Weekly US spot‑ETF flow reports - On‑chain miner‑selling & large‑wallet movement data $BTCUSDT #ByXIMPACT #WSOT2026 #WSOTPicktoEarn10U #NovUSCPIWatch
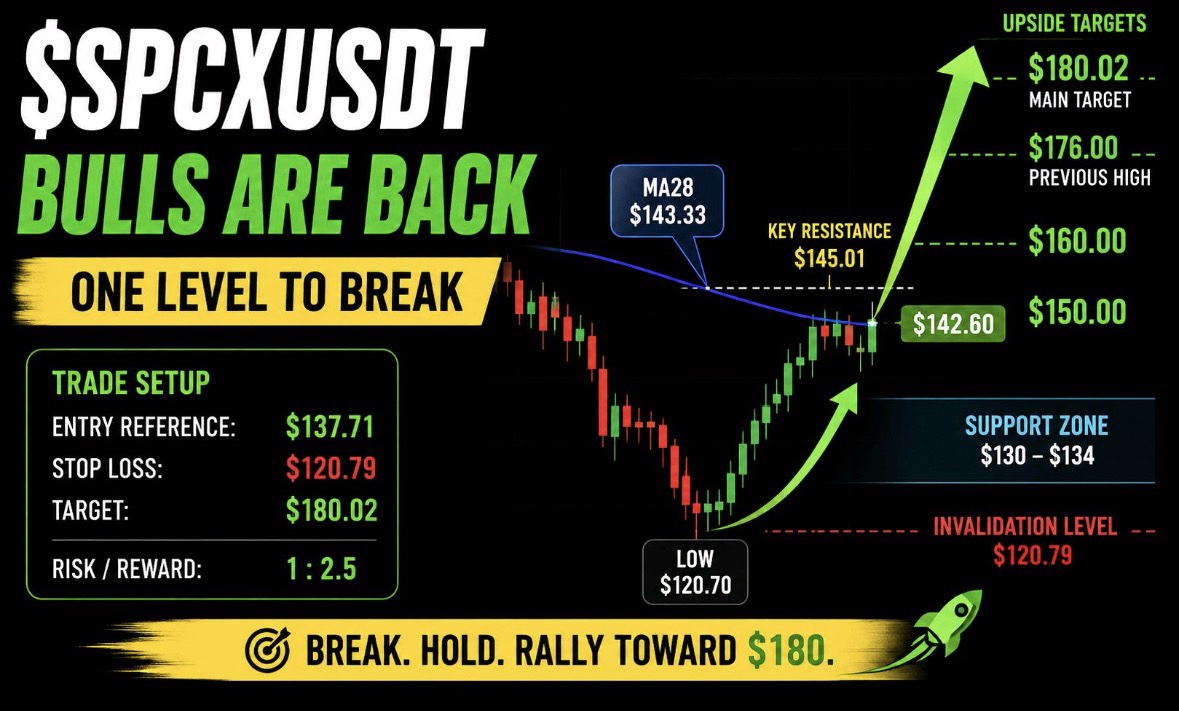
#SPCXXUSDT Bulls have recovered control, but one major hurdle remains. SPCX has staged a strong comeback from $120.70, reclaiming the lost ground and pushing back toward $142.60. Now the market is approaching a critical decision zone. spcx #WSOT2026 #NovUSCPIWatch #USPayrollsAndRateDecisionsDriveMacroWeek #WSOTPicktoEarn10U #BybitAIEvolving
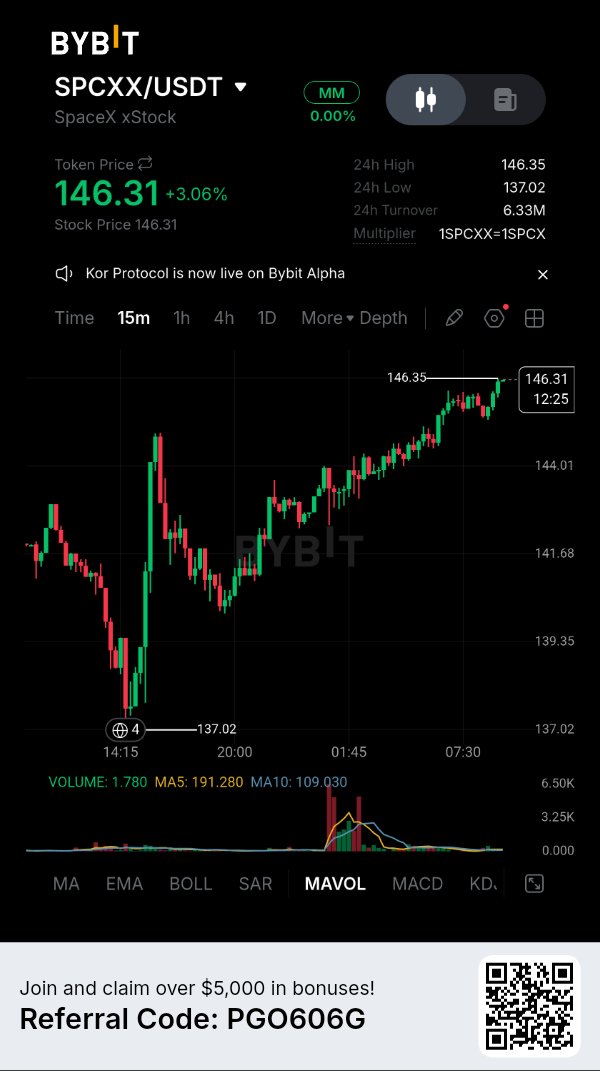
📊 Chart Overview · Asset: SPCXX paired with USDT (SpaceX xStock). · Current Price: $146.31 (Up +3.06%). · Timeframe: 15-minute (15m) chart. (Intraday view). · 24h Data: High: $146.35 | Low: $137.02 | Turnover: 6.33M. · Crucial Detail: The chart shows a "Multiplier" of 1SPCXX = 1SPCX. 📈 Technical Analysis Breakdown 1. Price Action & Recovery · The V-Shape: The chart displays a dramatic, aggressive V-shaped recovery. After a severe sell-off down to $137.02 (marked with a #4 circle), the price found immediate, strong support. · The Uptrend: From the bottom, buyers aggressively stepped in. The price formed a consistent series of higher highs and higher lows. · Current State: The price is currently pushing up against the 24-hour high of **$146.35**, resting just slightly below it at $146.31. It is consolidating in a tight range at the top of this trend. 2. Resistance & Support Levels · Immediate Resistance (Ceiling): $146.35. This is the current 24h high. A strong 15-minute close above this level is needed to confirm a breakout and continuation of the upward momentum. · Immediate Support (Floor): ~$144.01. Looking at the chart structure, this is the previous consolidation zone before the final leg up. If the price breaks down, this is the first area to watch. · Major Support: $137.02. The bottom of the recent crash. This is the critical structural floor for this 24-hour period. 3. Volume Analysis (The Story of the Move) · Look at the volume bars at the bottom. There is a massive, distinct spike in volume that occurs right at the bottom of the dip and the beginning of the recovery (around 01:45). · Interpretation: This massive green volume bar indicates heavy institutional or whale buying. This confirms that the bounce off the $137.02 level was a high-conviction buy. · The Catch: Notice the current volume on the right side. As the price climbs to new local highs, the volume is relatively flat and low. The current open candle shows a volume of 1.780 compared to the MA5 of 191.280. This is a classic bearish divergence on lower timeframes. The price is going up, but the buying volume is drying up, meaning the current uptrend lacks strong momentum to break the high. 🎯 Trading Scenarios · Bullish Scenario (Breakout): If a strong 15m candle closes solidly above $146.35, it signals the buyers have overpowered the resistance. However, for this to be reliable, you would want to see a spike in volume accompanying the breakout. · Bearish Scenario (Rejection/Pullback): The price is struggling at the 24h high with declining volume. There is a high probability of a rejection here. If the price gets pushed down, it will likely retest the $144.01 support area. If that fails, a slow bleed back down is possible. ⚠️ Important Notes for this Specific Asset · Tokenized Stock Dynamics: Because this is a tokenized version of a private asset (SpaceX), its price action may not perfectly track the traditional stock market (which is closed outside normal hours). It trades 24/7 on Bybit. · Liquidity Risk: While the turnover is decent (6.33M), the order book depth for tokenized private equity is often much thinner than standard crypto pairs. Watch out for sudden "wicks" (sharp, violent price movements) in either direction. · Notice: The banner notes "Kor Protocol is now live on Bybit Alpha." This is a general exchange announcement and not specific to this chart, but it's good to be aware of. (Disclaimer: This is a technical analysis of the provided image and does not constitute financial advice. Trading tokenized stocks carries unique risks.) $SPCXXUSDT #ByXIMPACT #WSOT2026 #NovUSCPIWatch #WSOTPicktoEarn10U #USPayrollsAndRateDecisionsDriveMacroWeek

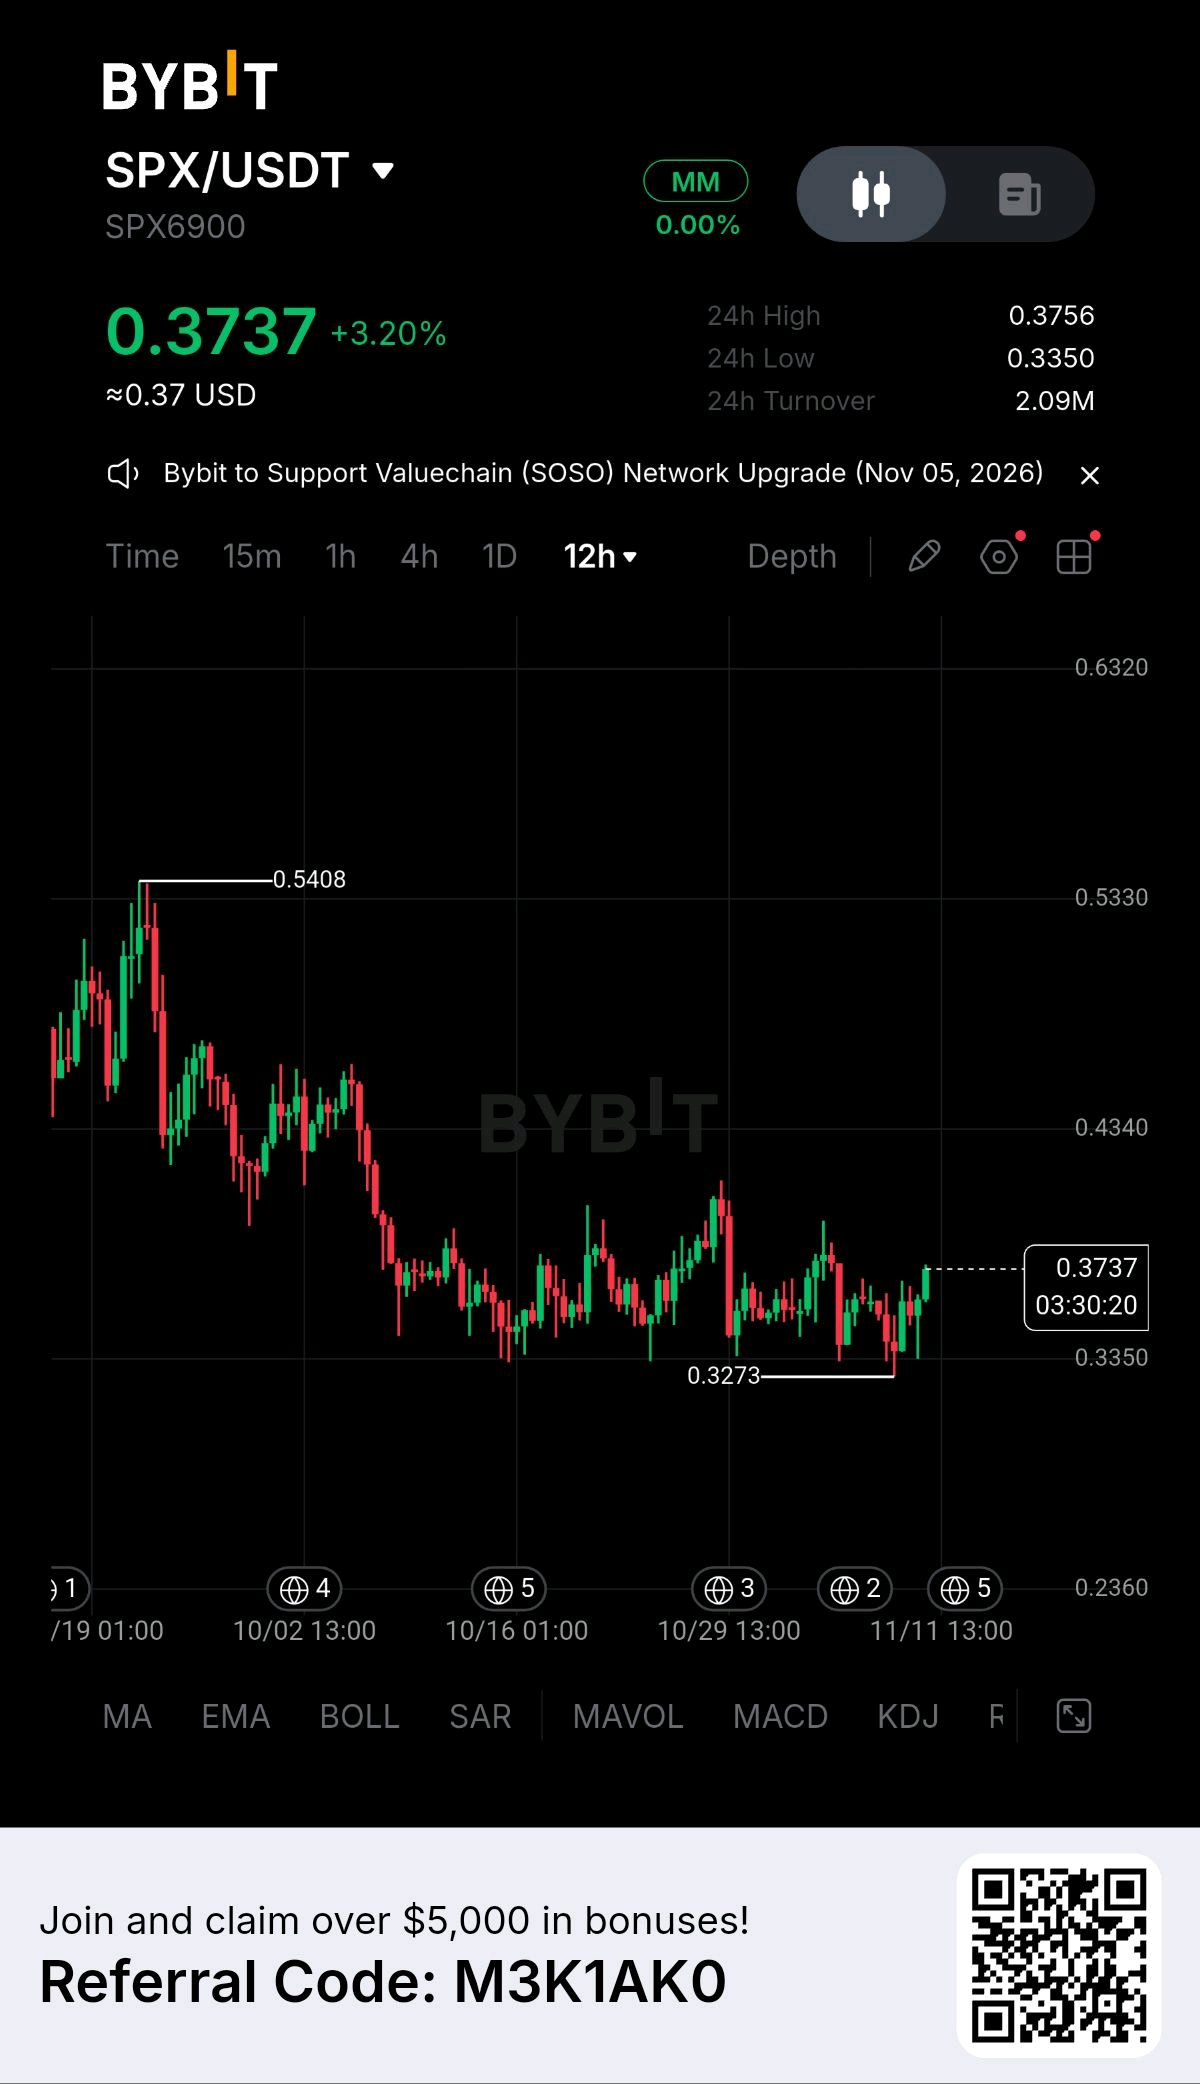
$SPX Bounces 3% Off Its Weekly Low Near $0.33
SPX6900 just posted a solid green session, climbing back above 0.37 after testing a fresh low for the stretch, though the token remains deep in a downtrend that's defined most of this year. SPX6900 is a self-described community meme asset with no roadmap, no team-led development, and no claimed intrinsic value, its own project says as much. The community, who call themselves Aeons, has built a reputation around a buy-and-hold mentality, and prominent crypto commentator Murad Mahmudov recently compared their conviction through steep drawdowns to early Bitcoin holders, though he was careful to frame it as a comparison of behavior rather than a claim the two assets will perform alike. That conviction has been tested, SPX now trades more than 80% below its July 2025 all-time high of 2.27, and 2026 has been its calmest year on record in terms of price range, with every close falling between roughly 0.25 and 0.65. Technical commentary earlier this week flagged the token sitting in a descending channel, with analysts noting price needed to hold around 0.34 and reclaim its 200-day moving average near 0.39 to show real signs of recovery, a level that today's bounce is now testing from below. The chart shows a steep decline from a high of 0.5408 down through a choppy multi-week slide to a low of 0.3273, with today's bounce bringing price back to 0.3737, up 3.20%, right around the middle of that broader range. Given the token is bouncing from a key support zone that technical watchers have specifically flagged, this looks like a cautious long rather than a wait-and-see setup, provided the level holds. An entry near the current 0.3737 with invalidation below 0.3273, the recent low, keeps risk tied to that well-defined floor. The first target sits near 0.39, the 200-day moving average and the level analysts have pointed to as the line between continued range-bound trading and a real recovery attempt, offering a modest but reasonable reward relative to the risk. China's Q3 GDP grew 4.5% year on year, beating forecasts on strong AI-related exports and tech manufacturing, a mildly supportive macro backdrop for risk assets broadly, though a pure sentiment-driven meme token like SPX is likely to keep trading far more on its own community conviction than on any macro data print. Not financial advice. $SPXUSDT $COREUSDT #WSOT2026 #WSOTPicktoEarn10U #NovUSCPIWatch


227,196 枚老比特幣發生移動。看跌嗎?未必。
據 Bitcoin.com News 報導,Checkonchain 稱約有 227,196 枚 2019 年前獲取的 BTC 在 2026 年「甦醒」。$BTCUSDT 數字很大。所以我深入調查了標題背後的內容。 首先,金額對不上。報導中提到是 1,836 億美元。以每枚 BTC 約 74,000 美元計算,227,196 枚 BTC 應更接近 168 億美元(這是我的計算結果)。 有趣的是,同一篇文章將另一個數據集中的 33,932 枚 BTC 估值為 24.9 億美元,這與該價格相符。 但更大的問題是,「甦醒」究竟是什麼意思。 只是幣發生了移動。並不一定代表幣被賣出了。 Btcparser 追蹤到 1 月至 10 月期間,從休眠地址轉出了 873 筆交易,總計 33,932 枚 BTC。這大約只有 Checkonchain 數據的 15%。 主題大致相同,但對「休眠」的定義不同,導致總量差異巨大。 我認為最關鍵的區別在於,「老幣移動」這一說法背後可能包含三種不同的事件。 錢包轉移:同一持有者,新地址。可能是託管權變更、安全升級或遺產規劃。 交易所充值:幣到達了可以賣出的地方。這會產生潛在的拋售壓力,但不能證實已經賣出。 實際賣出:幣被賣出或花掉。這才是直接拋售壓力真正產生之時。 現有的移動數據無法告訴我們每種情況具體屬於哪一類。 那麼,為何老持有者要移動這些幣呢?獲利了結、託管權變更和鯨魚部位調整都有可能。我們沒有足夠的證據來斷定是哪一種。 有幾個細節引起了我的注意。 四個地址均建立於 2016 年 1 月 23 日,每個地址剛好移動了 500 枚 BTC。這些轉帳分別發生在 3 月 24 日、5 月 19 日、7 月 2 日和 10 月 20 日。 四筆交易總計 2,000 枚 BTC。時間間隔看起來像是刻意安排的,但相同的金額和建立日期並不能證明它們屬於同一擁有者或有共同計畫。 另一個細節:81.9% 的「甦醒」幣來自 2015 年至 2018 年。2015 年之前的幣約佔 18%(我的計算結果)。 現在來看看時間點。 Btcparser 最繁忙的時期是在第三季,當時比特幣上漲了約 43%。在行情上漲期間移動老幣,可能指向獲利了結,而非恐慌。 這是一個合理的解讀,但並非證據。比特幣今年迄今仍下跌了約 16%。 且我不會稱這為「新浪潮」。八月份的一項分析顯示,2026 年休眠幣的重新活躍程度不到 2025 年的一半。由於定義不同,這種比較需要謹慎看待。 我的觀點是:老 BTC 的甦醒值得關注,但單純的移動並非看跌訊號。 我正在觀察兩件事:來自老幣錢包的交易所流入量,以及實際花費的證據。 如果幣轉入新的冷錢包,那可能僅僅是託管管理。如果它們進入交易所並被賣出,情況就會有所不同。 在此之前,我不建議將老錢包的移動與老持有者的離場混為一談。 $KORUSDT #WSOT2026 #NovUSCPIWatch #WSOTPicktoEarn10U #美國就業數據與利率決策主導本週宏觀市場 #石油波動追蹤伊朗和平談判

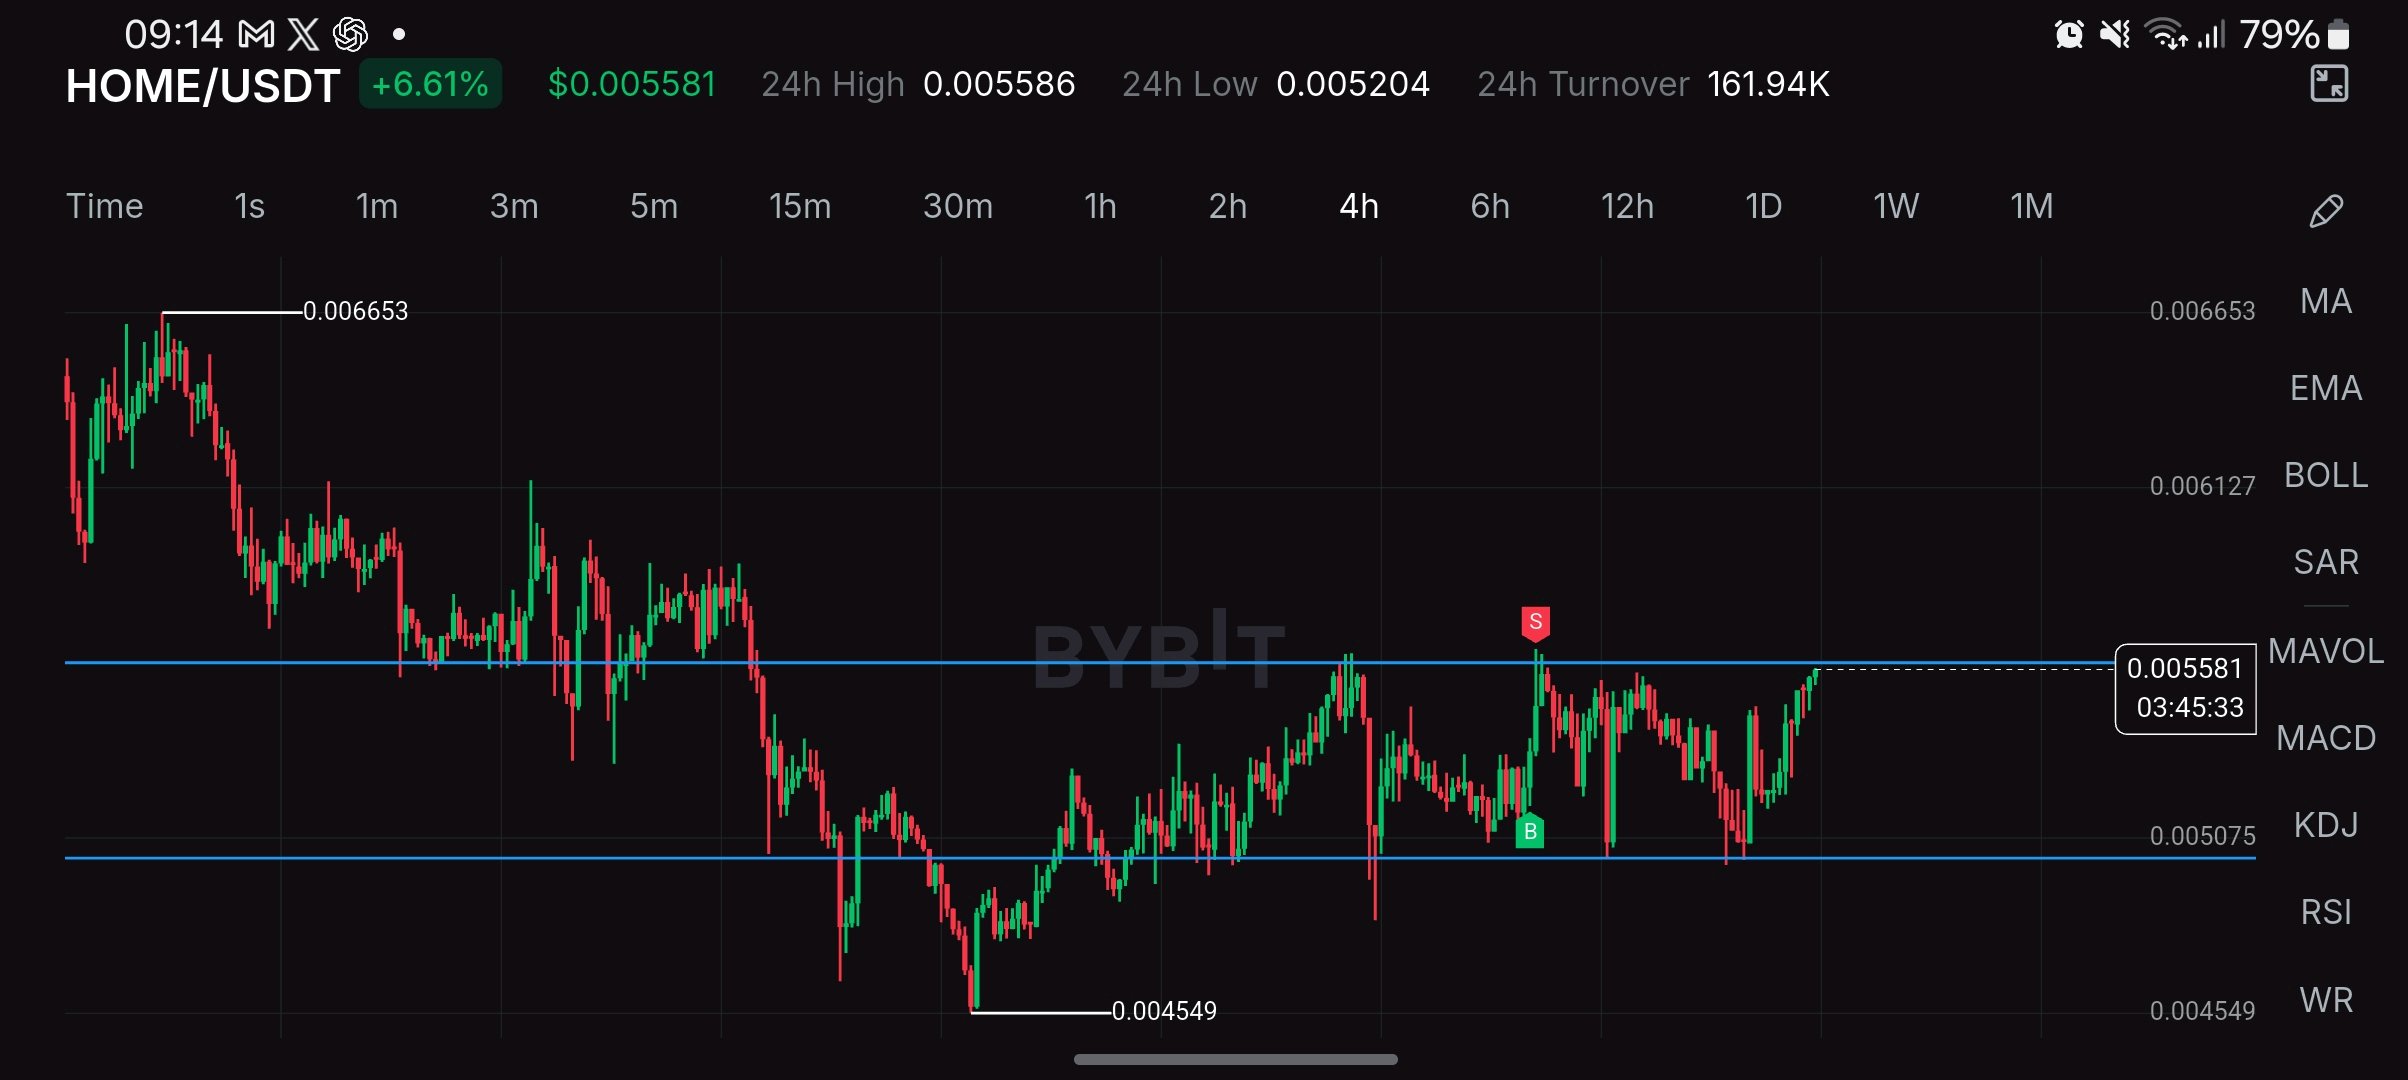
$HOME: Testing the $0.0056 Ceiling
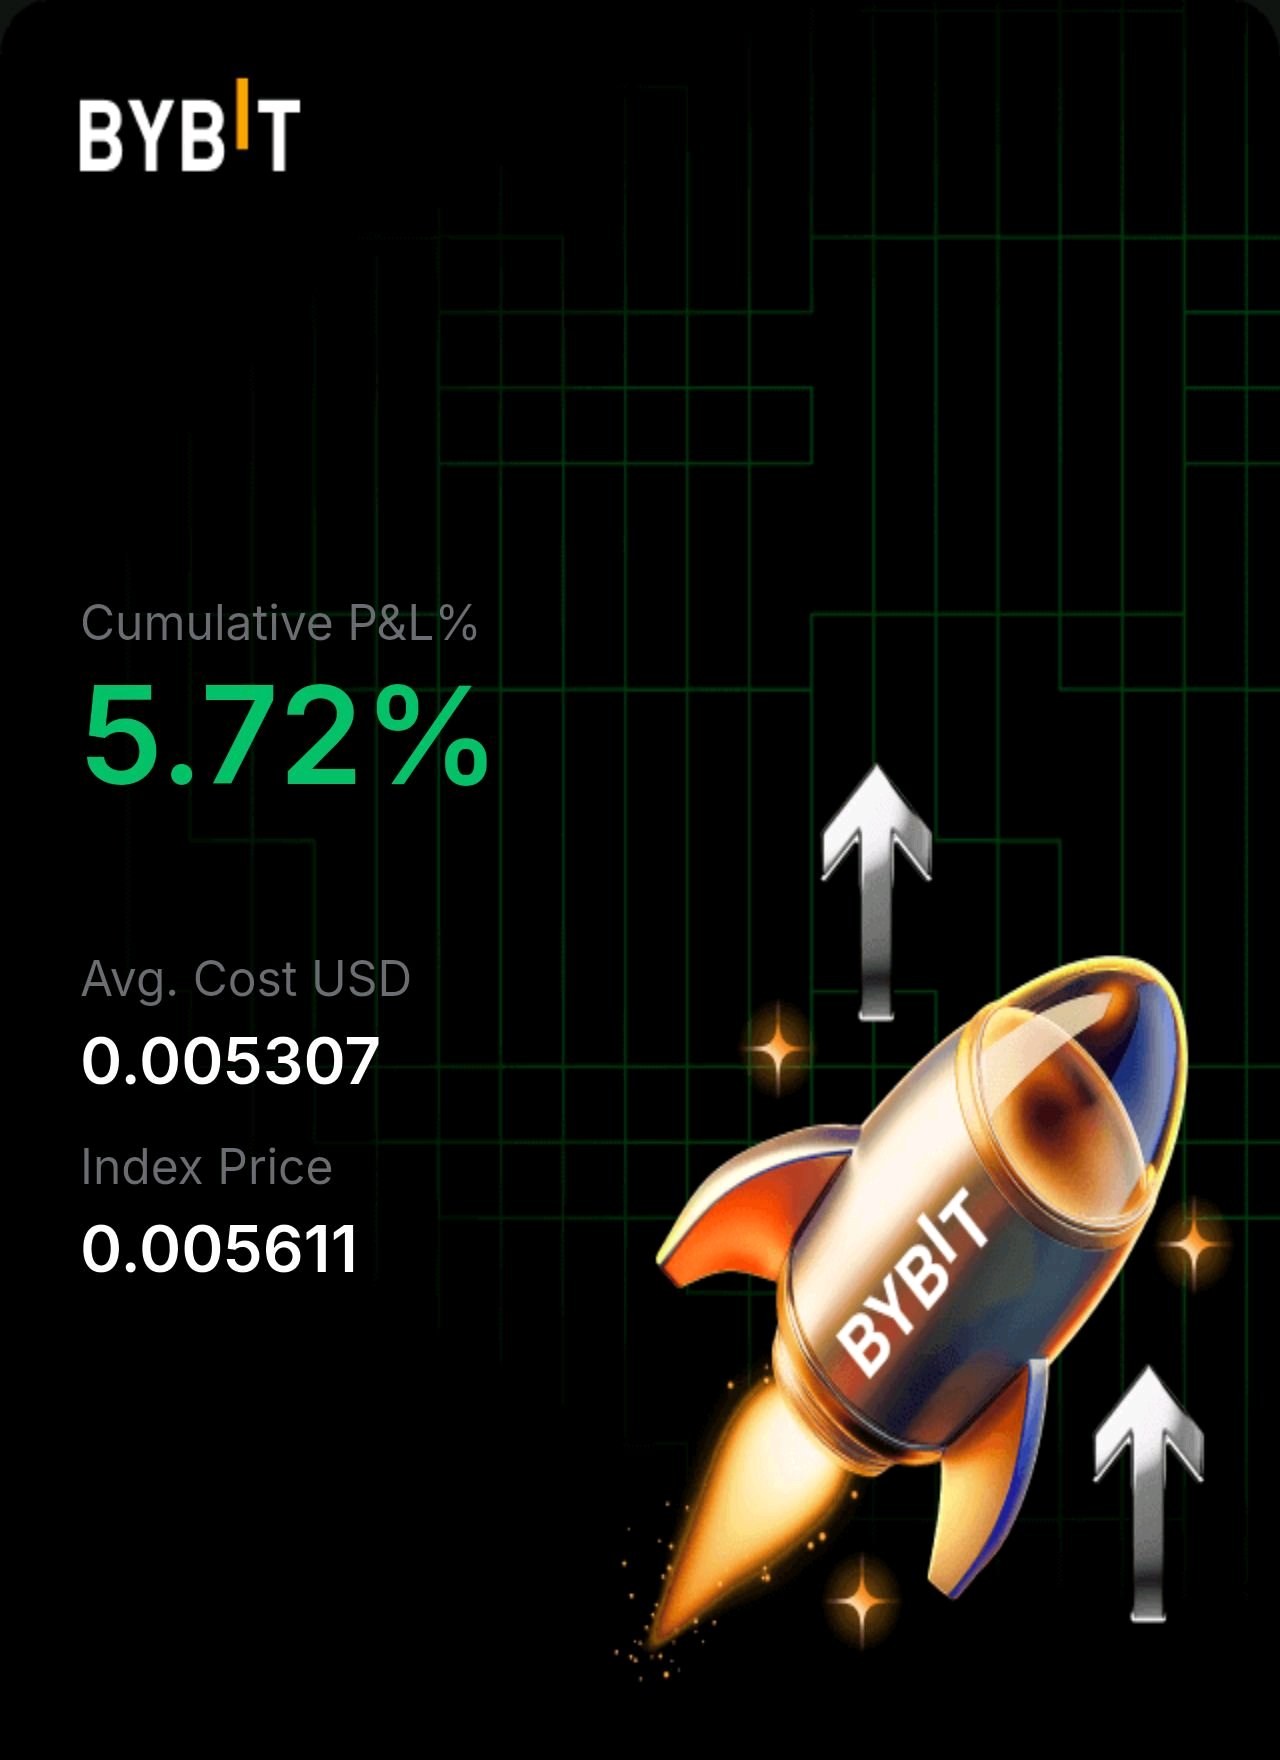
$HOME is pushing into the same ceiling that has rejected it several times in recent weeks. Today's 6.6% move is happening on low volume, so the real test is what comes next. What the 4H chart shows: Price is $0.005581, right at the upper edge of a range between about $0.0051 and $0.0056. Every push into $0.0056 has been rejected, including the sharp wick that printed a sell signal, and every dip toward $0.0051 has been bought. The 24h range is $0.005204 to $0.005586, so price is sitting exactly at the top. The bigger picture is still bearish: the structure is lower highs from $0.006653, and the yearly low is $0.004549. 24h turnover on Bybit is only about $162K, so a breakout without strong volume would be suspect. What's happening: There is no fresh project news this week. The main story is the tokenomics. Defi App uses 80% of protocol revenue for weekly on-chain buybacks, and when that was confirmed in August, $HOME jumped 13%. Upbit also listed HOME around then, which added Asian retail demand. The roadmap includes a physical debit card and prop trading in Q4 2026, which could be a catalyst if it ships. The headwind is supply: only about 4.36B of the 10B tokens are circulating, so roughly 56% is still to come from team, investor and ecosystem unlocks over the next years. That limits how far rallies can go. China and the global backdrop: China's Q3 GDP grew 4.5%, beating forecasts, and the yuan hit a 4-year high. For China, that means steadier policy and less need for emergency stimulus. For the world, stronger Asian growth supports risk appetite, and Asian retail access (like the Upbit listing) matters for a token like $HOME. The link is indirect, since China restricts crypto trading, and the beat is export-led with retail sales up only 1.1%. For $HOME, trading volume on Defi App (which drives buybacks) and Bitcoin's direction matter far more than China data. Key levels: Support: $0.0052 to $0.0051 first, then $0.004549 (the yearly low). A break below $0.0051 would reopen the move to the lows. Resistance: $0.0056 first, then $0.006127, then $0.006653 (the swing high). I want a 4H close above $0.0056 on rising volume before I treat this as a breakout. Scenarios: Bull: volume picks up, buyers close above $0.0056, and $HOME heads toward $0.006127. Base: $HOME gets rejected again and ranges between $0.0051 and $0.0056. Bear: sellers take control, $0.0051 breaks, and $HOME retests the $0.004549 low. Honest risk: thin liquidity means breakouts can fail fast, and the large locked supply is a constant overhang. Not financial advice. Does the fourth test of the ceiling finally break it? $HOMEUSDT $ICPUSDT #WSOT2026 #WSOTPicktoEarn10U #NovUSCPIWatch
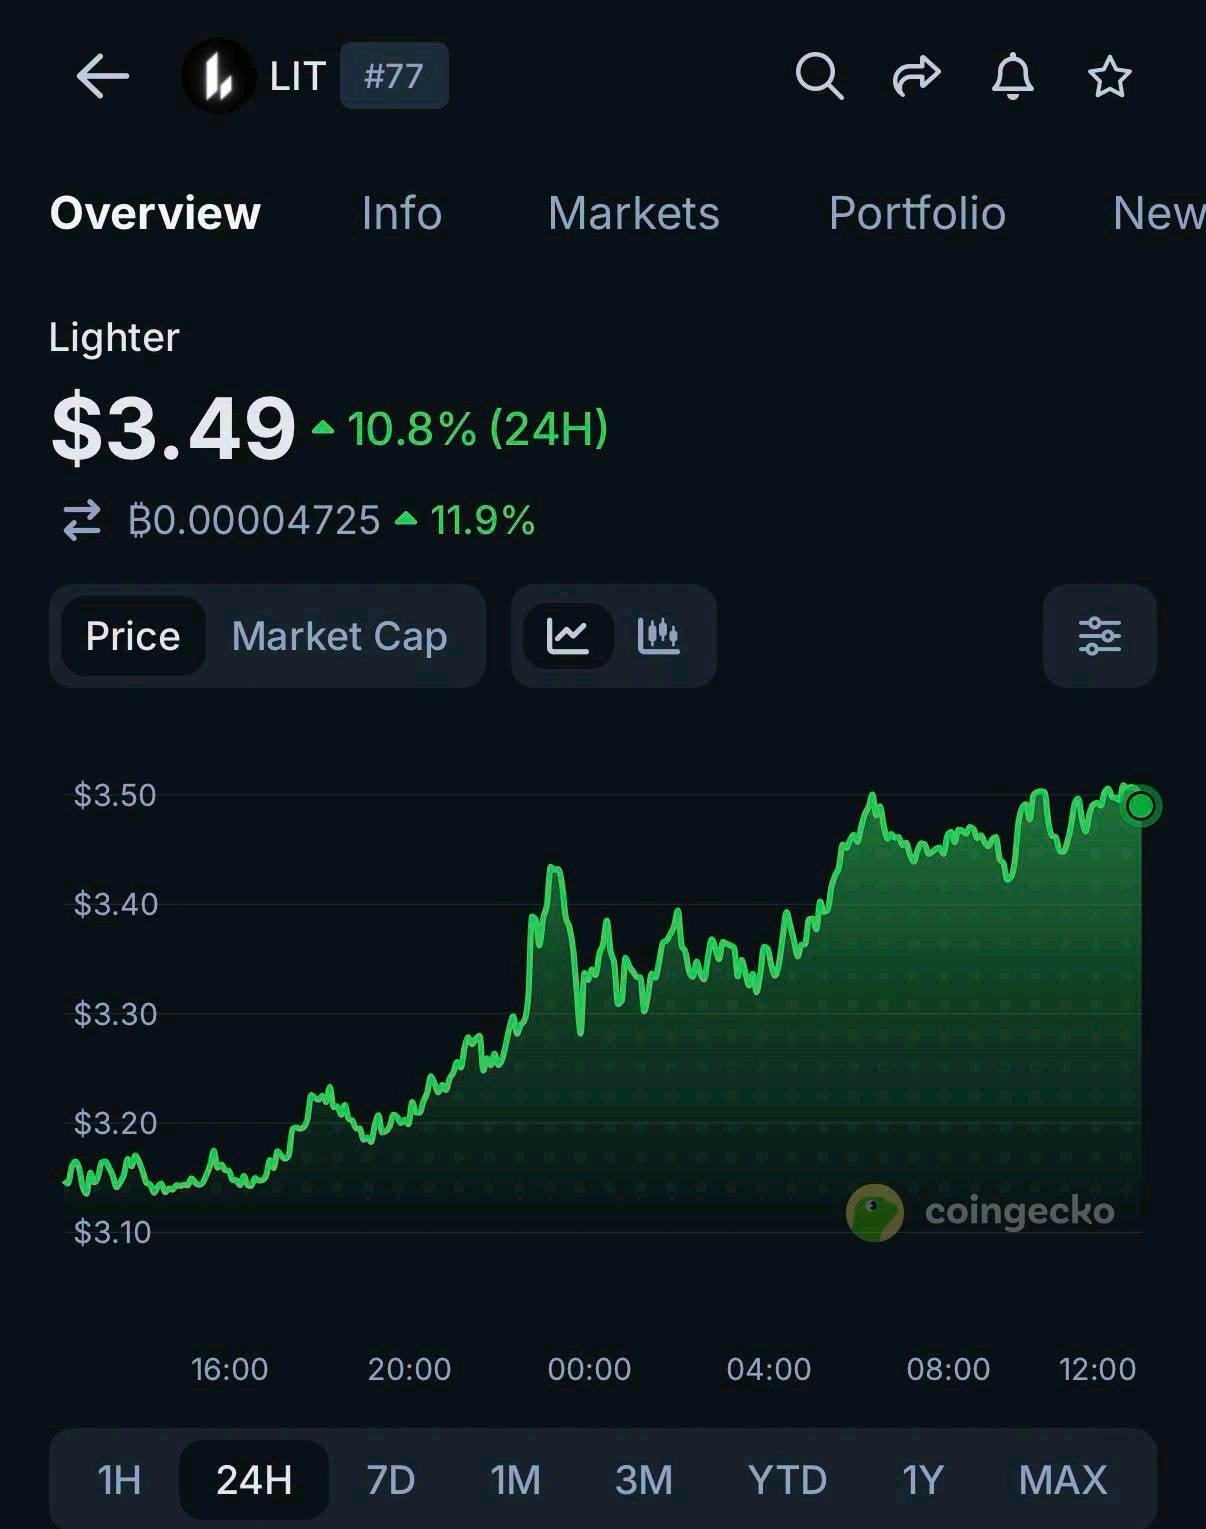
$LIT 上漲了 10.8% 🚀
洞察:$LITUSDT 今日在市場一片慘綠中逆勢上漲 10.8%,此前兩天,瑞士銀行 Sygnum 將其納入交易、託管和借貸服務。 #NovUSCPIWatch #WSOTPicktoEarn10U #美國就業數據與利率決策主導本週宏觀市場 #石油波動追蹤伊朗和平談判 #BybitAIEvolving $MCRTUSDT
🚨 $MCRT just printed a massive green candle.
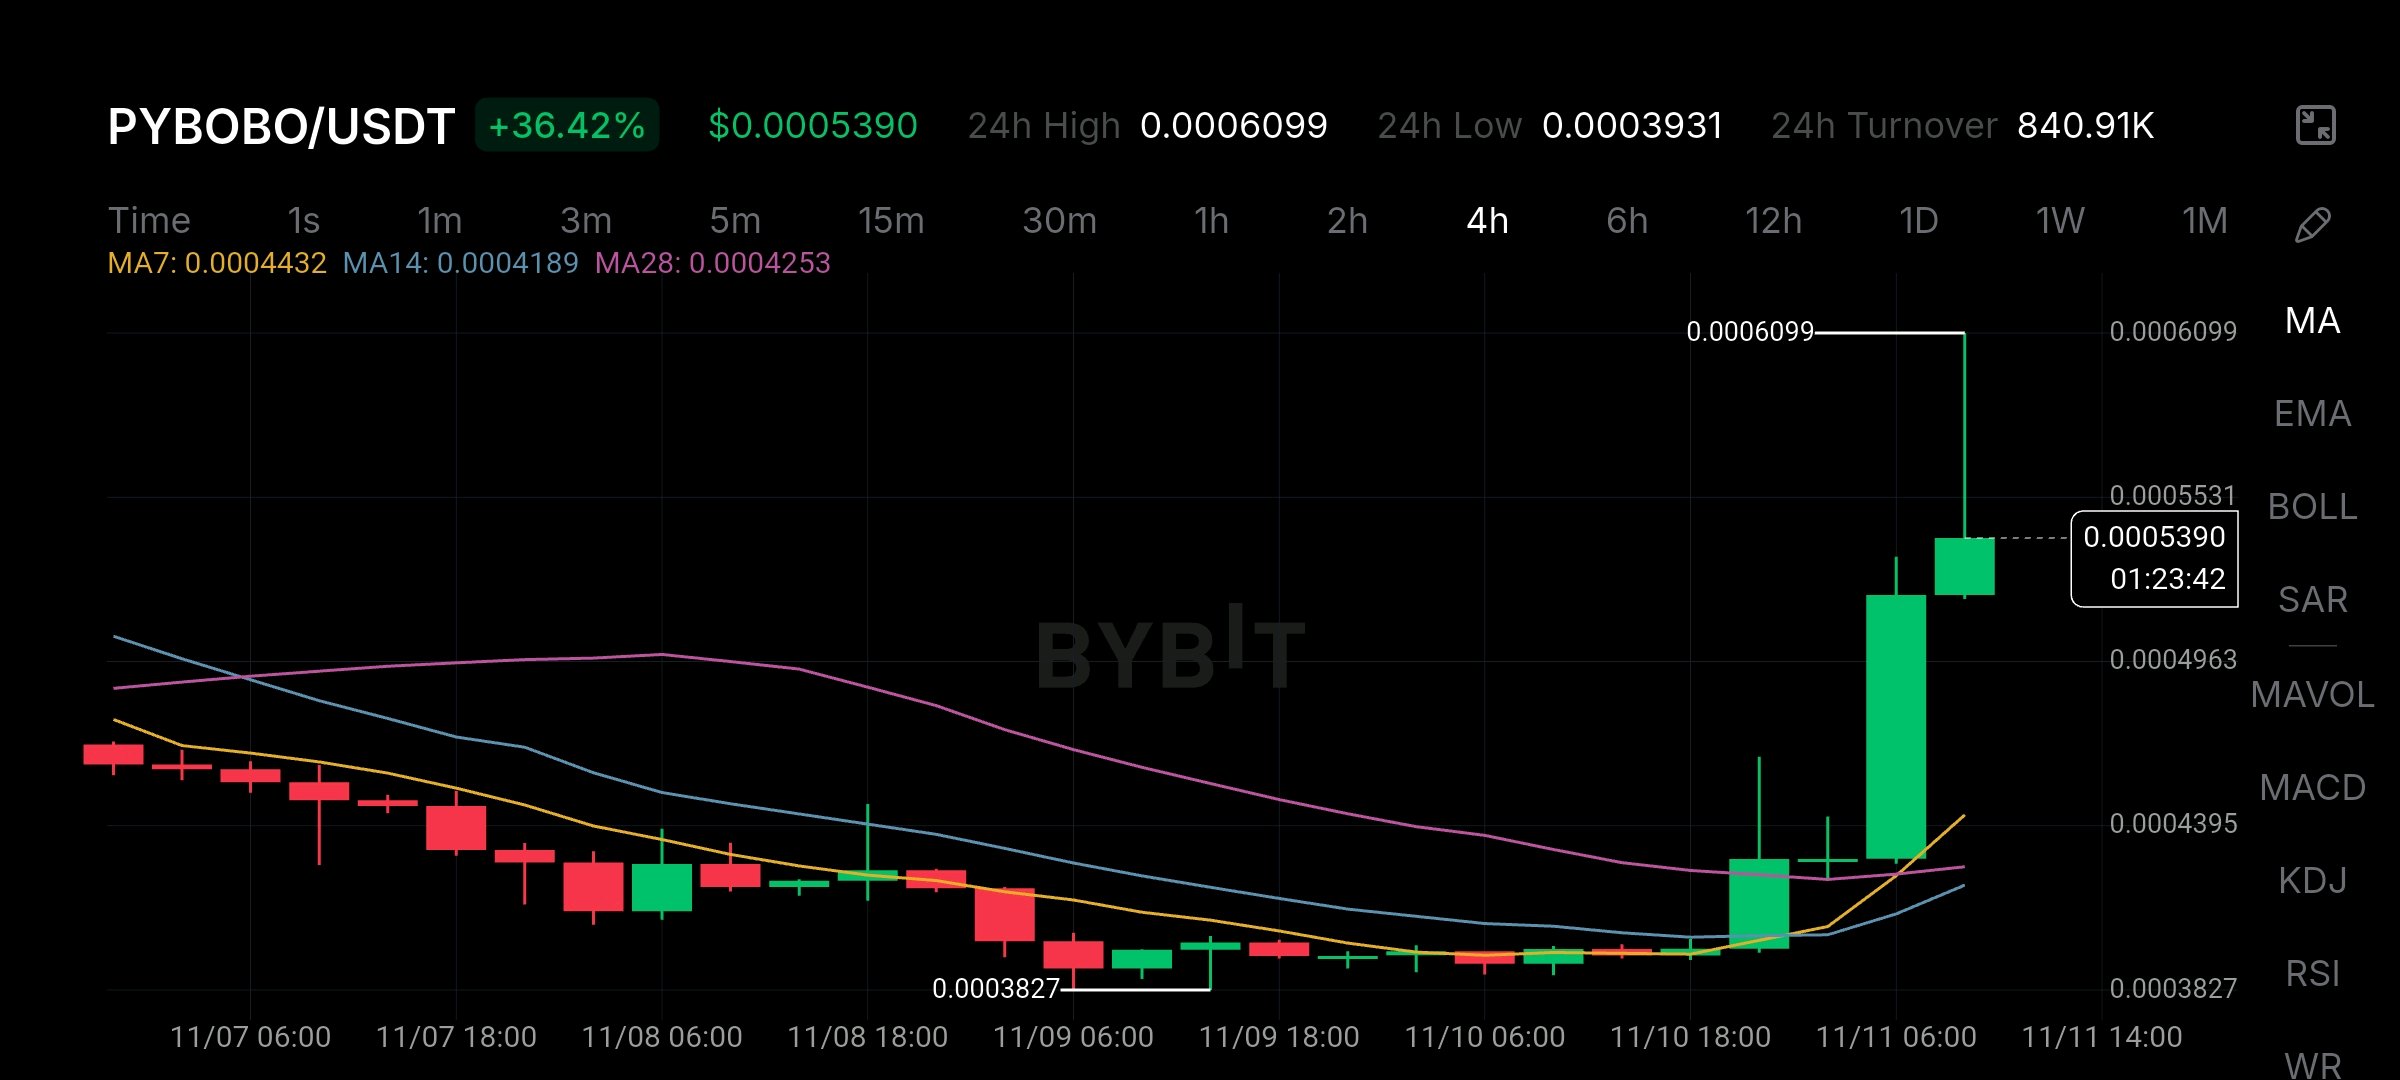
But look at the volume of $MCRTUSDT . Check this 15m chart. MCRT was flatlining in a tight base at 0.0001208, then suddenly went vertical to hit 0.0001537. It is up 23% right now, sitting at 0.0001500. But here is the massive red flag. Look at the turnover. It is only 25.40K. That is incredibly thin liquidity. Moves like this happen when the order book is empty, and they can reverse just as fast. The Levels: Resistance is the peak at 0.0001537. Support is the MA7 way down at 0.0001271. Do not FOMO into this thin pump. Wait for a pullback to the moving averages to see if it actually holds. Are you fading this spike? 👇 #NovUSCPIWatch #WSOTPicktoEarn10U #USPayrollsAndRateDecisionsDriveMacroWeek #OilVolatilityTracksIranPeaceTalks #BOERateDecision $PYBOBOUSDT
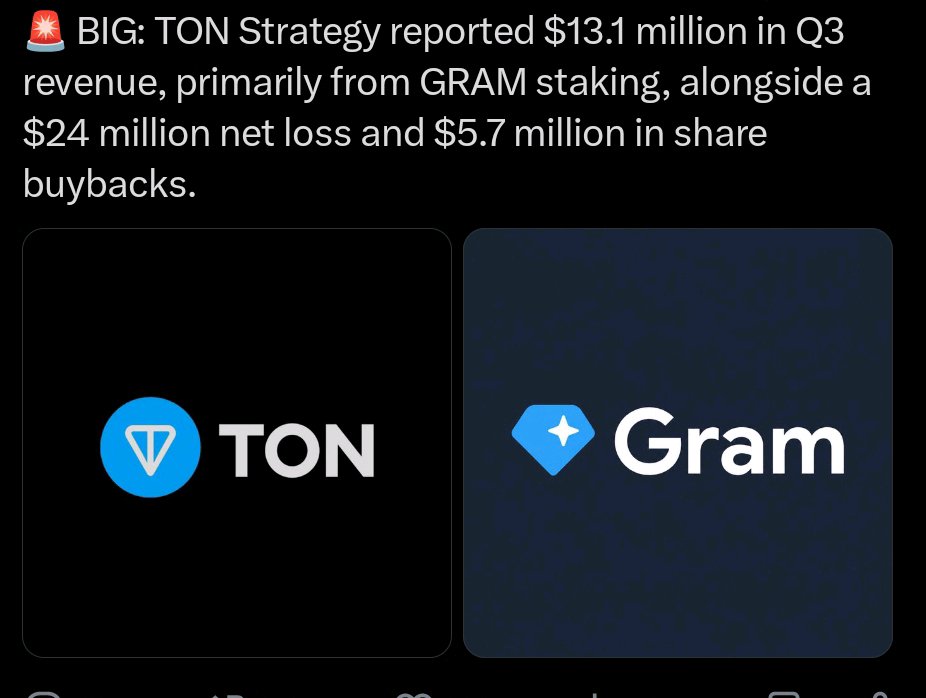
DTCC just went LIVE with Chainlink 🤯 The firm behind $4.7 QUADRILLION in securities transactions last year 💥$GRAMUSDT 🏦 Chainlink will run margin, valuations, collateral optimization and settlement inside DTCC's Collateral AppChain ⚙️ 🧠 Nasdaq research found 52% of firms expect to manage live tokenized collateral by end of 2026 📊 🐋 LINK on exchanges fell about 12% in a month as supply moved off 👀 ⚠️ DTCC's own target for full launch is Q4 2026 Is this the moment Wall Street plumbing switches on-chain? 🔌 Which part shocks you most? 👇 ➕ Follow for more #WSOTPicktoEarn10U #USPayrollsAndRateDecisionsDriveMacroWeek #NovUSCPIWatch #OilVolatilityTracksIranPeaceTalks @BybitX @kas***@**** @killer901 @DON'T JUDGE ME @BybitX @WhaleX🐳

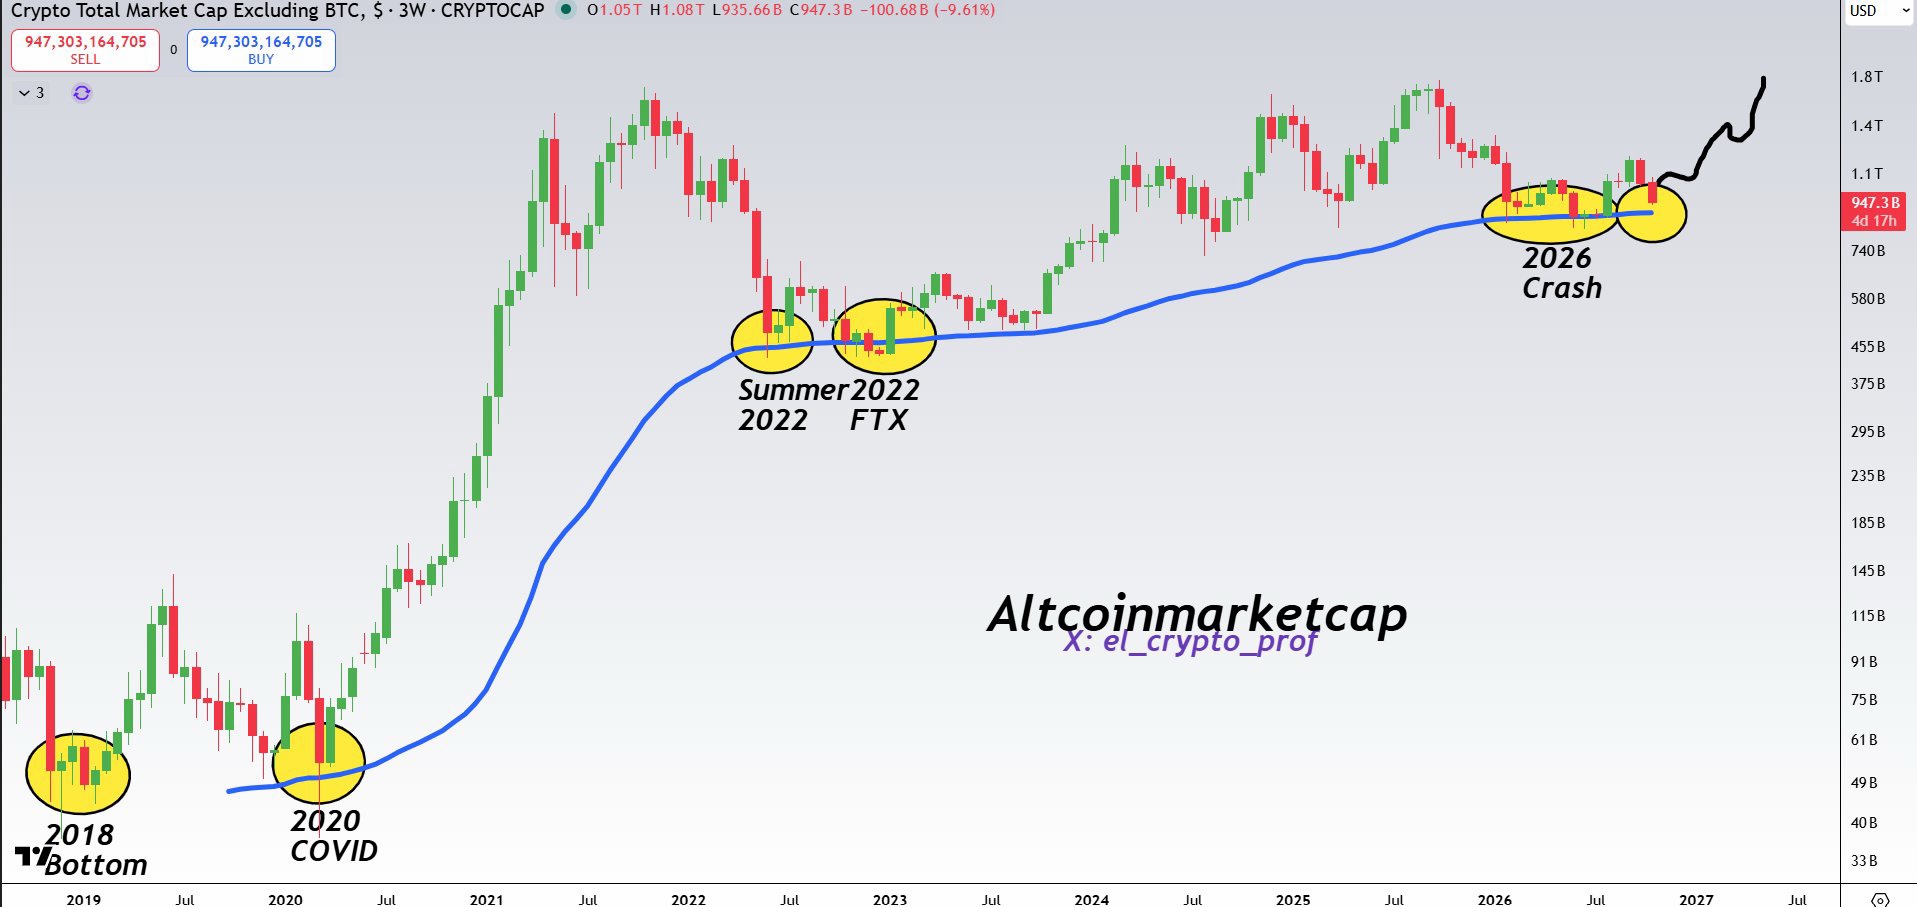
#山寨幣 你知道藍線標示出 TotalMarketCap 在幾乎每個週期中的底部嗎? 底部已經非常接近,或者可能已經觸及了。 更高,還要更高。 #WSOT2026 #WSOTPicktoEarn10U $INITUSDT
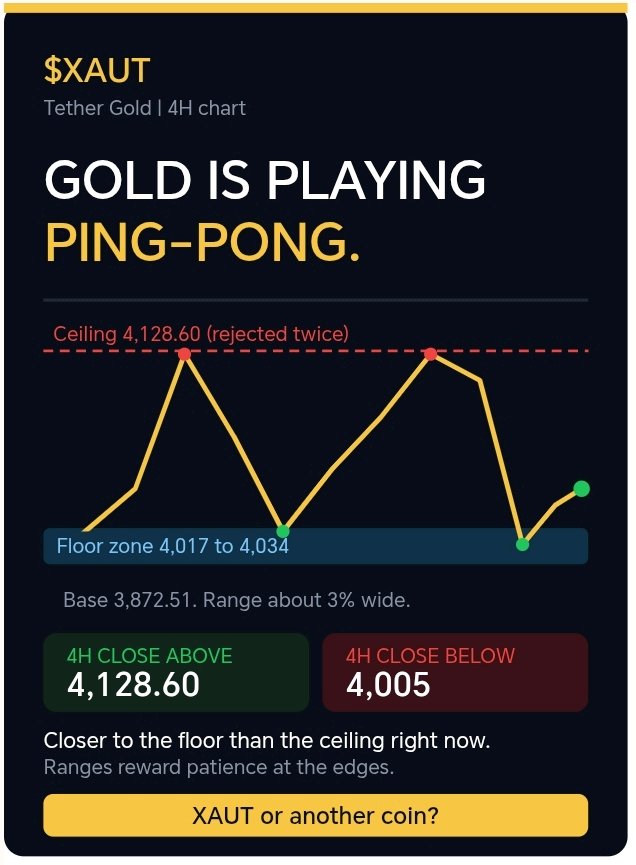
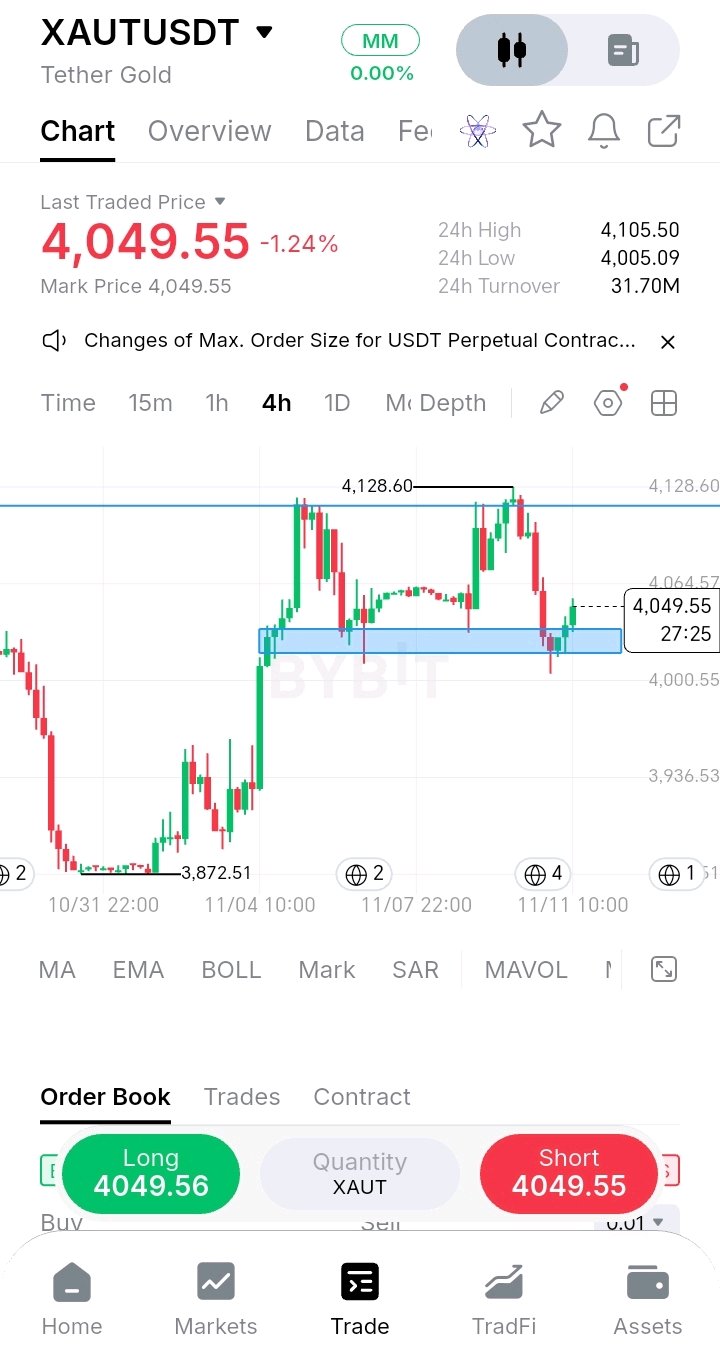
🏓 Gold is playing ping-pong, and both edges keep getting hit. I don't want to trade the middle of this $XAUT range. I want to see which edge breaks first on a 4H close: above 4,128.60 or below 4,005. Here's what the 4H chart shows: 🔹 The top edge: Gold ran from 3,872.51 up to the 4,120s and has now been rejected twice near the ceiling, with the latest high at 4,128.60. 🔹 The bottom edge: After each rejection, price dropped into the blue zone around 4,017 to 4,034, where buyers stepped in. The latest wick even dipped to 4,005.09 before recovering. 🔹 The range: Roughly 4,005 to 4,128, about 3% wide. Gold has moved back and forth inside it several times. 🔹 The bounce: Price is at 4,049.55, about 1% above the zone and 2% below the ceiling. It's closer to the bottom edge, so the risk and reward are tilted toward the floor right now. 🔹 The activity: 24H turnover is 31.70M with a 24H range of 4,005.09 to 4,105.50. Moves are fast but contained. 🟢 Bullish: a 4H close above 4,128.60 breaks the ceiling for the first time. The 4,208.90 swing high from earlier would be the next reference. 🔴 Bearish: a 4H close under 4,005 breaks the floor, and the 3,936 and 3,872 levels come into view. Ranges reward patience at the edges. The breakout is where the real move starts. Are you watching $XAUT or another coin? #XAUT #Gold #Crypto #BinanceSquare #WSOT2026 #WSOTPicktoEarn10U #USPayrollsAndRateDecisionsDriveMacroWeek #OilVolatilityTracksIranPeaceTalks #BybitAIEvolving $XAUTUSDT $BTCUSDT
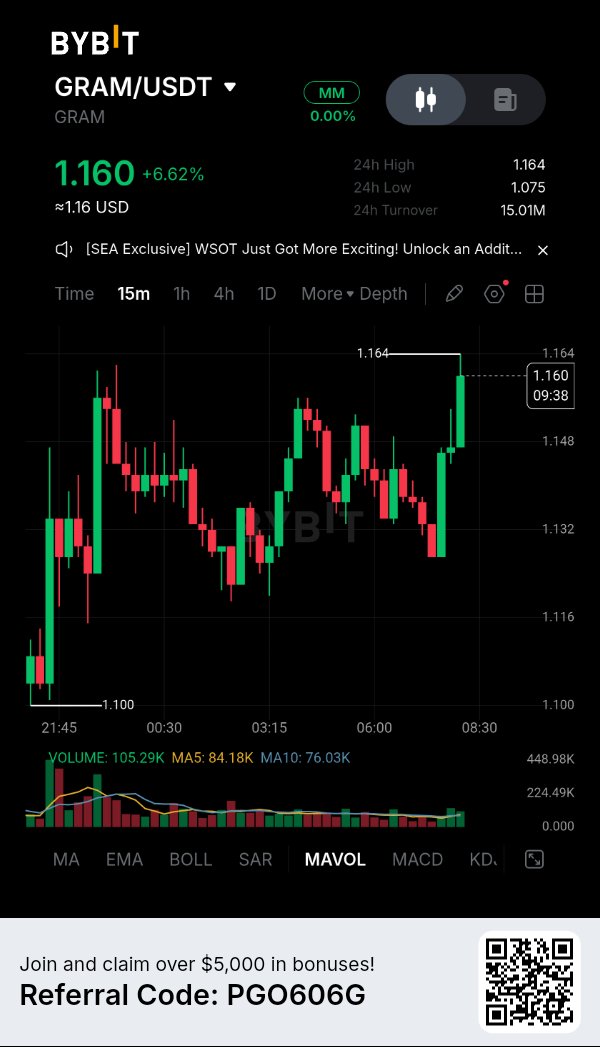
Here is a fresh, master-level breakdown of the GRAM/USDT chart on the 15-minute timeframe. This chart illustrates a highly volatile, choppy market that is slowly grinding upward. It is a great example of why patience is the most important tool in a trader's arsenal. Let's break down the mechanics. 1. The "Whipsaw" Environment Look at the chart from left to right. The price starts at the 24h Low of 1.100, rockets up to ~1.160, crashes down to ~1.125, rallies back to ~1.155, drops to ~1.130, and finally pushes to a new 24h High of 1.164. · The Master's View: Notice the long wicks on almost every candle. This is a classic "whipsaw" market. It is designed to trap retail traders. If you buy the green candles, you get stopped out by the red ones. If you short the red candles, you get squeezed by the green ones. The 24h Turnover is 15.01M—there is plenty of liquidity here, which means these erratic moves are likely driven by algorithmic trading and market makers shaking out weak hands. 2. The "Higher Low" Trend Despite the chaotic, violent swings, look at the macro structure. · First bottom: 1.100 · Second major bottom: ~1.125 · Third major bottom: ~1.130 · The Lesson: Even though the price is chopping wildly, it is printing higher lows. The underlying trend is actually mildly bullish. Buyers are slowly stepping in at higher prices, building a floor. 3. The Current Setup: The Breakout Attempt Right now, the price is sitting at 1.160, pressing right up against the 24h High of 1.164. · Look at the volume bar beneath the most recent massive green candle. It's a very healthy green spike. This tells us that real money is driving this final push. · However, notice that the price has stalled right at the resistance line. It is struggling to break through. --- The Master Trader's Game Plan for GRAM: This is a frustrating chart to trade on a 15-minute timeframe because the chop is so violent. The trend is bullish, but you are currently staring at a major resistance level. Here is how a professional handles it: · Do Not FOMO: Buying right now at 1.160 is a gamble. You are buying right into a wall of sellers at the 24h high. If it rejects here, you will be trapped. · The "Breakout Confirmation" Play: The master move is to wait. Set a buy stop order just above 1.164. If a 15-minute candle closes solidly above that level with strong volume, the resistance is broken, and you can enter a long position. · The "Buy the Dip" Play (The Safe Route): Look at the recent structure. There is a clear support zone around 1.130 - 1.148 (the area of the last pullback). If the price rejects the 1.164 high and pulls back, wait for it to hit that 1.130 zone. If it prints a strong green bounce candle there, that is a much safer entry with a defined stop-loss. · The Danger Zone: If the price violently breaks below 1.125 (the middle swing low), the higher-low structure is broken. The trend has shifted bearish, and the price will likely revisit the 1.100 floor. Summary: GRAM is in a choppy, volatile uptrend, but it is currently fighting a major resistance level at 1.164. The recent volume is promising, but do not chase the price at the top of the range. Wait for a confirmed breakout above 1.164, or a healthy pullback to the 1.130 support zone before making a move. $GRAMUSDT #ByXIMPACT #NovUSCPIWatch #WSOTPicktoEarn10U #USPayrollsAndRateDecisionsDriveMacroWeek #BybitAIEvolving


$BNB | 網路成長與代幣表現並不總是同步。 BNB 的市場強勢與其生態系統中的各項活動密切相關,從 DeFi 流動性到鏈上應用程式及交易需求皆是如此。 對於交易者而言,有三個指標值得密切關注: → 網路活動與活躍地址的變化。 → BNB Chain 上的 DeFi 流動性與 TVL 趨勢。 → BNB 交易量、需求及關鍵的市場結構水平。 重要的是要區分生態系統的擴張是否為原生代幣創造了可衡量的需求。 基本面提供了背景資訊,但價格確認才能決定市場的強勢程度。 #BNB #BNBChain #加密貨幣分析 #Bybit #WSOTPicktoEarn10U

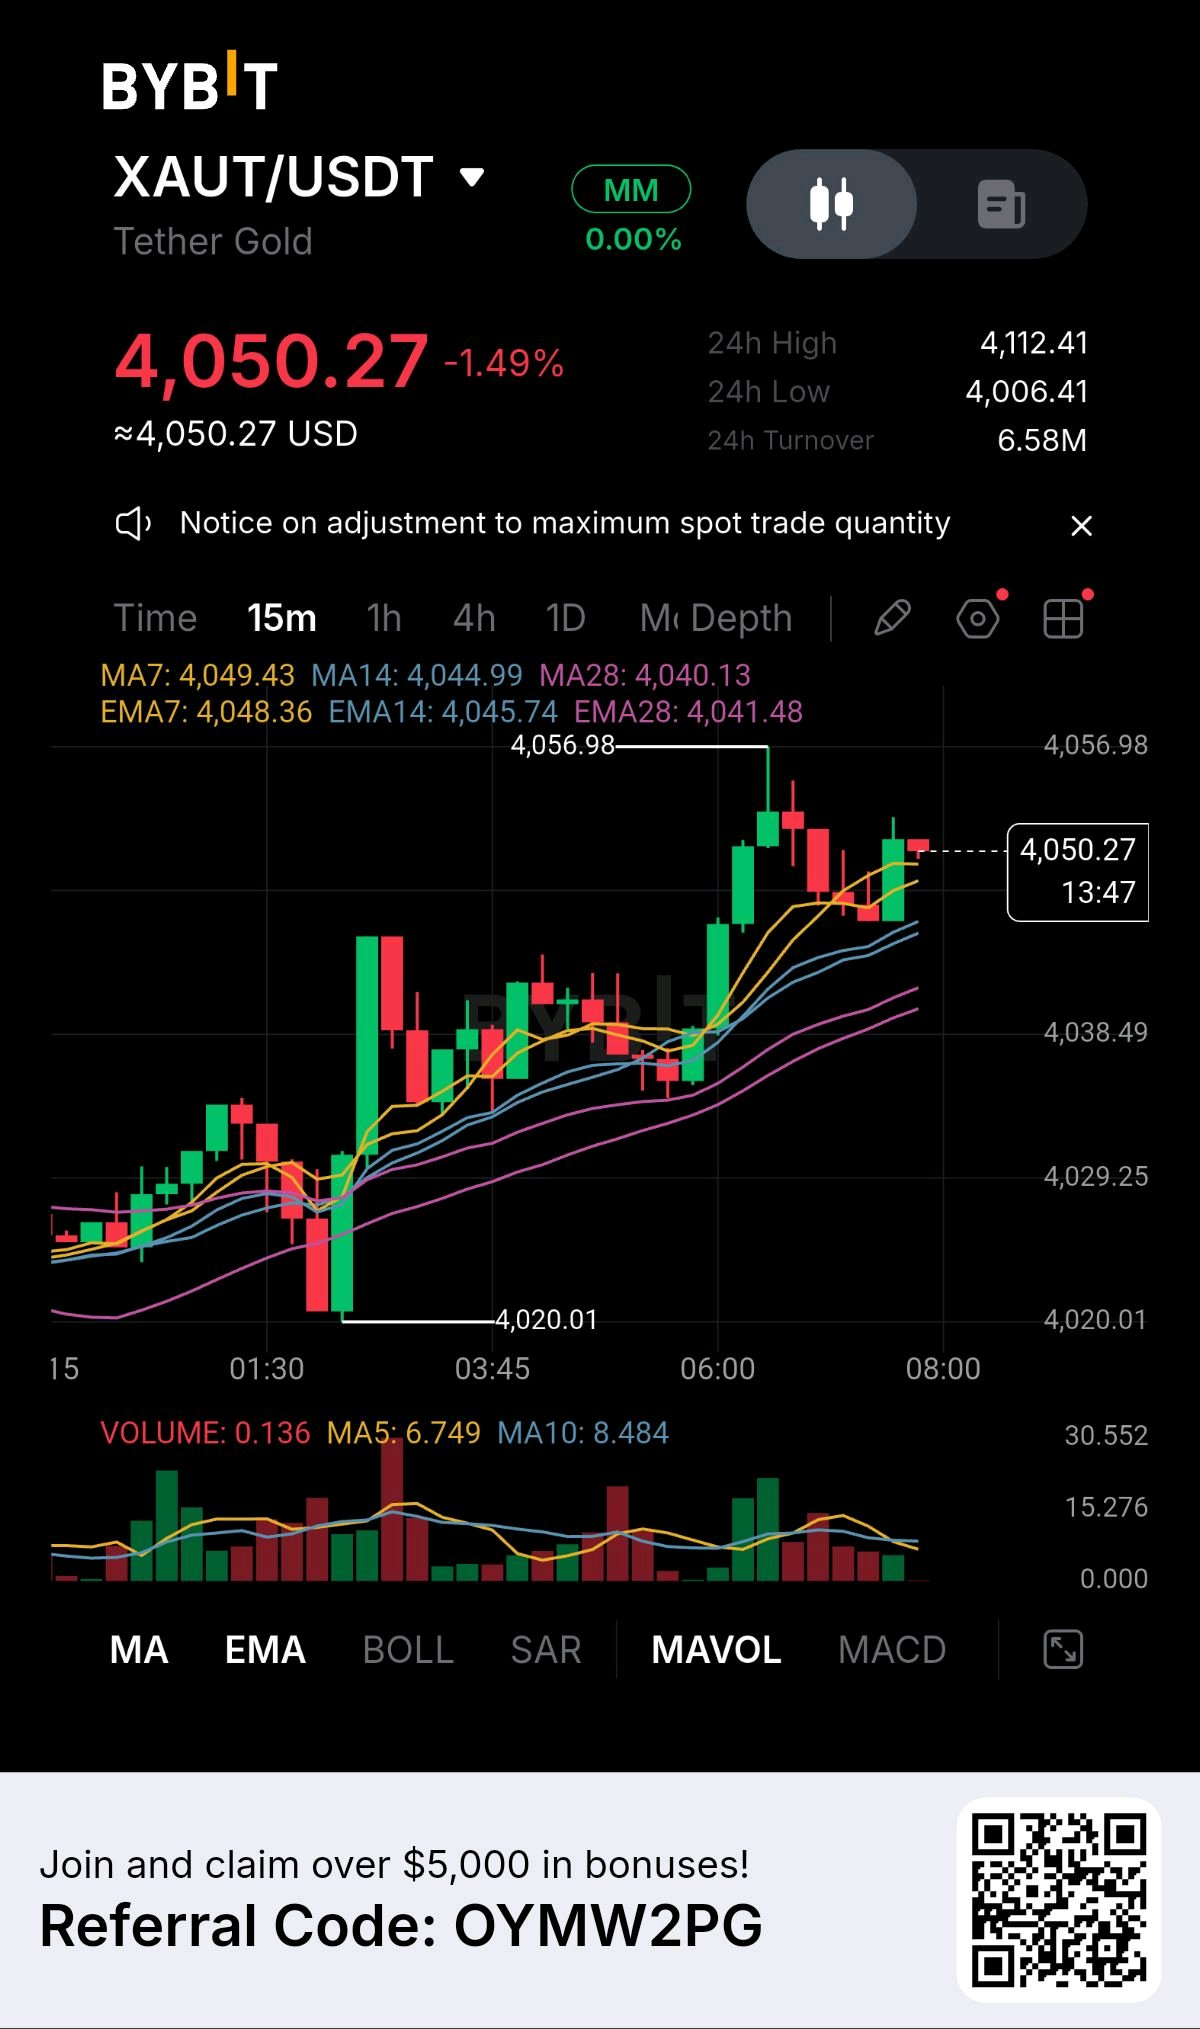
XAUT Holds Its Ground: Is Another Gold Move Loading? Gold is showing an interesting short term recovery structure despite remaining under pressure on the 24 hour chart. $XAUTUSDT is trading at $4,050.27, down 1.49% over the last 24 hours. However, the 15 minute chart reveals that buyers are still defending the recent recovery. What the chart is revealing • Price: $4,050.27 • 24H High: $4,112.41 • 24H Low: $4,006.41 • Turnover: $6.58M The technical picture The short term moving averages are aligned positively: • MA7: $4,049.43 • MA14: $4,044.99 • MA28: $4,040.13 The EMA structure tells a similar story, with price trading slightly above the major short term averages. This suggests that buyers still have some control over the immediate market structure, although momentum needs stronger confirmation. The levels that matter Resistance: $4,056.98 Support: $4,044 to $4,040 Further downside support: $4,038.49 and $4,029.25 Two possible developments A convincing breakout above $4,056.98 could strengthen bullish momentum and open the way for another upward test. However, losing the $4,040 support zone could weaken the recovery and expose lower support levels. My market perspective The important question is no longer just whether XAUT can recover. It is whether buyers can sustain the pressure long enough to turn this recovery into a stronger upward move. A breakout needs confirmation, not anticipation. What do you think comes next? Will gold break above $4,057 or return to test lower support?#ByXIMPACT #WSOT2026 #WSOTPicktoEarn10U

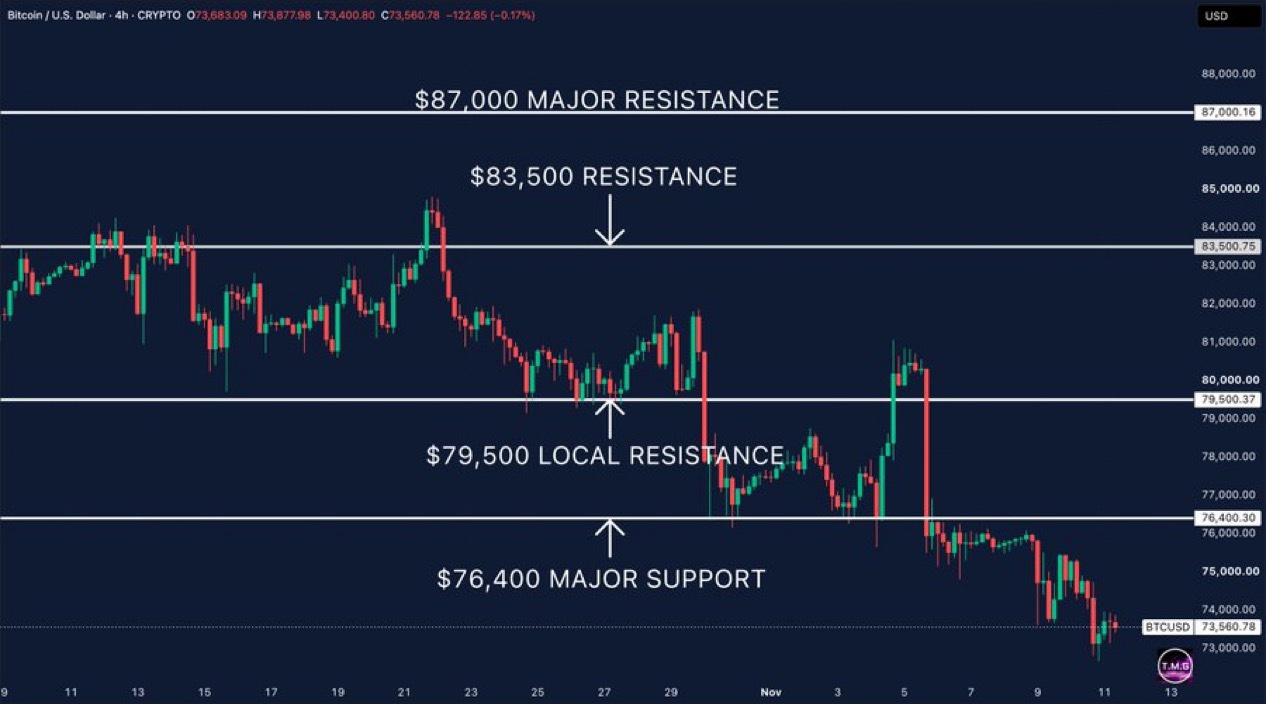
比特幣正難以找到支撐位。 我們現在已經跌破了 $76,400 的支撐水平,這原本是支撐市場的關鍵點位。 目前 BTC 在 $73,560 附近交易,4 小時線圖持續呈現低點更低、高點更低的走勢。 接下來我會關注買方是否能守住最近的 $73K 區域。 若能重回 $76,400 以上,將會是第一個有意義的強勢訊號。 在此之前,空方仍佔據上風。 #WSOT2026 #WSOTPicktoEarn10U
BitMine 虧損 63 億美元:帳面損失、現金流與損益平衡
BitMine 的 10-K 年報顯示,截至 8 月 31 日的年度淨虧損約為 63.1 億美元。而一年前,該公司獲利 3.49 億美元。 數位資產的未實現虧損為 62.3 億美元。前一年,該公司則帳列 8.05 億美元的收益。根據 The Block 的數據,ETH 在此期間下跌了 44%。 頭條看起來很殘酷。所以我把它分成兩部分來看。 帳面虧損:虧損來自於將 ETH 按公允價值計價。在此虧損下並未實際賣出任何資產。 現金流:這是另一回事。營運消耗了 3.051 億美元。營收約為 1.25 億美元,其中 97% 來自質押(1.21 億美元)。一般及行政費用為 3.769 億美元。 現在是我會記在心上的數字。 BitMine 的 ETH 成本基礎為 199.5 億美元,持有 590 萬枚 ETH。平均每枚 ETH 約 3,380 美元。8 月 31 日的公允價值為 145.6 億美元,即每枚 ETH 約 2,470 美元(我自己算的)。 隨著本週 ETH 在 2,130 美元附近徘徊,以該成本基礎計算,需要大約再上漲 59% 才能回本(我自己算的)。 修正一下推文的一個數據。590 萬枚 ETH 是 8 月 31 日的數字。截至 11 月 8 日,BitMine 持有 6,070,092 枚 ETH,佔供應量的 4.97%。 這裡有一線希望。質押業務正在增加。 BitMine 的最新更新顯示,在 520 萬枚質押的 ETH 上,年化質押獎勵約為 3.09 億美元。這相當於 2.65% 的收益率。這大致與去年 3.05 億美元的現金消耗相抵(我自己算的)。 但這是一個預估運轉率(run-rate),並非已報告的營收。它取決於 ETH 的價格和收益率。以 2,130 美元計算,接近 2.95 億美元。此外,一般及行政費用可能包含非現金項目。 我正在關注兩件事:下一季度的營收相對於那 3.09 億美元運轉率的表現;以及 BitMine 的現金水位:11 月 8 日為 4.75 億美元,低於兩週前的 5.14 億美元。 如果質押收入能達到預估運轉率,該模型在當前價格下可實現自給自足。如果 ETH 價格下跌,這個算式也就不成立了。 #WSOT2026 #NovUSCPIWatch #WSOTPicktoEarn10U #美國就業數據與利率決策主導本週宏觀市場 #石油波動追蹤伊朗和平談判


if you're in your early 20s, actively participating in Web3, and you've convinced yourself that one day the next big airdrop, protocol, ecosystem or alpha call is going to change your life, I really pity you. Because there's a dangerous side to this space that a lot of young people don't talk about. You can spend three, four or even five years chasing opportunities on Crypto Twitter. Waking up to check your timeline, farming points, joining Discord communities, grinding leaderboards, hunting for whitelists, jumping from one testnet to another and convincing yourself that the next opportunity is the one that will finally pay off. And there's nothing inherently wrong with that. Web3 has created real opportunities for people who were willing to take risks, learn and put in the work. But what happens when you spend all those years chasing digital opportunities while neglecting the ones right in front of you? You could have learned a practical skill, built a business, pursued a career, gone back to school, developed meaningful relationships, travelled, met people outside your timeline or even started something of your own. Instead, you keep postponing real-life progress because you're waiting for an airdrop that may never come, a token that may never appreciate or a project that might not even remember your contribution when it's time to distribute rewards. The scary part is that the years don't announce themselves before they pass. One day, you'll look up and realise you're approaching 30. You have thousands of followers, hundreds of Discord roles, countless testnet transactions, a folder full of project bookmarks and an impressive knowledge of protocols nobody around you understands. But outside Twitter, what have you actually built or achieved ? What skills can you monetize? What tangible assets do you own? What experience can you put on your CV? What opportunities have you created for yourself beyond the possibility of another airdrop or an NFT you can flip for peanuts? I'm not saying leave Web3. I'm not saying the opportunities aren't real. Some people will genuinely change their lives through this industry. I'm saying don't make Web3 your entire life. Learn to code. Get a job. Start a business. Build something tangible. Develop skills that remain valuable even when the market turns red and the timeline goes quiet. Make friends outside Crypto Twitter. Take care of your health. Explore opportunities in the real world. You can farm points and build your future at the same time. Participate in the ecosystem, but don't become so consumed by the possibility of making it big that you forget to actually make something of yourself. Don't spend your entire 20s waiting for crypto to change your life. Make sure you're building a life that doesn't depend on it. #WSOT2026 #WSOTPicktoEarn10U #BybitAIEvolving $XLMUSDT @

WSOT 2026
WSOT 2026] Join the squad and compete for a share of up to 3.2M USDT $BTCUSDT $SOLUSDT #WSOT2026 #OilVolatilityTracksIranPeaceTalks #WSOTPicktoEarn10U