ByXIMPACT
Where ByX creators compete for 8,000 USDT weekly. Post your market takes, trading setups & chart breakdowns — or go live — and turn every view into leaderboard points. Rank up, get paid. 🔥 v0804
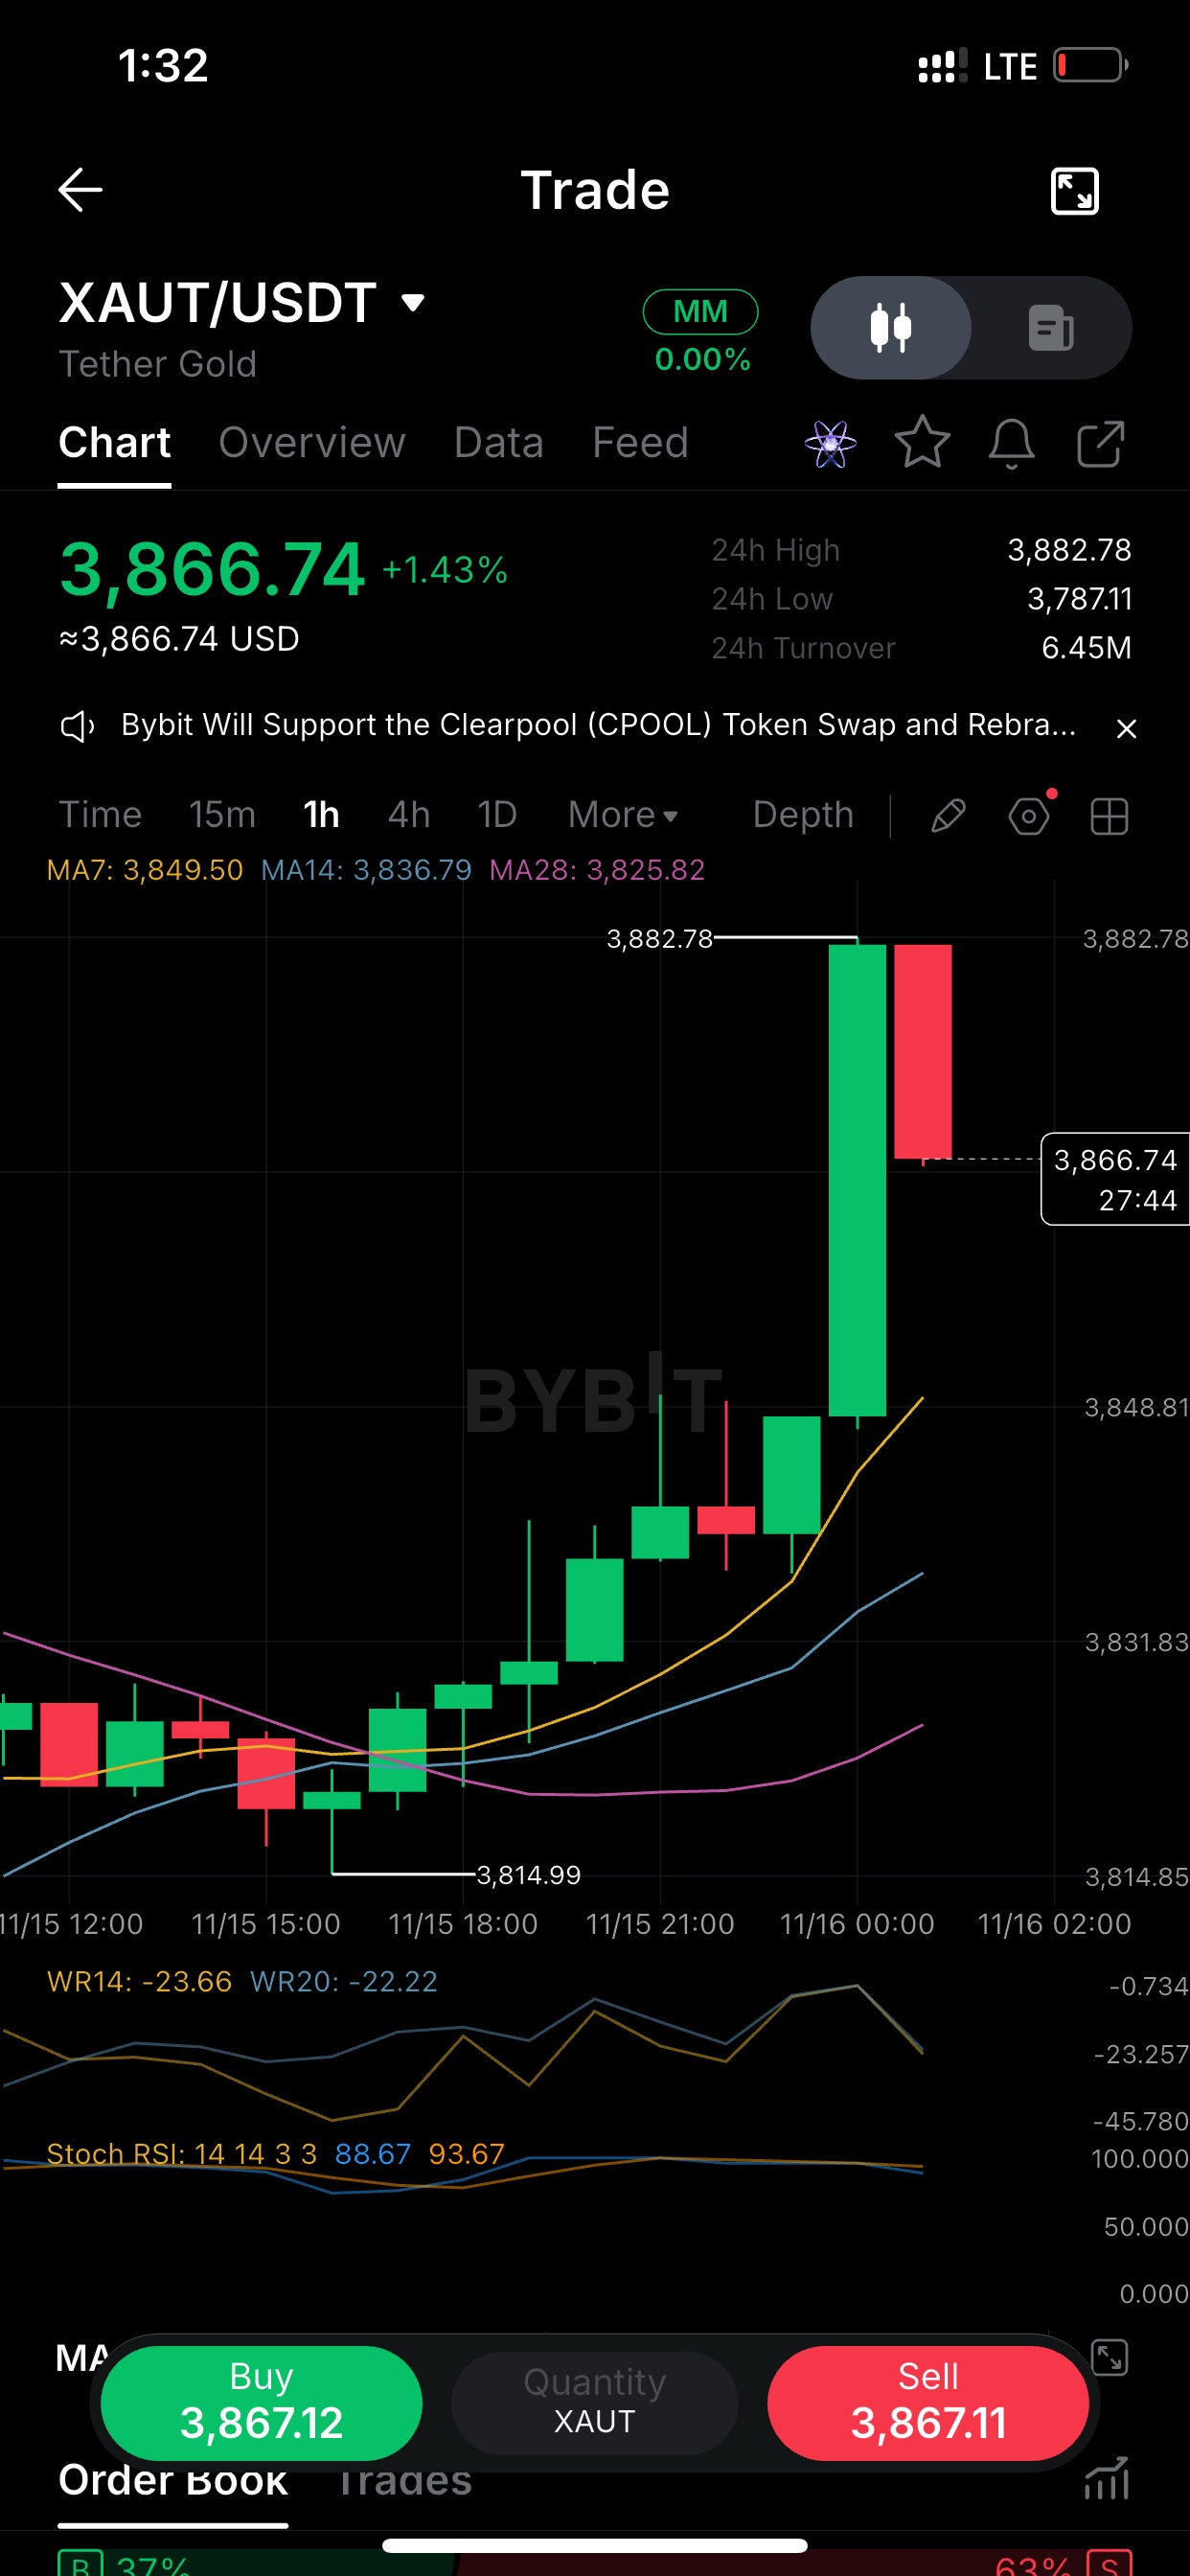
1: the structure $XAUT 1H: the 3,882.78 spike was the first real test of the move, and price is already taking some of it back. Stack is clean though. MA7 3,849 > MA14 3,837 > MA28 3,826, all rising, and the 3,815 swing low is now well behind us. I'm not chasing the green candle. First pullback toward the MA7 is the area I'd watch for a reaction. 2: the momentum read Stoch RSI on XAUT 1H is sitting at 88/93. After a +1.4% day that's not a surprise, but it does mean the easy part of this leg is probably done. Williams %R already rolled over from near zero to -23, so momentum is cooling before price has even given back much. Trend still up, entry quality is the question. I'd rather wait than pay the top of the wick. 3: levels Levels I'm using on $XAUT (1H): Resistance: 3,882.78, the 24h high, rejected once already Support: 3,849 (MA7), then 3,837 (MA14) Invalidation: back under 3,826 Price 3,866 right now, so the room to support is about 17 points and the room to resistance is about 16. That's not much edge in the middle of the range. Patience pays here. Let it come to a level. A few notes for your leaderboard score: - Post one per day at most, spaced out, so you stay clear of the duplicate and high-frequency rules.$XAUTUSDT - Add the $XAUT tag or a trading widget when you publish, since posts need one of them to count. - If you want a different tone (more aggressive, or more educational), tell me and I'll rework the set. #ByXIMPACT

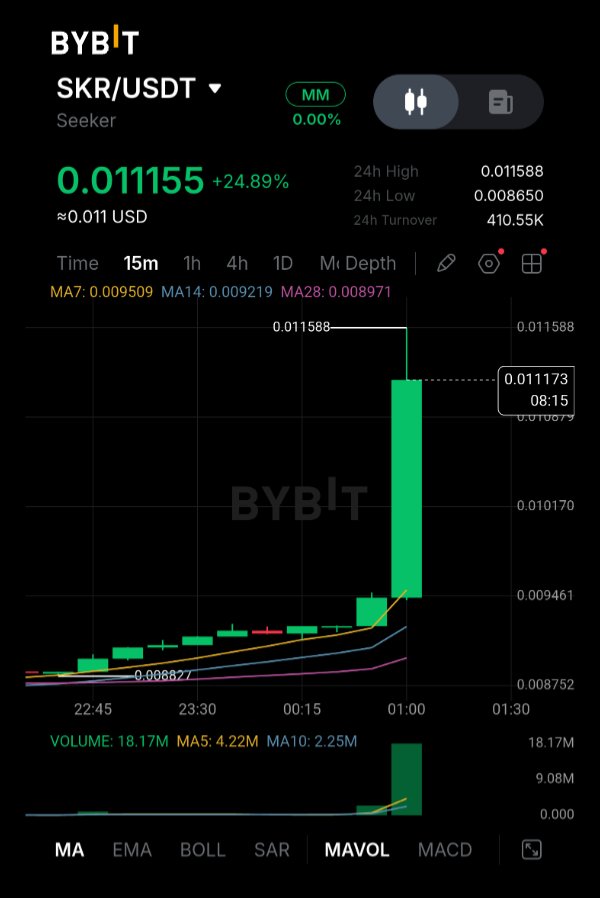
SKR is up 24.89% at $0.011155 and almost all of it came from one 15-minute candle. I couldn't find any news for tonight's move so I'm treating it as a pure market event and not inventing a cause. The chart is unusual. For hours SKR crept up in tiny candles, with the 7, 14 and 28-period averages stacked tightly between $0.0090 and $0.0095. Then a single green candle ran from about $0.0095 to a high of $0.011588, and price is now holding near $0.0112. Volume tells the same story: 18.17M on that candle against a 5-period average of about 4.2M roughly four times normal. That is a sudden burst of aggressive buying, but it is one bar old, so nothing has been tested yet. The background is mixed. On the positive side Solana Mobile runs a revenue-funded buy-and-burn program (about 1.8M SKR burned by November 5), the CLOCK IN hackathon paid out prizes on November 10, and SKR has more than 50,000 holders. The burns are small next to emissions though: the token inflates about 10% in year one decaying over time, and onchain checks showed the mint authority still active in late October. SKR also sits about 80% below its $0.060 all-time high from January. It fell from $0.0130 on November 6 to about $0.0108 by November 12 so tonight's candle is retracing part of that slide. A fake SKR claim app also surfaced and was removed on November 1 which is worth keeping in mind for anyone clicking links on a pump. The level that matters is $0.0116 tonight high. A close above it would be the first confirmation that buyers are holding the move and the $0.0130 area from November 6 is the next target. The floor is about $0.0095 the base of the big candle and the zone of the 7-period average. A move back below it would mean the entire spike has been given back. What I'm watching: whether the next few candles hold above $0.0105 or whether the price slides back toward $0.0095. $SKRUSDT #ByXIMPACT


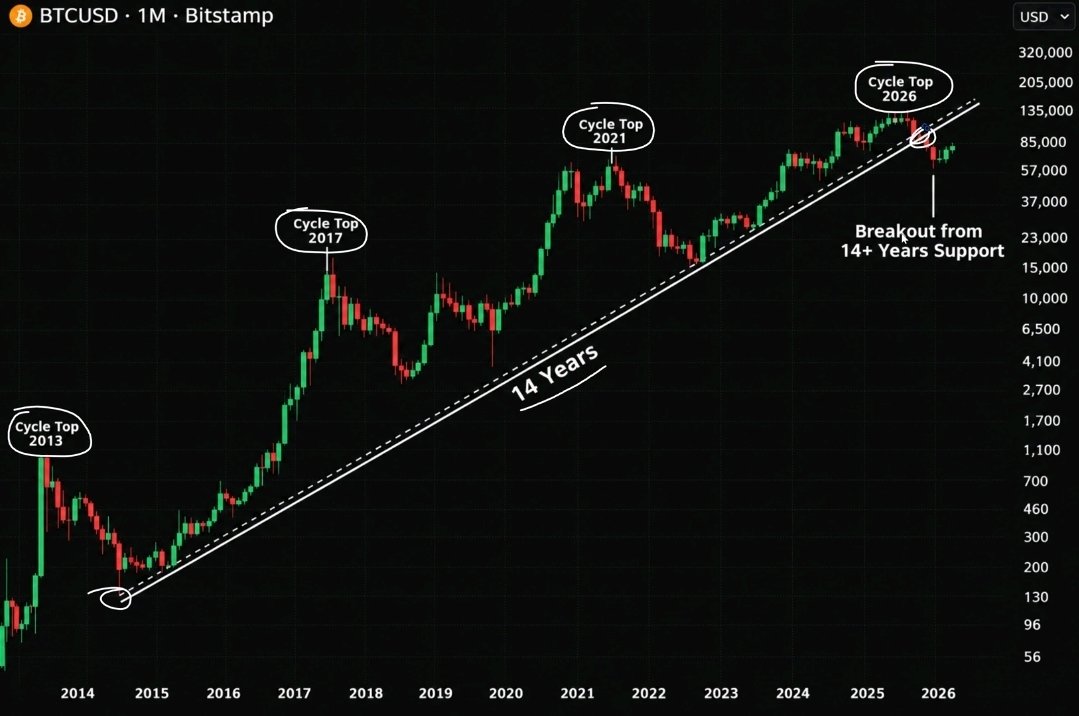
Bitcoin has finally broken below its 14-year trendline. And almost NOBODY understands how serious this could be. Look at the historical pattern: 2013 → Cycle Top. 2017 → Cycle Top. 2021 → Cycle Top. 2026 → Another major breakdown. For over a decade, this rising trendline has defined Bitcoin's long-term bullish structure. Now, for the first time, $BTC is trading BELOW it. But here's what everyone is MISSING: → Bitcoin has lost $70K. → The 200-week moving average near $68K has been breached. → $62K is the next critical level. → Below that, $58K comes back into play. This isn't just another ordinary correction. If Bitcoin fails to reclaim its broken support, we could be witnessing a MAJOR shift in the entire market cycle. One thing matters now: the MONTHLY CLOSE. A recovery could turn this into a massive BEAR TRAP. But a confirmed monthly breakdown would be a serious warning. Same Bitcoin. Different market structure. $BTCUSDT $SPCXXUSDT #ByXIMPACT


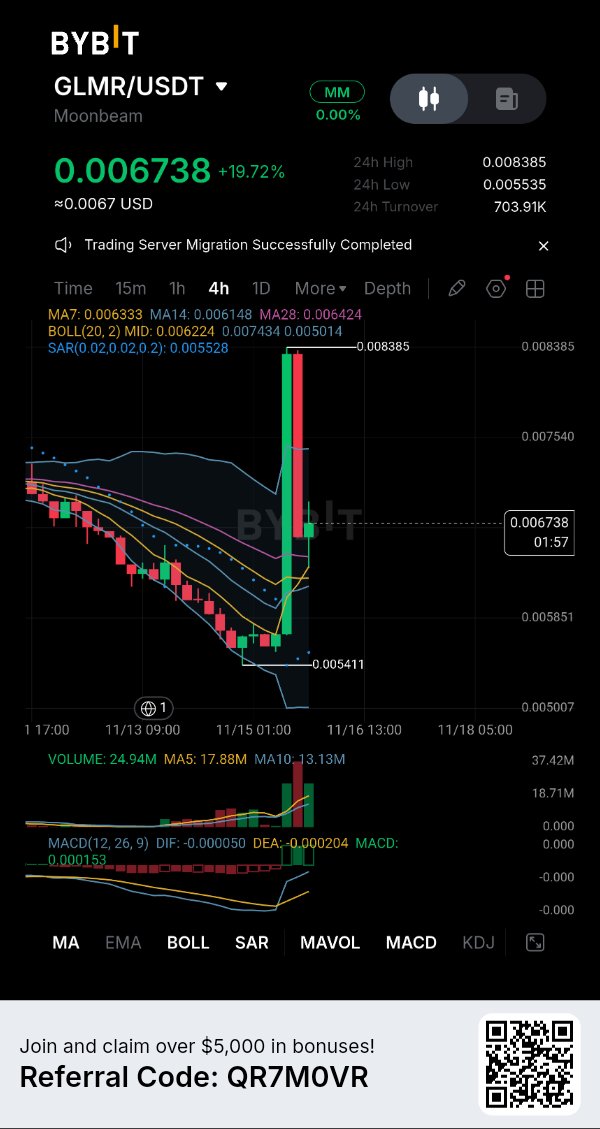
GLMR: Gave Back 58% of the Range, Now 0.006738
$GLMRUSDT — price is 9.4% under the upper Bollinger band, 0.007434, after a spike to 0.008385. Look at the 24h range: 0.005535 to 0.008385. Price gave back about 58% of it, and volume is still 1.4 times its five-bar average. Still unresolved: is this a pullback inside a bigger move, or the spike unwinding? Volume stays high after a big pullback. Is that buyers stepping in, or sellers leaving? 4H, GLMR/USDT on Bybit, 0.006738, +19.72% over 24h. Macro note Nov 14, 2026: US spot Bitcoin ETFs posted $2.35 billion in net outflows over two consecutive weeks (Cointelegraph). Background only, not the reason for this move. What the chart shows Price slid for days to a 24h low of 0.005535. Then it ran to 0.008385, a 51.5% swing from the low, and has pulled back to 0.006738. The spike high is 24% above the current price. Volume is visible. The current bar is 24.94M, 1.4 times the 17.88M five-bar average and 1.9 times the 13.13M ten-bar average. The tallest bar, about 37M, came during the spike. So the pullback is happening on busy volume, not on a quiet fade. Price is above MA7 (0.006333), MA14 (0.006148) and MA28 (0.006424). MACD has crossed up: DIF -0.000050 is above DEA -0.000204, both still below zero. SAR reads 0.005528, under price. These support short-term momentum. They do NOT prove a trend change. They are built from price, MA7 is still under MA28, and one spike pulls all of them up. Key levels Support: 0.006333 (MA7), then 0.006224 (middle Bollinger band). The 24h low is 0.005535. Resistance: 0.007434 (upper Bollinger band), then 0.008385 (24h high). What would strengthen it Price is 9.4% under the upper band, so I'm not asking for a break yet. First I want 4H closes that stay above 0.006333 and 0.006224. Then a 4H close above 0.007434 on volume above the 17.88M average. A higher low above 0.006224 on a pullback would help. Concern A 4H close below 0.006224 would put price back under the middle band and erase the bounce. The spike high of 0.008385 was rejected, and price gave back 58% of the range. Both are reasons for caution. What changes my mind A 4H close below 0.006224. The lesson A spike shows how far price can go. Closes show where it can stay. My view My read: the bounce is holding so far, so I lean slightly constructive while GLMR closes above 0.006224 on 4H. I could be wrong, and a 4H close below 0.006224 would prove me wrong. Take the levels, not my lean. This is a scenario, not a prediction. A reading at posting time, not a guarantee. Which matters more to you here, the 0.006224 hold or a close above 0.007434? #ByXIMPACT

APEX may look like a direct bet on a decentralized exchange, but holding the token is not the same as owning the exchange or having a claim on its assets. ApeX Protocol launched its first product in 2022 and later expanded through ApeX Omni in 2024. Its token supply was reduced from 1 billion to 500 million APEX following the 2024 burn. That distinction is easy to miss if you only read the headline. APEX is a protocol ecosystem token designed for governance, staking, and participation incentives. Holders can stake APEX to earn rewards and participate in protocol decisions, but the token does not represent company equity, direct ownership of trading infrastructure, or a guaranteed claim on exchange profits. Its market price is determined by supply, demand, utility, and market expectations rather than a fixed redemption value. The scale matters. ApeX operates a decentralized derivatives trading ecosystem with perpetual markets, liquidity products, and additional trading features. But the size of the exchange does not automatically translate into an equivalent financial claim for every token holder. The difference is simple: exposure to a trading protocol is not ownership of the business. APEX represents participation in the ecosystem, not ownership of everything behind it. #ByXIMPACT $APEXUSDT


#Bitcoin #BTCUSDT #CryptoMarket #MDFUNDS
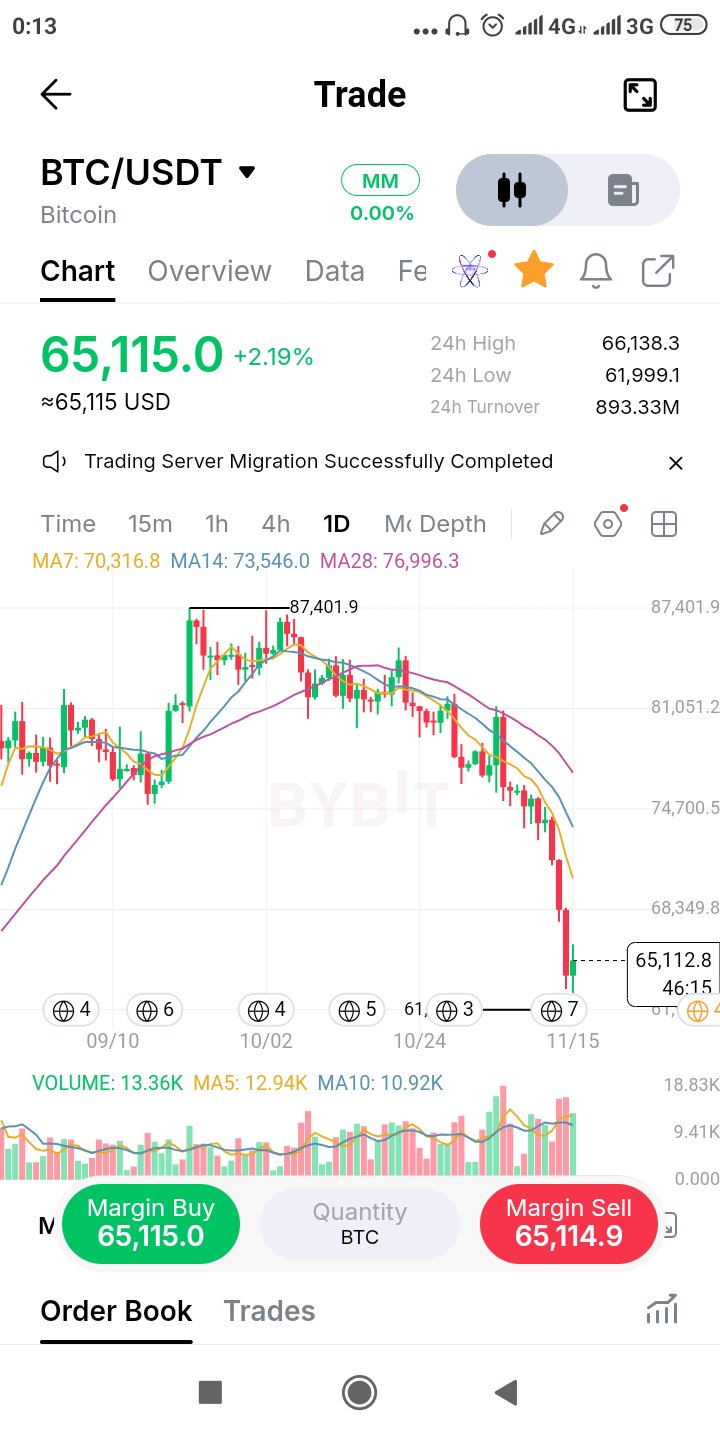
Bitcoin's $62K reaction: Is the market beginning to absorb selling pressure? Bitcoin's daily chart is showing something worth examining beyond the headline price decline. After failing to sustain its advance from the $87,401 peak, BTC entered a persistent sequence of lower highs and lower lows. The latest downside expansion pushed price towards $61,999, where buyers have started producing a visible response. BTC is now trading around $65,115, but the broader structure remains under considerable pressure. Here's the detail that interests me. Daily volume stands at 13.36K, above both its five-day average of 12.94K and ten-day average of 10.92K. That tells us participation has increased during this volatile phase. In Wyckoff terms, increased selling effort followed by a reaction from buyers can be worth monitoring. However, high volume alone does not confirm accumulation or a selling climax. The subsequent price behaviour must provide that evidence. The moving averages reinforce the caution: MA7: $70,316 MA14: $73,546 MA28: $76,996 All three remain above current price, reflecting the prevailing bearish alignment. The levels I'm watching: $61,999 — The immediate downside reference. A decisive loss could expose BTC to another leg lower. $68,350 — The first meaningful recovery hurdle visible on the chart. $70,316 — The daily MA7, which could become an important test of short-term trend recovery. What I want to see is whether BTC can establish a higher low, recover lost resistance and sustain that move with meaningful participation. Until then, calling this a confirmed bottom would be premature. My question to the market: Are we witnessing the early stages of selling-pressure exhaustion, or is this simply a temporary pause before another bearish expansion? #Bitcoin #BTCUSDT #CryptoMarket #MDFUNDS $BTCUSDT #ByXIMPACT

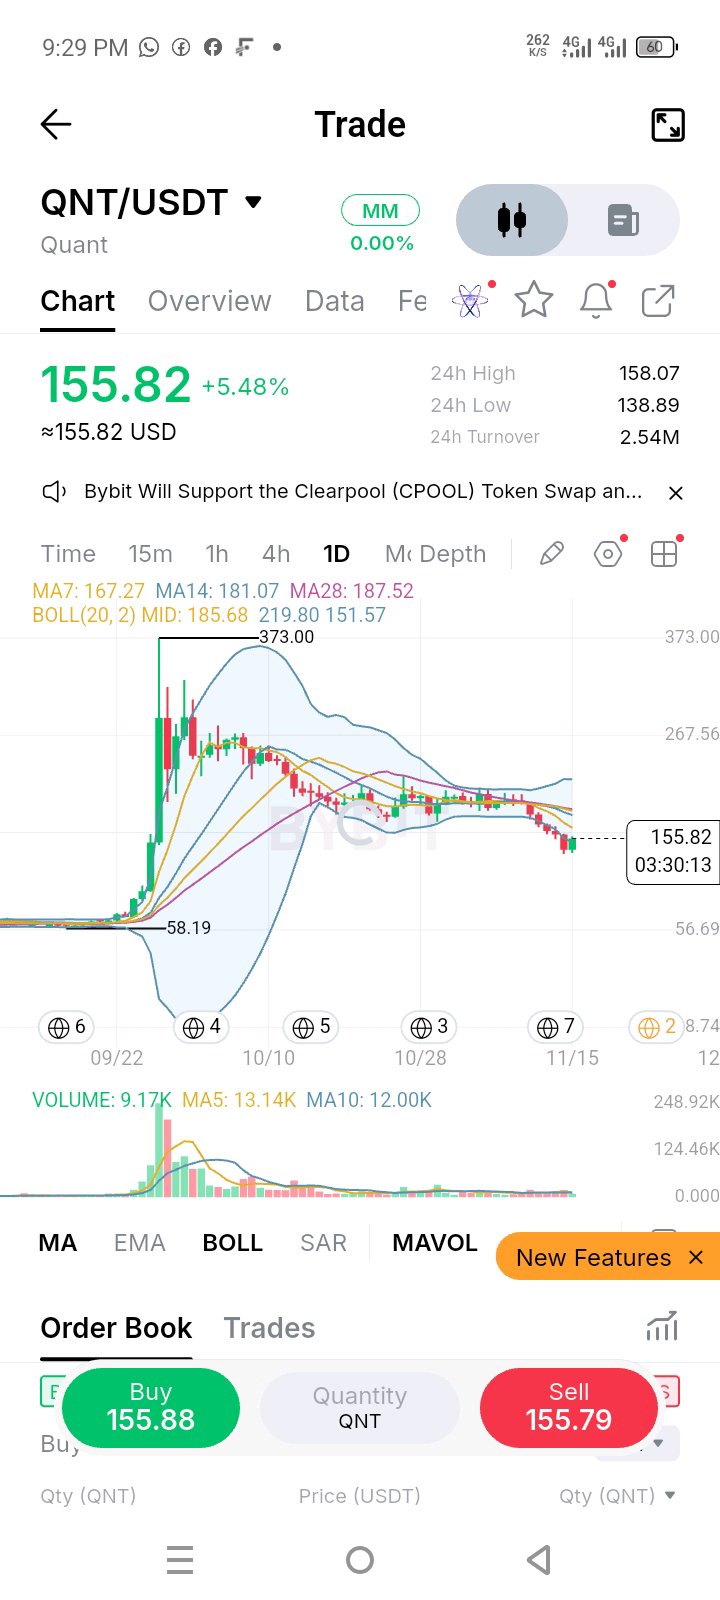
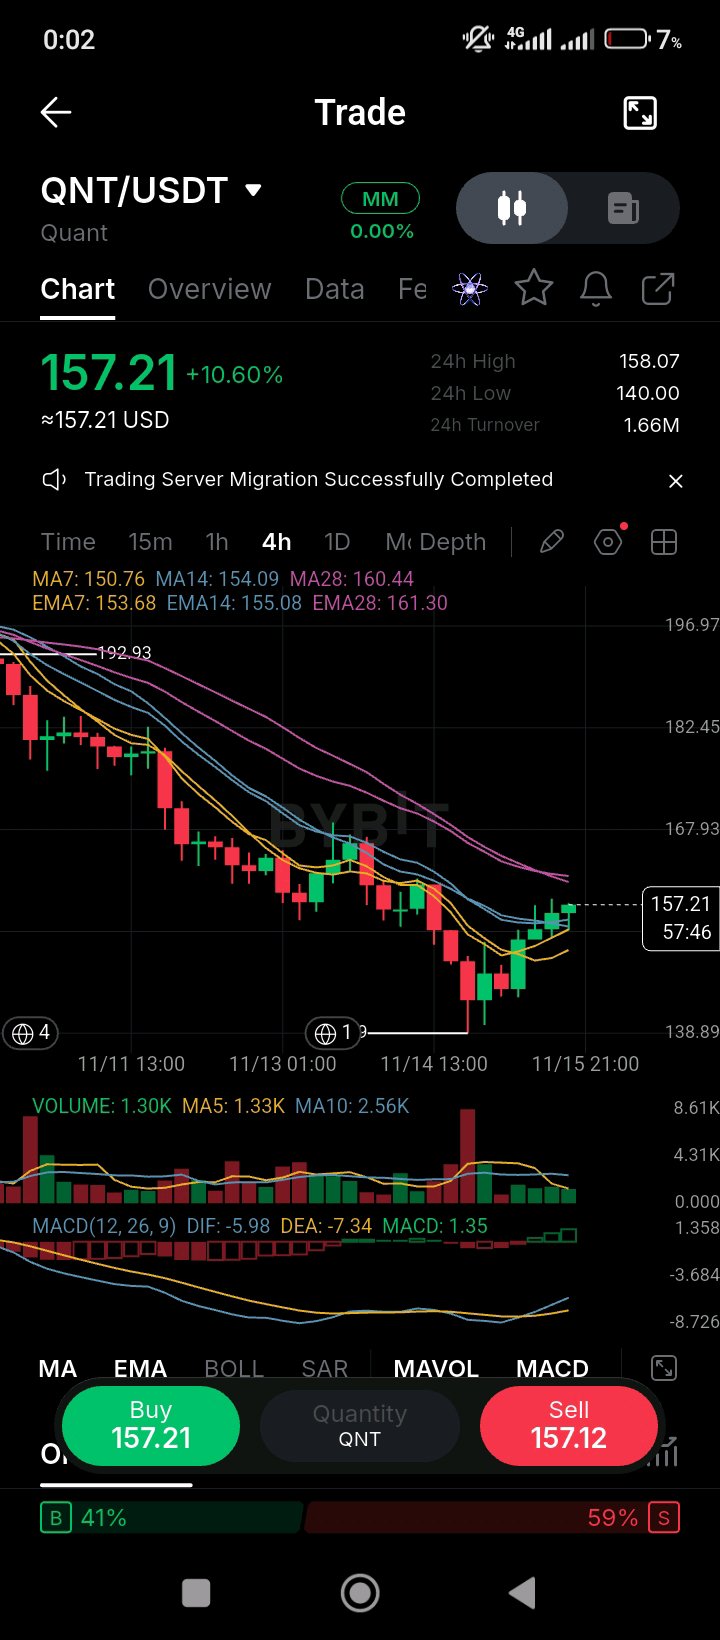
QNT bounced 10.6% off a 140 low today to 157.21, but it's still about 19% below where it traded at the start of the week and the order book is leaning sell. The November 5 move was a market-wide selloff: CoinMarketCap put QNT's 5.7% drop that day at roughly the same size as a 5.2% fall in total crypto market cap, with no Quant-specific news. The same day, COINOTAG reported a 6.9% rally on reports that The Clearing House was moving tokenized-deposit payments onto Quant's network. So the token is still trading on two different stories: the banking adoption that drove September's surge, and the risk appetite that sets the day-to-day moves. The bank pilots haven't been reversed, but they haven't produced steady buying either. On the chart, QNT is up 10.60% to 157.21, with a 24-hour range of 140.00 to 158.07. Price is above the MA7 (150.76), MA14 (154.09) and EMA7 (153.68) and EMA14 (155.08), but still under the MA28 (160.44) and EMA28 (161.30). MACD is positive (1.35), with the DIF (-5.98) crossing above the DEA (-7.34). Volume (1.30K) is roughly level with the MA5 (1.33K) and well below the MA10 (2.56K), so the bounce isn't drawing much buying. The order book is 59% sell-side. The 160.4 to 161.3 MA28 and EMA28 are the level to clear. A close above them on rising volume would bring the 165 area back into view. A loss of 140 would reopen the early-week lows. $QNTUSDT #ByXIMPACT

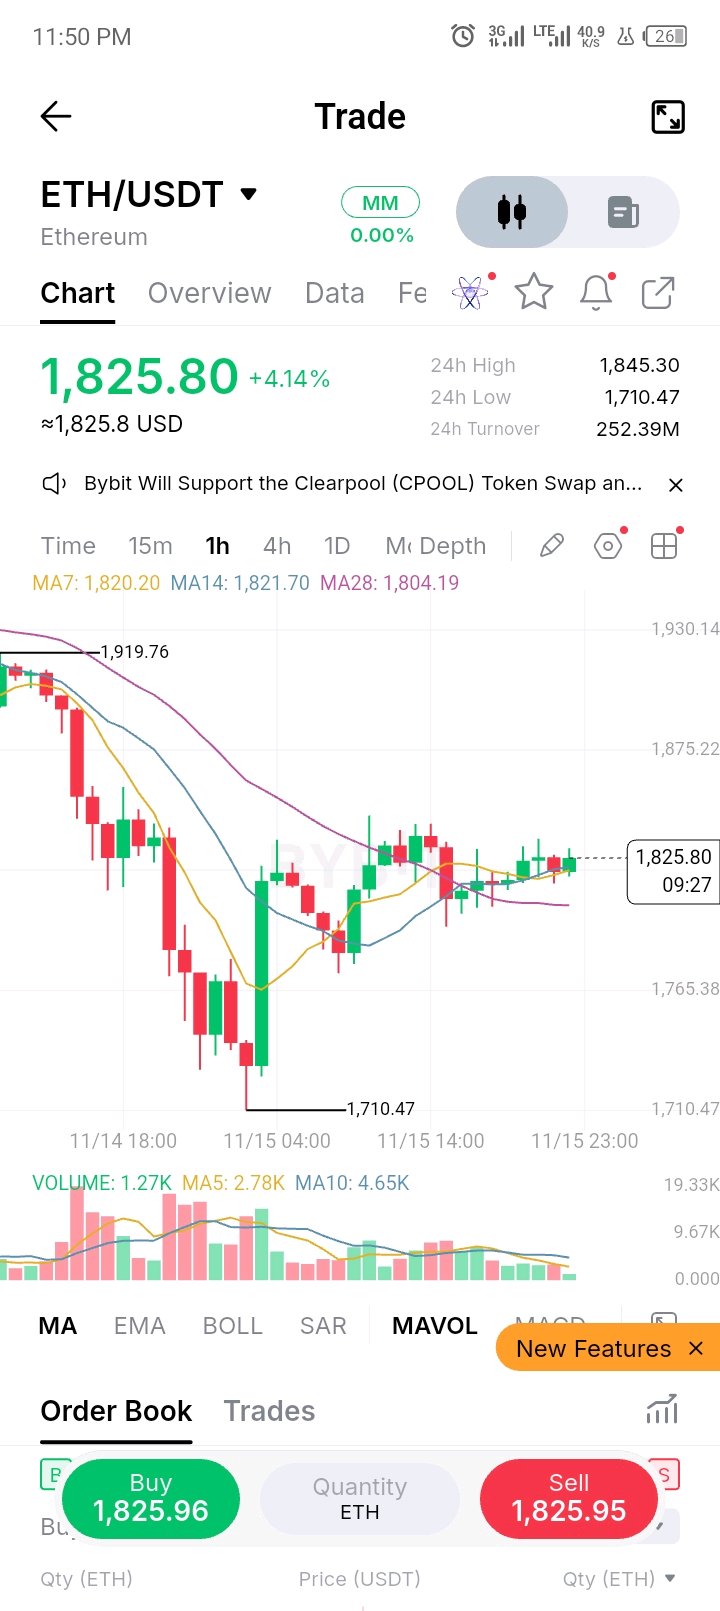
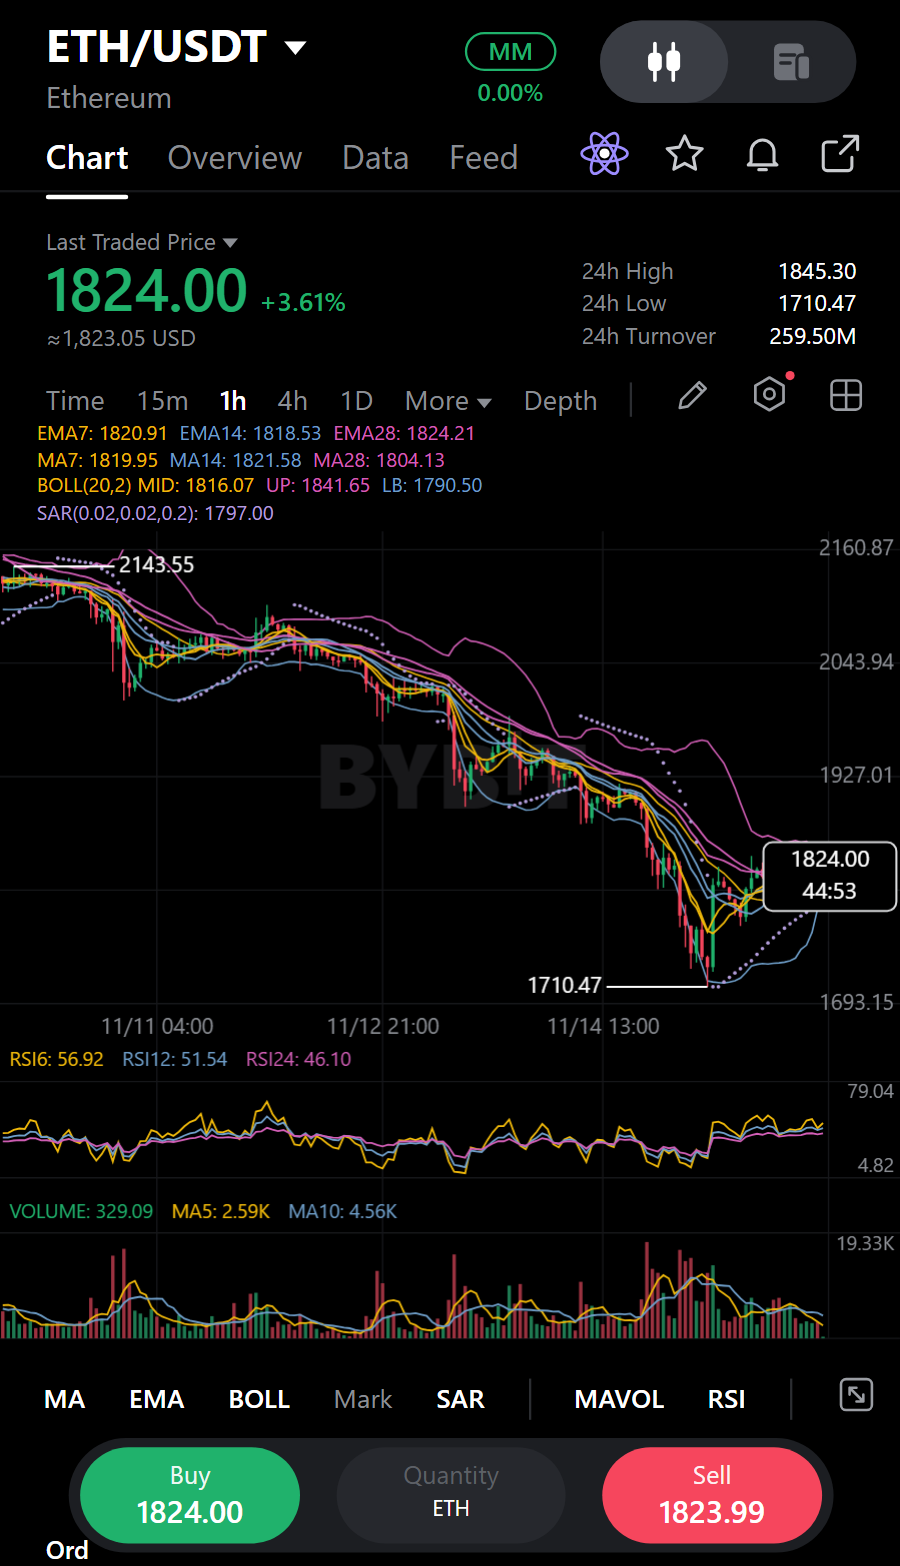
$ETHUSDT reclaimed all its MAs and bounced 6.7% off 1,710.47. Is the bottom in, or is 1,845.30 the trap? Context ETH is about 20% off the 2,271.33 high on this chart and has given back most of its run from 1,710.47. Price is 1,825.80 (+4.14%) after a low of 1,710.47, sitting 0.31% above the 7-day average: MA7 (1,820.20), with MA14 (1,821.70) and MA28 (1,804.19) below, all stacked in bullish order. It's late Sunday, and the 1h candle is about 30 minutes old. Turnover and volume 24h turnover is about 252.39M USDT, roughly 138K ETH, about 0.46x the 5-day average of 2.78K and 0.27x the 10-day (4.65K) on this 1h candle alone. The 5-day average is running below the 10-day, so volume has been shrinking into the bounce, and today's candle has already traded 1.27K. The flush came on real volume, which is how washouts tend to look, though it doesn't prove it's over. Momentum Price is above all three MAs and the MAs are starting to turn up. The last bounce was sold into 1,919.76, then price made a lower low at 1,710.47, then reclaimed 1,820.20. Momentum is turning, so I want a reaction before I act. A reclaim plus a hold sets up a bounce, but a bounce without a close above the wall is just a bounce. Support and resistance Support: 1,804.19 (MA28), about 1,820.20 (MA7), then 1,710.47 (24h low), not a proven level below. Resistance: 1,845.30 (24h high, now the wall), about 1,875.22 (next level), 1,919.76 (earlier high), then 2,271.33. Level to watch 1,804.19 - 1,820.20 is the floor, with the MAs as the line. A 1h close under 1,804.19 would open 1,765 and below. On the upside, 1,845.30 is the wall, where the 24h high meets the round number. Trade plan Bounce: buy 1,804 - 1,820 only on a reaction (a rejection wick or a 1h close holding above 1,820.20), stop under 1,795. Targets are 1,845.30 and 1,875.22, roughly 1.5R and 2.5R from 1,812. Continuation (short, or simply no longs): wait for a retest of 1,845.30 that gets rejected, stop above 1,855. Targets are 1,820.20 and 1,804.19, roughly 1.5R and 2.2R from 1,845. I'm not buying 1,825.80 in the middle of a +4.14% candle. The stop belongs under 1,804.19, and the first resistance at 1,845.30 is only about 19 above, so it pays under 1R. Risk note ETH ranged about 7.9% in the last 24 hours (1,710.47 to 1,845.30), weekend liquidity is thinner, and wicks can run through any level, so size matters more than entry. Oversold readings can stay oversold. MA levels are zones, not exact lines. Levels come from my own chart. Not financial advice. Is the bottom in, or is 1,845.30 the trap? The reaction at 1,845.30 will say. For education only, not financial advice. $ETHUSDT#ByXIMPACT

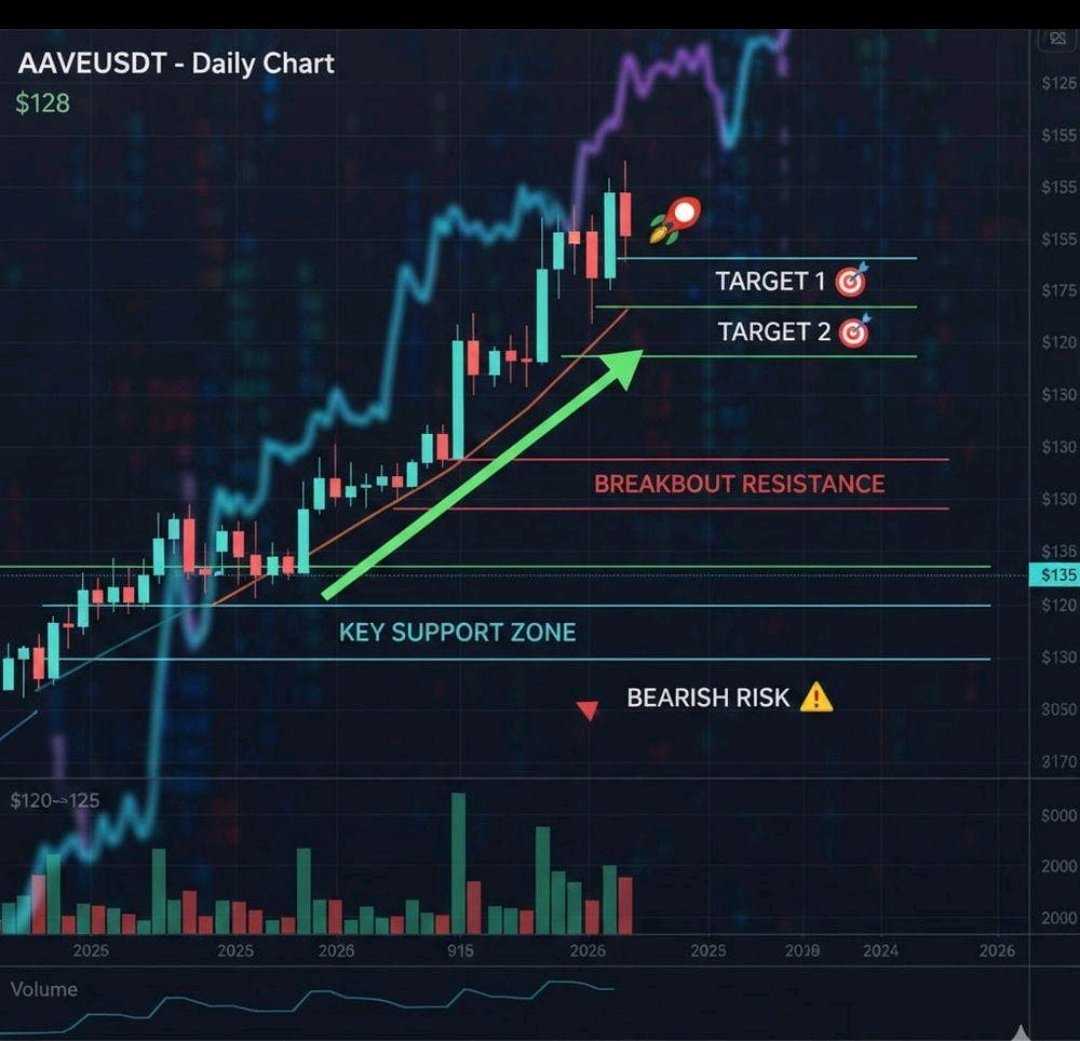
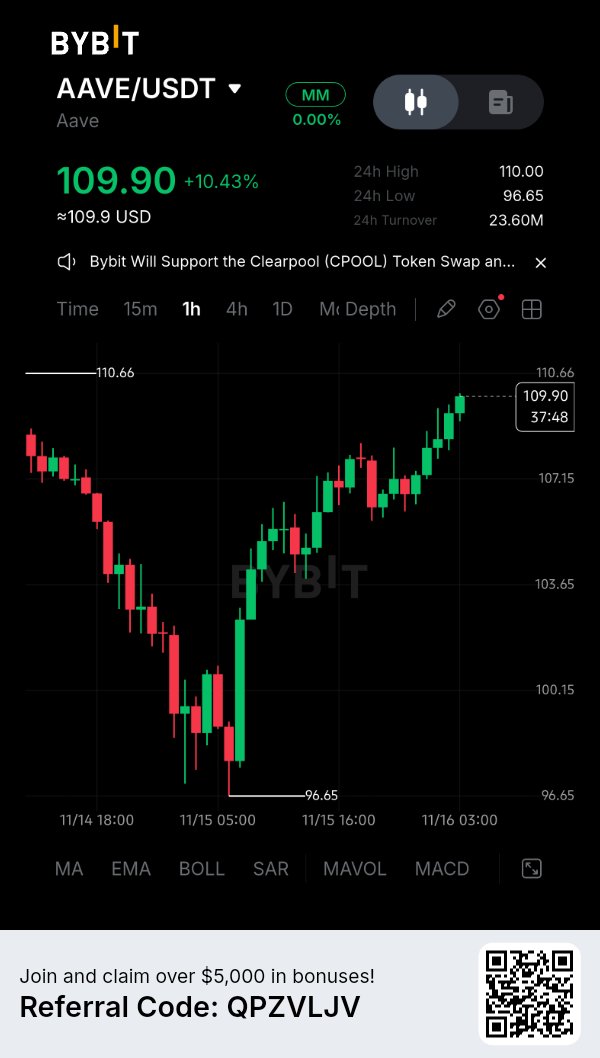
🚀 $AAVEUSDT Technical Analysis – Bulls Are Approaching a Major Breakout! AAVE is showing strong buying pressure after recovering from the $96.65 support area. The price is currently trading around $109.90, with a 10.43% gain. The 1H chart shows a clear recovery structure, with buyers gradually pushing the price toward the $110 resistance zone. But the big question is whether bulls can successfully break this level. Let's break down the important trading levels. 📊 Current Market Overview Pair: AAVE/USDT Current Price: $109.90 24H Change: +10.43% 24H High: $110.00 24H Low: $96.65 24H Turnover: $23.60M Timeframe: 1H 🟢 Important Support Levels $107.15 – $106.50: Immediate support and potential pullback area. $105.00 – $104.50: Secondary support zone. $103.65 – $102.00: Important demand area. $100.15 – $96.65: Major downside support zone. 🔴 Important Resistance Levels $110.00 – $110.66: Immediate resistance and breakout area. $111.50 – $112.00: Next potential upside target. $113.00: Psychological target if bullish momentum continues. 📈 LONG Trading Strategy Setup 1 – Pullback Entry Entry Zone: $107.50 – $108.50 Stop Loss: Below $106.50 Take Profit 1: $110.00 Take Profit 2: $111.50 Take Profit 3: $113.00 Wait for a bullish rejection candle and confirmation before entering. Setup 2 – Breakout Entry Entry: Above $110.70 after a confirmed 1H candle close. Retest Zone: $110.00 – $110.70 Stop Loss: Below the confirmed retest structure. Take Profit 1: $111.50 Take Profit 2: $112.00 Take Profit 3: $113.00 Strong volume during the breakout would increase confidence in the setup. 📉 SHORT Trading Strategy If AAVE fails to break the $110.00 – $110.66 resistance zone and forms a strong bearish rejection, a short opportunity may develop. Entry Zone: $110.00 – $110.50 after bearish confirmation. Stop Loss: Above $111.00 Take Profit 1: $108.50 Take Profit 2: $107.50 Take Profit 3: $106.50 Avoid shorting if buyers successfully break and hold above resistance. 🧠 Professional Trading Tips 1. Watch the 1H candle close around $110.66. 2. Confirm breakout strength with trading volume. 3. Avoid entering directly into resistance. 4. Wait for a retest before taking a breakout trade. 5. Keep risk limited to 0.5%–1% of your trading capital. 6. Always use a stop loss and consider taking partial profits. 🎯 My Market Outlook AAVE currently has a bullish short-term structure after its strong recovery from $96.65. The $110.00 – $110.66 zone is the most important area to watch. A confirmed breakout could open the way toward $111.50 and potentially $113.00. However, rejection from this resistance could trigger a pullback toward $107.15 or $105.00. My strategy is simple: I would prefer waiting for confirmation rather than chasing the current green candles. Trade with a plan. Protect your capital. Let the market confirm your setup. What is your prediction? Will AAVE break $110.66 and move toward $113, or will sellers defend this resistance? Share your thoughts below. #ByXIMPACT #WSOTShowYourAITradeToEarn10USDT #JensenHuangExitTestsNvidiasAILeadership #USPPITestsTheHigherForLongerTrade #USInflationRunsHotAndRateHikeBetsRise $AAVEUSDC
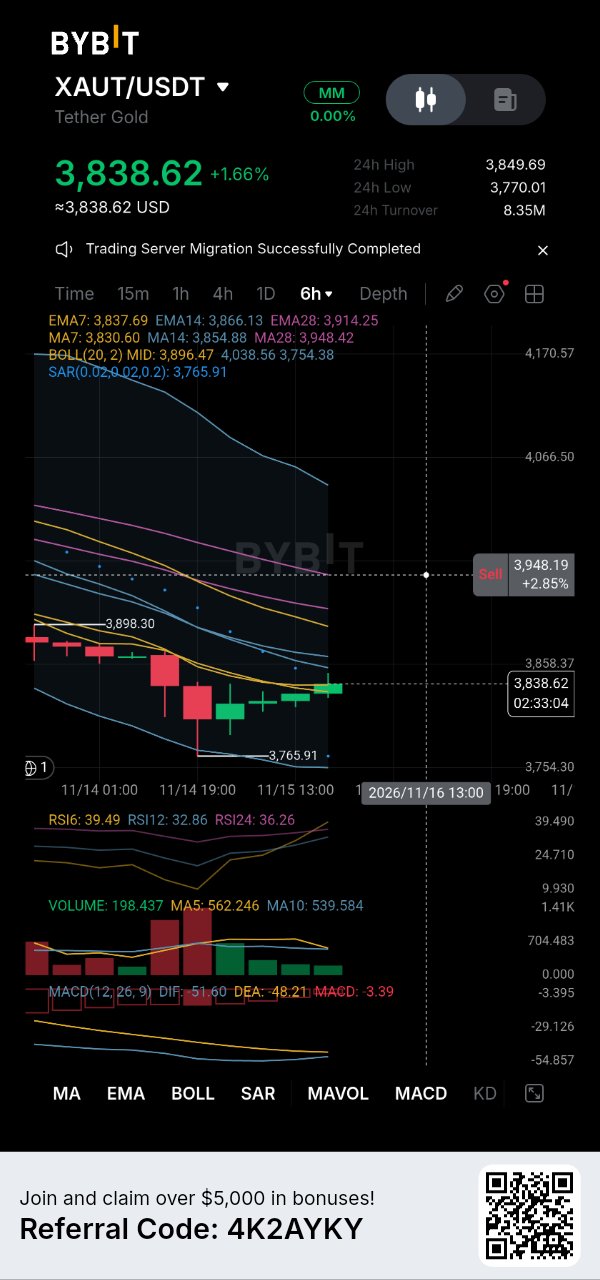
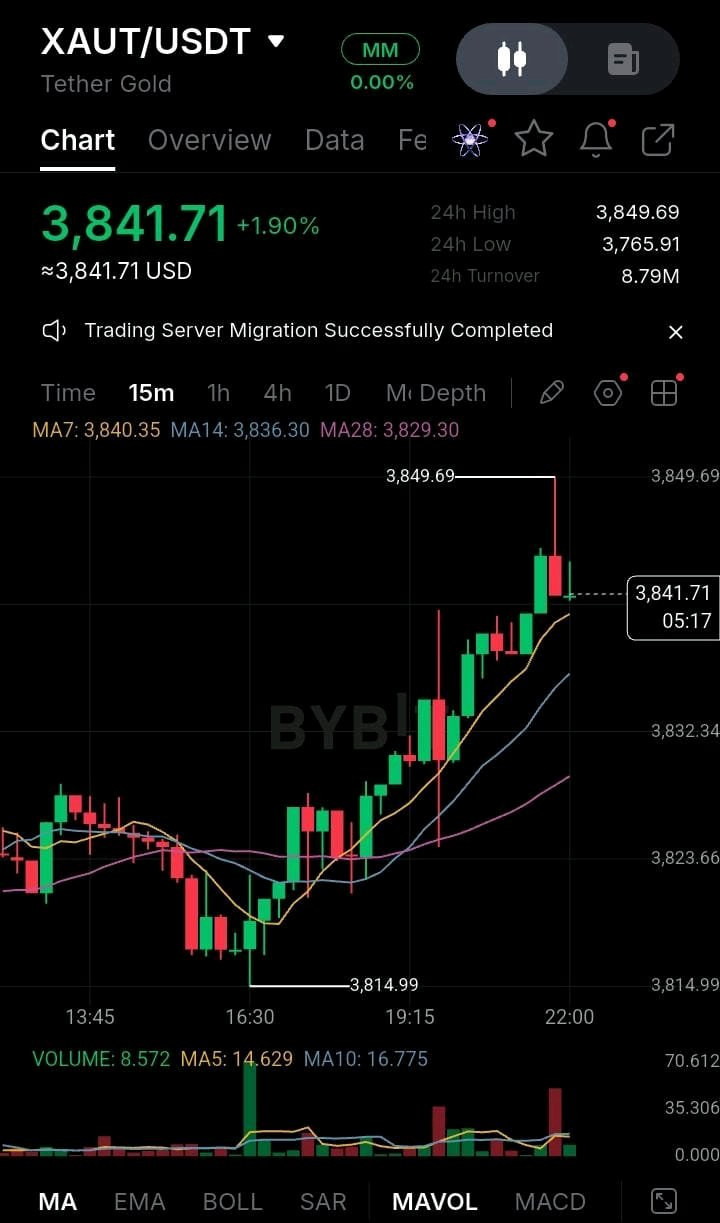
Tether Gold is trading near $3,838.62, up 1.6%, after falling toward the $3,765.91 area on the 6H chart. The latest candles show buyers attempting to stabilize the price. XAUT has moved back above EMA7 at $3,837.69 and MA7 at $3,830.60. That is an improvement, but I would not confuse short-term stabilization with a confirmed trend reversal. The bigger resistance remains overhead. EMA14 sits at $3,866.13, followed by the Bollinger midline at $3,896.47. A sustained move above these levels would provide stronger evidence that buyers are regaining control. Momentum still calls for patience. RSI6 is at 39.49, RSI12 at 32.86, and RSI24 at 36.26. MACD remains negative, with DIF at -51.60 against DEA at -48.21. The selling pressure may be easing, but bullish momentum has not been established. Volume adds another layer of caution: 198.4, compared with MA5 at 562.2 and MA10 at 539.6. The rebound is occurring with relatively limited participation. My focus is now on whether XAUT can hold $3,830 and reclaim $3,866. If it does, $3,896 becomes the next important test. Failure to hold the short-term averages could bring $3,800 and the previous low near $3,766 back into focus. I prefer to wait for confirmation rather than assign too much importance to a modest rebound. Is this the start of a stronger recovery, or simply a pause before another test of the lows? Not financial advice. $XAUTUSDT $BTCUSDT #ByXIMPACT


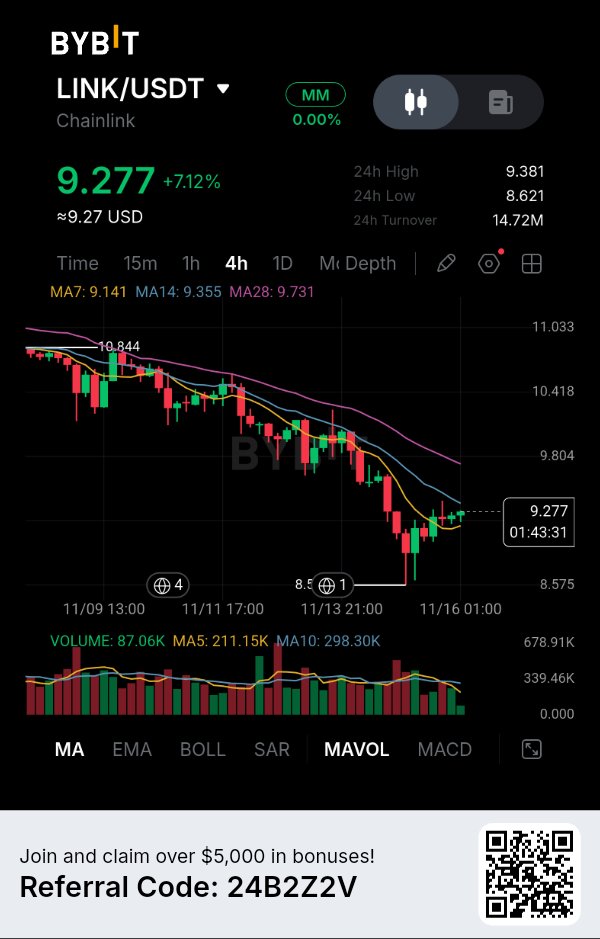
The 7% Recovery Looks Interesting, But Buyers Still Face a Major Resistance Zone. Chainlink is showing a strong short-term recovery, with LINK gaining 7.12% and moving back above its 4H MA7. However, what catches my attention is that this recovery is happening inside a broader declining structure. The interesting part is that buyers have managed to push price away from the recent $8.62 low, but they are now approaching a region where multiple moving averages could challenge the recovery. I want to understand whether this is the beginning of a genuine trend reversal or simply a relief bounce before sellers return. THE MARKET STORY LINK is currently trading around $9.277, after recovering from the recent decline toward the $8.621 area. The 4H chart shows that the previous downward structure has not completely disappeared. Price is still below MA14 and MA28, even though it has recovered above MA7. This creates an interesting technical situation. Buyers are showing renewed strength, but they still need to overcome the $9.35–$9.73 resistance region before I would consider the broader recovery convincing. For me, the next reaction around this zone matters more than the current 7% gain. DATA & EVIDENCE Here are the important figures from the supplied Bybit screenshot: Current price: $9.277 24H change: +7.12% 24H high: $9.381 24H low: $8.621 24H turnover: $14.72M Previous visible high: $10.844 The moving averages reveal an important difference between short-term momentum and the broader trend: MA7: $9.141 MA14: $9.355 MA28: $9.731 LiNK has reclaimed MA7, which suggests improving short-term buying pressure. However, MA14 and MA28 remain above the current price. This means the broader 4H structure still needs confirmation before a bullish reversal can be established. Volume provides another important detail: Current volume: 87.06K Volume MA5: 211.15K Volume MA10: 298.30K Despite the 7.12% price recovery, current displayed volume remains below both averages. This is something I would not ignore. Price is recovering, but participation has not yet reached the recent average levels. A stronger volume expansion would make the recovery more convincing. MY READ I see two important levels in LINK's current structure. The first is $9.355, where MA14 is positioned. The second is $9.731, where MA28 creates another potential resistance. If buyers reclaim both levels and maintain price above them, the current recovery could develop into a broader trend reversal. However, if LINK struggles around this resistance zone and produces a confirmed bearish 4H rejection, another move toward $9.14 and potentially $8.62 becomes possible. My preference is to avoid chasing the recovery after a 7% move. I would rather observe how price behaves around the moving averages before committing to a direction. TRADING SETUP LINK — SHORT Scenario Bearish trigger: Rejection from the $9.35–$9.73 resistance region, followed by a confirmed bearish 4H candle. Entry Zone: $9.40–$9.65 Stop Loss: $9.85 TP1: $9.14 TP2: $8.85 tP3: $8.62 Bullish invalidation: Sustained 4H acceptance above $9.85, weakening the bearish continuation setup. The downside targets are estimates based on the visible chart structure, with TP3 positioned near the previous $8.621 low. Potential downside to TP3: Approximately 8%–10%. Estimated risk-to-reward: Around 2.5:1, depending on entry and execution. This setup is conditional. I would wait for an actual rejection before considering the SHORT active. FINAL THESIS What makes Chainlink interesting right now is the contrast between improving short-term momentum and an unrecovered broader trend. The 7.12% gain shows that buyers have returned, but the moving averages suggest they still have important resistance to overcome. For me, the $9.35–$9.73 region will determine whether this recovery has enough strength to challenge the existing bearish structure. If buyers reclaim it with convincing volume, the outlook changes. If sellers defend it, the recent recovery could become another lower high in the broader downtrend. The next important signal will come from how LINK reacts when it meets this resistance zone. $LINKUSDT #ByXIMPACT


⚠️ $ETH: INSTITUTIONAL MONEY IS LEAVING ETFs, BUT EXCHANGE RESERVES ARE FALLING TOO — WHAT IS REALLY HAPPENING? Ethereum is facing a challenging market environment, but there is more to this situation than a simple price decline. As of November 15, ETH is trading around the $1,800 area after experiencing significant selling pressure. What makes this situation particularly interesting is the contrast between institutional fund outflows and declining exchange reserves. Let's look beyond the candles and examine the bigger picture. 🔴 1. THE MARKET IS UNDER PRESSURE Ethereum has been moving lower alongside Bitcoin and the broader cryptocurrency market. Several factors are contributing to the weakness: - Higher interest-rate expectations. - Marketwide selling pressure. - Forced liquidations in derivatives markets. - Weak institutional demand through spot ETH ETFs. This suggests that the current decline is not necessarily caused by a new fundamental problem within Ethereum itself. 📉 2. INSTITUTIONAL FLOWS: A WARNING SIGNAL One important development is the approximately $398.9 million in net outflows recorded by US spot Ethereum ETFs between November 9 and November 13. This indicates that institutional investment products experienced meaningful selling pressure during that period. However, ETF outflows should not automatically be interpreted as proof that long-term confidence in Ethereum has disappeared. They are one part of a much larger market picture. 📊 3. THE EXCHANGE RESERVE PARADOX Here is another development worth watching. Ethereum reserves on Binance have reportedly declined to approximately 2.9 million ETH, reaching their lowest level in nearly five years. This creates an interesting contrast: - ETF outflows indicate pressure on institutional investment demand. - Declining exchange reserves indicate that fewer ETH are held in exchange-labelled wallets. Could this reflect longer-term withdrawals and reduced immediately available exchange supply? Possibly. But exchange withdrawals do not automatically prove accumulation or fresh buying. This is precisely why on-chain data needs to be interpreted carefully. ⚡ 4. THE TECHNICAL LEVELS THAT MATTER Based on the November 15 market analysis, these are the key areas I am monitoring: Support zone: $1,790–$1,814 Holding this area could allow ETH to attempt a recovery. First recovery resistance: $1,838–$1,868 A sustained reclaim of this zone would improve the short-term technical outlook. Critical downside reference: $1,712 A breakdown below the support structure could expose ETH to another significant test. These are monitoring levels, not guaranteed targets. 🧠 5. WHAT WOULD CHANGE MY MARKET VIEW? I would become more constructive if: - ETH maintains support around $1,790–$1,814. - Price reclaims $1,838–$1,868. - Spot buying activity improves. - ETF outflows begin to stabilize. - Derivatives positioning becomes healthier. On the other hand, a sustained breakdown below support, accompanied by increasing selling pressure, would invalidate the short-term recovery scenario. 🎯 6. A DISCIPLINED APPROACH Rather than buying simply because ETH has declined, I would separate potential exposure into conditional stages: 1. Observe whether support holds and selling pressure weakens. 2. Look for confirmation through price recovery and stronger participation. 3. Evaluate additional exposure only after resistance is reclaimed. Total exposure should be determined by a predefined risk limit. If support fails, the correct response is to reassess the thesis rather than automatically increase exposure. 🔥 MY BIGGER PICTURE Ethereum is currently facing two competing forces. On one side, institutional ETF outflows and marketwide liquidations are creating pressure. On the other, declining exchange reserves raise an interesting question about the movement and availability of ETH supply. Neither development alone determines the next market direction. The real confirmation must come from price action, liquidity, institutional flows, and sustained demand. I believe the coming sessions will be important in determining whether Ethereum can stabilize or whether sellers still have more room to push. What is your interpretation of ETH right now? Are we witnessing a temporary liquidity-driven correction, or is the market entering a deeper bearish phase? Let's discuss the data, not just the predictions. $ETHUSDT $ETHUSDC #ByXIMPACT


NVIDIA'S BOARD IS LEARNING HOW HARD IT IS TO REPLACE A FOUNDER AND CRYPTO HAS SEEN THIS MOVIE BEFORE The Nvidia saga took a surprising turn this week. After Jensen Huang resigned following reports of extramarital relationships, a petition to bring him back climbed toward 150,000 signatures, with Elon Musk, several tech CEOs and two large investors holding more than two billion dollars of stock publicly backing a return or at least a rethink. The signatures are self reported, the board has not responded, and shareholders do not get a direct vote on who runs the company, so this is pressure and not a process. Nvidia also faces a lawsuit and a CEO search right as earnings approach. What makes it relevant here is the key person problem. Nvidia's stock dropped hard on the news because the market priced in how much of the AI story was tied to one face. Crypto knows this feeling well. Strategy leans on Michael Saylor, Binance has leaned on CZ, and every time a founder wobbles, the token or the stock attached to them wobbles with him. For traders the lesson is that governance risk is real risk. A board can move faster than anyone expects, public campaigns can swing sentiment overnight, and when the leader of the market's favorite theme is suddenly in question, risk assets tend to feel it, including crypto which has been trading like tech. On the positive side of the week's ledger, Coinbase received final approval for its national trust bank charter, putting its institutional custody under a single federal regulator, and Deutsche Bank is moving ahead with its own custody service in Europe. Those developments keep stacking up in the background while prices fall, and they are the reason I stay constructive on the long game even when the short term looks ugly. I'm watching Nvidia's earnings and the board's next move closely, because a messy resolution would keep the AI and crypto risk mood fragile. Do you think the board should bring Huang back or move on, and does losing a founder hurt a company's token or stock more than people admit? #ByXIMPACT

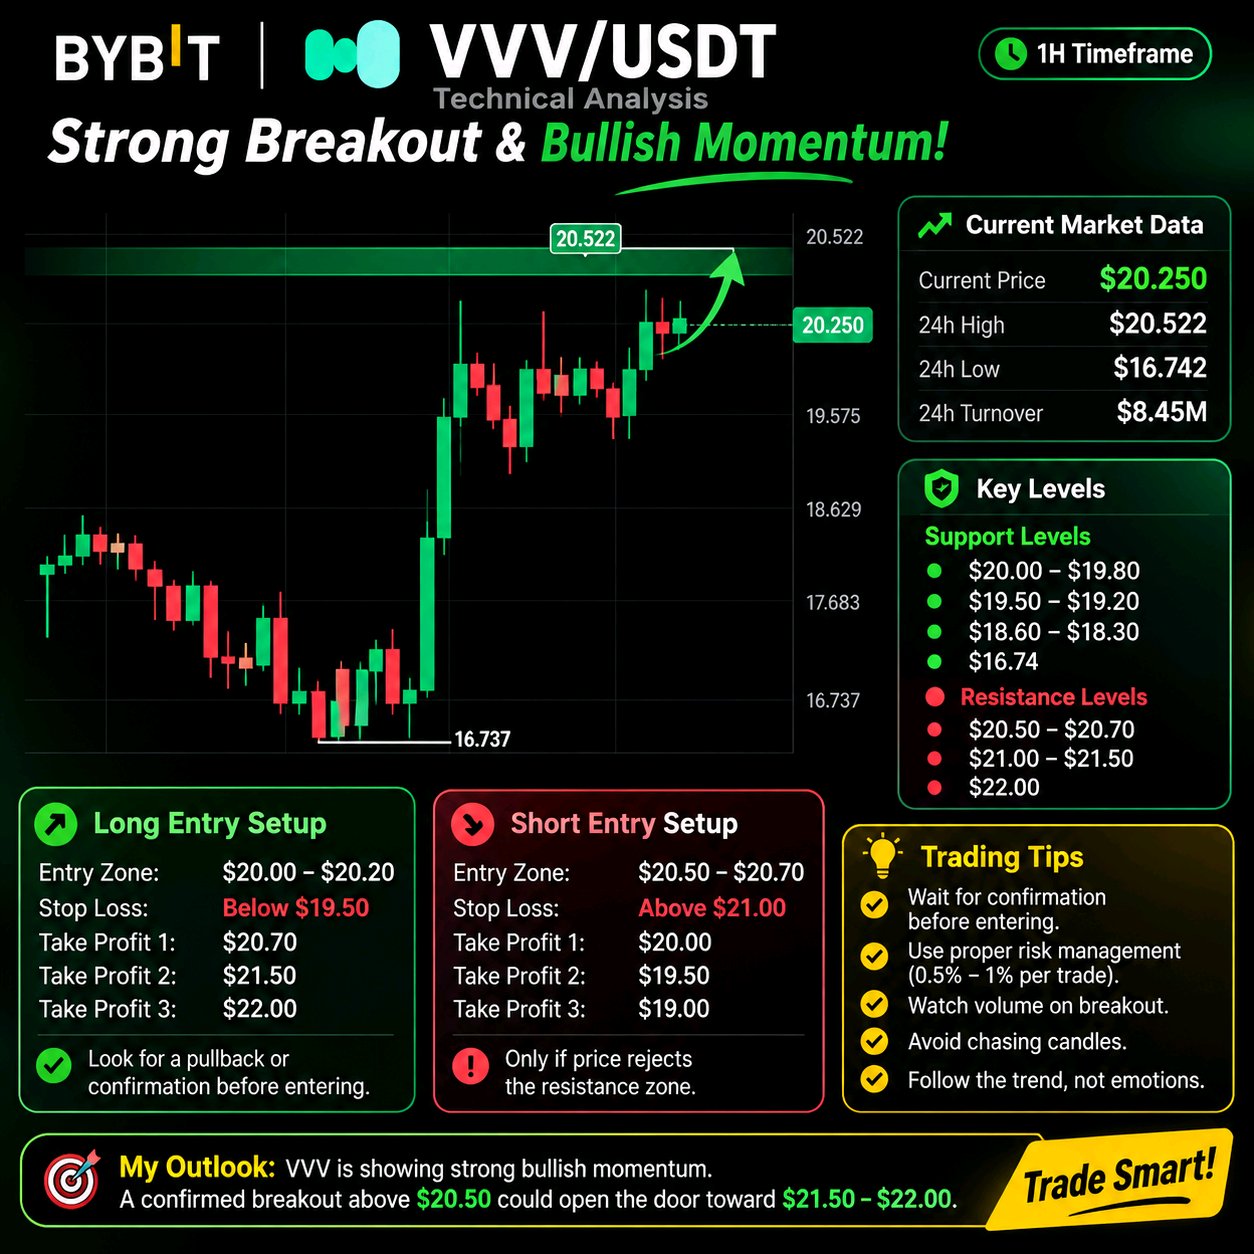
🚀 $VVVUSDT Bulls Are Taking Control! Is $22 the Next Target? VVV is showing strong bullish momentum after recovering from the $16.737 support area. The price has climbed toward $20.250, recording an impressive 19.54% gain. Buyers are clearly showing strength, but the next resistance zone will be very important for the continuation of this move. Let's look at the important levels and possible trading opportunities. 📊 Current Market Overview Pair: VVV/USDT Current Price: $20.250 24H Change: +19.54% 24H High: $20.522 24H Low: $16.742 24H Turnover: $8.45M Timeframe: 1H 🟢 Important Support Zones $20.00 – $19.80: Immediate support and potential pullback entry area. $19.50 – $19.20: Secondary support where buyers may attempt to defend the price. $18.60 – $18.30: Important demand zone and previous consolidation area. $16.74: Major recent swing low. 🔴 Important Resistance Zones $20.50 – $20.70: Immediate resistance and breakout area. $21.00 – $21.50: Next potential resistance zone. $22.00: Psychological upside target if bullish momentum continues. 📈 LONG Trading Strategy Setup 1: Pullback Entry Entry Zone: $19.80 – $20.10 Stop Loss: Below $19.40 Take Profit 1: $20.50 Take Profit 2: $21.00 Take Profit 3: $21.50 Wait for bullish confirmation around support before entering. Avoid buying simply because the price is moving up. Setup 2: Breakout Entry Entry: Above $20.55 after a confirmed 1H candle close. Retest Zone: $20.40 – $20.55 Stop Loss: Below $20.00, adjusted to the retest structure. Take Profit 1: $21.00 Take Profit 2: $21.50 Take Profit 3: $22.00 A breakout supported by strong volume would provide better confirmation. 📉 SHORT Trading Strategy If VVV fails to break the $20.50 – $20.70 resistance zone and forms a strong bearish rejection, a short setup may develop. Entry Zone: $20.45 – $20.70 after bearish confirmation. Stop Loss: Above $21.00 Take Profit 1: $20.00 Take Profit 2: $19.50 Take Profit 3: $19.20 Do not open a short position if buyers successfully break and hold above resistance. 🧠 Professional Trading Tips 1. Watch the 1H candle close around $20.50. 2. Check trading volume before trusting a breakout. 3. Wait for retests instead of chasing green candles. 4. Use a stop loss on every trade. 5. Risk only 0.5%–1% of your trading capital per setup. 6. Consider taking partial profits at each target. 🎯 My Market Outlook VVV currently has a bullish short-term structure after its strong recovery from $16.737. The $20.50 level is the most important area to watch. A confirmed breakout could create an opportunity toward $21.50 and potentially $22.00. However, rejection from resistance could bring a healthy correction toward $20.00 or $19.50. My approach would be to wait for confirmation rather than chase the current pump. Trade the setup, not the excitement. What do you think? Will VVV break above $20.50 and move toward $22, or will sellers push the price back toward $19.50? #ByXIMPACT #WSOTShowYourAITradeToEarn10USDT #JensenHuangExitTestsNvidiasAILeadership #USPPITestsTheHigherForLongerTrade #USInflationRunsHotAndRateHikeBetsRise $BTCUSDT
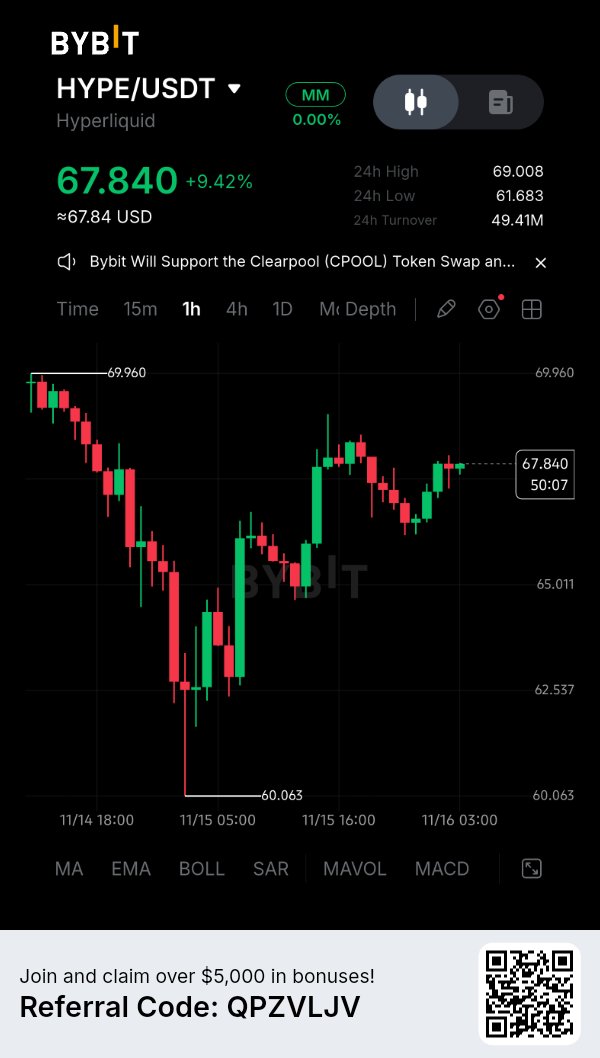
🚨 $HYPEUSDT Technical Analysis – Bulls Are Fighting Back! HYPE is showing a strong recovery after dropping toward the $60.06 support area. Buyers have stepped in aggressively, pushing the price back to $67.84, with approximately 9.42% gains visible in the chart. However, the next move will be very important. Price is approaching a major resistance zone, and traders should watch for confirmation before entering a position. 📊 Current Market Structure (1H Chart) Current Price: $67.84 24H High: $69.00 24H Low: $61.68 Major Chart Low: $60.06 The market has recovered strongly from its recent low. Short-term momentum looks bullish, but the $68.50–$69.00 region could create selling pressure. 🎯 Important Support Levels 1. $67.00 – $66.50: Immediate support and potential pullback zone. 2. $65.50 – $65.00: Important support area for buyers. 3. $63.00 – $62.50: Major demand zone from the previous recovery. 4. $60.06: Recent chart low and major downside reference. 🔴 Major Resistance Levels 1. $68.50 – $69.00: Immediate resistance zone. 2. $69.90 – $70.50: Potential upside target after a confirmed breakout. 3. $72.00: Next psychological target if bullish momentum continues. 📈 Potential LONG Entry Setups Setup 1 – Pullback Entry Entry Zone: $66.50 – $67.20 Stop Loss: Below $65.80 Take Profit 1: $68.00 Take Profit 2: $69.00 Take Profit 3: $70.00 Wait for a bullish rejection candle or a confirmed support retest before entering. Setup 2 – Breakout Entry Entry: Above $69.10 after a confirmed 1H candle close. Confirmation: Wait for a successful retest of $69.00. Stop Loss: Below the retest structure. Take Profit 1: $70.00 Take Profit 2: $70.50 Take Profit 3: $72.00 Avoid chasing a breakout without confirmation. 📉 Potential SHORT Entry Setup If HYPE fails to break the $68.50–$69.00 resistance zone and produces a clear bearish rejection: Entry Zone: $68.30 – $68.90 after bearish confirmation. Stop Loss: Above $69.50 Take Profit 1: $67.20 Take Profit 2: $66.50 Take Profit 3: $65.00 A short position should only be considered if sellers regain control. A strong breakout above resistance invalidates this setup. 🧠 Professional Trading Strategy Here are five things I would watch before taking a trade: 1. Watch the 1H candle close around $69.00. 2. Check volume during any breakout. 3. Avoid entering in the middle of a resistance zone. 4. Wait for retests instead of chasing green candles. 5. Keep risk between 0.5% and 1% of trading capital per setup. My Market Outlook HYPE currently has positive short-term recovery momentum, but the $69.00 level is the key decision point. A confirmed breakout could open the door toward $70–$72. On the other hand, rejection from resistance could bring another pullback toward $67 or even $65. The best trade is not always the first trade. Patience, confirmation and proper risk management matter more than predicting every candle. What is your expectation for HYPE? Will bulls break $69 and push toward $72, or will sellers defend resistance again? Share your analysis below. #ByXIMPACT

ETHUSDT Bulls Weigh a Retest
The sharpest clue in this sequence is the contrast between the selloff and the recovery attempt. At 21:00, the red candle closed at 1,807.04 on the sequence’s heaviest volume; by 04:00, after several green candles, price closed at 1,819.45. That shows buyers responded, though the latest candle was red. $ETHUSDT is near the MA7 and MA14 and above the MA28, a mildly supportive arrangement, not proof that the rebound will continue. The bullish lean also has the 24h move in its favor, while the mixed moving-average picture and lower traded volume keep me from treating the move as confirmed. I hold ETH spot, and my chart read depends on whether buyers can maintain the recent recovery rather than on assuming the earlier selloff is finished. The candle sequence shows both demand and selling pressure, so I’d look for follow-through before giving the rebound more weight. My long setup is a possible retest of the Entry Zone at 1,817.20 - 1,830.68, with the Stop Loss at 1,783.49 as the level that invalidates this setup. TP1 is 1,857.65 and TP2 is 1,891.36. From the middle of the zone, the supplied risk-reward is about 0.8 to 1 and 1.7 to 1, respectively, so the first target offers less room relative to the stated risk. A hold around the entry area would support my bullish read; a move through the stop would change it. The recent heavy-volume candle is a reminder that volatility can be uneven around these levels, so I’d account for liquidity and possible wicks when assessing a break. Moving averages describe the current chart, but they don’t guarantee what price does next. Trade Plan (LONG / Bullish): • Support: 1,710.47 / 1,710.47 | Resistance: 1,845.30 / 2,103.98 • Entry Zone: 1,817.20 - 1,830.68 • Stop Loss (SL): 1,783.49 • Targets: TP1 1,857.65 | TP2 1,891.36 When a rebound follows a heavy-volume selloff, what helps you decide whether buyers have regained control? Just my read, not advice.#ByXIMPACT


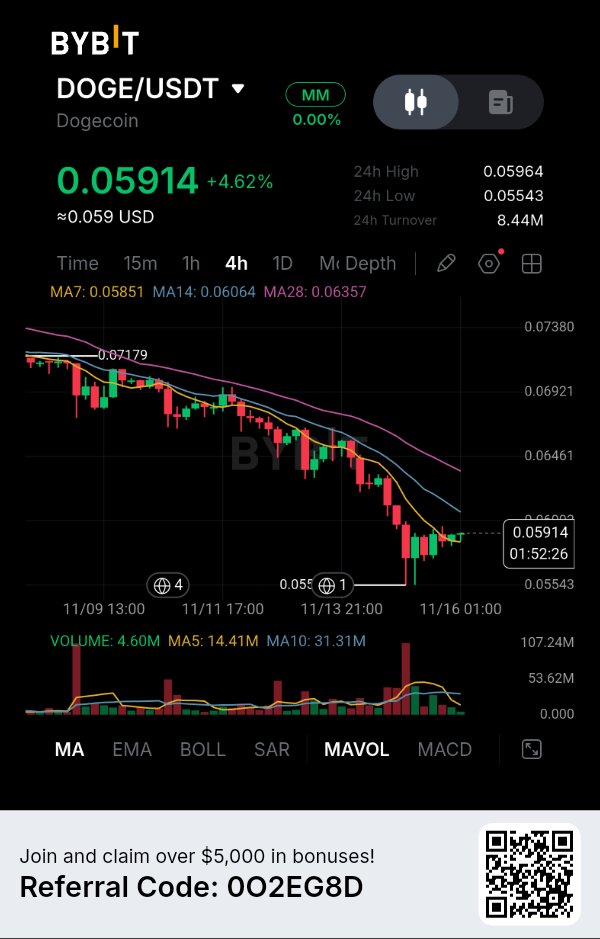
$DOGEUSDT — Dogecoin Is Recovering, But the Bigger Trend Has Not Changed Yet. Dogecoin has gained 4.62% in your 4H screenshot, but I am not convinced that buyers have regained control. The interesting part is that DOGE has bounced from its recent low while remaining below two important moving averages. At the same time, something is changing behind the project: developers are working to give DOGE more practical uses through an application ecosystem. This creates an interesting contrast between improving utility and a technically weak market structure. MARKET DATA — BYBIT 4H CHART According to your chart: * Price: $0.05914 * 24H change: +4.62% * 24H high: $0.05964 * 24H low: $0.05543 * 24H turnover: $8.44M * MA7: $0.05851 * MA14: $0.06064 * MA28: $0.06357 For today's separate market snapshot, November 16, CoinMarketCap reports DOGE around $0.05895, approximately $9.24 billion market capitalization and $1.15 billion in 24H volume. Circulating supply is approximately 156.76 billion DOGE, with no fixed maximum supply. WHAT THE CHART IS REVEALING DOGE has been moving inside a declining structure, falling from the visible $0.07179 region toward $0.05543. Buyers have recently defended the lower area and pushed price back above MA7 at $0.05851. However, MA14 at $0.06064 and MA28 at $0.06357 remain overhead resistance. Another detail deserves attention: displayed volume is 4.60M, compared with MA5 volume of 14.41M and MA10 volume of 31.31M. This suggests the latest recovery has not yet attracted participation comparable to previous trading activity. For me, $0.06064 is the first important level buyers need to reclaim. THE DEVELOPMENT MOST PEOPLE SHOULD WATCH Dogecoin's ecosystem is attempting to move beyond simple transfers and payments. On November 11, DogeOS announced that its first version was developed and audited, with mainnet described as very close, although no confirmed launch date was provided. The project aims to introduce an Ethereum-compatible application layer supporting DeFi, trading, lending and gaming. More than 100 builders are reportedly working on applications. What makes this particularly interesting is that DogeOS intends to use DOGE for transaction fees rather than introducing another native token. However, there is an important limitation: DogeOS is a separate application layer, not a direct upgrade to Dogecoin's base blockchain. Its current security model still relies on selected validators, while a proposed upgrade for native zero-knowledge proof verification has not been approved. THE TOKEN VALUE QUESTION I keep coming back to one issue. If DogeOS successfully attracts developers and applications, DOGE could gain additional utility through transaction fees and application activity. But development completion does not guarantee user adoption. The real evidence will come from actual application usage, transaction demand and the amount of DOGE circulating through these new services. Dogecoin has an established network and substantial liquidity, but its inflationary supply structure also means demand needs to remain relevant over time. MY TRADING PLAN — CONDITIONAL SHORT The broader 4H structure still favors sellers, despite the recent bounce. Trigger: Rejection around $0.0600–$0.0606, followed by a 4H close below $0.0585. Entry: $0.0582–$0.0585. Stop-loss: $0.0600. TP1: $0.0565. TP2: $0.05543. TP3: $0.0535. Using a representative entry of $0.05835: Potential downside to TP3: 8.32%. Defined risk: 2.83%. Estimated risk-to-reward: 2.94:1. This setup is conditional. I would not enter without the resistance rejection and subsequent breakdown. MY FINAL VIEW Dogecoin is entering an interesting development phase. DogeOS could give DOGE additional financial applications, but the market still needs evidence that developers can turn this infrastructure into consistent user activity. I don't think the most important question is whether Dogecoin can attract more attention. It's whether Dogecoin can evolve from an asset people primarily hold and transfer into one they have additional reasons to actively use. That transition could become more important for DOGE's long-term value than another short-lived price recovery. $DOGEUSDT #ByXIMPACT


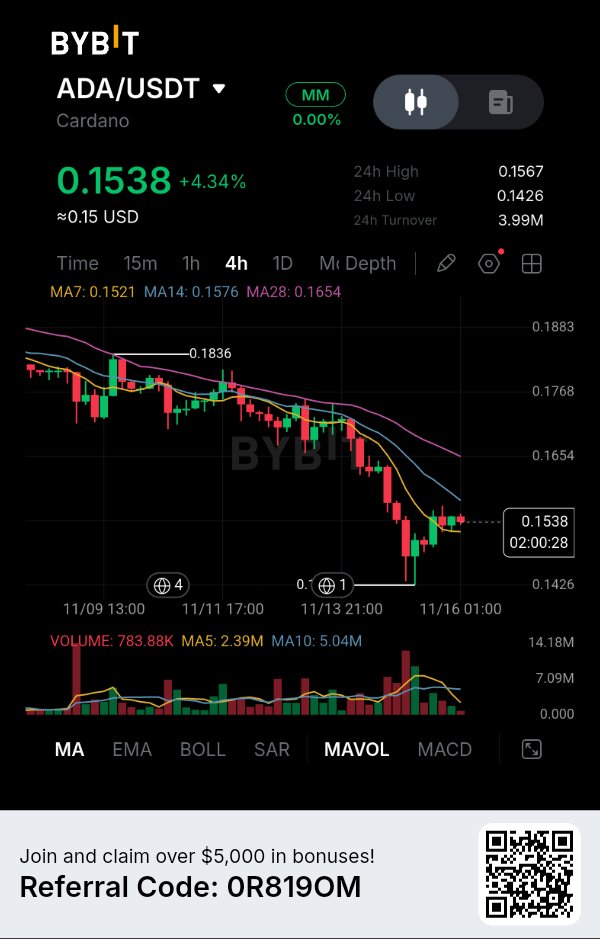
$ADAUSDT — CARDANO HAS REBOUNDED 4.34%, BUT THE REAL TEST IS WHETHER BUYERS CAN RECLAIM $0.1576. I'M NOT CONFUSING A RELIEF BOUNCE WITH A TREND REVERSAL. ADA is finally showing some buying interest after an extended decline. Price has recovered from the $0.1426 region and is now trading around $0.1538. The reaction is encouraging, but one important detail keeps me cautious: buyers have recovered the shortest moving average, yet the larger resistance structure remains overhead. THE TECHNICAL PICTURE The 4H moving averages are telling an interesting story: MA7: $0.1521 MA14: $0.1576 MA28: $0.1654 ADA has reclaimed MA7, showing short-term improvement. However, MA14 and MA28 remain above the current price. The broader structure still favors sellers until buyers demonstrate a stronger recovery. THE DETAIL I'M WATCHING The $0.1426 level is where the latest selling pressure attracted a buying response. But the recovery has one weakness I don't want to ignore. Current volume is approximately 783.88K, compared with MA5 at 2.39M and MA10 at 5.04M. Buying participation remains relatively weak compared with both volume averages. This makes the $0.1576 resistance particularly important. I want to see whether buyers can reclaim it with stronger participation or whether sellers defend it again. MY EXECUTION STRATEGY I'm watching ONE conditional SHORT opportunity. Entry zone: $0.1575–$0.1600 Confirmation: 4H bearish rejection from this region. Stop Loss: $0.1665 TP1: $0.1500 TP2: $0.1426 TP3: $0.1380 (projected extension) I'm not entering immediately after the recovery. I want price to approach resistance and show clear selling pressure before considering this setup. WHAT COULD INVALIDATE MY IDEA? A convincing 4H breakout above $0.1654 would weaken my bearish continuation thesis. If ADA establishes sustained acceptance above $0.1665, I would invalidate this short setup and reassess the market. MY PERSPECTIVE What interests me about ADA is the battle between improving short-term momentum and the still-unrecovered larger trend. Buyers have defended $0.1426, but now they need to prove they can overcome the resistance above them. I'm watching $0.1576 as the next important decision point. I would rather miss an entry than chase a recovery without confirmation. Would you trust this ADA bounce and look for a breakout above $0.1576, or wait for sellers to confirm another rejection? $ADAUSDT #ByXIMPACT


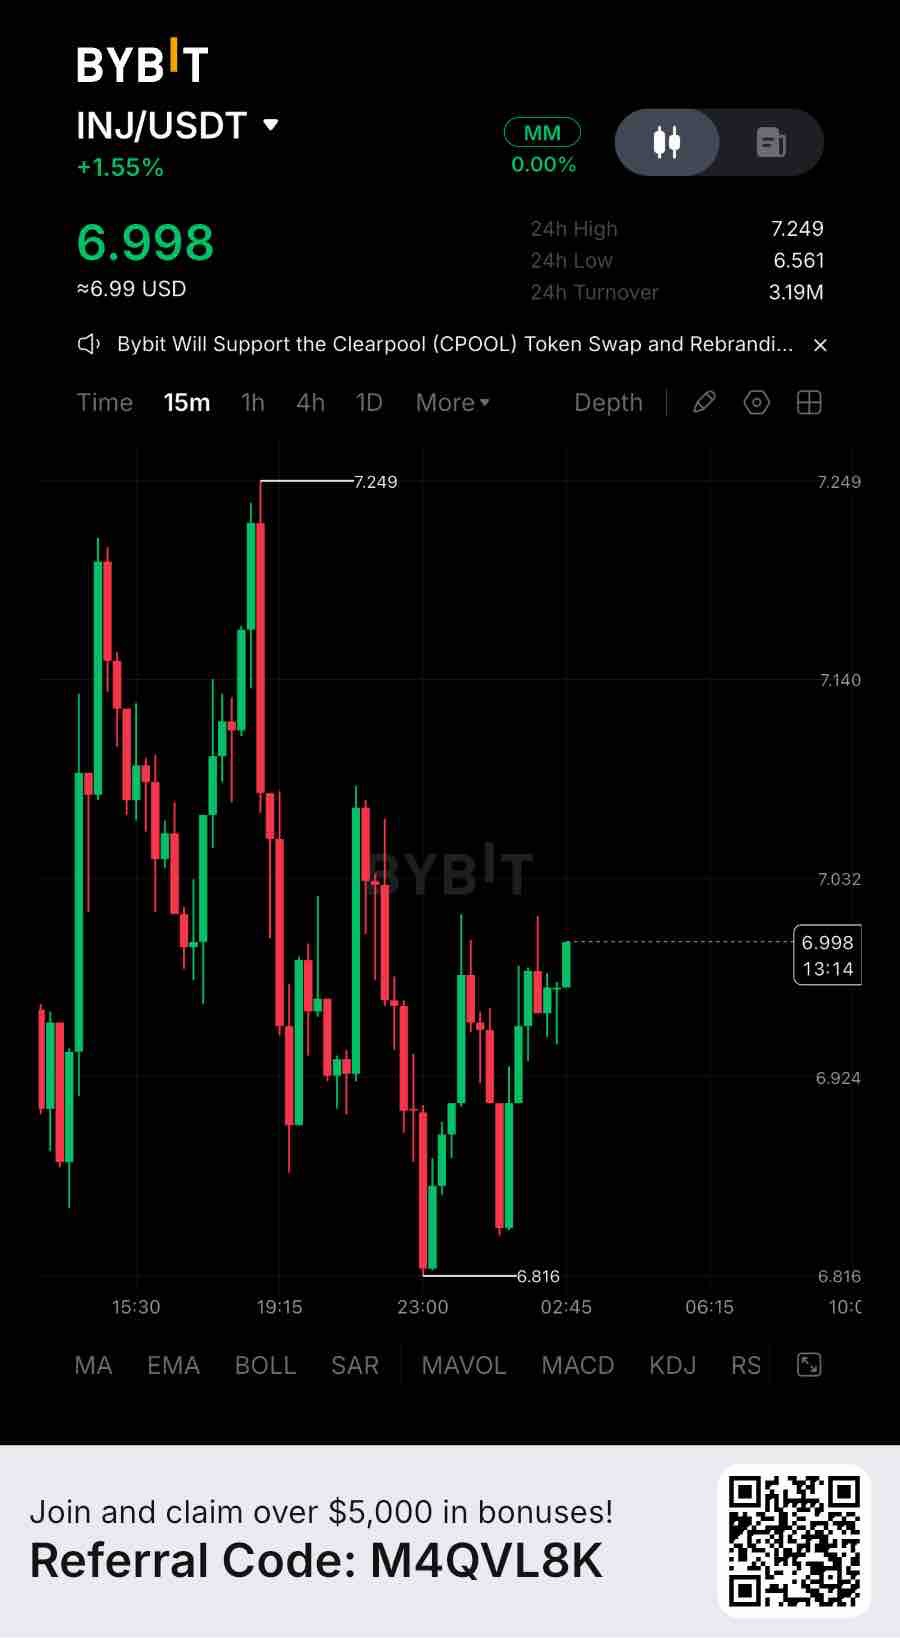
Injective now reports more than $11B in assets issued through its tokenization infrastructure, while its on-chain orderbook processed $12.86B in trading volume between November 2025 and November 2026. RWA perpetuals alone generated nearly $1.8B in volume. That’s real usage, not narrative. But valuation tells a different story. INJ carries a reported circulating market cap of approximately $690M against just $16.36M in DeFi TVL, putting its market-cap-to-TVL multiple around 42.2x. For comparison, Maple trades around 0.052x and Pendle around 0.255x on the same metric. INJ therefore screens roughly 814x richer than Maple and 165x richer than Pendle. These are not perfectly comparable businesses, since Injective is a Layer 1 rather than a standalone yield protocol, but the difference highlights how much future ecosystem growth is already reflected in its valuation. The underlying expansion is meaningful. Tokenized stocks established new monthly volume records from July through October, while RWA perpetuals expanded into equities, foreign exchange, commodities and indices. Pineapple Financial has also migrated more than $1B in residential mortgage records onto Injective, with 2,079 records visible on its public dashboard. Importantly, these mortgage records represent tokenized data infrastructure, not $1B of liquid collateral or traditional mortgage securities. Injective has additionally secured SEC transfer-agent registration and expanded INJ access to Solana. There is also a supply consideration. SEC filings show total INJ supply reached approximately 122.9M by September 15, 2026, against the commonly reported 100M initial supply. Annualized issuance stood at 4.4%. The Supply Squeeze proposal strengthens the deflationary mechanism, but actual supply reduction still depends on ecosystem revenue and buyback activity exceeding issuance. From a market perspective, INJ is trading around $6.89. Immediate support sits near $6.44, with resistance around $7.15. I would avoid chasing the current movement without confirmation. A 4H close above $7.15 followed by a successful retest could open $7.85 and eventually $8.76. However, losing $6.44 on a confirmed 4H breakdown would weaken the structure and expose $6.01, followed by $5.18. The short-term trend remains under pressure despite stronger higher-timeframe momentum. None of this says the token is wrong. It says the on-chain growth story and the price story are running on separate clocks right now. Worth asking which one catches up to the other first — and whether more chains, institutional products and tokenized assets alone are enough to close a valuation gap that size. #ByXIMPACT $INJUSDT


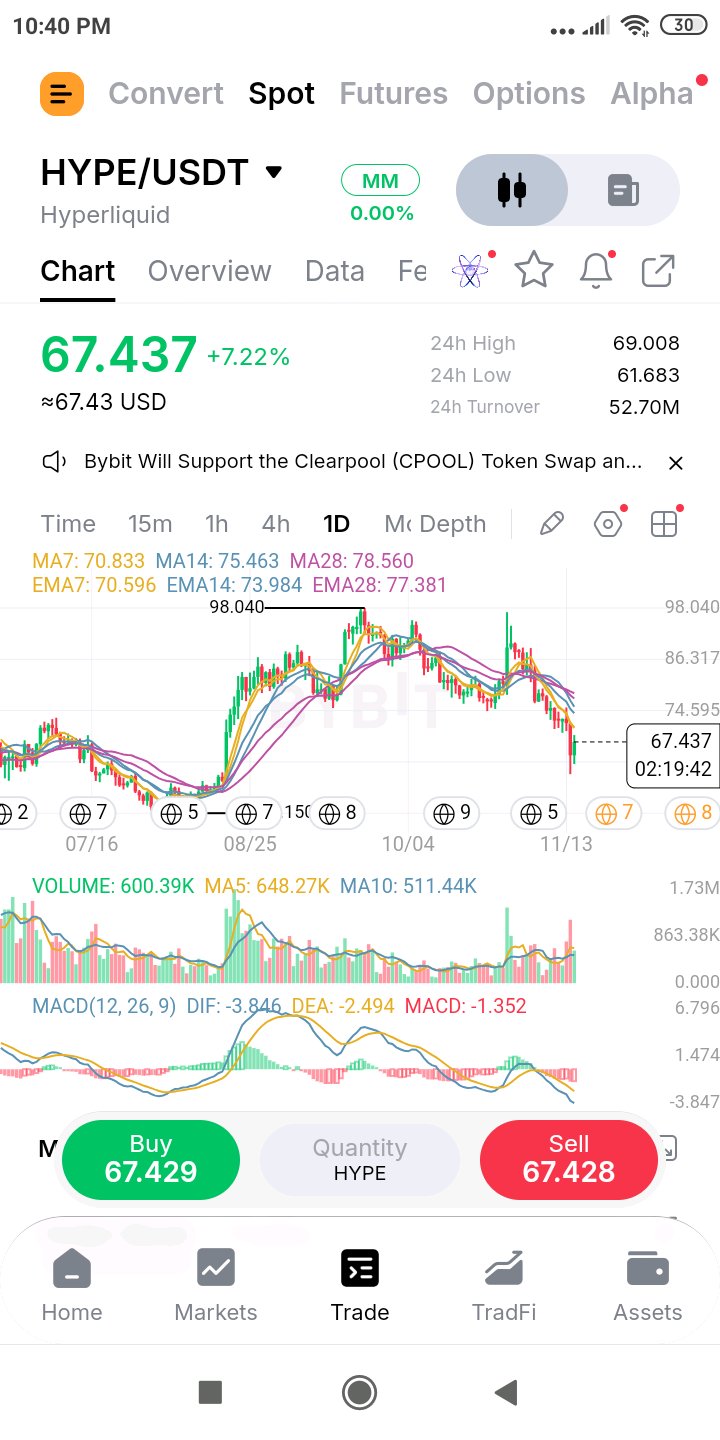
$HYPEUSDT bounced 9% off a low that held just above the 0.786 and stalled 0.05 under the broken 0.618, so now the retest decides. Context HYPE wicked to 61.683, only 0.5 above the 0.786 retracement at 61.18, then rallied to a 69.008 high, 0.05 short of the broken 0.618 at 69.06, and trades at 67.437 (+7.22% on the rolling 24h). That is about 31% under the 98.04 peak, with roughly 65% of the advance from 51.15 retraced. All six averages are still overhead: EMA7 70.596, MA7 70.833, EMA14 73.984, MA14 75.463, EMA28 77.381 and MA28 78.560, with the 7s 4.7-5% above price, the 14s 10-12% and the 28s 15-16%. MACD (DIF -3.846, DEA -2.494, histogram -1.352) is at its lowest reading on this chart, so momentum hasn't turned. The daily candle is green so far, with a long lower wick. Turnover and volume 24h turnover is 52.70M USDT (roughly 800K HYPE) on a 24h range of 61.683 to 69.008, about 12%. That rolling total is about 1.6x the 10-day average, mostly from the heavy selling earlier in the window. Today's own candle is 600.39K with about 2.3 hours left, on pace for roughly 665K, in line with the 5-day (648.27K) and above the 10-day (511.44K). So the bounce is on ordinary volume, not a surge. Holding a key fib and bouncing is good, but a bounce that can't take the broken 0.618 on a strong day is not yet a reversal. Support and resistance Support: 61.68 (24h low), 61.18 (0.786), 60.00 (round number), then the 51.15 base. Resistance: 69.01 (24h high), 69.06 (the broken 0.618), 70.00 (round number), 70.60-70.83 (EMA7 and MA7), 73.98 (EMA14), 74.595 (0.5), 75.46 (MA14), 77.38-78.56 (the 28s), 80.13 (0.382), 86.97 (0.236), then 97-98.04. Level to watch 61.18 below and 69.06-70.00 above. A daily close above 70.9 clears the 0.618, the 70 round number and both 7s in one move. A daily close under 61.18 gives up the 0.786 zone. Consideration Retesting a broken level from below is where downtrends often fail, and this one stalled by a few cents. The 7s sit right above it at 70.6-70.8, so there is a stacked ceiling within about 2.5 points. I'd treat the 9% bounce as a reaction at support, not a trend change, until a daily close clears 70.9. Trade plan Low retest: buy 61.7-63.0 (the sweep zone and the 0.786), stop under 59.9, about 2.4 of risk from 62.3. Targets are 69.06 and 74.6, roughly 2.8R and 5.1R. Reclaim: wait for a daily close above 70.9, buy the retest of 70.0-70.9, stop under 68.3, about 2.2 of risk from 70.5. Targets are 74.6 and 80.13, roughly 1.9R and 4.4R. I'm not buying 67.4 under the 0.618 and the 70 round number. A stop under 61.2 would risk about 6.2 to make about 1.6 to the 0.618 and 3.2 to the 7s, about half an R at best. Invalid if A daily close under 61.18 gives up the 0.786 zone, with 51.15 next, about 16% lower, and I'd stand aside rather than average down. The low-retest idea is dead under 59.9, and the reclaim idea is dead on a daily close back under 68.3. The bear case stays in charge until a daily close above 75.5, the MA14. Risk note HYPE has been ranging around 10-12% a day lately, so cut size and use limit orders. Today's candle still has about 2 hours left, so volume and price will shift by the close. Fib levels are zones, not guarantees. Levels are read off my chart. Idea only, not financial advice. Reversal or a retest that fails? A daily close above 70.9 or under 61.18 will say. #ByXIMPACT
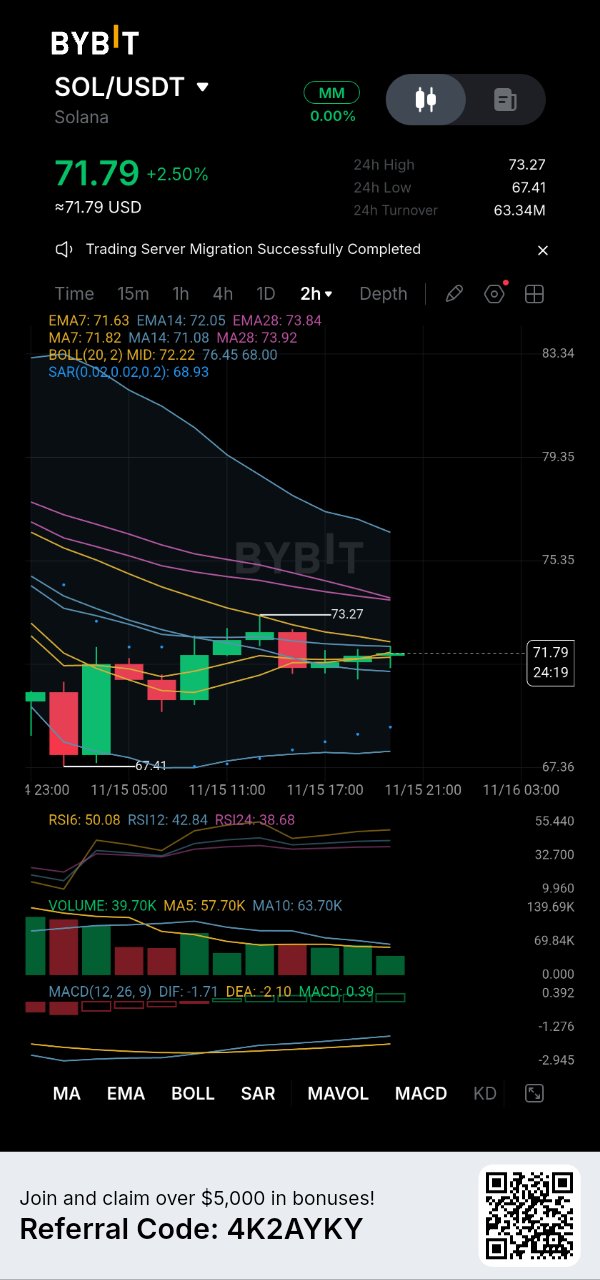
SOL is trading around $71.79, up 2.50% on the 2H chart, after recovering from the $67.41 low. What interests me is not the rebound itself, but whether buyers can turn this recovery into a more sustainable structure. There are some early improvements. RSI6 has returned to 50.08, and the MACD histogram has moved into positive territory at 0.39. Price is also holding near the short-term moving averages. However, the recovery still faces obstacles. The Bollinger midline around $72.22 and EMA14 near $72.05 form the first resistance zone. Above that, $73.27 is the recent local high, while the EMA28 around $73.84 remains another hurdle. Volume is the main caution: approximately 39.7K, below both the MA5 at 57.7K and MA10 at 63.7K. The price is recovering, but participation has not yet strengthened enough to confirm the move. My levels are straightforward: - Above $72.22: recovery gains credibility. - Above $73.27: buyers have a stronger case for continuation. - Below $71: momentum could weaken again. - Below $67.41: the current recovery structure would be invalidated. I would rather see SOL reclaim resistance with stronger volume than assume that one green move has changed the trend. The next few 2H candles should tell us more. Is SOL building a genuine recovery, or does it still need a deeper test of support? Not financial advice. $SOLUSDT $AAVEUSDT #ByXIMPACT

#QNT #Quant #CryptoAnalysis #MDFUNDS
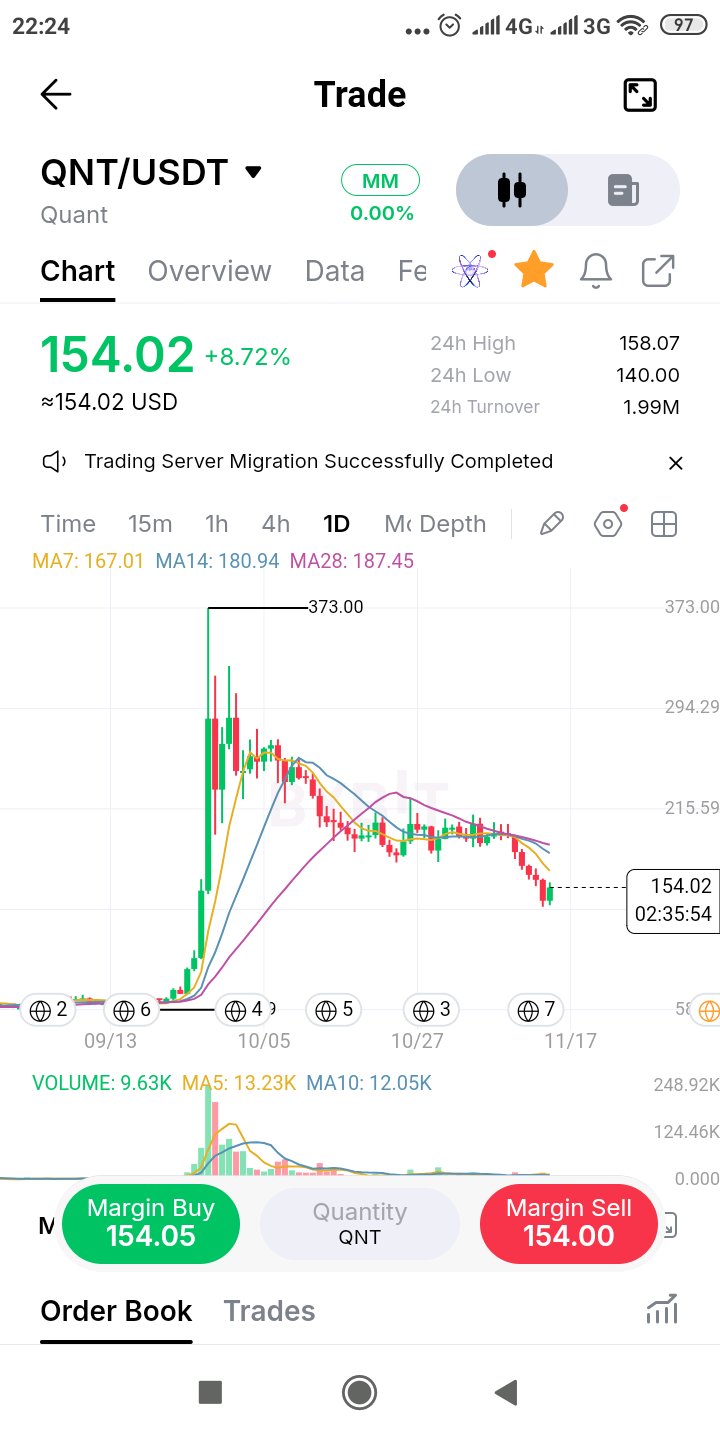
$QNTUSDT — A relief rally is not yet a trend reversal QNT has bounced sharply from the $140 region, gaining 8.72% and reaching an intraday high of $158.07. That reaction is significant, but I wouldn't rush to interpret it as a bullish structural shift. Look at the bigger picture. Since its explosive expansion towards $373, QNT has progressively surrendered its gains. The market moved through an extended distribution and declining phase, attempted to stabilise around the $200 region, and has now experienced another leg lower. Today's rebound shows that buyers are responding to lower prices. What remains uncertain is whether that demand is strong enough to reverse the prevailing structure. The moving averages provide an important perspective: MA7: $167.01 MA14: $180.94 MA28: $187.45 Price remains beneath all three. This means the current recovery is still happening below the market's major daily trend references. I'm particularly interested in three price areas: $140: The immediate downside reference established by the latest daily low. $158–$167: The first recovery challenge. Holding above this region and reclaiming the MA7 would improve the short-term picture. $180–$187: A more substantial recovery zone where the next two moving averages converge. Volume also deserves attention. The displayed 9.63K remains below both the MA5 and MA10 volume averages. Until participation improves, the rebound needs to prove itself. There is a lesson here from Dow Theory: a meaningful reversal requires more than a strong green candle. The market must begin establishing a different sequence of highs and lows. My question: Are buyers beginning to defend QNT at $140, or are we simply witnessing a temporary relief rally inside a larger bearish structure? $QNTUSDT #ByXIMPACT

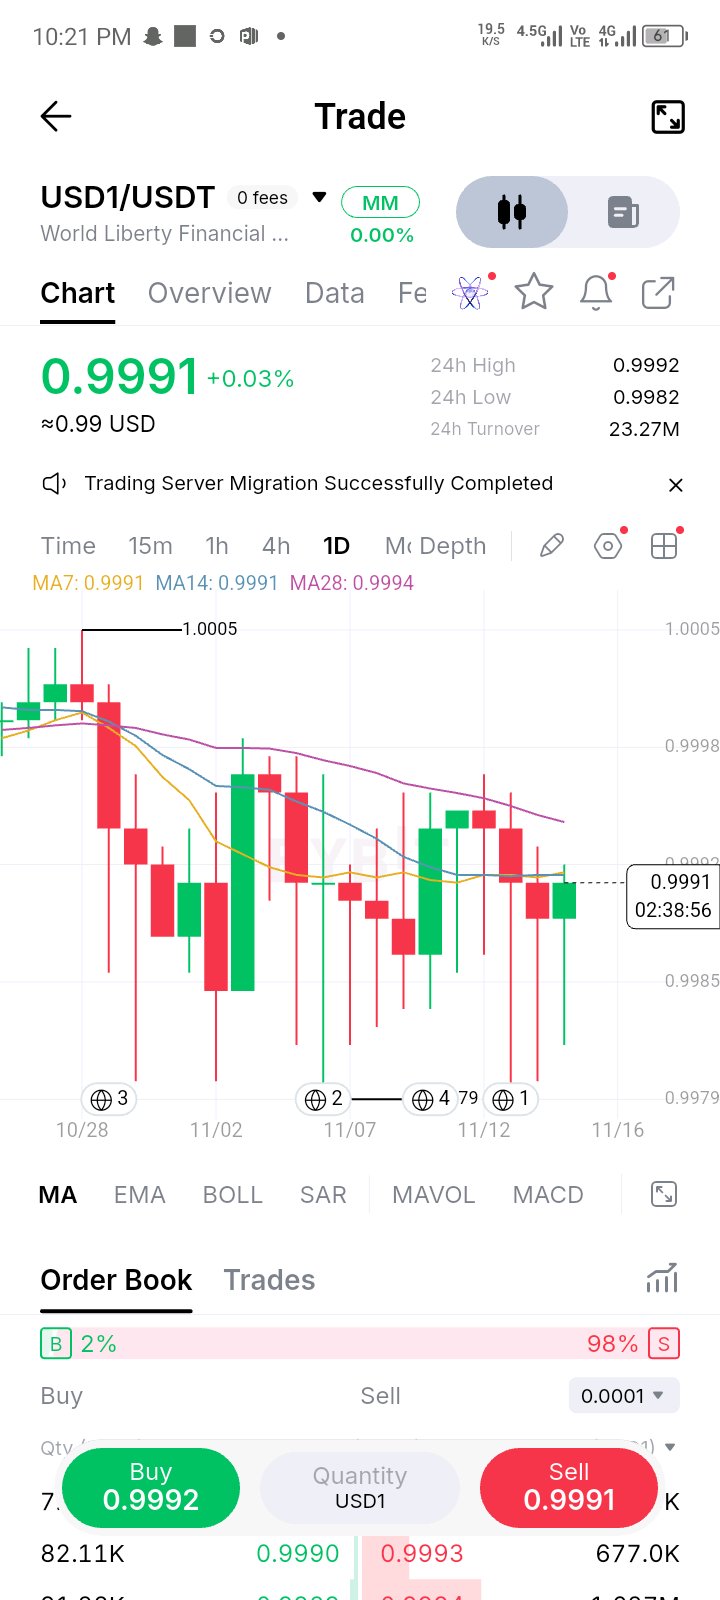
USD1 KEEPS DIPPING TO 0.998 AGAINST USDT AND GETTING BOUGHT. THE CLOSES NEVER LEAVE THE BAND On the daily, $USD1 has spent three weeks just under par against USDT, with closes mostly between about 0.9985 and 0.9998. Today it's at 0.9991, and the 7, 14 and 28 MAs are stacked at 0.9991-0.9994, so the average and the price are basically the same thing. The action is in the wicks. Several candles have stabbed down toward 0.998 and been bought back within the day, with the lowest print on this chart at 0.9979. Buyers have defended that area every time, and sellers haven't managed a close under it. The only trip above 1.0000 was a single wick to 1.0005 in late October. This is a spread, not a trade, so there's no entry to hunt. What I'd watch is a daily close under 0.9979, because that's the one outcome this three-week range hasn't produced. Anything inside it is noise. Which do you trust more on a stablecoin: how it closes, or how fast the wicks get bought? $USD1USDT$NOTUSDT #ByXIMPACT

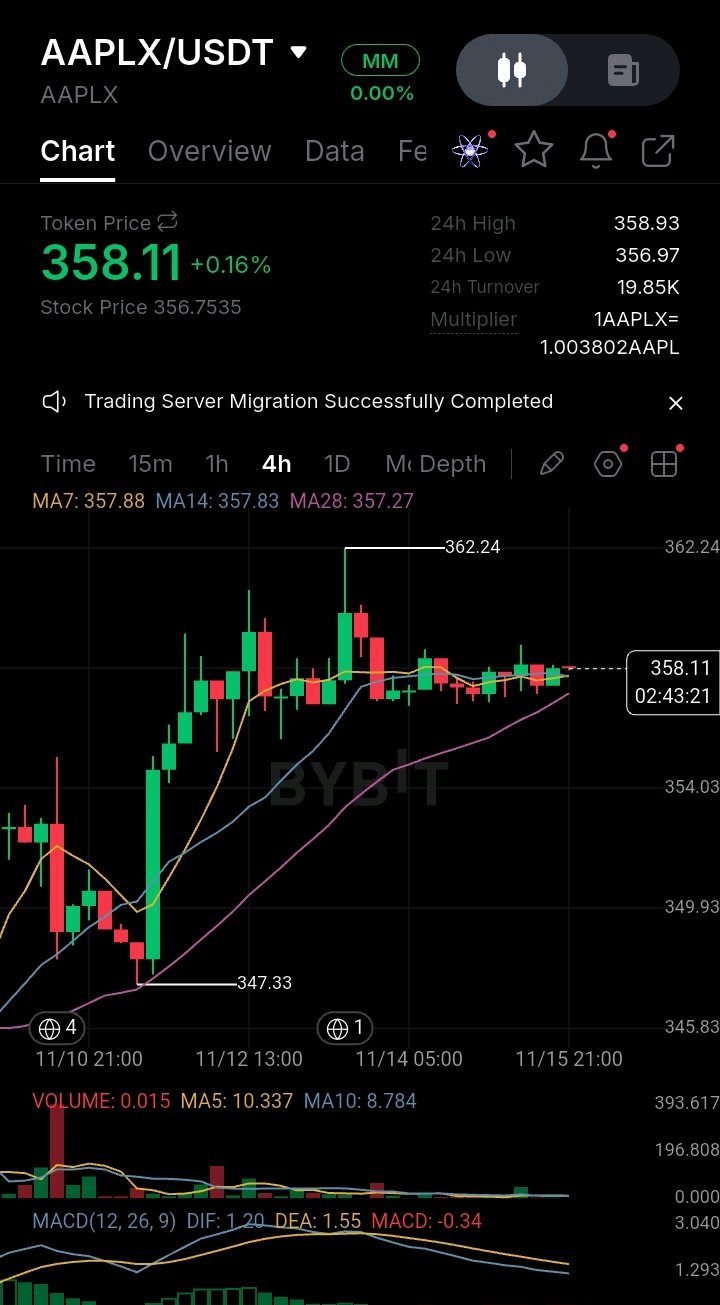
🔍 Market Analysis: $AAPLXUSDT | Apple Holds Above Key Moving Averages as Buyers Defend Consolidation (4H Chart) AAPLX is maintaining a relatively stable structure around $358.11 following a strong recovery from the $347.33 region, with buyers continuing to defend the recent consolidation. The token is currently trading at $358.11, up 0.16% over 24 hours. Although price remains below the recent $362.24 high, its position above all three moving averages suggests that the broader recovery structure remains constructive. Technical Analysis: The 4H structure remains cautiously bullish, with price trading above all three moving averages: MA7: $357.88 MA14: $357.83 MA28: $357.27 The moving averages maintain a bullish arrangement, with MA7 slightly above MA14 and both positioned above MA28. This suggests that buyers retain a slight advantage, although the relatively narrow separation between the averages indicates consolidation rather than strong directional momentum. MACD shows weakening bullish momentum. DIF stands at 1.20 against DEA at 1.55, with a histogram of -0.34. DIF remains below DEA, indicating that immediate bullish momentum has weakened. However, both lines remain above zero, suggesting that the broader recovery structure has not yet turned decisively bearish. Current volume is 0.015, significantly below MA5 of 10.337 and MA10 of 8.784. This suggests limited trading participation during the latest consolidation, with buyers yet to demonstrate strong volume confirmation. Fundamental & News: Apple reported strong fiscal Q4 2026 financial results, with quarterly revenue reaching $114.5 billion, representing 12% year-over-year growth. Diluted earnings per share increased 14% to $2.10, while Services revenue reached a new all-time high. Additionally, Apple launched its new HomeView smart-home device on November 13, priced at $299. The device combines a 7-inch display, smart-home management and Apple Intelligence with Siri AI. These developments highlight continued strength in Apple's hardware and services businesses, alongside its expansion into AI-powered consumer products. This provides constructive fundamental support, although the current technical structure still requires stronger buying participation before another bullish breakout can be confirmed. Market Outlook: Bullish: Holding $356.97 and breaking above $358.93 with stronger volume could open a recovery toward $362.24. Bearish: A confirmed 4H breakdown below $356.97 could weaken the current consolidation structure and expose further downside. Invalidation: A sustained 4H breakdown below $356.97 would invalidate the immediate bullish recovery setup. The key question is whether buyers can generate enough momentum to break above $362.24, or whether weakening MACD momentum will keep Apple trapped in its current consolidation range. ⚠️ Educational analysis only. Not financial advice. #ByXIMPACT

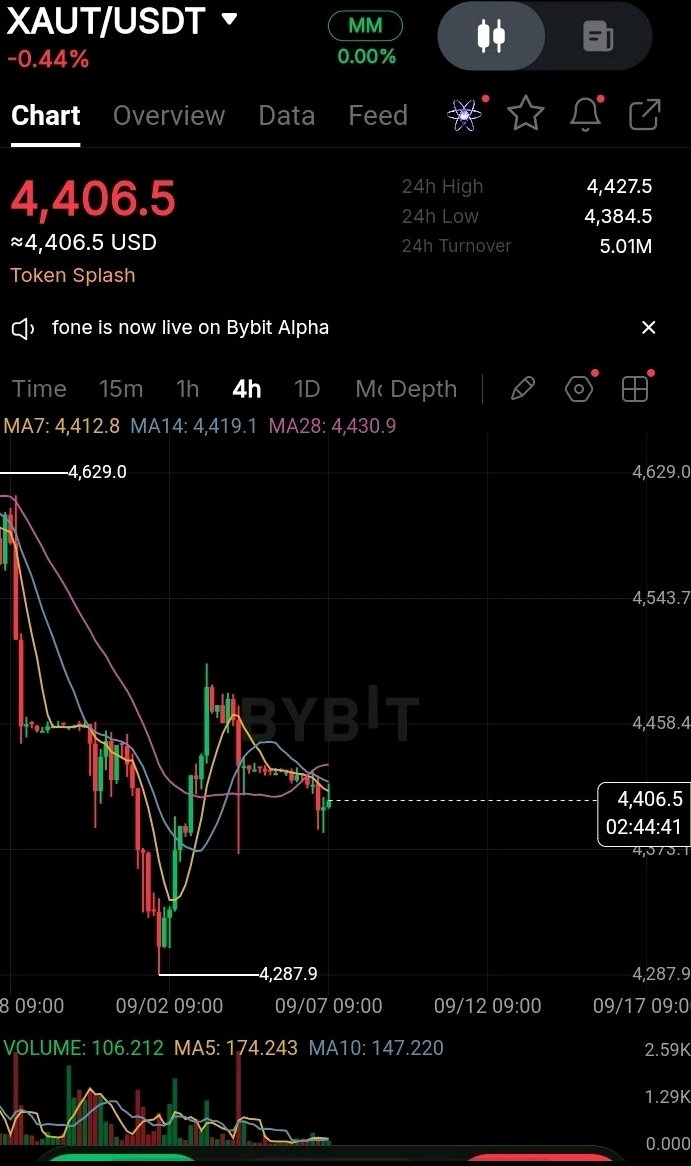
Gold is in an interesting position right now because the macro story is still supportive, but the chart is asking for confirmation. 👀 XAUT/USDT is sitting around $4,426.8, almost flat at -0.02%, with a very tight 24h range between $4,423.1 and $4,430.4. Turnover is currently around $2.30M. The bigger move came earlier from the $4,287.9 swing low, where buyers stepped in and pushed XAUT back toward the $4,480 area. Since then, however, momentum has cooled and price is compressing around $4,426. That hesitation makes sense from the macro side. The latest U.S. jobs data was stronger than expected, increasing expectations for a possible Fed rate hike and putting pressure on gold through higher yields and a stronger dollar. But the longer-term gold story hasn't disappeared. Central-bank demand remains a major structural support, with Goldman Sachs expecting average central-bank purchases of around 50 tonnes per month in 2026 and forecasting gold around $4,900 by year-end. 🧠 That creates the interesting conflict: Macro conditions are creating short-term pressure, while structural demand is still giving gold a reason to recover. Now the chart needs to decide which side wins. On the 4H: MA7: $4,426.4 MA14: $4,435.4 MA28: $4,413.3 Price is sitting almost directly on MA7, below MA14 but above MA28. That tells me the recovery hasn't completely broken, but buyers haven't regained full control either. For me, $4,435–$4,450 is the first area bulls need to reclaim. If XAUT breaks through there with volume, the next serious test is around $4,480, followed by the psychological $4,500 area. But if price loses $4,413, the recovery starts looking weaker, with $4,350 and eventually the $4,287.9 swing low becoming important again. The interesting part is the volume: current volume is only 24.148, below the MA5 at 45.289 and MA10 at 137.923. So I'm not treating this compression as a breakout yet. Gold has thes fundamental story. Now I want to see whether buyers can make the chart agree. 🔎 Does XAUT reclaim $4,450 next, or does this low-volume recovery eventually retest $4,350? #ByXIMPACT $XAUTUSDT


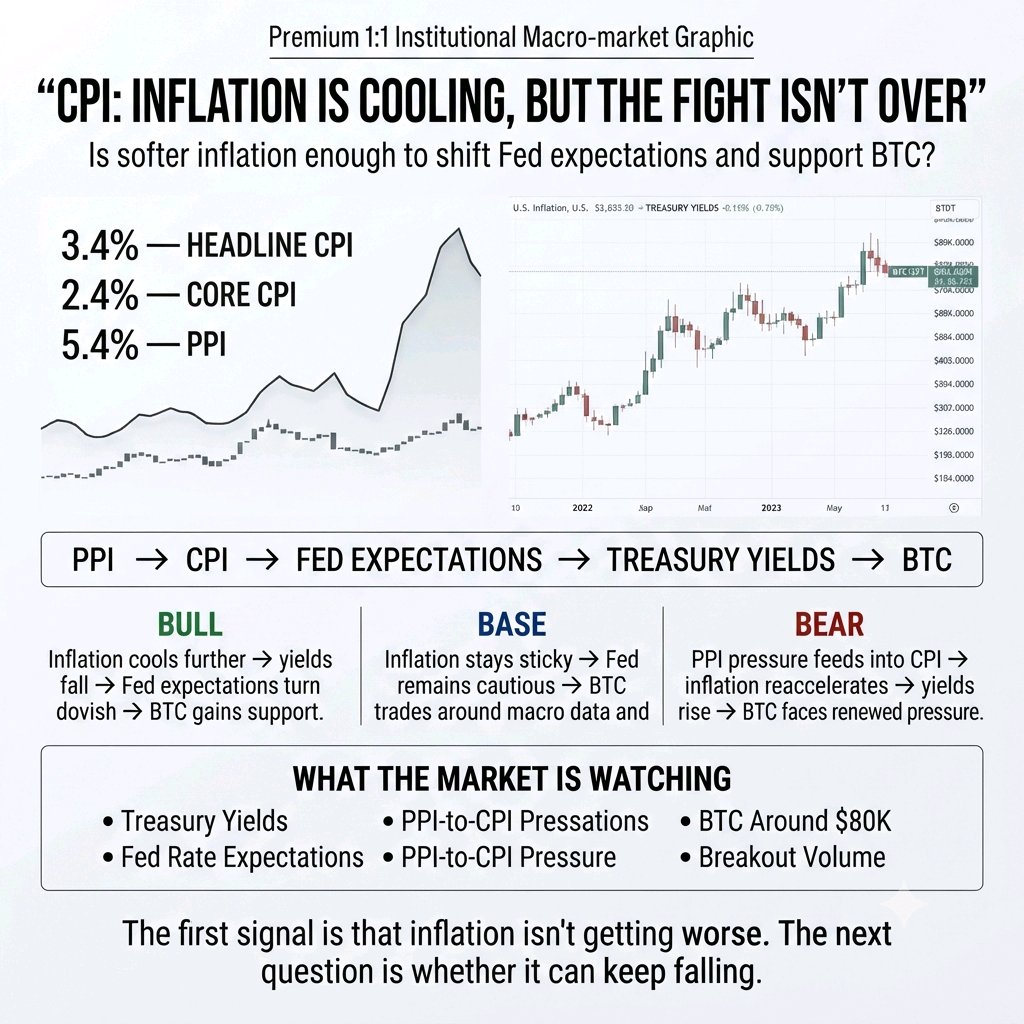
CPI: Inflation Remains a Major Market Risk
The latest CPI report reduced fears of another inflation shock, but it didn't remove the problem. Headline CPI came in at 3.4% YoY, while Core CPI stood at 2.4%. Both were not hotter than expected, giving risk assets some relief and helping BTC move higher. But the bigger signal may be coming from PPI. Yesterday’s PPI came in at 5.4% YoY, showing that producer-level price pressure remains elevated. If those costs continue moving through the economy, CPI could remain sticky for longer. That creates three possible outcomes: Bull case: Inflation keeps cooling → Treasury yields fall → Fed expectations turn more dovish → BTC and risk assets gain support. Base case: Inflation stays sticky → Fed remains cautious → markets continue reacting to every macro release. Bear case: PPI pressure feeds into CPI → inflation reaccelerates → rate-cut expectations weaken → yields rise → BTC faces renewed pressure. Market takeaway CPI gave the market relief, not certainty. I'm watching: • Treasury yields • Fed rate expectations • PPI-to-CPI pressure • BTC reaction around $80K • Volume behind any breakout The real risk isn't one hot CPI print. It's inflation staying high enough to keep the Fed restrictive for longer. #ByXIMPACT $BTCUSDT $HYPEUSDT

Gold just lost more than 3% but the interesting part isn't the drop itself. XAU/USD extended Friday’s Jackson Hole selloff into Monday, briefly slipping below $4,400 and touching around $4,396 as markets repriced the Fed path after Kevin Warsh’s hawkish inflation comments. September rate-hike odds have moved toward roughly 58–60%, while the dollar remains near a two-week high. That changes the short-term gold equation. For weeks, the trade was simple: weaker dollar + easier Fed expectations = stronger gold. Now we're seeing the inverse. Higher yields are increasing the opportunity cost of holding a non-yielding asset, while the stronger dollar adds another layer of pressure. At the same time, geopolitical risk is sending oil above $90, creating an unusual problem for gold bulls: safe-haven demand supports gold, but higher energy prices can reinforce inflation and keep the Fed hawkish. Technically, $4,467 is the level I'm watching. Gold is trading below that area after losing the 200-day average, with $4,408 acting as the immediate downside pivot. A failure to reclaim $4,467–$4,511 keeps the short-term structure bearish. My setup: Bearish: rejection around $4,450–$4,500 → target $4,408, then $4,368–$4,350 over the coming days. Bullish: reclaim and hold above $4,511 → the bearish repricing starts losing credibility, opening a move back toward $4,540–$4,580. Invalidation: sustained reclaim above $4,600. The real catalyst now isn't another Fed speech. It's the US jobs report. If employment weakens enough to unwind September hike expectations, gold could reverse aggressively. If the data keeps the Fed hawkish, that $4,400 shelf may not hold. Gold isn't necessarily bearish long term. The market is simply repricing the cost of owning it right now.. $XAUTUSDT #ByXIMPACT


NVIDIA xStock ($NVDAXUSDT) trades at $164.62 (+3.72%) on the 6h chart, experiencing a strong relief bounce after testing local support floors near the $156.70 low, backed by 1.39M in 24h turnover and a 24h high of $166.52. Fundamental momentum mirrors broader semiconductor sector stabilization while RWA infrastructure maintains secure 1:1 on-chain tracking of NVIDIA Corporation shares. CONTEXT Price is attempting a recovery rally from recent multi-week lows near the $154.26 support cluster toward overhead supply zones below the $220.69 structural peak. NEWS Corporate updates highlight resilient artificial intelligence chip demand and stabilizing semiconductor supply chains, while institutional RWA adoption expands across multi-chain DeFi networks. FUNDAMENTAL Blockchain-native tracker mirroring NVIDIA Corporation shares on a 1:1 basis, backed by audited reserves and institutional custody. ECOSYSTEM Bridges traditional financial equities with decentralized finance protocols for 24/7 cross-chain utility and collateralization. KEY TECHNICAL CONFLUENCE Volume: 24h turnover stands at 1.39M, reflecting active liquidity absorption during the recent bounce from support. Indicators: Price trades at $164.62, reclaiming short-term moving average clusters on the 6h timeframe with RSI recovering toward neutral levels. Fundamentals: Direct equity correlation provides solid macro backing for downside defense. WHAT I LIKE Clean structural defense and reaction holding above multi-week demand floors near $156.70. Seamless 24/7 on-chain exposure to premier artificial intelligence equities. Favorable risk-to-reward parameters for momentum relief plays. WHAT I DON'T LIKE Immediate overhead supply near the $166.52 24h high and $170.86 resistance block capping rapid upside. Subdued alt-market liquidity during broader market macro adjustments. Inherent tracking correlation risks tied to traditional tech sector volatility. MAJOR LEVELS Resistance: $166.52 (24h High) to $170.86 $187.47 to $220.69 (Extension Targets) Support: $156.70 (24h Low) to $154.26 $145.00 (Key Structural Base) Invalidation: Daily close below $130.00 TRADE PLAY Setup: Look for a confirmed 6h volume stabilization above $160.00 or a continuation reclaim of $166.50. Trigger: 6h bullish continuation close above $165.00 with expanding turnover. Entry: $163.50 Stop Loss: $128.50 ($35.00 risk) TP1: $190.00 (0.76R) TP2: $220.00 (1.62R) TP3: $255.00 (2.62R) Risk Disclaimer Cryptocurrency and tokenized commodity trading involves substantial risk of loss and is not suitable for every investor. Valuation volatility is high, and past performance is not indicative of future results. Always manage your position size and employ strict risk management protocols. #ByXIMPACT



$SPCXXUSDT is at $139.13, up 3.63% over 24 hours. SpaceX xStock is recovering, but holding above $140 would provide stronger evidence than a brief weekend push. Chart: A separate aggregate snapshot reports a $133.54–$138.60 daily range. The latest spot quote is above that snapshot’s ceiling, making $138.60 a potential retest reference—not yet confirmed support. News: CNN reports a successful Starship upper-stage catch after its orbital flight, although the booster recovery failed. This supports the reusability story without proving commercial readiness. Source: [CNN] updated November 15, 2026. Fundamentals: Launch economics and Starlink revenue underpin the business case. Repeatable recovery could reduce costs, but one successful test does not establish sustained profitability. Sentiment and narrative: The narrative has shifted toward technical progress. The positive daily move fits that backdrop, though the data does not prove the mission caused the rally. Ecosystem: SPCXX provides tokenized SpaceX equity exposure. Custody, issuer terms and trading liquidity remain separate risks from the company’s operations. Momentum: Reported aggregate 24h traded volume is $6.60M. Rising price is encouraging, but volume alone cannot confirm a durable breakout. Key levels: Support: $138.60 as a retest reference, then $133.54. Resistance: psychological $140, then the $147–$150 reference zone. I want a 2H close above $140 on rising spot volume, followed by a successful retest. Scenarios: Bull: buyers hold above $140 and approach $147–$150. Base: price consolidates around $138.60–$140. Bear: the retest fails, bringing $133.54 back into focus. Considerations: Weekend spreads and separately updated snapshots can exaggerate apparent breakouts. Operational progress is positive; sustained price strength still needs confirmation. Not financial advice. #ByXIMPACT



MAJOR is testing whether buyers can defend the $0.0255–$0.0260 area after sliding to a fresh all-time low. Its Telegram utility story is still active, but thin liquidity and weak momentum leave little room for careless entries. I want a confirmed reclaim, not a blind bottom-fishing trade. MARKET SNAPSHOT MAJOR trades around $0.0262–$0.0267, with a 24-hour range near $0.0255–$0.0284. It is down roughly 11–14% over seven days. Market cap is approximately $2.1–$2.2M, with 83.35M tokens circulating against a 100M maximum. FDV is around $2.6M. Aggregated spot volume ranges from $73K to $540K across different trackers. Bybit lists MAJOR/USDT spot, but its reported 24-hour turnover is only around $64.5K. Reported order-book depth is only about $175 within +2% and $830 within -2%. Even modest orders can move price. This is a thin-liquidity market. TECHNICAL STRUCTURE Daily RSI is near 22, while price sits well below its 20-, 50-, 100- and 200-day averages near $0.0318, $0.0341, $0.0374 and $0.0412. The trend is bearish. Oversold readings can produce a bounce, but they do not confirm a bottom. The immediate demand zone is the recent $0.0255–$0.0257 low. A daily close below $0.0255 would mean fresh downside discovery, with no reliable support underneath. First resistance is $0.0281–$0.0284. Reclaiming this zone and holding the retest would be the first sign of stabilisation. Next barriers are $0.0300 and the 20-day average near $0.0318. A wick is not a breakout. DERIVATIVES: NO FUTURES MARKET Current trackers show no active MAJOR perpetual or delivery-futures market. Open interest is zero or unavailable, and there is no reliable funding, long/short or liquidation data. No derivatives signals should be invented. The available evidence is spot-led. CoinGlass reports about $73K in 24-hour spot volume and net outflow near $1.5K, while broader aggregators show higher turnover due to wider exchange coverage. The key signal is whether spot buyers return and whether the order book can absorb selling. FUNDAMENTAL OUTLOOK Major started as a Telegram rating-based mini-app and expanded into a services platform. Products include an on-chain gift marketplace, NFT number rentals, peer-to-peer escrow, a curated catalog of Telegram channels and mini-apps, and profile or channel verification via Major Business Card. The token has practical platform uses: users can pay for Telegram Stars and Telegram Premium, and MAJOR is connected to selected marketplace services. This adds utility beyond the original game. But utility does not automatically create persistent token demand. The real test is repeat transactions, marketplace activity, paid verification and whether users choose MAJOR over alternative payment methods. The project says Telegram founder Pavel Durov has committed not to sell his one million MAJOR tokens for ten years. That is a confidence signal, not guaranteed price support or liquidity. Verifiable product usage matters more than promotional user totals. TOKENOMICS AND SUPPLY MAJOR has a fixed 100M maximum supply, with approximately 83.35M circulating, or 83.3%. Around 16.65M remain outside reported circulation. This is a higher circulating share than many new launches, reducing dilution pressure relative to low-float tokens. Remaining supply and its release schedule still matter; I could not verify a reliable current cliff-unlock calendar, so no specific upcoming unlock should be assumed. The token is around 98% below its 2024 all-time high, with market cap only a few million dollars. A low price does not automatically mean undervaluation. Small market cap can create sharp percentage moves, but thin liquidity also increases execution risk. BULLISH SCENARIO — RECLAIM AND HOLD I would not buy directly at the recent low. The setup I would consider is a confirmed reclaim of $0.0284 followed by a successful retest, with spot volume expanding and Bybit order-book depth improving. Entry: $0.0284–$0.0288 after breakout and successful retest. Stop-loss: $0.0260. TP1: $0.0300 TP2: $0.0318 TP3: $0.0341 Conditional setup, not a prediction. A daily close below $0.0255 cancels the bullish idea and raises downside-discovery risk. With thin liquidity, use small size and limit orders; stop execution can slip in a fast move. MY TAKE MAJOR has expanded beyond its Telegram game into payments, digital gifts, NFT numbers, escrow and verification. But the token is near its all-time low, spot activity is modest and Bybit depth is thin. There is no futures market to validate a leverage-driven squeeze. The test is whether $0.0255 holds and buyers reclaim $0.0284 with genuine spot participation. Would you wait for that reclaim, or do you think the recent low breaks first? $MAJORUSDT #ByXIMPACT
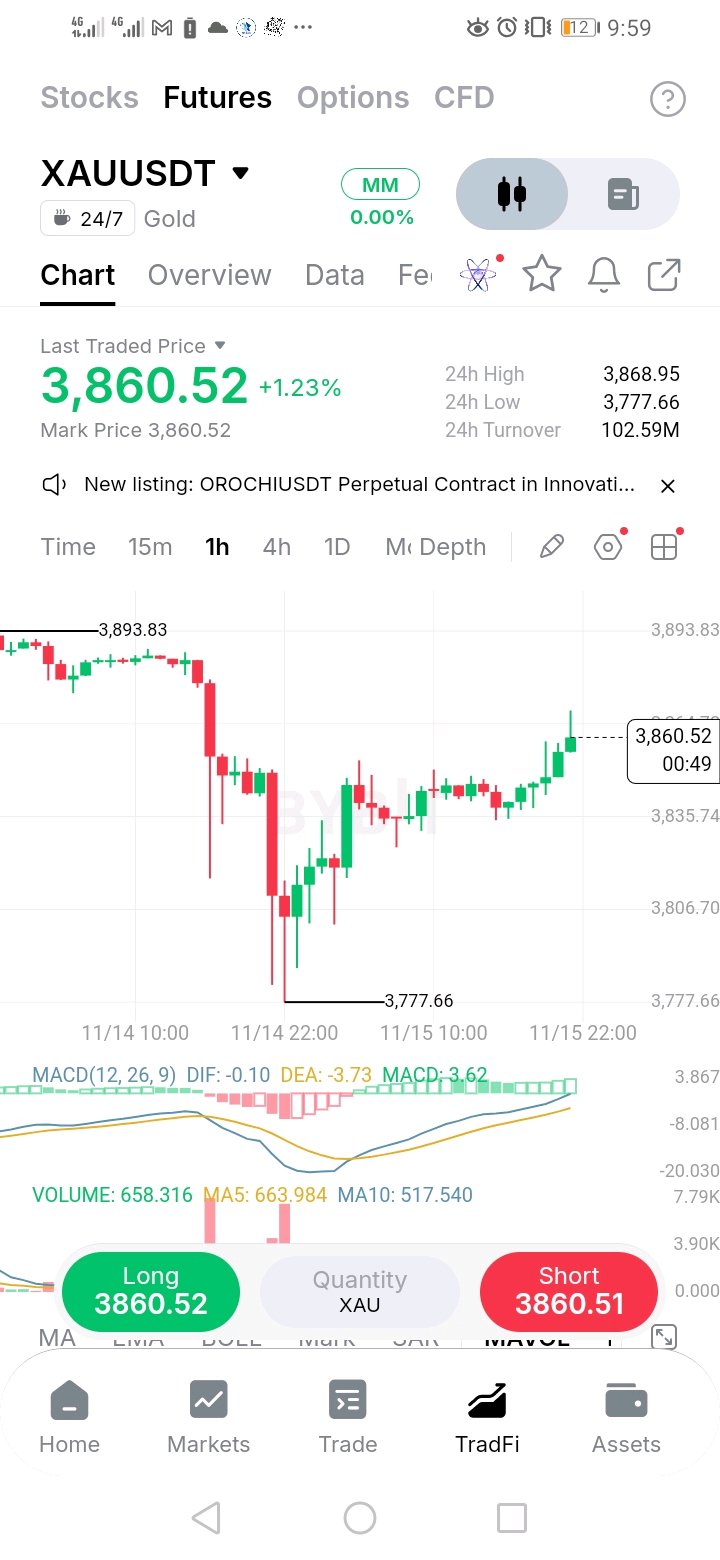
| V-shaped recovery from 3,777 is back at the old 3,860 floor. Sellers defended it before, so this is the test. Gold flushed to 3,777.66 on a heavy-volume drop, then rebuilt in a clean staircase of higher lows: about 3,820, then 3,830, then 3,840. Price is now at 3,860, almost exactly the old floor that broke on Friday, and the last candle printed a small upper wick near 3,868.95 (the 24h high). Broken support often acts as resistance on the first retest, so this is where the move gets decided. MACD has turned up (DIF -0.10, DEA -3.73) and the histogram is positive, so momentum is shifting. But DIF has only just reached zero, so the turn is early. Current volume (658) is in line with its 5-period average (664) and above the 10-period average (518), but the candle is still open, so judge it at the close. Support: 3,835 (higher-low zone), 3,806, 3,777.66 (24h low and flush low) Resistance: 3,860 to 3,869 (old floor and 24h high), 3,894 (swing high) Bullish plan A: buy the pullback (my preferred entry) Entry: 3,842 to 3,836 Stop loss: 3,828 Take profit: 3,860, then 3,869 (about 1.9R and 2.7R) What it means: holding the higher-low zone shows buyers defend the recovery, and the old floor gets retested. Bullish plan B: breakout Trigger: 1H close above 3,869 Entry: retest of 3,865 Stop loss: 3,850 Take profit: 3,894, then 3,920 (about 1.9R and 3.7R) Note: 3,920 is above anything on this chart, so treat it as an estimate. What it means: reclaiming the old floor and the 24h high turns the breakdown into a fake-out, and shorts have to cover. Bearish plan A: sell the rejection Entry: 3,862 to 3,869, if price gets rejected at the old floor Stop loss: 3,885 Take profit: 3,835, then 3,806 (about 1.7R and 3.5R) What it means: broken support turning into resistance confirms the breakdown, and the higher lows get tested. Bearish plan B: recovery fails Trigger: 1H close below 3,835 Entry: retest of 3,837 from below Stop loss: 3,850 Take profit: 3,806, then 3,778 (about 2.4R and 4.5R) What it means: breaking the higher-low staircase sends price back to the flush low. Invalidation: bulls are wrong on a 1H close below 3,835. Bears are wrong above 3,869. Risks - Gold reacts fast to US data, dollar moves and rate news. One headline can ignore every level here. - The bigger trend is still down, and a 1H bounce inside a downtrend has to prove itself. - Weekend trading is usually thinner, and moves can be sharper when traditional markets reopen. - The 1H chart is noisy, so wait for candle closes, not wicks. - Futures carry funding and liquidation risk, so size small and use stops. Recommendation: don't buy into the old floor. Let price come back to the higher-low zone, or wait for a close above 3,869 and trade the retest. If you sell the rejection, use a defined stop. Keep size small. Does 3,860 cap the recovery again, or does gold reclaim it? Not financial advice.#ByXIMPACT $XAUTUSDT $ETHUSDT
CSPR: Spike to 0.002522, Now at 0.001971
$CSPRUSDT — price is 1% under the upper Bollinger band, 0.001991, after a spike far above it. Look at the 24h range: 0.001527 to 0.002522. Price has already given back about 55% of it. Still unresolved: does 0.001991 turn from a ceiling into support? One giant volume bar and a 28% day: what would make you trust a spike like this, a retest, a close, or more volume? 4H, $CSPRUSDT on Bybit, 0.001971, +27.99% over 24h. Macro note Nov 15, 2026: Bitcoin dipped to about 62,081, its weakest level since July, before rebounding above 65,000 (Cointelegraph). Background only, not the reason for this move. What the chart shows Price slid for days to a 24h low of 0.001527. Then one candle spiked to 0.002522, about 65% above that low, and price has since pulled back to 0.001971. The 24h range is 0.000995. Price has given back about 55% of it. The spike high is 28% above the current price. Volume is visible. The spike bar is about 195M by eye, over six times the 31.00M ten-bar average. The current bar is 7.03M against a 53.65M five-bar average, but this candle is only about 22% done (3 hours 7 minutes left), so that comparison is not fair yet. The indicators agree with the bounce, but they come from price, so they are not independent proof. Price is above MA7 (0.001770), MA14 (0.001728) and MA28 (0.001794). MACD has crossed up: DIF -0.000012 is above DEA -0.000058, but both are still below zero. This supports short-term momentum. It does NOT prove a trend change. MA7 is still under MA28, and one spike candle can pull all these lines up. Key levels Support: about 0.00186 (low of this candle so far), then 0.001743 (middle Bollinger band). The 24h low is 0.001527. Resistance: 0.001991 (upper Bollinger band), then 0.002522 (24h high). What would strengthen it Price is under 0.001991, so this is a test, not a break. A touch proves little. I want a 4H close above 0.001991, then a retest that holds as support. A higher low above 0.00186 would help. A close above the band on volume well above the 53.65M average would show real participation. Concern A 4H close under 0.001743 would put price below the middle band and erase most of this bounce. Price was rejected at 0.002522 and has given back 55% of the range since. What changes my mind A 4H close above 0.001991. The lesson One loud candle is not a trend. A trend is a row of closes, each holding above the last. My view My read: this looks like a sharp spike followed by a pullback, not yet a base, so I lean cautious while CSPR stays under 0.001991 on 4H closes. I could be wrong, and a 4H close above 0.001991 would prove me wrong. Take the levels, not my lean. This is a scenario, not a prediction. A reading at posting time, not a guarantee. Do you trust the volume bar or the pullback more here? #ByXIMPACT #WSOT2026 #WSOTShowYourAITradeToEarn10USDT #JensenHuangExitTestsNvidiasAILeadership
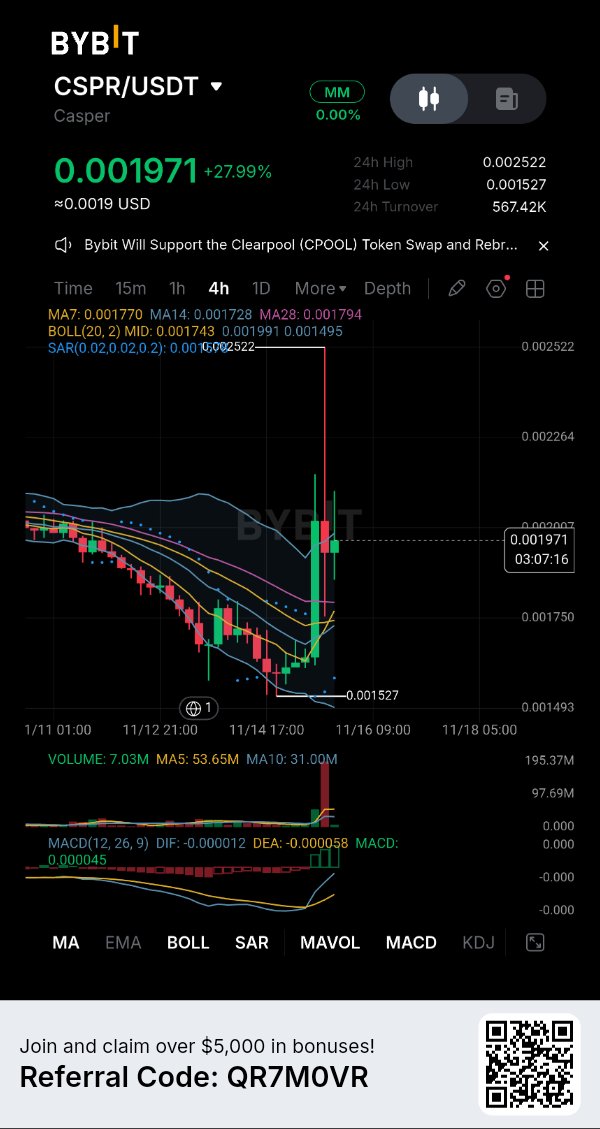

The Gold Is Holding $4,400 But CPI Could Trigger the Next Big Move $XAUT/USDT is trading around $4,400 after falling below the level Monday. Spot gold briefly reached roughly $4,396, extending the pressure from Friday's stronger-than-expected U.S. jobs report. August payrolls rose 162K versus 56K expected, while unemployment held at 4.1%, pushing markets to price around a 60% chance of a September Fed hike. The less-obvious part is how much macro pressure Gold is absorbing without completely breaking down. Higher Treasury yields, rising oil prices and renewed Fed-hike expectations are all working against the metal. But geopolitical risk is simultaneously supporting safe-haven demand, while the dollar has struggled to extend its gains. That leaves Gold caught between two opposing forces. There is also an interesting development specifically for $XAUT. Tether is winding down Alloy and aUSDT while explicitly shifting resources toward products with stronger demand, deeper liquidity and broader long-term opportunity, including XAU₮. Existing aUSDT users have until September 17 to return aUSDT and recover their XAU₮ collateral through the platform. Technically, $4,400 is now the battleground. Bearish: rejection around $4,450–$4,500 → lose $4,400 → targets $4,350, then $4,300. Bullish: reclaim $4,500 and break $4,540 → opens $4,600, then $4,700. Invalidation: sustained acceptance below $4,300 would significantly weaken the current recovery structure. The next major catalyst is U.S. inflation. PPI arrives Thursday and CPI Friday. A hotter inflation print could reinforce the Fed-hike narrative, keep yields elevated and put $4,400 under serious pressure. A softer CPI could reverse some of that hawkish repricing and give Gold room to attack $4,500 again. But here's the important distinction: Gold doesn't need to rally yet. It needs to prove that $4,400 is a real base. I don't want to chase the bounce. I want to see $4,500 turn from resistance into support. Until then, this is still a decision zone not a confirmed reversal. Does Gold reclaim $4,500 into CPI, or does $4,400 finally give way? $XAUTUSDT #ByXIMPACT



ETH/USDT DAILY TECHNICAL OUTLOOK: LOCAL SUPPORT DEFENSE & VOLUME SPIKE PROBING MA7 RECLAIM Ethereum ($ETH$) is printing a modest daily recovery, up +0.43% around 1,827.62 after defending a sharp intraday low of 1,710.47[span_0](start_span)[span_0](end_span). Price action is attempting to stabilize following a steep corrective leg down from the 2,778.20 macro peak[span_1](start_span)[span_1](end_span). • CONSIDERATION: The recent washout to 1,710.47 triggered an aggressive volume expansion (126.34K daily volume vs. 123.01K MA5 baseline)[span_2](start_span)[span_2](end_span), signaling strong short-term buyer absorption at multi-month structural lows. • VOLUME AND TURNOVER: Daily trading volume stands at 126.34K[span_3](start_span)[span_3](end_span), outperforming both the 5-day MA (123.01K) and 10-day MA (110.75K)[span_4](start_span)[span_4](end_span), accompanied by a robust 24-hour turnover of 320.22M USDT[span_5](start_span)[span_5](end_span). • LEVEL TO WATCH: The immediate battleground is anchored around the fast MA7 at 1,970.23 and EMA7 at 1,951.05[span_6](start_span)[span_6](end_span), which represent the first line of dynamic overhead pressure. • SUPPORT AND RESISTANCE: - Support Levels: 1,710.47 (24h Low)[span_7](start_span)[span_7](end_span) and the 3,710.47 historical accumulation zone[span_8](start_span)[span_8](end_span). - Resistance Levels: MA14 at 2,113.48 (EMA14 at 2,062.32) and the macro MA28 at 2,230.32[span_9](start_span)[span_9](end_span). • BULLISH & BEARISH CONFIRMATION: - Bullish Confirmation: A decisive daily close back above the 1,951.05 EMA7 / 1,970.23 MA7 cluster[span_10](start_span)[span_10](end_span) confirms seller exhaustion and opens a clear path toward the 2,113.48 MA14 region[span_11](start_span)[span_11](end_span). - Bearish Confirmation: Failure to hold the 1,710.47 support floor[span_12](start_span)[span_12](end_span) on increasing sell volume invalidates the immediate base-building thesis and exposes deeper liquidity gaps. • TRADE PLAN, INVALIDATION & RISK NOTE: Aggressive traders can look for scalps on reclaims of the local handle with tight stops below 1,710. Invalidation occurs on a high-volume breakdown of the 24h low. Always manage position sizing carefully in high-volatility corrective channels. • KEY FIGURES: - Current Price: 1,827.62 USDT (+0.43%)[span_13](start_span)[span_13](end_span) - 24h High / Low: 1,845.30 / 1,710.47[span_14](start_span)[span_14](end_span) - 24h Turnover: 320.22M USDT[span_15](start_span)[span_15](end_span) - MA Stack: MA7: 1,970.23 | MA14: 2,113.48 | MA28: 2,230.32[span_16](start_span)[span_16](end_span) - EMA Stack: EMA7: 1,951.05 | EMA14: 2,062.32 | EMA28: 2,189.13[span_17](start_span)[span_17](end_span) Are you bidding this 1,820 demand shelf for a mean-reversion bounce toward 2,100, or waiting for a confirmed close past the MA7 line[span_18](start_span)[span_18](end_span)? $ETHUSDT #ByXIMPACT $XRPUSDT
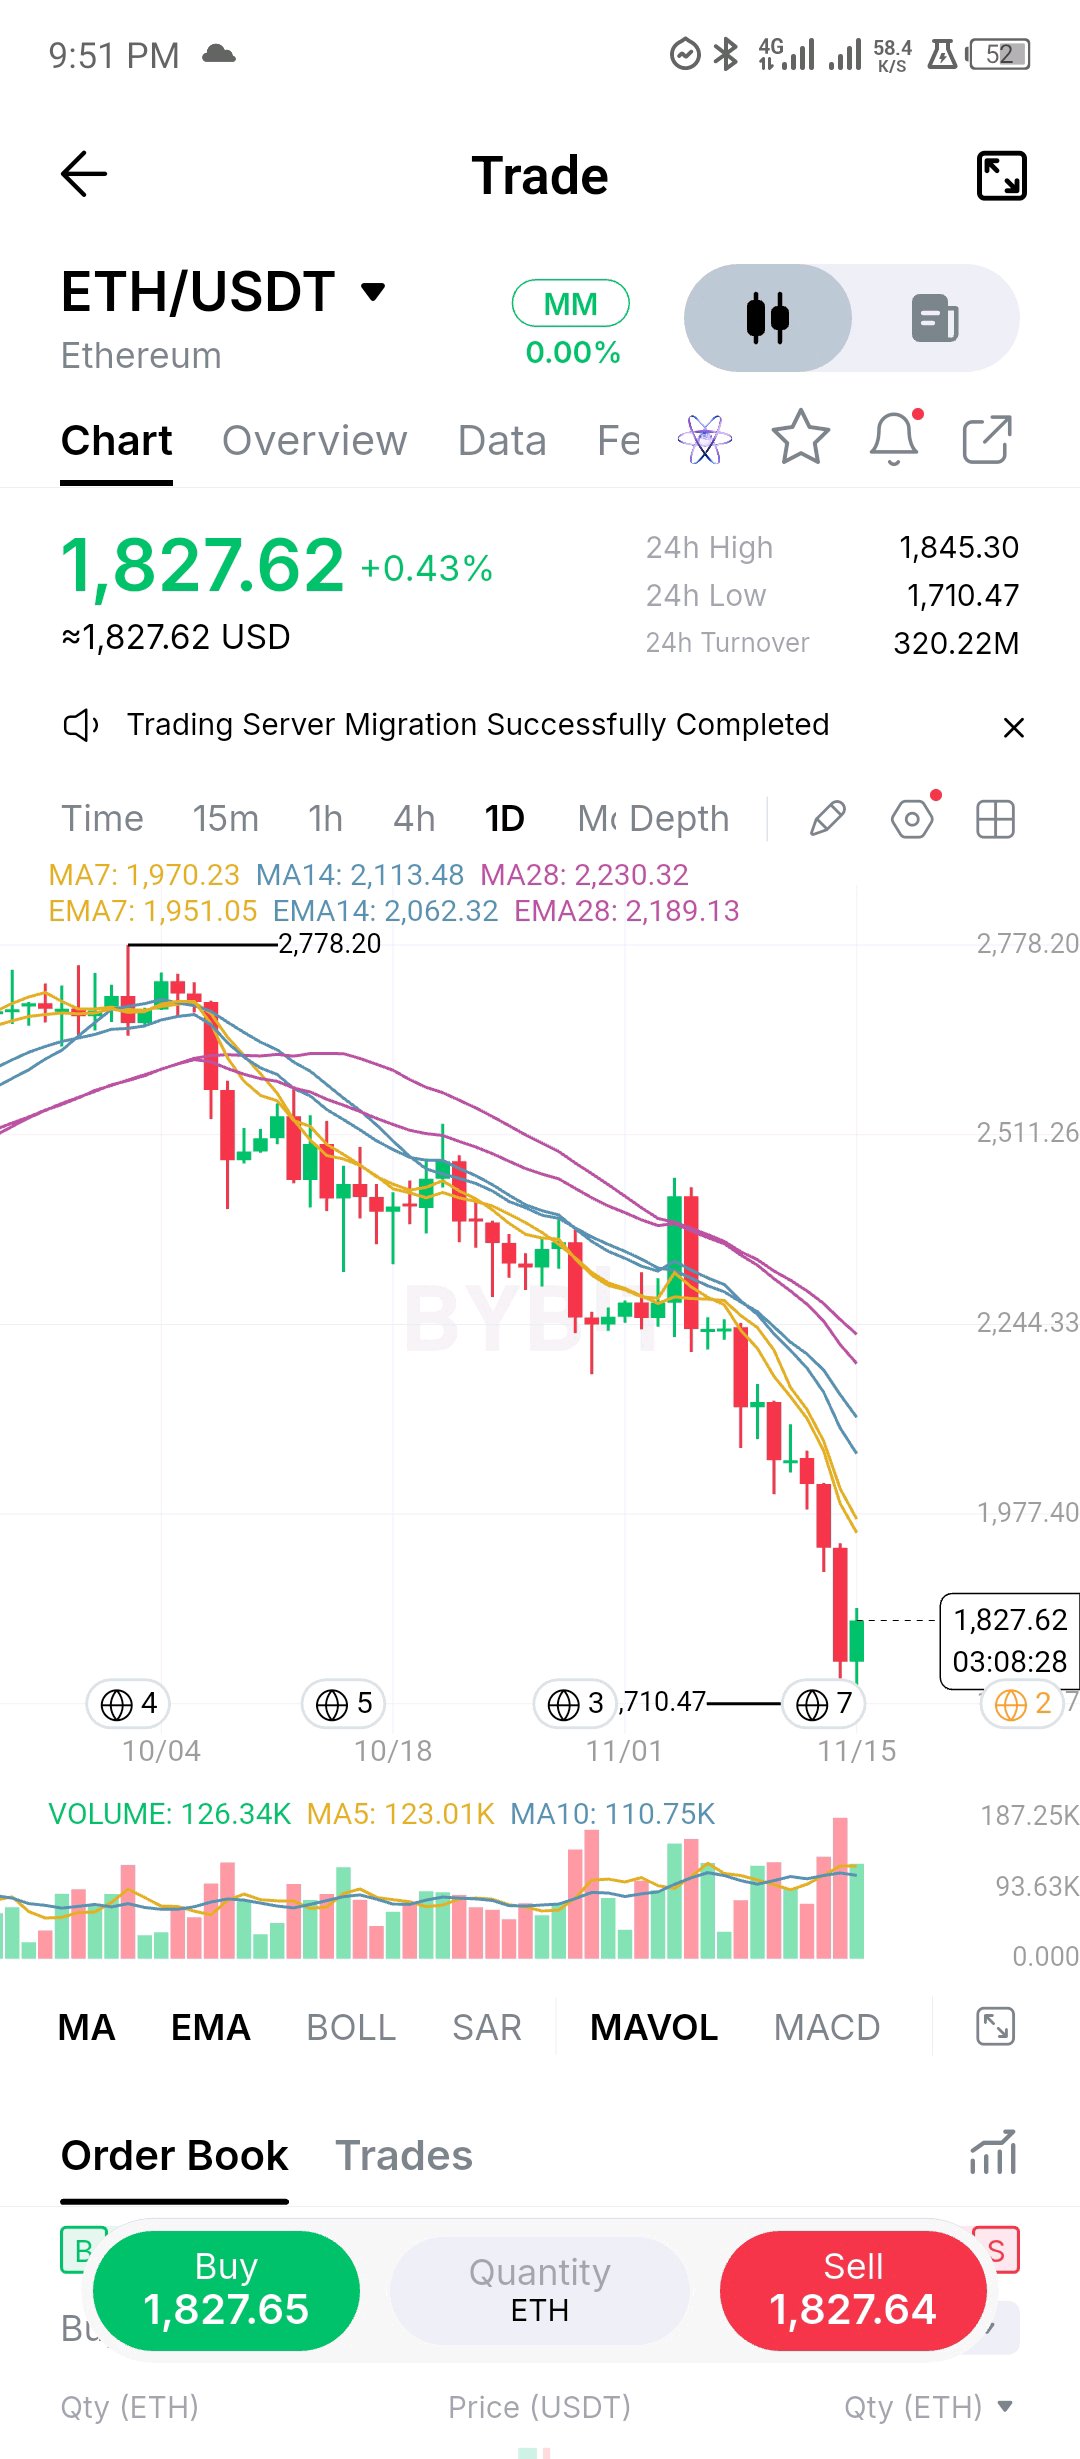
$ENAUSDT is at 0.12056 (+4.11%), about 59.1% under the 0.29465 high, 1.4% under the 24h high of 0.12228 and 9.6% above the 24h low of 0.11002. The 24h range is an 11.1% box, and the daily candle has about three hours left. Price flushed to 0.11002 and is bouncing, but it is still trading at the lowest levels since the August breakout, with the old base roughly 0.08-0.09 (approximate) below. Every average is overhead and falling, stacked fast under slow: 10.5-12.0% under the 7s (EMA7 0.13466, MA7 0.13706), 19.0-20.3% under the 14s (EMA14 0.14878, MA14 0.15124) and 27.5-30.8% under the 28s (EMA28 0.16633, MA28 0.17425). A +4.11% day only closes a small slice of that gap, so this is a bounce inside a downtrend until the 7s are won back. Volume is heavy on both sides of this move. Today’s bar is 167.27M with about three hours left, 25.9% above the MA10 (132.91M) and only 4.1% under the MA5 (174.51M), and the 24h turnover of 24.03M USDT works out to roughly 199.3M ENA, about 14% above the MA5 and 50% above the MA10. The MA5 sits 31.3% above the MA10. Real size traded at 0.11002, which is what a flush looks like, and a bounce on that kind of volume is worth respecting. MACD is still negative and pointing down: DIF (-0.01931) is under DEA (-0.01520), a histogram of -0.00411, with both lines below zero, so momentum has not turned yet. Levels to watch: Support: 0.11002 (24h low), then nothing marked until the July-August base, roughly 0.08-0.09 (approximate), and about 0.0723 (grid line, approximate). Resistance: 0.12228 (24h high), about 0.12791 (grid line, approximate), 0.13466 (EMA7), 0.13706 (MA7), 0.14878 (EMA14), 0.15124 (MA14), 0.16633 (EMA28), 0.17425 (MA28), 0.18349 (grid line), 0.23907 (grid line), then 0.29465 (the high). Plan, on daily closes: Low-hold long (counter-trend): a dip into 0.1100-0.1170 that holds on the daily close above 0.11002. Entry 0.1140, stop under 0.1075, which is 0.0065 of risk. 0.12791 is about 2.1R, 0.13466 about 3.2R and 0.14878 about 5.4R. Reclaim long: a daily close above 0.13706 on volume above the 174.51M MA5, then a retest of 0.1345-0.1375 that holds. Entry 0.1395, stop under 0.1330, which is 0.0065 of risk. 0.15124 is about 1.8R, so I’d trim there, then 0.17425 is about 5.3R and 0.18349 about 6.8R. Breakdown (short or exit): a daily close under 0.11002 on volume above the 174.51M MA5, then a failed retest of 0.1100-0.1180. Entry 0.1125, stop above 0.1195, which is 0.0070 of risk. Roughly 0.09 is about 3.2R and about 0.0723 about 5.7R, though both are approximate, so I’d trail after the first. Invalidation: the low-hold long fails under 0.1075. The bearish read softens on a daily close above 0.15124 (MA14), and the downtrend has turned above 0.17425 (MA28). Risk note: a bounce this size inside a downtrend can fade as fast as it came, and the candle still has three hours to run. Stops matter more than targets. Limit orders, small size. That’s my read of the chart, not advice.$ENAUSDT #ByXIMPACT
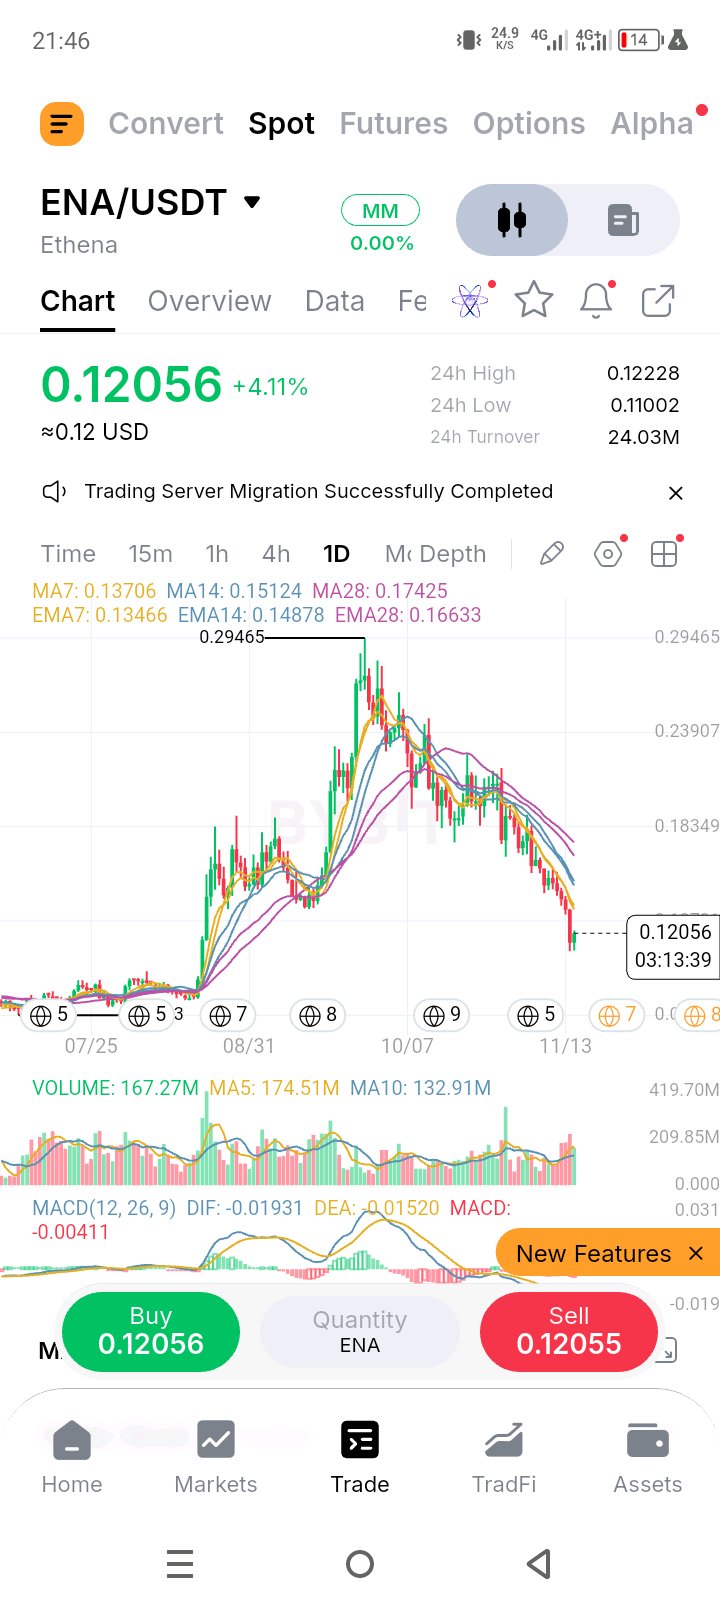

ETHEREUM 4H Market Analysis
$ETHUSDT is showing a small recovery after dropping to the $1,710 support area, but the overall trend remains bearish. ETH is currently trading around $1,832, still below both the MA50 ($2,025) and MA200 ($2,271), confirming that sellers remain in control. RSI indicators are showing some improvement, but bullish momentum is not yet strong enough to confirm a trend reversal. Key levels to watch: Support: $1,710 Resistance: $1,892 Major resistance: $2,025 A sustained move above $1,892 could strengthen the recovery. However, rejection at resistance may bring another test of lower support. For now, patience and risk management remain essential. A short-term bounce does not necessarily mean the downtrend is over. #ByXIMPACT $ETHUSDT
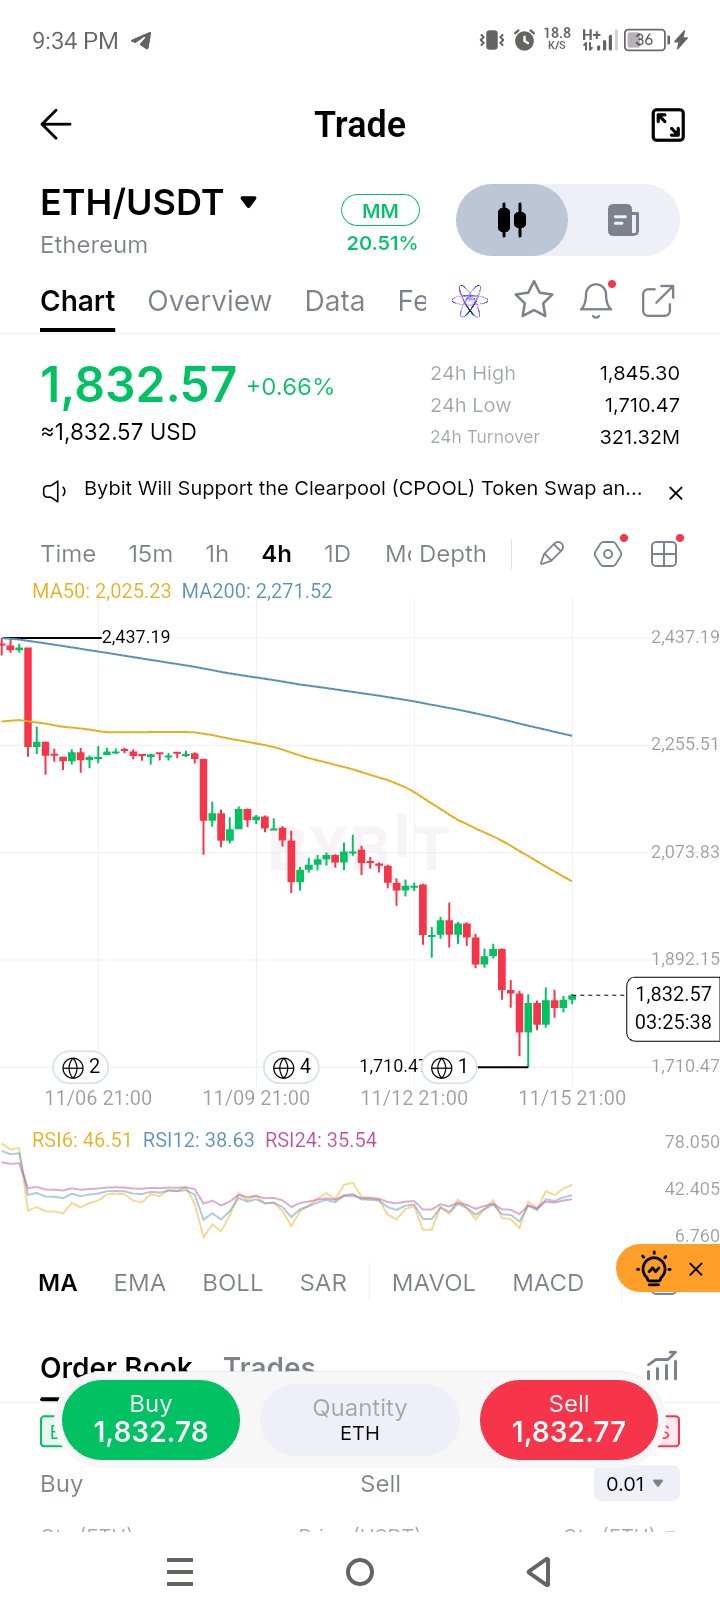

I almost ignored this SUI chart until I noticed how the price was interacting with the moving averages on the right side. Looking at the 1-hour timeframe, the macro trend had a heavy bleed from the 0.96550 peak down to the 0.67410 low. But zoom in on the recent price action. The aggressive selling stalled, and we’ve seen a strong, aggressive V-shaped recovery pushing the price back up to 0.72910 (+2.30%). Here is the critical detail: price is currently trading just above a fanned-out moving average cluster. The MA7 (0.72127), MA14 (0.72330), and MA28 (0.71623) are all acting as dynamic support beneath us. This is a textbook structural shift. When a downtrend stops making lower lows and price aggressively reclaims its moving averages, it signals that sellers are exhausted. However, we are testing a local resistance zone, so this is a tactical bounce, not a full reversal yet. A lesson I've learned from trying to catch falling knives is that you don't buy the bottom; you buy the confirmation of a structure shift. Trade Plan: Bias: Short-term bullish (Playing the recovery). Entry Zone: 0.7200 – 0.7250 (Looking for a slight pullback to retest the MA cluster). Stop Loss: 0.6740 (Just below the recent local swing low). Target 1: 0.7365 (24h high and immediate resistance). Target 2: 0.8198 (Mid-range macro resistance). Target 3: 0.8926 (Previous breakdown level). Risk/Reward: 1:2.5 Invalidation: A 1H candle close below 0.7100, which would signal a loss of the local uptrend support. Don't FOMO into the middle of this chop. Wait for the hourly candle to close strong, respect your stop loss, and never risk more than you can afford to lose. Do you think SUI is finally ready for a relief rally, or is this just a pause before the next leg down? $SUIUSDT #ByXIMPACT
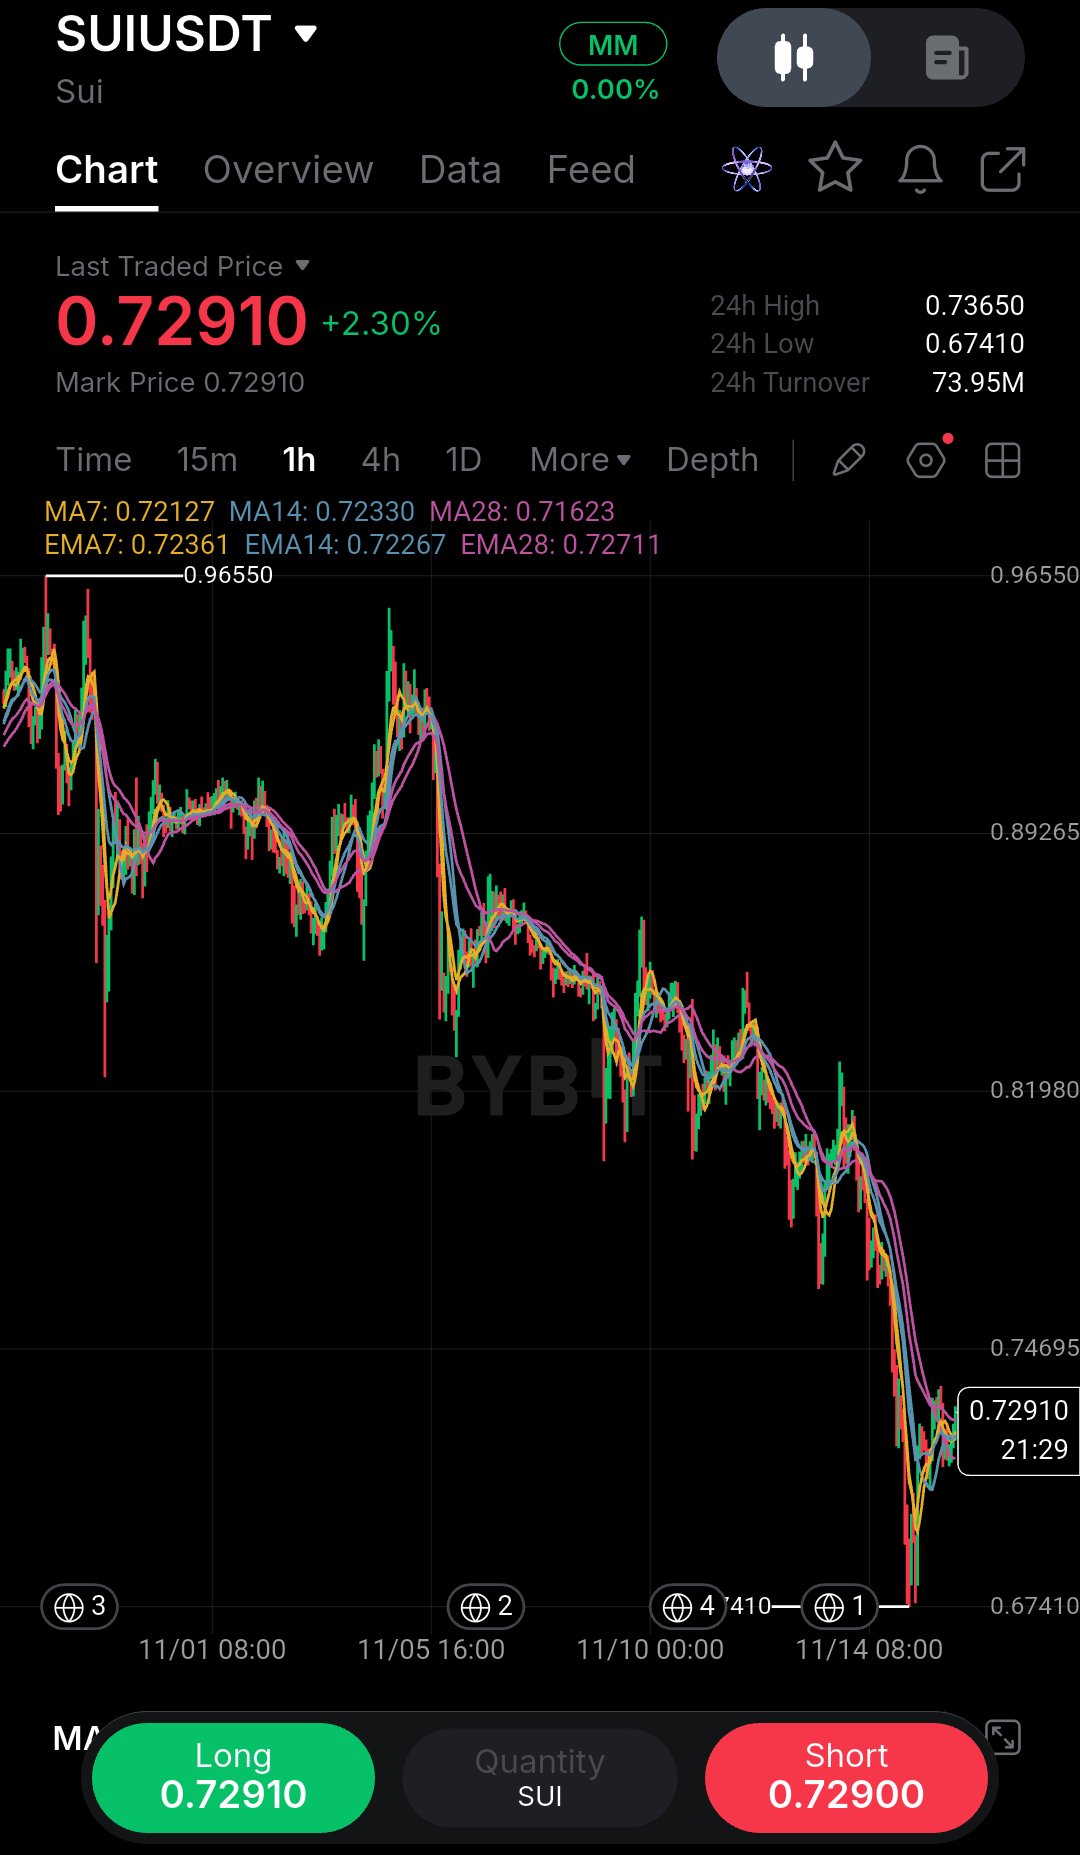

Guys, I'm opening a BIG LONG on $C98 here. 👀
$C98USDT Leverage: 30x Entry: MARKET / 0.010090 Entry 2: 0.009995 TP 1: 0.010399 TP 2: 0.010661 SL: 0.009765 👇🏻 $C98 just bounced off the 0.0094 lows and is reclaiming the 0.0100 zone, and if that level holds as support, the recovery can get aggressive fast. Everyone has been trained to sell every bounce. That's exactly why I'm watching for the bounce that finally doesn't fail. #ByXIMPACT #WSOT2026 #WSOTShowYourAITradeToEarn10USDT
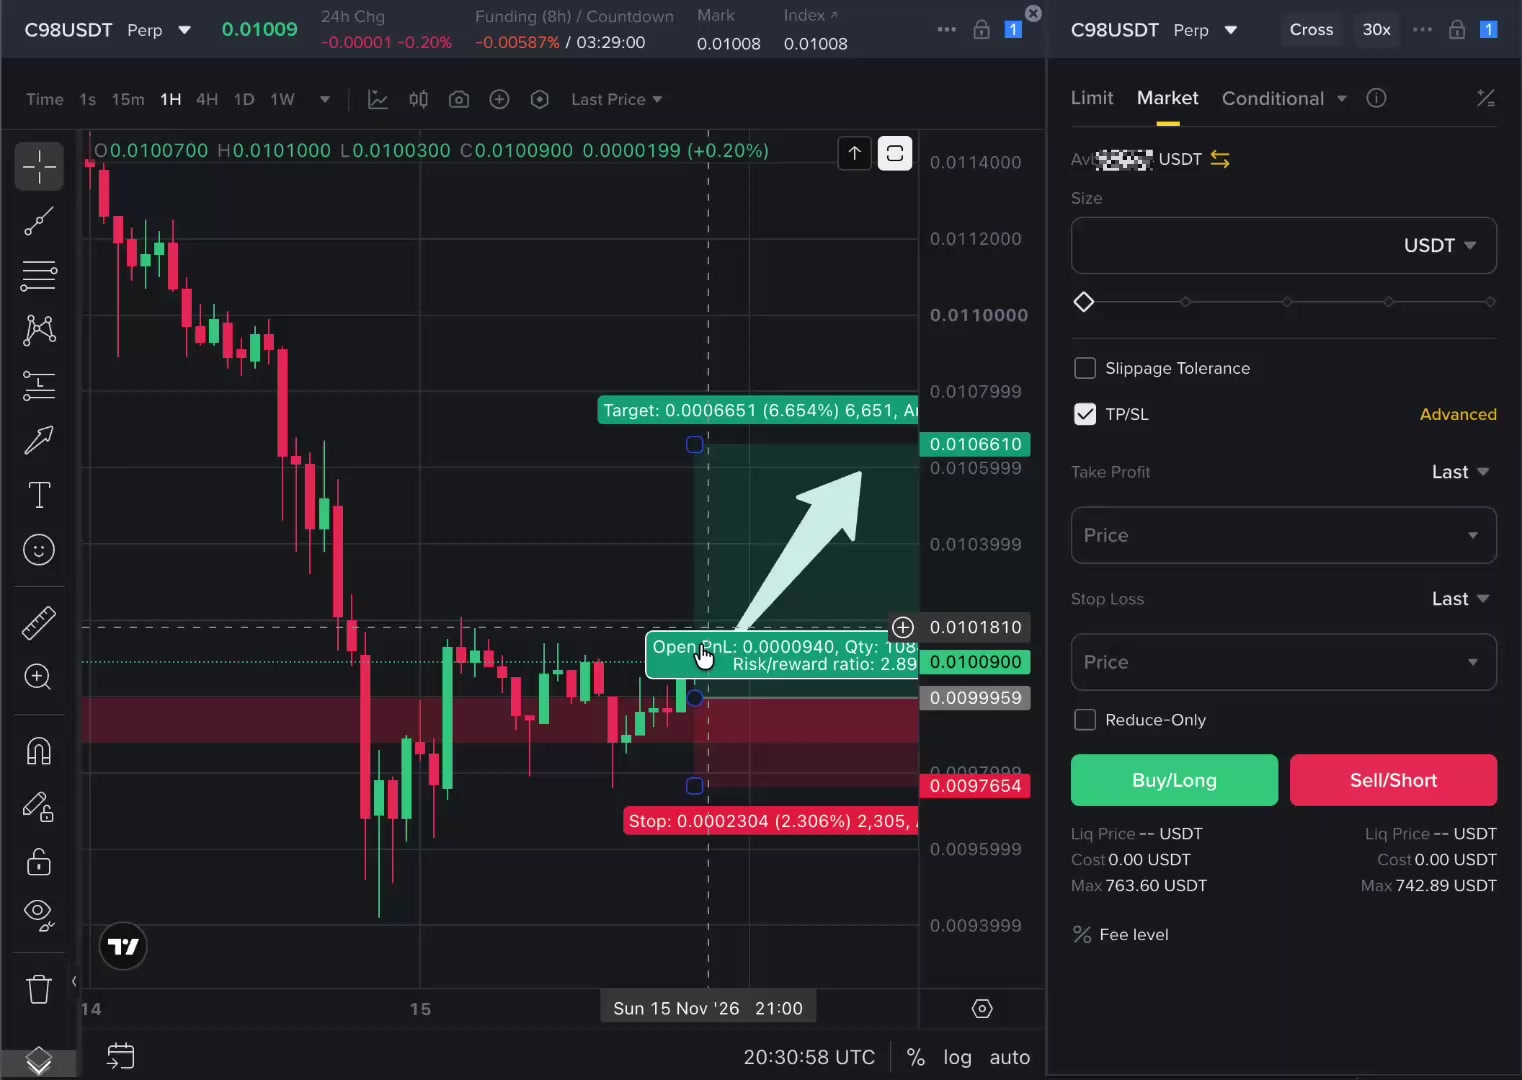
Hedera continues to process significant network activity, with approximately $20.65M in DeFi TVL and $493M in bridged TVL. Daily transactions remain around 679K. That’s real network usage, not just narrative. But the valuation question is more complicated. HBAR carries a circulating market capitalization of approximately $2.5B, while its DeFi ecosystem remains relatively small. This creates a gap between the valuation investors are assigning to the network and the capital currently deployed in its DeFi applications. The RWA opportunity remains an important part of Hedera’s longer-term positioning. Institutional tokenization, asset issuance and enterprise infrastructure could expand its economic footprint. However, adoption needs to translate into sustained capital inflows, deeper liquidity and recurring network revenue before it can justify a significantly higher valuation. One metric deserves attention: Hedera generates relatively modest daily network fees compared with its market capitalization. High transaction counts do not automatically translate into equivalent economic value for HBAR holders. From a trading perspective, HBAR is currently around $0.057–$0.058. Immediate support sits near $0.0550, while resistance is around $0.0595–$0.0605. A 4H close above $0.0605 followed by a successful retest could open the way toward $0.0620 and $0.0645. However, losing $0.0550 on a confirmed 4H breakdown would weaken the structure and expose $0.0525, followed by $0.0500. None of this says HBAR is fundamentally weak. It says the network adoption story and the token valuation story are moving on different clocks. The real question is whether institutional adoption eventually translates into measurable economic value for the token. #ByXIMPACT $HBARUSDT


QNT/USDT: a 12% bounce off 138.9 gets price back inside the band, but not back in control Quant's token powers Overledger, the software that links blockchains with bank systems, which is why September's run came from a banking deal and not a retail narrative. What got better: the daily is back above its lower Bollinger band (151.6) after dipping under it, and 138.9 held as the low. Price is up about 12% from there, on 9.2K volume with hours still left in the candle. What didn't: MA7, MA14 and MA28 (167.3 / 181.1 / 187.5) are still stacked downward, with price 7% under MA7. And roughly 69% of the whole run from 58.2 to 373 is still given back. Levels: 158.1 (the 24h high) is the first lid. MA7 at 167.3 is the line between a bounce and a recovery. Around 181-188, MA14 and MA28 sit right where the old sideways range was. Below, 151.6 is now the support to hold on a daily close, and losing it puts 138.9 back in play. Green candle, same trend. MA7 decides which one wins. $QNTUSDT #ByXIMPACT