Umar
3194Like0Shares171Fans324Follow
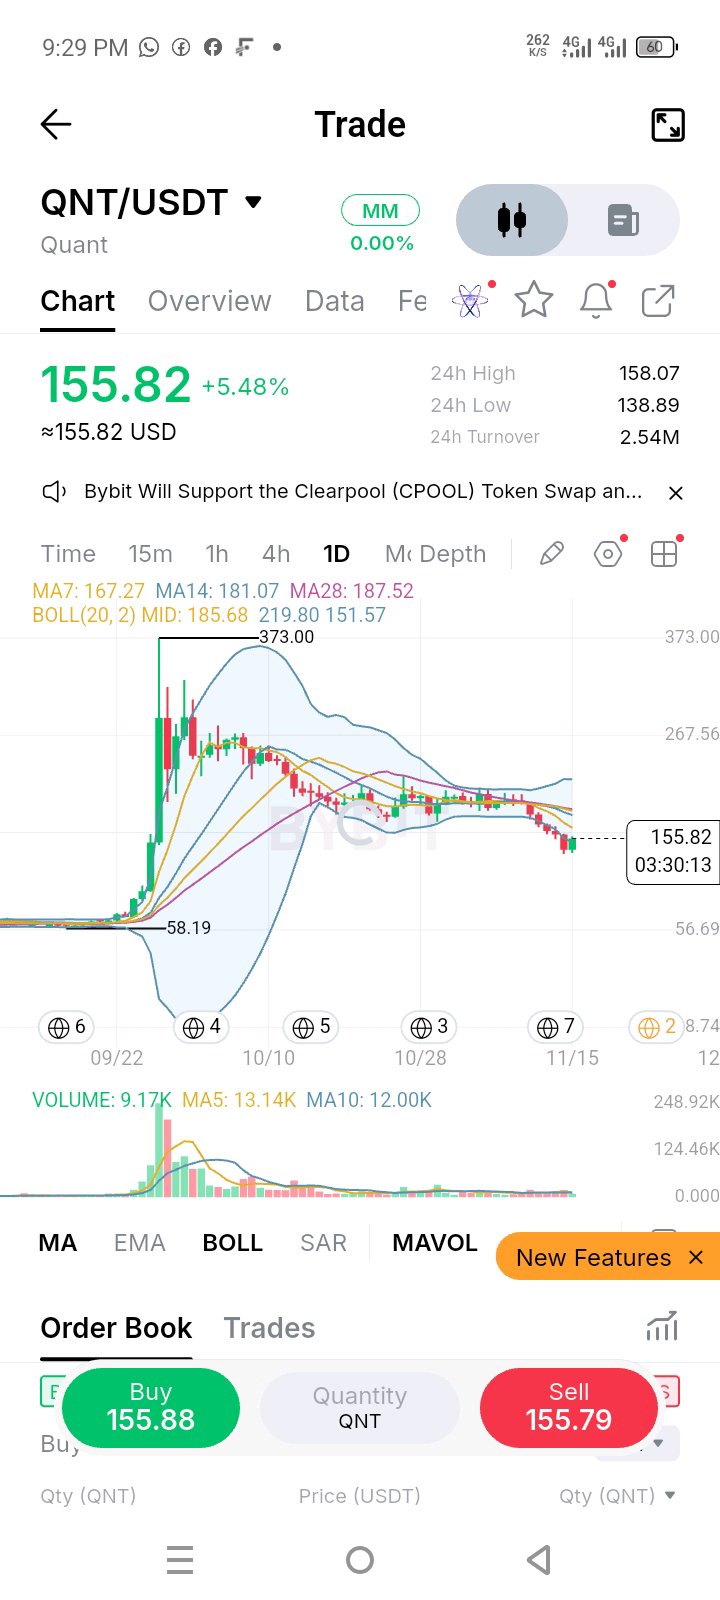
QNT/USDT: a 12% bounce off 138.9 gets price back inside the band, but not back in control Quant's token powers Overledger, the software that links blockchains with bank systems, which is why September's run came from a banking deal and not a retail narrative. What got better: the daily is back above its lower Bollinger band (151.6) after dipping under it, and 138.9 held as the low. Price is up about 12% from there, on 9.2K volume with hours still left in the candle. What didn't: MA7, MA14 and MA28 (167.3 / 181.1 / 187.5) are still stacked downward, with price 7% under MA7. And roughly 69% of the whole run from 58.2 to 373 is still given back. Levels: 158.1 (the 24h high) is the first lid. MA7 at 167.3 is the line between a bounce and a recovery. Around 181-188, MA14 and MA28 sit right where the old sideways range was. Below, 151.6 is now the support to hold on a daily close, and losing it puts 138.9 back in play. Green candle, same trend. MA7 decides which one wins. $QNTUSDT #ByXIMPACT
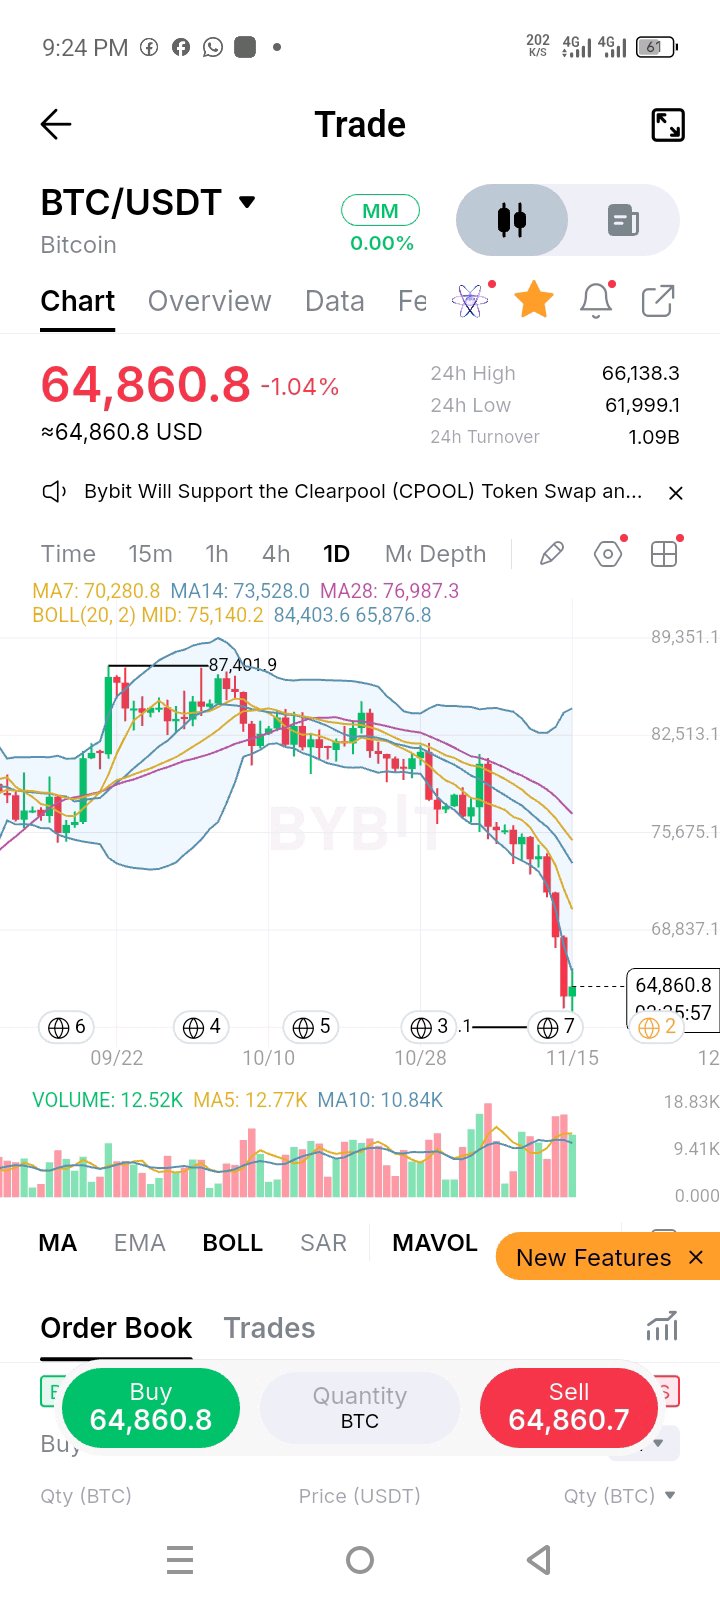
$BTCUSDT: back at the June low, and the first bounce is already running into a ceiling Bitcoin is the reference asset the rest of the market prices against, so when it tests a stress zone, everything else feels it. This zone has history: BTC hit 61.35K on June 4, and price touched 62.0K again in the last 24 hours. It was near 76K when the Binance hack headlines landed in late October, so it has lost about 15% since. The chart: 87.4K to 62.0K is a 29% drop, and the bounce to 64.9K is about 4.6%. Price sits 1.5% under the lower Bollinger band (65.9K), which lines up with the 24h high at 66.1K, so one ceiling has two reasons behind it. MA7 at 70.3K is 8% overhead. Volume is 12.5K today against a 12.8K 5-day average. That's normal participation, not a climax, so I wouldn't call a bottom off it. If you're long: a daily close above 66.1K says the bounce has teeth, and MA7 is the real test after that. If you're short: a rejection at 65.9-66.1K keeps the retest of 62.0K in play, and a close under 61.35K, the June low, is the break that matters. Same zone, second visit. On the next test I'll watch volume first, because a break on a spike and a drift under the level mean different things. $BTCUSDT #ByXIMPACT
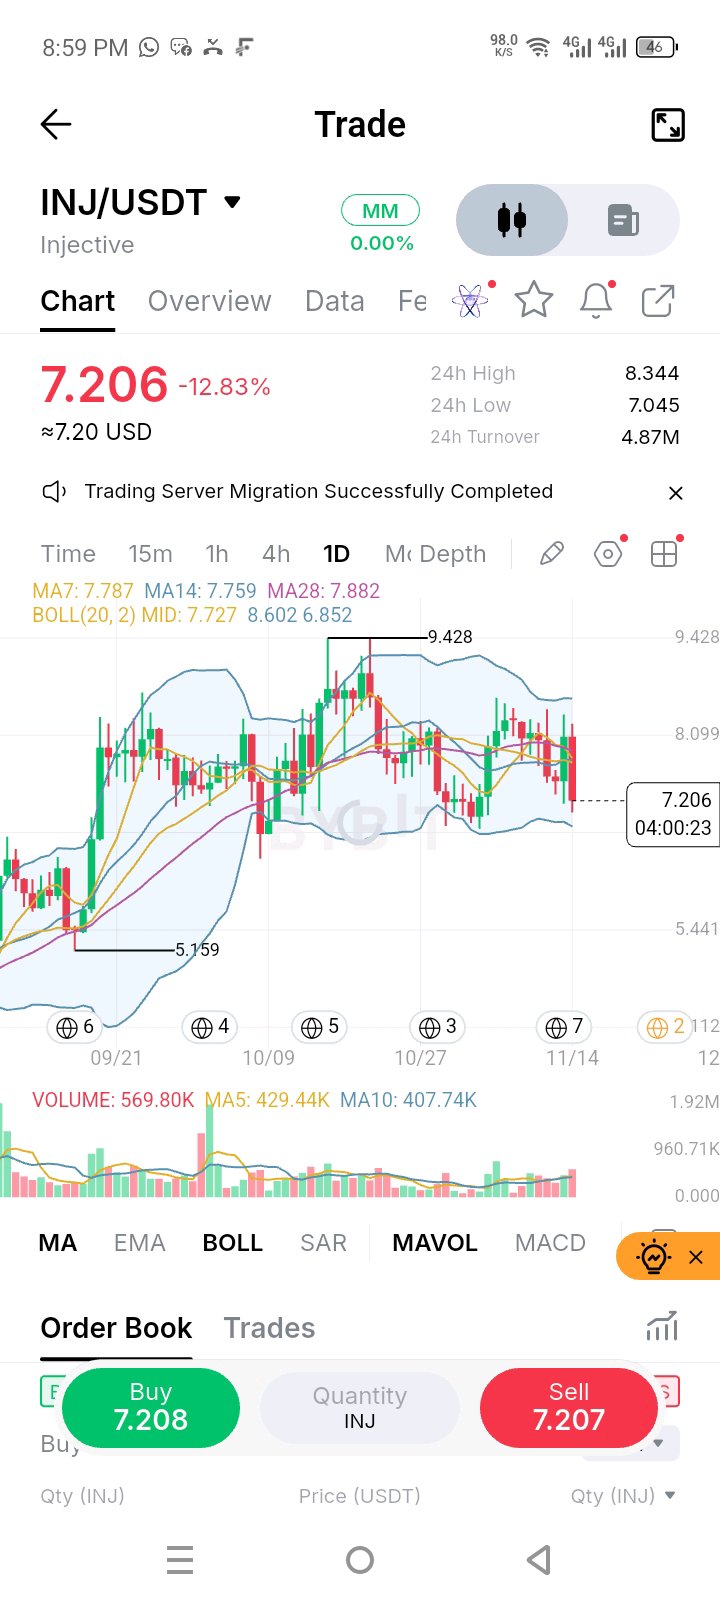
$INJUSDT a squeeze that broke the wrong way, with the ETF bid already behind it Injective is a Layer-1 built for onchain finance (spot, derivatives, tokenized real-world assets), and INJ is used for staking, governance and fees. The network processed about $12.9B in onchain trading over the past year. When the first staked INJ ETF began trading on Nasdaq on Nov 5, price was near 8. It's 7.2 now, about 10% lower, and traders noted that the ETF's initial seeding wasn't fresh spot buying, so the bounce never had much behind it. The chart: for three weeks MA7, MA14 and MA28 (7.79 / 7.76 / 7.88) have been tangled within 0.12 of each other, which is a market with no opinion. Today's 12.8% drop is the market forming one, and it came on 570K volume against a 5-day average of 429K, so it isn't a thin move. Price is now 7.5% under MA7 and about 5% above the lower band (6.85). What I'm watching: that tangle of averages around 7.76-7.88 is now overhead supply, and any rally into it is a test. Below, 7.045 (today's low) comes first, then the 6.85 band. If both give way, the 5.16 swing low is the next marked level on this chart. A fast reclaim of 7.8 turns this into a shakeout. Anything slower and the old range becomes resistance. $INJUSDT #ByXIMPACT $BTCUSDT
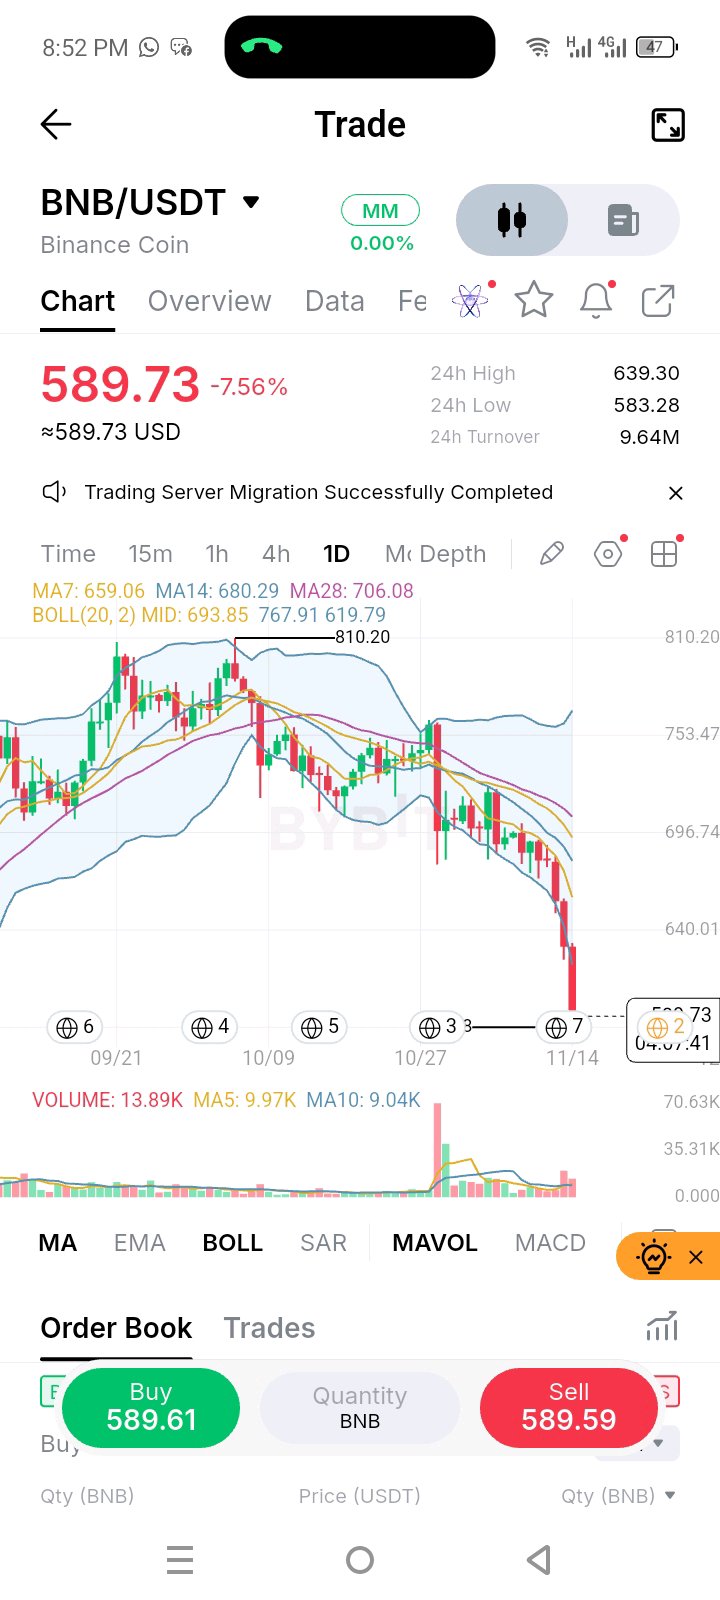
$BNBUSDT Binance says everyone's been made whole, and the chart still hasn't accepted it BNB is the native token of BNB Chain and the Binance ecosystem, and its supply shrinks through scheduled burns (about 131.5M BNB remained as of Oct 19). The Oct 29 hack, roughly $6.3B pulled from Binance wallets, didn't touch any BNB, and Binance says it has since reimbursed users from its own funds. BNB closed at 759 that day and trades at 589.7 now, about 22% lower. The hack headline alone doesn't explain this leg. The chart: 27% off the 810.2 high, 4.9% under the lower Bollinger band (619.8) and 10.5% under MA7 (659.1). MA7, MA14 and MA28 are fanned apart and all falling. That's a stretched market, and stretched markets snap back, but the trend still controls direction. Volume is what separates this from a quiet drift. Today's 13.9K is well above the 5-day average of roughly 10K, so this selling has real participation. That fits capitulation or distribution, and the chart can't tell me which one yet. How I'm framing it: - A bounce toward 619.8 wouldn't surprise me. I'd treat it as a test, and the 24h high at 639.3 is where it has to prove itself. - Under today's low of 583.3, the 52-week low near 538.7 is about 9% below price and in play. - If the bounce comes on thinner volume than today, that's an exit for trapped longs, not new demand. $BNBUSDT#ByXIMPACT $PEPEUSDT
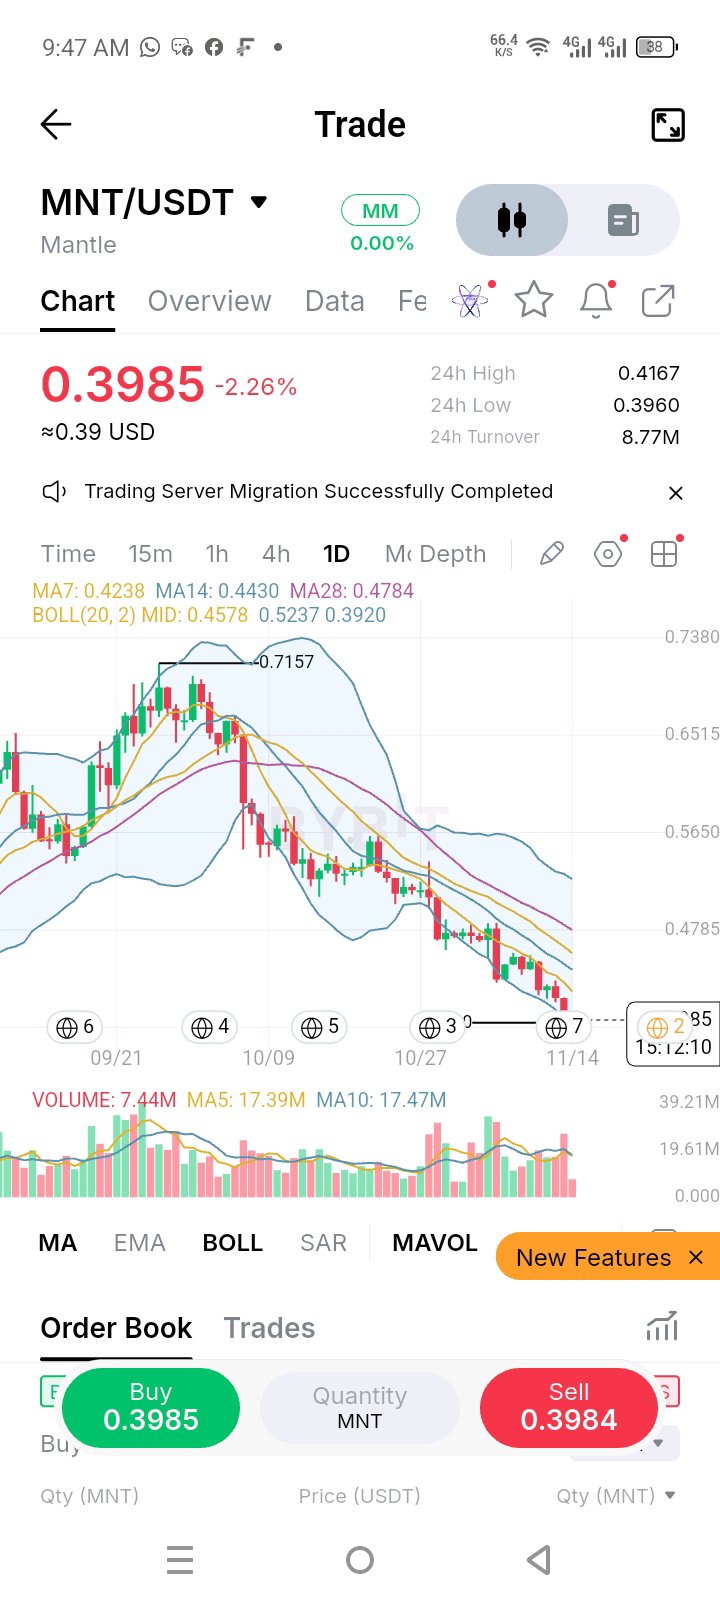
$MNTUSDT price is 2% above its cycle low, which makes this a risk-definition trade, not a prediction Mantle is an Ethereum Layer-2, and MNT is its governance and utility token (migrated from BitDAO in 2023). The cycle low is 0.390, set on July 31, against an all-time high of 2.84 from October 2025. I can't find a Mantle-specific bad headline behind this drift, so the weakness looks market-wide. One thing I'm watching is an open governance proposal for the July 2026-June 2027 budget cycle that earmarks 150M MNT and 40M USDx. Votes like that can move sentiment either way. The chart is still a downtrend. It's 44% off the 0.7157 high, with daily candles walking the lower band (0.3920), and MA7/14/28 at 0.4238 / 0.4430 / 0.4784 all falling above price. Volume is quiet, with 7.44M today against roughly 17.4M on both averages. That can mean sellers are running out, or it can mean nobody's bidding. Today's candle isn't closed, so I can't tell yet. What caught my eye is the location. The 0.390 cycle low and the 0.392 lower band sit within a few ticks of price, so the line where this idea is wrong is very close. A daily close under 0.390 and the July low is gone. Upside, the first real test is MA7 at 0.4238, about 6% away. That's roughly 3:1 from here if you stop under 0.390. The catch: a stop on a daily close can slip well past the paper number. Size it as if the loss will be bigger than the math says. The trend says down, but the location says risk is cheap. I'd only take that with small size, and I'd drop the idea the moment 0.390 closes broken. $MNTUSDT #ByXIMPACT $SOLUSDT
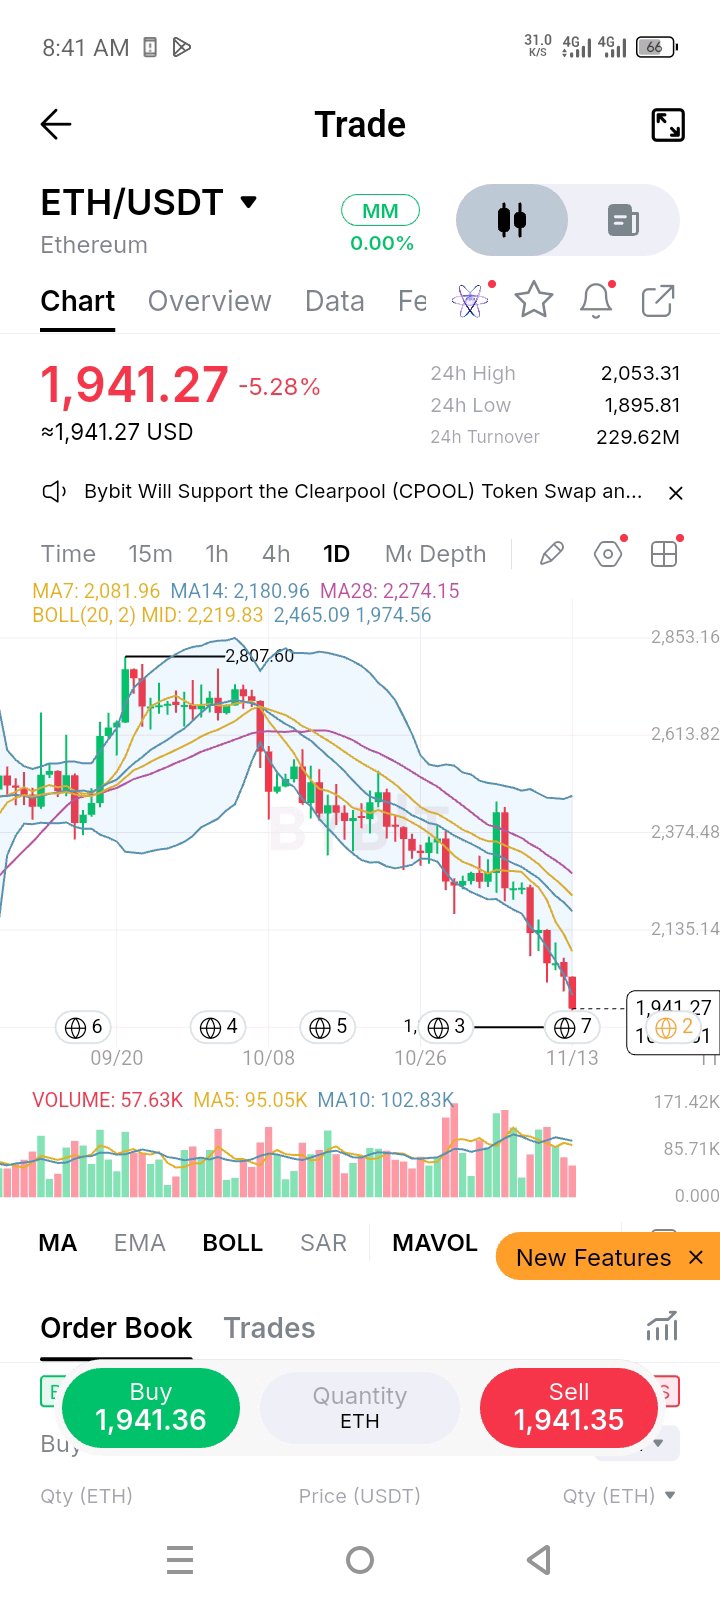
$ETHUSDT 31% off the 2,807 high, and the daily chart still hasn't printed a clean reversal Ethereum is the settlement layer behind most DeFi and stablecoin activity. Its next hard fork, Glamsterdam, brings proposer-builder separation into the protocol, plus block-level access lists and repriced gas, and it still has no confirmed mainnet date. Upgrade stories rarely hold a price up in a tape like this. They matter once buyers are already back. At 1,941 ETH sits under the lower Bollinger band (1,974.6) and almost 7% below MA7 (2,082). MA14 and MA28 (2,181 and 2,274) are both rolling over above it. This is a trend in motion, not a stretched rubber band waiting to snap. Volume is why I'm not calling a bottom. Today's 57.6K is roughly 60% of the 5-day average (95K), and the candle isn't closed. A real flush usually leaves a volume footprint, and this one doesn't yet. What I'd need to see: a daily close back above 1,975 on volume above that 95K average. That's the minimum to say the pressure is easing. A close under today's low at 1,895.8 and I stand aside instead of guessing where the floor is. And any bounce into 2,082 is a test, not a verdict. Falling 31% makes ETH cheaper, not safer. The reclaim is the signal, not the price. $ETHUSDT #ByXIMPACT
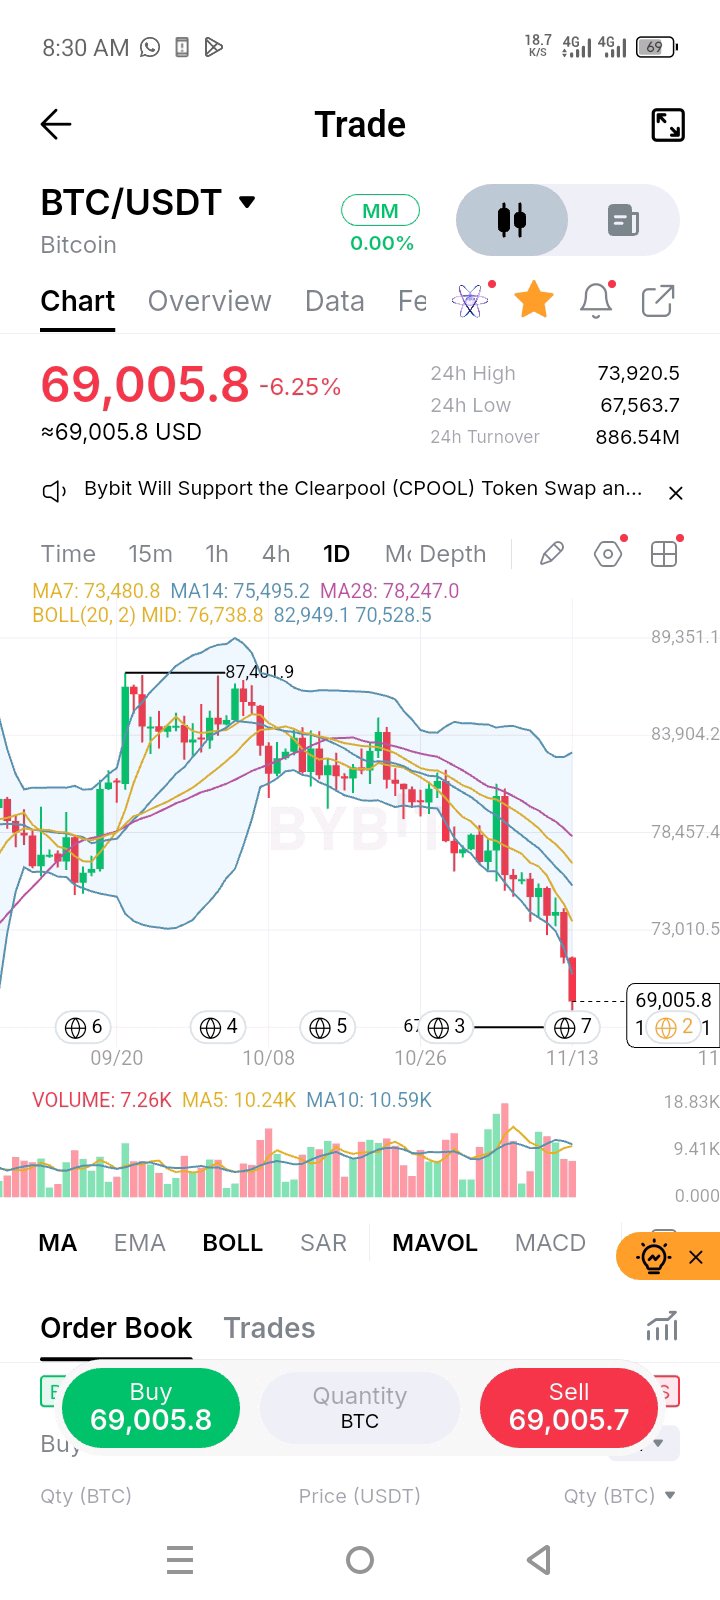
$BTCUSDT daily candle is outside the lower Bollinger band, and that isn't the same as "oversold" Bitcoin's issuance has been fixed at 3.125 BTC per block since the 2024 halving, so a move like this is about flows and leverage, not new supply. The 87.4K high to 69.0K is roughly a 21% drop. Price sits under the lower band (70.5K), and MA7, MA14 and MA28 (73.5K / 75.5K / 78.2K) are stacked and all pointing down. With bands expanding like this, a close outside the band often means continuation pressure, not a bounce signal on its own. Volume is the missing piece. Today's 7.26K is below the 5-day average of 10.2K, though the candle hasn't closed. Capitulation usually shows up as a volume spike, and I don't see that yet. Levels I'm watching: - 67.5K, today's low. This is the line. - 70.5K, a daily close back inside the band. That's the first sign sellers are tired. - 73.5K, MA7. Any bounce gets tested here, and I wouldn't read a pop into it as a trend change. Plan: no early long into a falling knife. I'd wait for a daily close above 70.5K, or a sweep of 67.5K that gets reclaimed fast. A daily close below 67.5K means I'm risk-off. Are you fading the band here or waiting for the reclaim? $BTCUSDT #ByXIMPACT $SOLUSDT
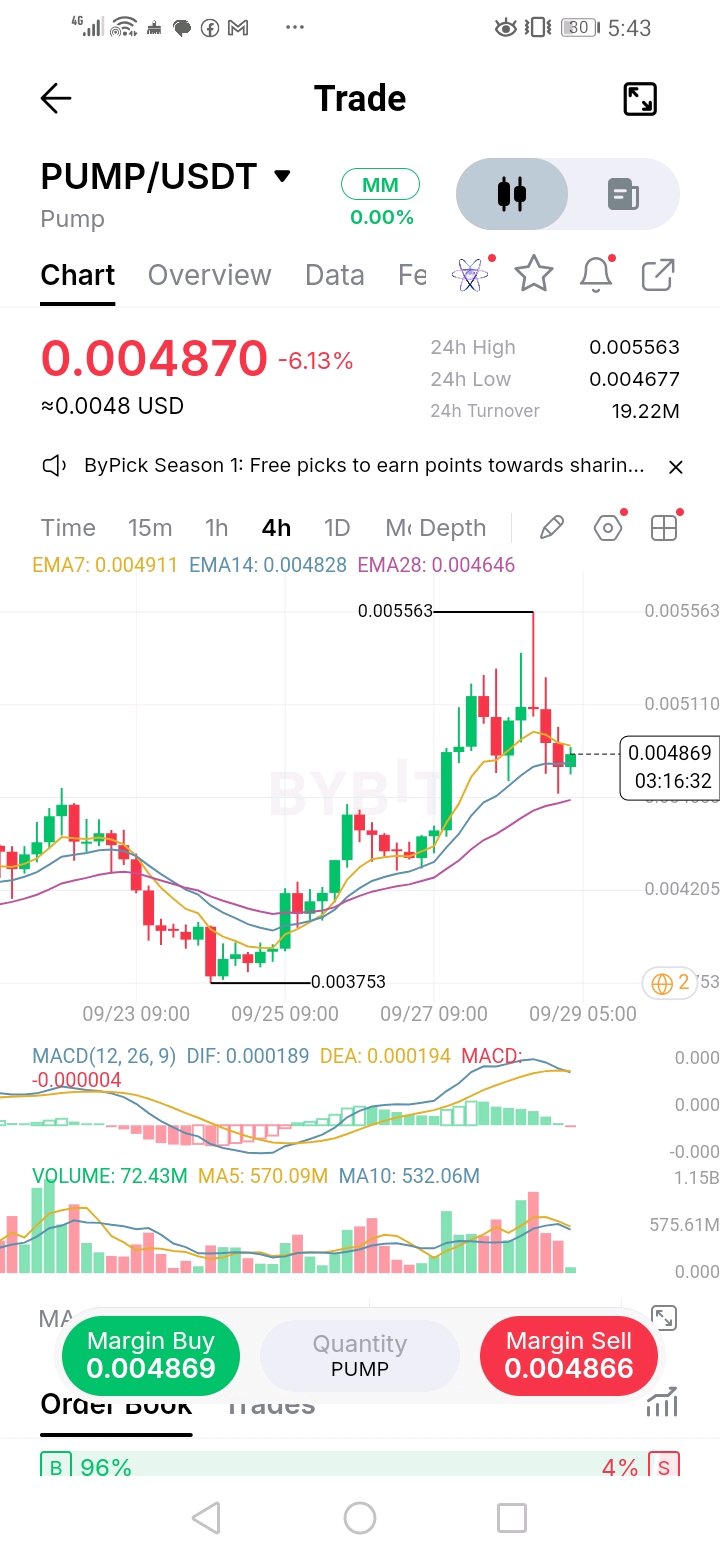
What is interesting me is the volume and buying side of 90-95% range PUMP is still holding a bullish medium-term structure, but the latest candles show a pullback from 0.005563 and momentum is cooling. The key question is whether the pullback holds around the EMA cluster. 📊 Key figures Current: 0.004870 24H high: 0.005563 24H low: 0.004677 EMA 7: 0.004911 EMA 14: 0.004828 EMA 28: 0.004646 MACD: -0.000004 DIF: 0.000189 DEA: 0.000194 Recent major low: 0.003753 🟢 Bullish structure The broader 4H structure remains constructive: EMA7 > EMA14 > EMA28 And price is still above the EMA14 and EMA28. However, price has slipped slightly below EMA7, while MACD has just turned marginally negative. That means bullish momentum is weakening, not necessarily that the entire uptrend has reversed. 🎯 Long setup Pullback entry zone: 0.00475–0.00485 This zone combines the EMA14 area with recent price structure. More conservative confirmation: Wait for price to reclaim 0.00491 and hold it as support. Potential targets: Target Level TP1 0.00510 TP2 0.00530 TP3 0.00555–0.00556 The 0.005563 high is the major breakout level. A clean 4H breakout above 0.005563 with expanding volume could expose higher levels, but those should be reassessed after confirmation. 🔴 Bearish scenario The important downside level is 0.004646, the EMA28. If PUMP loses 0.004646 with a convincing 4H close, the current bullish structure becomes considerably weaker. Possible downside levels: 0.00450 0.00421 0.00375 The 0.003753 level is the major swing low visible on your chart. 🛑 Invalidation For the pullback-long setup: 4H close below 0.004646 → bullish setup weakened/invalidation zone. For a breakout setup above 0.005563: A breakout followed by a quick rejection back below 0.00550–0.00556 would be a warning of a failed breakout. 📈 Momentum map Indicator Reading 4H structure 🟢 Bullish, weakening EMA alignment 🟢 Bullish Price vs EMA7 ⚠️ Slightly below Price vs EMA14 🟢 Above Price vs EMA28 🟢 Above MACD ⚠️ Nearly neutral/bearish crossover Immediate support 0.00483–0.00475 Major support 0.004646 Resistance 0.00510–0.00511 Major resistance 0.005563 🔥 Trade map Bullish: 0.00475–0.00485 → confirmation → 0.00510 → 0.00530 → 0.00556 Breakout: 4H close > 0.005563 → retest/hold → continuation setup Bearish: 4H close < 0.004646 → 0.00450 → 0.00421 → 0.00375 ❓ Key question Can PUMP defend 0.00475–0.00483 and reclaim 0.00491, or will sellers push it below the EMA28 at 0.004646? One important observation: the screenshot's order-book indicator shows 96% buy vs 4% sell, but I would not treat that alone as confirmation—the chart structure, actual traded volume, and candle closes matter more. #ByXIMPACT $MONUSDT
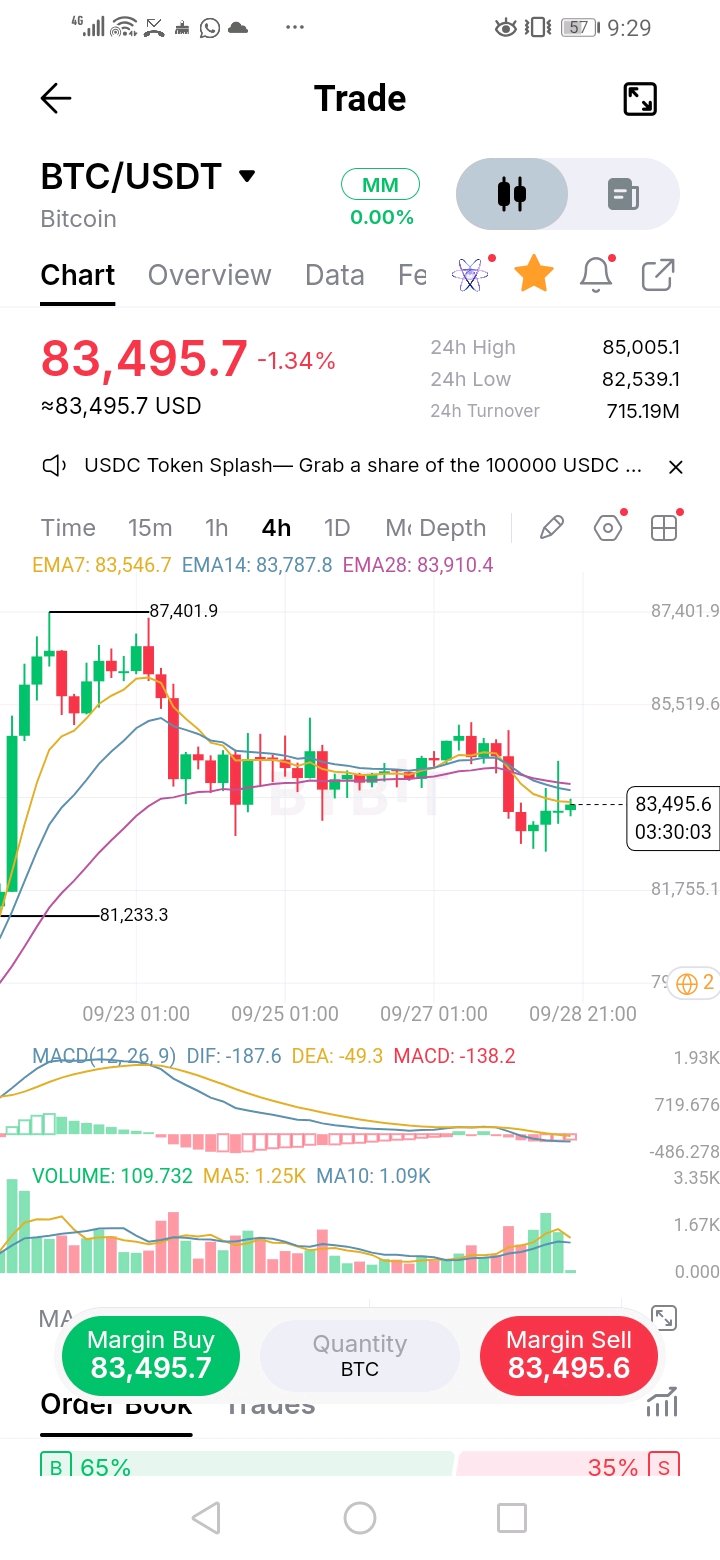
BTC/USDT — 4H Technical Analysis BTC is showing a weak/bearish 4H structure with a short-term attempt to stabilize around 83.5K. The key issue is that price remains below all three EMAs while MACD is negative. 📊 Key figures Current price: 83,495.7 24H high: 85,005.1 24H low: 82,539.1 EMA 7: 83,546.7 EMA 14: 83,787.8 EMA 28: 83,910.4 MACD: -138.2 DIF: -187.6 DEA: -49.3 🔴 Bearish structure The current EMA positioning is: Price 83,496 < EMA7 83,547 < EMA14 83,788 < EMA28 83,910 That keeps the 4H structure bearish. MACD is also below zero, with DIF significantly below DEA, indicating that downside momentum is still present. However, the recent candles around 82.5K–83.5K show some buying response, so a short-term recovery is possible if BTC reclaims the EMA cluster. 🎯 Key levels 🟢 Bullish scenario First trigger: reclaim 83,550 Stronger confirmation: 4H close above 83,910–84,000 If BTC can establish itself above the EMA28, potential upside zones become: TP1: 84,300–84,500 TP2: 85,000–85,100 TP3: 85,500–86,000 The 85,005 area is particularly important because it corresponds with today's high. 🔴 Bearish scenario A rejection from the EMA cluster followed by a move below 82,539 would strengthen the downside setup. Potential downside zones: TP1: 82,500 TP2: 81,750 TP3: 81,230 The chart's previous major swing low around 81,233 is an important structural support. 🎯 Entry ideas Long/pullback idea: 82,800–83,200 if support holds and price produces bullish confirmation. Long breakout idea: >84,000 after a confirmed 4H close/retest. Short rejection idea: 83,800–84,100 if price reaches the EMA cluster and gets rejected. Short breakdown idea: <82,500 following confirmation/retest. 🛑 Invalidation For a bullish setup, losing 82,539 weakens the immediate recovery thesis. For a bearish setup, sustained 4H acceptance above roughly 84,000–84,300 would weaken the rejection setup. 📈 Momentum map Factor Reading 4H trend 🔴 Bearish EMA structure 🔴 Bearish MACD 🔴 Bearish Immediate support 82,539 Major support 81,233 Immediate resistance 83,550–83,910 Major resistance 85,005 Current condition ⚠️ Stabilizing after sell-off 🔥 Key question Can BTC reclaim 83.9K–84K and turn the EMA cluster into support, or will the current bounce fail and send price back toward 82.54K? For this chart, 83.9K–84K is the key decision zone. #ByXIMPACT $BTCUSDT $QNTUSDT
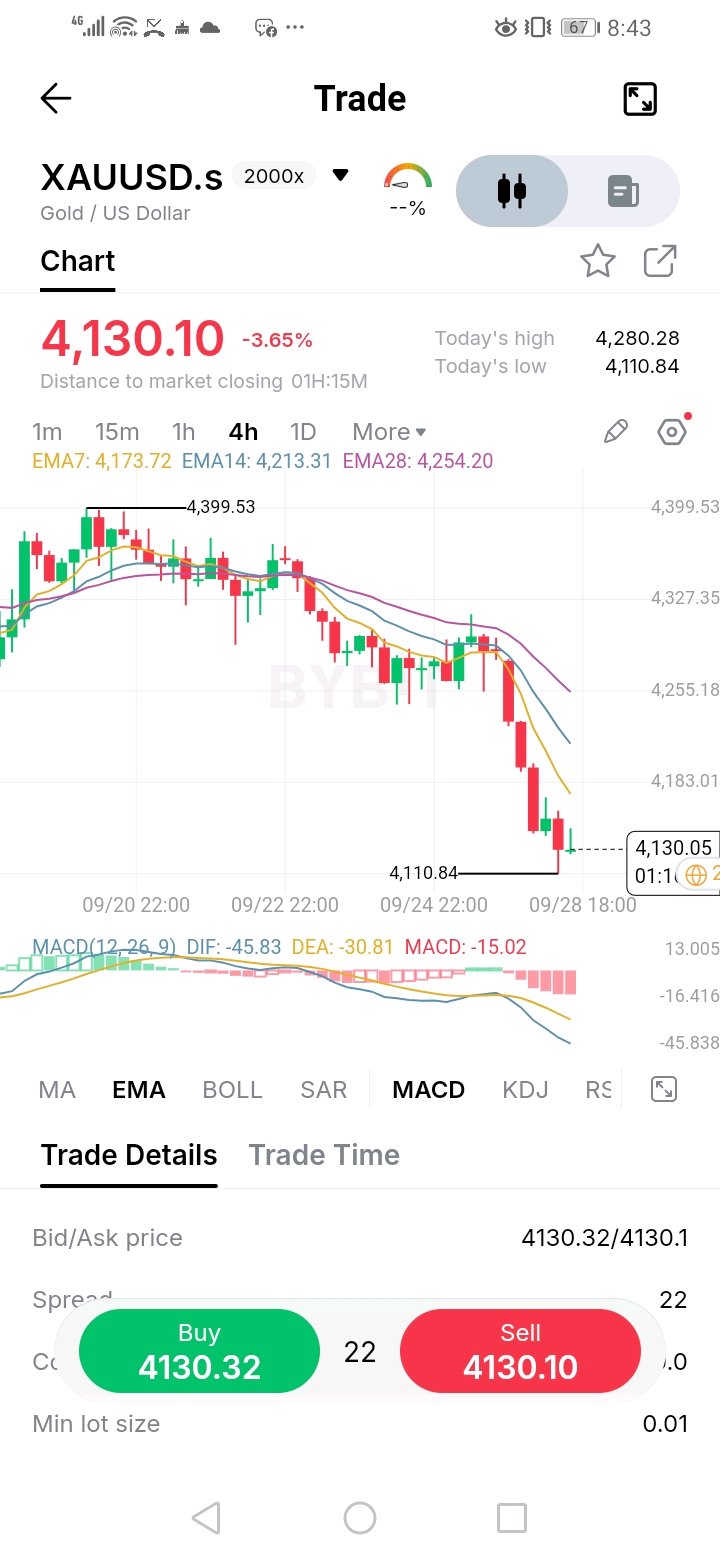
XAUUSD — 4H Technical Analysis The chart shows a strong bearish 4H structure. Price is below all three EMAs, and MACD remains deeply negative. However, price is now very close to the 4,110.84 daily low, so chasing a short at 4,130 carries increased risk of a relief bounce. 📊 Key figures Current: 4,130.10 Today's high: 4,280.28 Today's low: 4,110.84 EMA 7: 4,173.72 EMA 14: 4,213.31 EMA 28: 4,254.20 MACD: -15.02 DIF: -45.83 DEA: -30.81 🔴 Bearish structure The EMA arrangement is clearly bearish: Price 4,130 < EMA7 4,174 < EMA14 4,213 < EMA28 4,254 That means the immediate trend remains downward. MACD also supports the bearish momentum: DIF is below DEA and the histogram is negative, with the latest bars expanding downward. 🎯 Short setup Rather than chasing at 4,130, two technical approaches stand out: 1. Pullback short Entry zone: 4,165–4,190 TP1: 4,130 TP2: 4,110–4,105 TP3: 4,070–4,050 A rejection around the EMA7/nearby resistance would provide confirmation for this scenario. 2. Breakdown short Trigger: sustained move below 4,110.84 Confirmation: preferably a 4H close below the level or a breakdown/retest TP1: 4,080 TP2: 4,050 TP3: 4,000 🟢 Bullish reversal scenario The bearish setup becomes less convincing if XAUUSD recovers above the EMA7 and starts reclaiming the higher EMAs. Key levels: 4,174 → 4,213 → 4,254 A sustained 4H recovery above 4,213–4,254 would indicate that the current downside momentum is weakening and could open a move toward the previous 4,280 area. 🛑 Invalidation For the pullback-short idea, a sustained 4H move above roughly 4,213–4,254 would materially weaken the setup. For a breakdown short, a quick reclaim of 4,110.84 after the breakdown would be a warning that the breakdown may have failed. 🔥 Momentum map Bearish: 🔴🔴🔴🔴 MACD: Bearish EMA structure: Bearish Immediate support: 4,110.84 Resistance: 4,174 / 4,213 / 4,254 Major resistance: 4,280 Key question: Will 4,110.84 break, or will buyers defend the daily low and produce a relief bounce? Important: because price is already near the day's low, the cleaner risk/reward may come from either a confirmed breakdown or a pullback into resistance rather than entering blindly around 4,130. #ByXIMPACT $XAUTUSDT $SOLUSDT
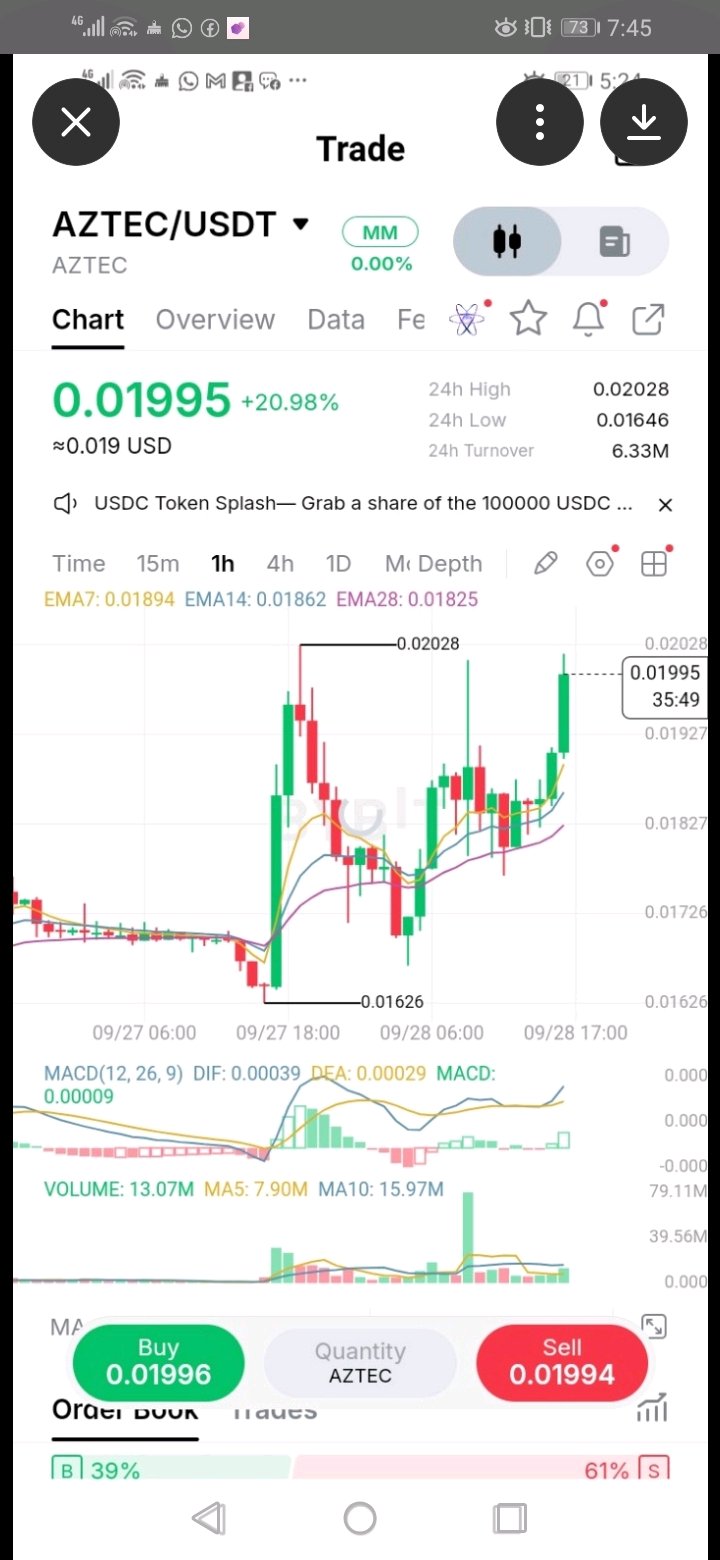
AZTEC/USDT — 1H Technical Analysis Based on the chart you shared, AZTEC is in a short-term bullish structure, but price is currently pressing into the 0.02028 resistance/24h high, so breakout confirmation matters. 📊 Key figures Current price: 0.01995 24H high / major resistance: 0.02028 24H low: 0.01646 EMA 7: 0.01894 EMA 14: 0.01862 EMA 28: 0.01825 MACD: bullish — DIF 0.00039 > DEA 0.00029 24H change: +20.98% Volume: 13.07M 🟢 Bullish setup The EMA alignment is constructive: EMA7 > EMA14 > EMA28, while price is above all three. MACD is also positive and the latest candle is pushing toward the previous high. Important breakout level: 0.02028 A sustained 1H candle close above 0.02028, preferably accompanied by increasing volume, would indicate that buyers have cleared the immediate resistance. Potential upside zones after confirmation: Target Level TP1 0.02080–0.02100 TP2 0.02170–0.02200 TP3 0.02280–0.02320 These are technical target zones rather than guaranteed outcomes. 🎯 Entry ideas Pullback entry: 0.01920 – 0.01950 This area is interesting because it is close to the recent breakout structure and above the EMA7. Breakout entry: > 0.02030 after a confirmed 1H close/retest. Avoid treating a brief wick above 0.02028 as confirmation. 🛑 Invalidation For the bullish setup: Aggressive invalidation: 1H close below 0.01860 Stronger structural invalidation: 1H close below 0.01825 A move below 0.01825 would put price back underneath the EMA28 and weaken the current bullish structure. 🔴 Bearish scenario If AZTEC rejects 0.02028 and loses: 0.01927 → 0.01894 → 0.01862 the momentum could weaken. Below 0.01825, the next notable downside areas visible on the chart are approximately: 0.01726 0.01626 ⚠️ Main thing to watch The coin has already moved roughly 21% in 24 hours, so chasing the green candle at 0.01995 carries more breakout/rejection risk than entering after a controlled pullback. Bullish trigger: 1H close above 0.02028 + volume Key support: 0.01862–0.01894 Major structural support: 0.01825 Main resistance: 0.02028 Question for the setup: Does AZTEC get a genuine 1H breakout above 0.02028, or does this become another rejection at the 24H high? #ByXIMPACT $AZTECUSDT $ETHUSDT
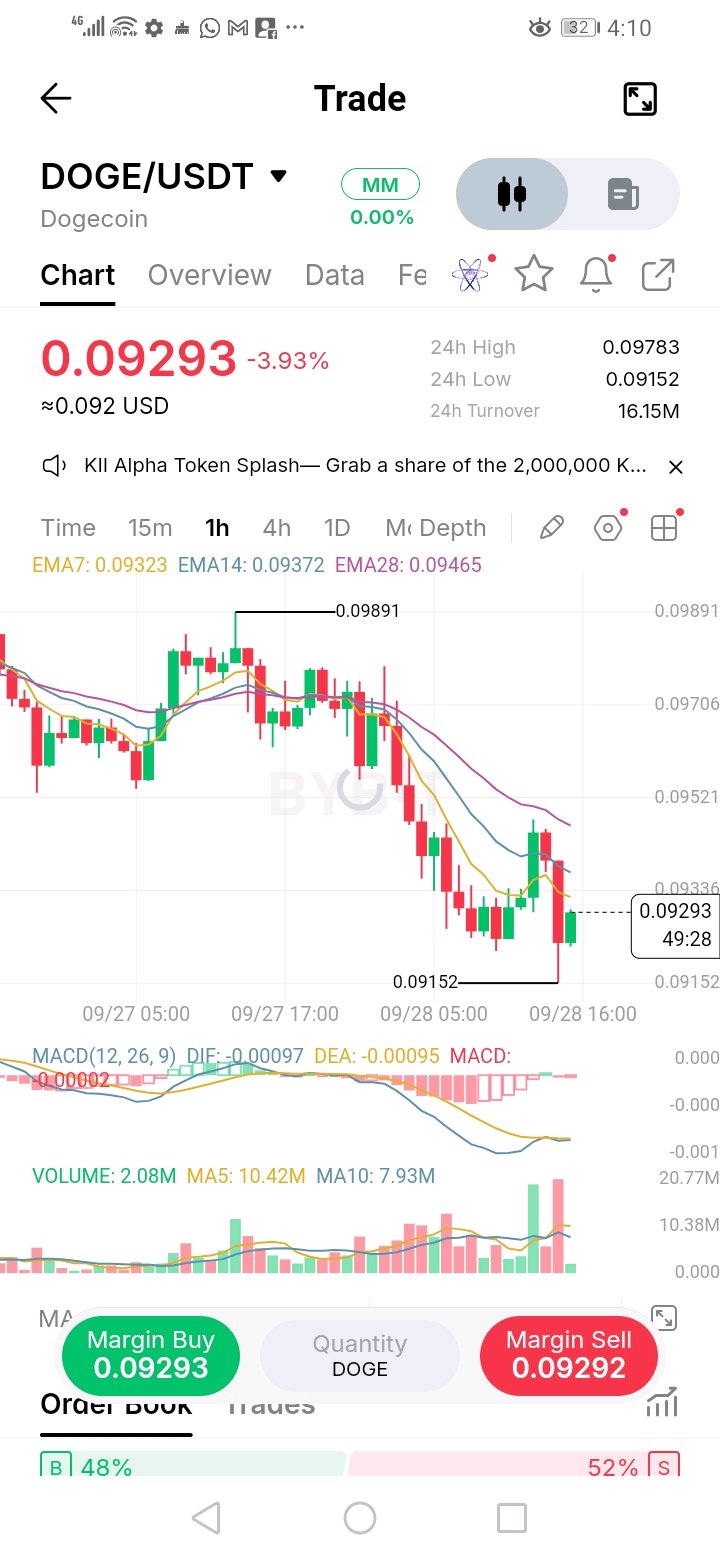
DOGE/USDT — 1H Technical Analysis Based on the chart you uploaded, DOGE is trading around 0.09293, down about 3.93%. The 1H structure remains bearish, but momentum is showing signs of slowing. Key figures Current: 0.09293 24H high: 0.09783 24H low: 0.09152 Chart swing high: 0.09891 Major swing low: 0.09152 EMA 7: 0.09323 EMA 14: 0.09372 EMA 28: 0.09465 📉 Structure The 1H structure is currently bearish: 0.09891 → lower highs → 0.09152 → weak rebound → rejection Price is below all three EMAs: EMA7 < EMA14 < EMA28 That alignment favors sellers until DOGE can reclaim the EMA cluster. Momentum MACD: DIF: -0.00097 DEA: -0.00095 MACD: approximately -0.00002 MACD remains negative, but the histogram is becoming less negative. That suggests selling momentum may be weakening, rather than confirming a bullish reversal. So the important distinction is: Bearish trend + potentially weakening bearish momentum. 🟢 Bullish scenario For bulls, the first important area is 0.0933–0.0937. A stronger bullish confirmation would be: 1H close above 0.0937 → reclaim 0.09465 → hold above it. Illustrative long setup: Level Price Entry zone 0.0937–0.0940 after confirmation TP1 0.09465 TP2 0.09520 TP3 0.09706 Extended target 0.0978–0.0989 Invalidation 1H rejection back below ~0.0930 I'd avoid treating the current 0.09293 price as a confirmed long signal because price is still underneath the EMA cluster. 🔴 Bearish scenario If DOGE continues failing around 0.0933–0.0940, sellers could retest the major support. Important bearish trigger: Break and 1H close below 0.09152. Illustrative short levels: Level Price Rejection-entry zone 0.0933–0.0938 TP1 0.09152 TP2 ~0.0905 TP3 ~0.0895 Invalidation Sustained 1H reclaim above ~0.0940–0.09465 🧱 Key support & resistance Support 0.09152 — major chart support / recent low 0.0905 — potential next downside area 0.0895 — secondary downside area Resistance 0.09323 — EMA7 0.09372 — EMA14 0.09465 — EMA28 0.09521 — horizontal resistance 0.09706 0.09783–0.09891 — major upper resistance zone 🎯 Most important level 0.0937–0.09465 is the decision zone. A recovery through this area would materially improve the short-term structure. Failure there keeps the bearish structure intact. Bullish confirmation: reclaim + hold above 0.09465. Bearish confirmation: rejection followed by loss of 0.09152. ⚠️ Invalidation Don't treat either scenario as guaranteed. A wick through a level isn't as significant as a 1H candle close and subsequent hold/retest. If you're preparing a ByX-style market post, the concise call could be: DOGE/USDT 1H: Bearish structure remains dominant below 0.09465, with price trading beneath EMA 7/14/28. Momentum is still negative, although MACD selling pressure appears to be weakening. 0.09152 is the critical support. Bulls need a reclaim of 0.0937, followed by 0.09465, to strengthen the recovery case. A confirmed break below 0.09152 would expose lower support zones around 0.0905–0.0895. #ByXIMPACT $DOGEUSDT $MNTUSDT
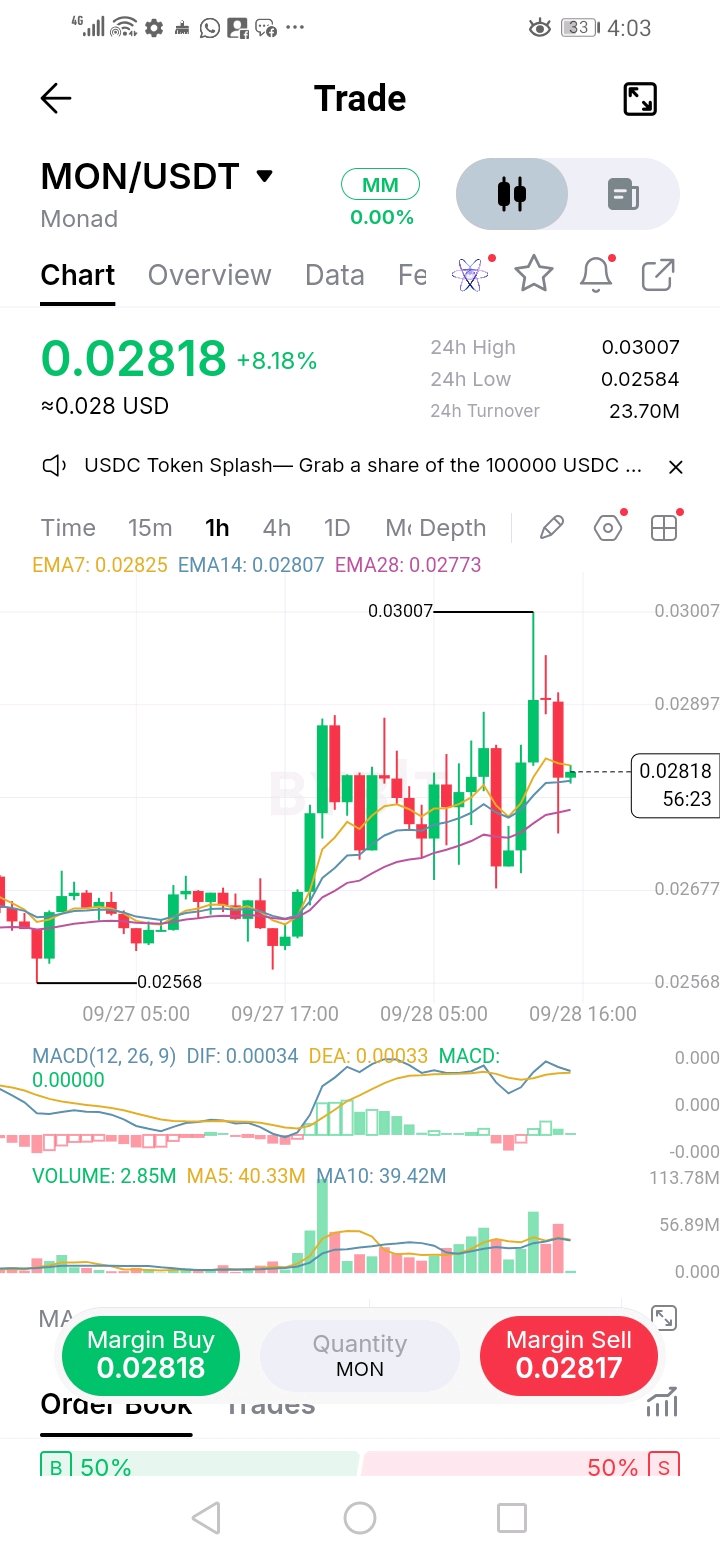
📊 Recent Market History MON hit an all-time high near $0.049 in late November 2025 and an all-time low near $0.016 in early February 2026. It has spent much of the months since trading in the low $0.02s, below its public-sale price and lagging despite fast growth in Monad's DeFi activity. The overhang to watch is supply: investor unlocks are due to begin about three months after mid-August, and the Foundation's offer to buy locked tokens from early investors drew very few takers. Today's move to 0.02818 (+8.18%) is a notable bounce off that 0.02–0.025 base, but I couldn't confirm a specific news catalyst for it. (defillama.com +2) MON/USDT — 1H Structure Breakdown 📌 Recommendation: Neutral-to-cautious. MON pushed to a spike high, was rejected hard, and is now sitting on its EMAs. This is a wait-for-direction chart, not a clean trend. 🎯 Key Points Structure: Base near 0.02568, a strong impulsive leg up, then a spike to 0.03007 that was immediately rejected. Price has since pulled back and is chopping around the EMA cluster at 0.02818. Volume: Current volume (2.85M) is far below MA5 (40.33M) and MA10 (39.42M). The most recent candles have cooled sharply after the earlier high-volume push. Support: EMA28 (0.02773) first, then EMA14 (0.02807) right at price, with 0.02677 and 0.02568 as deeper floors. Resistance: EMA7 (0.02825) just overhead, then 0.02897, with 0.03007 (spike high) as the major ceiling. ✅ Bullish Confirmation Reclaiming and holding above the EMA7 cluster (~0.02825) MACD DIF (0.00034) pulling back above DEA (0.00033) with a positive histogram A push through 0.02897 with renewed volume ❌ Bearish Confirmation A break below EMA28 (0.02773) and 0.02677 MACD flipping negative after this flat, indecisive reading Volume expanding on red candles ⛔ Invalidation Bulls invalidated: close below 0.02568 (the base low), which erases the whole recovery leg Bears invalidated: reclaim of 0.03007 with volume, which turns the rejection into a breakout ✅ Encouraged Confirmation Price is holding right at the EMA cluster rather than breaking down through it, so the structure is intact for now The earlier breakout leg carried strong volume, so this wasn't a thin move ❌ Discouraged Confirmation The sharp rejection wick from 0.03007 shows sellers defending that level heavily MACD is completely flat (histogram 0.00000), with no momentum in either direction Upcoming investor unlocks are a documented supply overhang that has capped MON's rallies Order book is a perfect 50/50, so there's no directional edge from positioning 🎯 Take Profit Levels (conditional on bullish confirmation, not guaranteed) TP1: 0.02897 (recent local resistance) TP2: 0.03007 (spike high) TP3: 0.0320 (extension if the breakout resumes) 💡 Suggestions This is a "let the EMA cluster resolve" chart: no edge yet, and the wick rejection plus the unlock overhang argue for patience 0.02773 (EMA28) is the level separating healthy consolidation from a deeper pullback #ByXIMPACT $MONUSDT $XRPUSDT
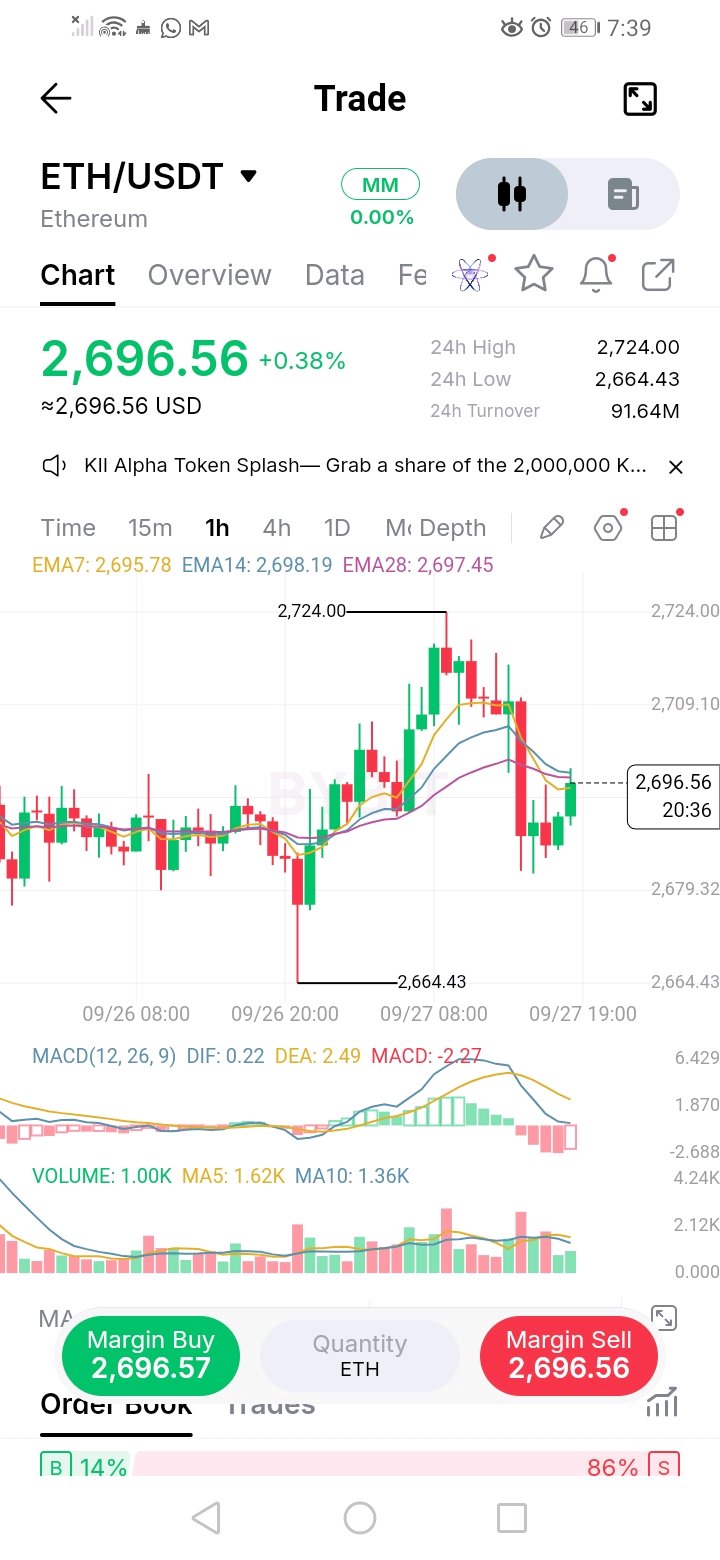
No solid current-week-specific news turned up — mostly stale or irrelevant prediction-market noise. I'll keep the market history section honest about that and lean on the chart's own structure. 🪙 About Ethereum (ETH) Ethereum is the leading smart-contract blockchain platform, launched in 2015, powering the majority of DeFi, NFT, and decentralized application activity in crypto. It shifted from Proof-of-Work to Proof-of-Stake in 2022 and remains the second-largest crypto asset by market cap. 📊 Recent Market History ETH has been trading in a broad, choppy range through late September, oscillating in the mid-$2,600s to high-$2,700s over the past several sessions. I couldn't confirm a specific news catalyst for this week's price action, so this chart's move should be read primarily through its own technical structure rather than an external story right now. ETH/USDT — 1H Structure Breakdown 📌 Recommendation: Neutral — ETH just spiked to a fresh high, reversed sharply, and is now stabilizing at a lower level. This looks like a failed breakout attempt that's cooling off, not a clean trend in either direction. 🎯 Key Points Structure: Long sideways chop, then a sharp impulsive spike to 2,724.00, followed by an equally sharp reversal down to 2,664.43, and now a small stabilization bounce back to 2,696.56 — a clear spike-and-fail pattern. Volume: Current volume (1.00K) is below MA5 (1.62K) but above MA10 (1.36K) — mixed signal, showing the market has calmed since the volatile reversal candles but hasn't fully quieted down. Support: EMA28 (2,697.45) sits almost exactly at current price, with 2,679.32 and 2,664.43 (session low) as the deeper levels below. Resistance: EMA7 (2,695.78) and EMA14 (2,698.19) are essentially at price right now, with 2,709.10 and 2,724.00 (session high) above that. ✅ Bullish Confirmation Holding above the EMA cluster (~2,696–2,698) and building a base here MACD histogram (-2.27) stopping its decline and turning back positive A push back through 2,709.10 with fresh volume ❌ Bearish Confirmation A break below 2,679.32, pushing toward a retest of 2,664.43 MACD DIF (0.22) continuing to fall further below DEA (2.49) Volume expanding on red candles, confirming the reversal is resuming ⛔ Invalidation Bulls invalidated: close below 2,664.43 (session low) — confirms the failed breakout is turning into a deeper move down Bears invalidated: reclaim of 2,724.00 with volume — would suggest the spike wasn't just a wick and the uptrend resumes ✅ Encouraged Confirmation Price has stabilized right at the EMA cluster rather than continuing to break down — the reversal hasn't extended further yet MACD, despite rolling over, hasn't fully collapsed — some tension remains rather than a clean bearish resolution ❌ Discouraged Confirmation Order book is heavily sell-skewed (86% S vs 14% B) — a significant imbalance that argues against assuming this stabilizes higher MACD has clearly rolled over from a positive peak into negative territory — momentum has genuinely shifted against the recent spike The spike to 2,724 followed by an immediate hard reversal is a classic "failed breakout / trap" pattern, often followed by further downside as trapped buyers exit 🎯 Take Profit Levels (conditional on bullish confirmation — not guaranteed) TP1: 2,709.10 (recent consolidation ceiling) TP2: 2,724.00 (session high) TP3: 2,743.21 (prior 24h high — full range reclaim) 💡 Suggestions This is a "let it prove direction" chart — the failed breakout pattern plus heavily sell-skewed order book both lean bearish short-term, despite MACD not being fully broken yet The EMA cluster (~2,696–2,698) is the level to watch; losing it decisively would favor further downside toward 2,664 Educational/informational analysis only — not financial advice, manage your own risk #ByXIMPACT $ETHUSDT
🪙 About Bitcoin (BTC) Bitcoin is the original cryptocurrency, launched in 2009 by the pseudonymous Satoshi Nakamoto as a peer-to-peer digital currency with no central authority. It remains the largest crypto asset by market cap and the primary benchmark for the entire market, with a fixed supply cap of 21 million coins. 📊 Recent Market History Bitcoin has had a choppy back half of 2026 — trading in the low-to-mid $70,000s through much of September after a summer that saw prices swing between roughly $63,000 and $90,000 across the year. Mid-September brought a notable rally, with BTC jumping 6.7% in a single day to around $86,600 on September 21st amid improving on-chain sentiment metrics (rising NUPL and reserve-risk readings pointing to renewed "Hope" phase conditions). This chart's current push toward 85,166 fits within that broader September recovery attempt, following a period of consolidation in the low $80Ks. BTC/USDT — 1H Structure Breakdown 📌 Recommendation: Bullish trend intact, but currently rejecting from a fresh high with a sharp reversal candle — treat this as a pullback within an uptrend rather than a fresh breakout entry. 🎯 Key Points Structure: Choppy basing phase from 83,620.1, followed by a strong impulsive breakout to 85,166.1, and now a sharp reversal candle pulling back hard to 84,552.7 — momentum has shifted abruptly in the most recent candle. Volume: Current volume (240.408) is above MA5 (183.064) and MA10 (166.196) — this pullback candle came with real volume, worth taking seriously as a short-term warning. Support: EMA28 (84,495.0) sits just below current price, with 84,006.6 as the next structural shelf and 83,620.1 as the session low. Resistance: EMA7 (84,764.5) and EMA14 (84,664.1) form a tight cluster just overhead, with 85,166.1 (session high) as the major ceiling. ✅ Bullish Confirmation Holding above EMA28 (84,495.0) on this pullback MACD still positive, DIF (182.2) well above DEA (168.4), histogram positive (13.8) despite the pullback candle A bounce reclaiming the EMA7/EMA14 cluster with fresh volume ❌ Bearish Confirmation A break below EMA28 (84,495.0) and the recent base MACD histogram contracting sharply after this reversal candle Continued volume on further red candles, confirming distribution at the top ⛔ Invalidation Bulls invalidated: close below 83,620.1 — would suggest the breakout has failed Bears invalidated: reclaim of 85,166.1 with volume — resumes the uptrend to fresh highs ✅ Encouraged Confirmation MACD remains solidly positive despite the pullback — the broader momentum hasn't flipped yet, just cooled Order book, while sell-leaning (57% S vs 43% B), isn't extreme — no panic signal there ❌ Discouraged Confirmation This pullback candle carries volume above both MA5 and MA10 — a real distribution signal, not just quiet profit-taking Order book sell-skew (57%) adds some near-term caution on top of the technical rejection BTC's broader 2026 history shows repeated failed breakouts near similar levels before larger corrections — worth respecting given this pattern 🎯 Take Profit Levels (conditional on bullish confirmation — not guaranteed) TP1: EMA7/EMA14 cluster (~84,700–84,765) TP2: 85,166.1 (session high) TP3: 86,000 (extension if trend resumes with strength) 💡 Suggestions This is a "wait for the pullback to prove itself" chart — MACD still favors bulls, but the volume-backed reversal candle and sell-heavy order book both argue against chasing right now EMA28 (~84,495) is the level that separates healthy pullback from a deeper correction #ByXIMPACT $BTCUSDT
🪙 About Pump.fun (PUMP) Pump.fun is a Solana-based meme-coin launchpad that lets users instantly create and trade custom tokens, and has become one of the most prolific token-launch platforms in crypto since debuting in January 2024. Its native token, PUMP, launched via ICO in July 2025, raising roughly $500 million and valuing the project near $4 billion at launch. The protocol earns revenue from trading and launch fees, and has been running aggressive open-market buybacks to reduce circulating supply. 📊 Recent Market History PUMP has had a genuinely strong 2026, doubling in value earlier in the year on rising protocol usage and revenue, then extending further as buyback activity accelerated — since July, the protocol has bought back over $30 million worth of PUMP, easing sell pressure from early investors. More recently, PUMP saw a sharp ~42% weekly rally alongside record revenue days, though this was quickly followed by warnings of an overbought pullback after RSI hit extreme levels near 88, with one analysis flagging up to 26% downside risk after the token failed to hold above key resistance. This chart's current move — up 7.43% intraday off a base near 0.003806 — fits within that pattern of sharp, fundamentals-backed rallies that have periodically overheated and needed to cool off. PUMP/USDT — 1H Structure Breakdown 📌 Recommendation: Bullish structure, but with a recent history of overbought pullbacks — this looks like a healthy basing/recovery phase rather than a fresh breakout, so manage expectations around chase risk. 🎯 Key Points Structure: Strong impulsive rally from 0.003806 to a peak of 0.004626, followed by a pullback and now a stabilizing base around 0.0042–0.0044 — consolidation after a strong trend leg. Volume: Current volume (44.46M) is well below MA5 (62.00M) and MA10 (112.51M) — participation has cooled significantly since the initial rally, typical of a post-spike pause. Support: EMA28 (0.004350) sits just below current price, then 0.004216 and 0.004011 as deeper structural shelves. Resistance: EMA7 (0.004397) and EMA14 (0.004403) form a tight cluster just overhead, with 0.004626 (session high) as the major ceiling. ✅ Bullish Confirmation Reclaiming and holding above the EMA7/EMA14 cluster (~0.0044) MACD histogram (currently -0.000027) stopping its decline and turning back positive A push through 0.004626 with renewed volume ❌ Bearish Confirmation A break below EMA28 (0.004350) and the base MACD DIF (0.000047) continuing to converge with and cross below DEA (0.000074) Volume picking up on red candles, confirming a deeper pullback ⛔ Invalidation Bulls invalidated: close below 0.004011 — would suggest the rally structure has failed Bears invalidated: reclaim of 0.004626 with volume — resumes the uptrend ✅ Encouraged Confirmation Order book is heavily buy-skewed (85% B vs 15% S), a strong signal of underlying demand Real fundamental support behind the broader move — genuine revenue growth and active buyback mechanism, not pure speculation ❌ Discouraged Confirmation PUMP has a documented recent history of sharp rallies followed by overbought pullbacks (RSI hitting extreme levels near 88 in a prior rally, with an analyst-flagged ~26% downside risk after a similar setup) — this pattern is worth respecting even during strength Volume has notably cooled from the rally's peak, meaning the current base lacks strong fresh buying conviction yet 🎯 Take Profit Levels (conditional on bullish confirmation — not guaranteed) TP1: 0.004626 (session high) TP2: 0.0050 (round-number extension) TP3: 0.0055 (extension if momentum resumes strongly) 💡 Suggestions Order book and fundamentals both favor bulls, but PUMP's recent history of overheating after fast rallies makes this a "confirm before chasing" setup A reclaim of the EMA cluster (~0.0044) would be the cleaner signal to watch versus buying the current drift Educational/informational analysis only — not financial advice, manage your own risk #ByXIMPACT $PUMPUSDT
🪙 About Pendle (PENDLE) Pendle is a DeFi protocol that lets users tokenize and trade future yield from yield-bearing assets, effectively allowing fixed-yield strategies and yield speculation on-chain. In January 2026, Pendle overhauled its tokenomics, replacing the older vePENDLE system with liquid sPENDLE and routing up to 80% of protocol revenue into open-market PENDLE buybacks. 📊 Recent Market History That buyback mechanism has become Pendle's defining recent story — the last several epochs saw buybacks running at roughly 3.77x the rate of new token issuance, meaningfully shrinking net circulating supply. On top of that, Pendle expanded distribution by launching on Robinhood Chain on September 8, 2026, with an institutional "Permissioned Markets Pilot" and a Curator Module both slated for the following months. This combination of structural buyback demand and expanding institutional access has been the core bullish narrative feeding into PENDLE's price this year, even as the token remains well off its all-time high near $7.51. The current chart's range (2.49–2.68) is consistent with this steadier, fundamentals-driven grind rather than pure speculative momentum. PENDLE/USDT — 1H Structure Breakdown 📌 Recommendation: Neutral-to-constructive — PENDLE spiked, pulled back hard, based, and is now recovering steadily. Structure favors a slow grind higher rather than a sharp breakout right now. 🎯 Key Points Structure: Sharp spike to 2.684, a steep pullback to 2.491, then a steady stair-step recovery back to the current 2.574 — a V-shaped reversal that's since matured into a controlled uptrend. Volume: Current volume (850.79) is far below MA5 (4.49K) and MA10 (5.67K) — this recovery phase has been happening on progressively lighter volume, consistent with a calm grind rather than an aggressive push. Support: EMA28 (2.565) sits just below current price, with EMA14 (2.575) essentially at price and 2.491 (session low) as the deeper floor. Resistance: EMA7 (2.582) just overhead, then 2.625 (24h high) and 2.684 (spike high) above that. ✅ Bullish Confirmation Holding above the EMA cluster (~2.565–2.582) on any pullback MACD still positive, DIF (0.011) above DEA (0.009), histogram positive (0.001) A push through 2.625 with renewed volume, opening room toward the spike high ❌ Bearish Confirmation A break below EMA28 (2.565) and the recovery structure MACD histogram contracting back toward zero Volume picking up on red candles, confirming a fresh leg down ⛔ Invalidation Bulls invalidated: close below 2.491 — would suggest the recovery has fully failed Bears invalidated: reclaim of 2.684 with volume — resumes the spike move to new highs ✅ Encouraged Confirmation Order book is close to balanced with a slight buy lean (51% B vs 49% S), consistent with the steady grind-higher structure The buyback tokenomics mechanism provides a structural demand floor that's somewhat independent of short-term sentiment — a genuine fundamental tailwind ❌ Discouraged Confirmation Volume has been consistently fading through this entire recovery leg — there's no strong fresh buying conviction pushing this higher, just gradual drift PENDLE remains down significantly from its all-time high, and 7-day/30-day price swings in its history show this token can reverse sharply even during "constructive" phases 🎯 Take Profit Levels (conditional on bullish confirmation — not guaranteed) TP1: 2.625 (24h high) TP2: 2.684 (spike high) TP3: 2.75 (extension if the recovery gains fresh momentum) 💡 Suggestions This is a "steady, not spectacular" setup — real buyback-driven fundamentals support the token, but current price action lacks strong volume conviction EMA28 (~2.565) is the level to watch for confirming the recovery stays intact #ByXIMPACT $PENGUUSDT
🪙 About Drift Protocol (DRIFT) Drift is a decentralized exchange built on Solana, offering low-slippage spot and perpetual futures trading through a combination of on-chain orderbooks and automated market makers. DRIFT is its governance token, giving holders a say in protocol decisions and access to trading incentives. 📊 Recent Market History DRIFT has had a brutal 2026, down roughly 97% on a rolling one-year basis after peaking near $2.60 back in late 2024. The token spent much of the year grinding to new all-time lows (around $0.015–$0.016) despite the protocol itself maintaining meaningful revenue and TVL in the hundreds of millions — a classic case of token price disconnecting from underlying protocol fundamentals. I couldn't confirm a specific news catalyst for this week's price action, so this chart's move should be read primarily as a technical bounce attempt within a longer-term downtrend rather than a fundamentals-driven reversal. DRIFT/USDT — 1H Structure Breakdown 📌 Recommendation: Cautious — DRIFT had a strong bounce off its base but is now breaking down from a lower-high pattern, currently down nearly 3% intraday. This looks like a fading rally attempt, not a confirmed reversal. 🎯 Key Points Structure: Sharp bounce from a low of 0.01827 to a spike high of 0.02103, followed by a choppy lower-high pattern and a fresh breakdown in the most recent candle — momentum has clearly shifted from the initial bounce. Volume: Current volume (1.99M) is well above MA5 (558.13K) and MA10 (689.96K) — the breakdown candle came with a real volume spike, a meaningful bearish signal. Support: 0.01827 (session low) is the key floor below current price. Resistance: EMA7/EMA14/EMA28 are now clustered tightly overhead (~0.0195–0.0196) after price broke below them, with 0.02103 (spike high) further above. ✅ Bullish Confirmation Reclaiming and holding above the EMA cluster (~0.0195–0.0196) MACD histogram (-0.00008) stopping its decline and turning back positive A bounce off current levels with fading volume on any further downside ❌ Bearish Confirmation Continued closes below 0.0191, pushing toward a retest of 0.01827 MACD DIF (-0.00002) continuing to diverge further below DEA (0.00006) Volume remaining elevated on further red candles, confirming distribution ⛔ Invalidation Bulls invalidated: clean break and close below 0.01827 — confirms the bounce has fully failed Bears invalidated: strong reclaim of the EMA cluster and 0.02103 with volume — would suggest a real reversal is forming ✅ Encouraged Confirmation Order book still leans buy-side (70% B vs 30% S) despite the recent breakdown candle — some underlying demand remains The broader bounce off 0.01827 still shows a higher low structurally, even if the most recent candle is bearish ❌ Discouraged Confirmation This is a long-term downtrending, low-cap token (down ~97% over the past year) — bounces like this have repeatedly failed to hold in DRIFT's recent history The breakdown candle carried unusually high volume relative to the rest of the session — a real distribution signal, not just drift MACD has fully rolled over into negative territory, confirming momentum has shifted against the bounce 🎯 Take Profit Levels (conditional on bullish confirmation — not guaranteed) TP1: EMA cluster (~0.0196) TP2: 0.02034 (mid-range level) TP3: 0.02103 (spike high — full range reclaim) 💡 Suggestions Given DRIFT's brutal long-term downtrend and this session's volume-backed breakdown, treat this as a high-risk bounce attempt rather than a trend reversal 0.01827 is the critical level; losing it with volume would likely resume the broader downtrend #ByXIMPACT $DRIFTUSDT
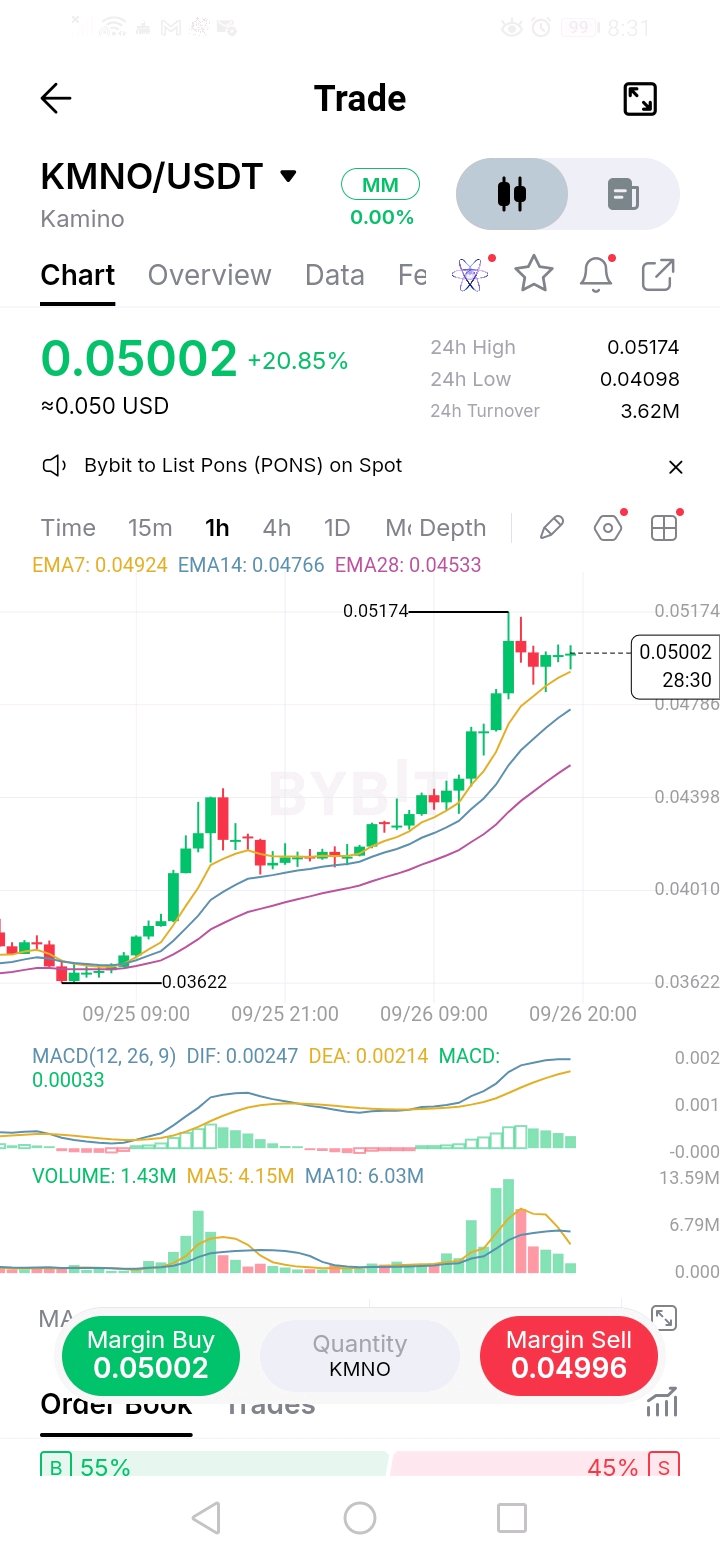
No solid week-specific news turned up for KMNO — mostly stale pricing data. I'll keep the market history section honest about that and lean on the chart's own structure as the primary signal. 🪙 About Kamino (KMNO) Kamino Finance is a lending, borrowing, and liquidity protocol built on Solana, offering automated yield strategies and leveraged positions across DeFi. KMNO is its governance token, used for protocol voting and incentive programs. 📊 Recent Market History KMNO has had a volatile year, having spent much of mid-2026 trading in a depressed range (roughly $0.015–$0.02) after falling sharply from its December 2024 all-time high near $0.36. More recently, broader reporting shows the token up significantly on a rolling one-year basis, suggesting a real recovery has been building beneath the surface. I couldn't confirm a specific news catalyst for this week's sharp move, so the +20.85% intraday breakout on this chart should be read primarily through its own technical structure rather than an external story right now. KMNO/USDT — 1H Structure Breakdown 📌 Recommendation: Strongly bullish — KMNO is in the midst of a powerful breakout, up nearly 21% intraday with a clean uptrend structure. This is a high-momentum move, best suited to managing an existing position rather than chasing fresh size at the top. 🎯 Key Points Structure: Sharp reversal off a base near 0.03622, accelerating into a strong impulsive breakout to 0.05174 — clean higher-highs, higher-lows throughout, now consolidating just under the high. Volume: Current volume (1.43M) is below MA5 (4.15M) and MA10 (6.03M) — the recent pullback/consolidation candles are on lighter volume than the breakout itself, a mildly reassuring sign. Support: EMA7 (0.04924) is the immediate cushion, then EMA14 (0.04766), with 0.04010 as a deeper structural shelf. Resistance: 0.05174 (session high) is the only real ceiling directly overhead — this is fresh territory beyond that. ✅ Bullish Confirmation Holding above EMA7 (0.04924) on this consolidation MACD strongly positive, DIF (0.00247) above DEA (0.00214), histogram positive (0.00033) A push back through 0.05174 with fresh volume, extending the breakout ❌ Bearish Confirmation A break below EMA14 (0.04766) — first structural warning after this sharp run MACD histogram contracting quickly Heavy volume on a red candle, signaling distribution at the highs ⛔ Invalidation Bulls invalidated: close below 0.04010 — would suggest the breakout has failed Bears invalidated: reclaim of 0.05174 with volume — confirms trend continuation ✅ Encouraged Confirmation Order book leans buy-side (55% B vs 45% S), aligning with the bullish structure The breakout leg itself was backed by a strong volume spike, well above the recent average — this was a real move, not a thin wick ❌ Discouraged Confirmation No confirmed news catalyst found for this specific move — without a clear fundamental driver, sharp low-cap breakouts like this can reverse quickly Price is up ~21% intraday alone — statistically elevated pullback/retracement risk after such a fast move This remains a smaller-cap, historically volatile token — position sizing should reflect that added risk 🎯 Take Profit Levels (conditional on bullish confirmation — not guaranteed) TP1: 0.05174 (immediate session high) TP2: 0.055 (round-number extension) TP3: 0.060 (measured-move extension from the breakout range) 💡 Suggestions Technical structure is strongly bullish, but the lack of a confirmed news catalyst plus KMNO's small-cap volatility history both argue for tight risk management here A pullback to EMA14 (~0.0477) would offer a healthier entry than chasing current price Educational/informational analysis only — not financial advice, manage your own risk #ByXIMPACT $KMNOUSDT
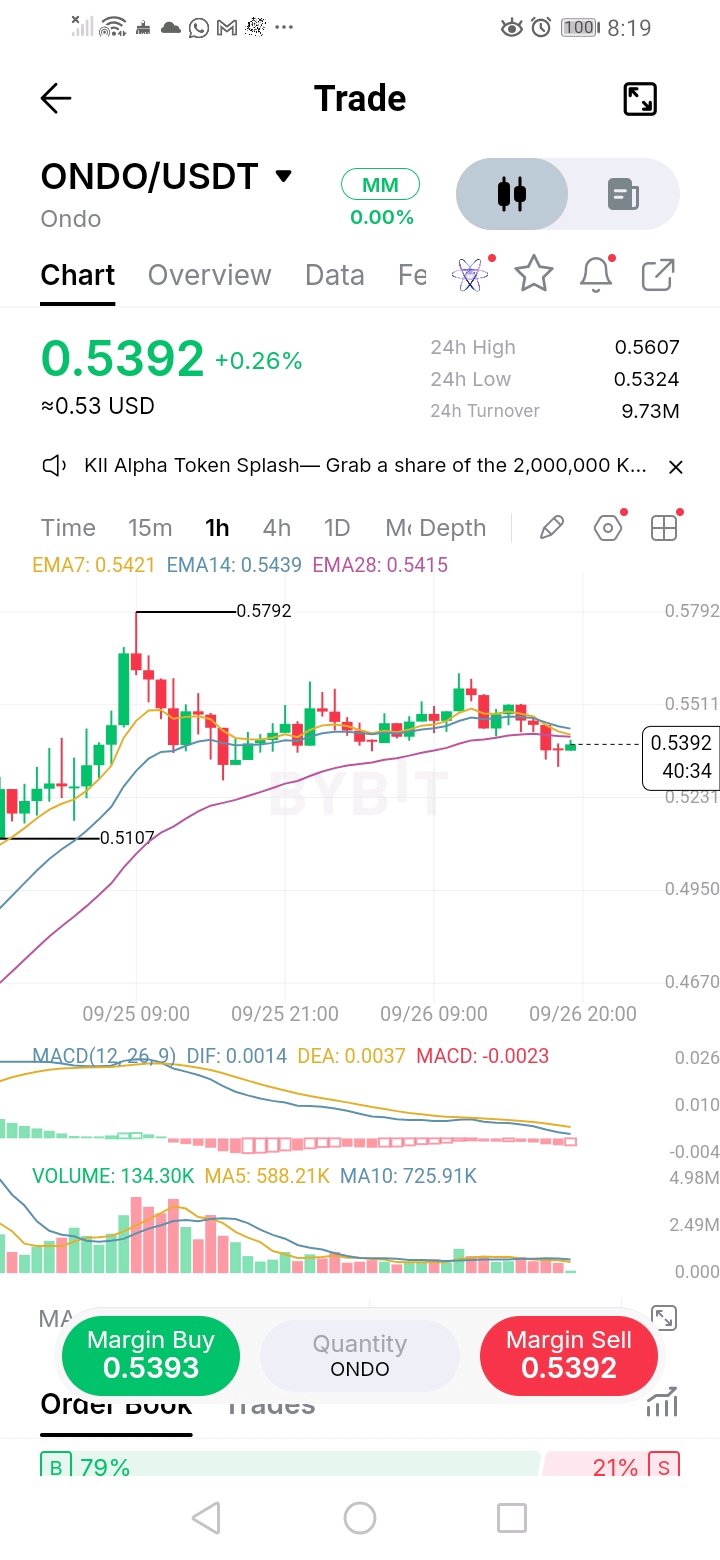
📊 Recent Market History ONDO's 2026 has been a story of strong fundamental growth clashing with weak token price performance. Protocol TVL has scaled dramatically — reaching records above $3.5 billion at points in the year — driven by tokenized Treasury products and expansion into tokenized U.S. stocks on additional chains like Solana. Despite this, the token itself has struggled, repeatedly trading well below its all-time high, with commentary pointing to governance/value-capture concerns (the token doesn't directly capture protocol revenue) and ongoing supply unlock pressure as headwinds. There have been sharp speculative rallies tied to specific catalysts — such as a ~70% weekly surge in May tied to a DTCC tokenization pilot — but these have tended to fade rather than sustain. This chart's current range (0.53–0.58) sits well below ONDO's broader historical highs, consistent with that pattern of strong news, weak follow-through. ONDO/USDT — 1H Structure Breakdown 📌 Recommendation: Neutral-to-cautious — ONDO is pulling back from a recent spike high and consolidating in a tightening range. Order book is buy-heavy, but momentum has cooled. 🎯 Key Points Structure: Sharp impulsive spike to 0.5792, followed by a pullback into a choppy sideways range (roughly 0.52–0.55), now drifting toward the lower end of that range at 0.5392. Volume: Current volume (134.30K) is well below MA5 (588.21K) and MA10 (725.91K) — participation has dropped off significantly since the initial spike, typical of post-spike consolidation. Support: EMA28 (0.5415) sits almost exactly at current price, with 0.5107 as the deeper structural low. Resistance: EMA7 (0.5421) and EMA14 (0.5439) form a tight overhead cluster, with 0.5792 (spike high) well above that. ✅ Bullish Confirmation Reclaiming and holding above the EMA7/EMA14 cluster (~0.542–0.544) MACD histogram stopping its decline (currently -0.0023) and turning back positive A push through 0.5511 (recent local resistance) with volume ❌ Bearish Confirmation A break below EMA28 (0.5415) and the broader range floor MACD DIF (0.0014) continuing to fall further below DEA (0.0037) Volume expanding on red candles, confirming range breakdown ⛔ Invalidation Bulls invalidated: close below 0.5107 — would suggest the entire recovery structure has failed Bears invalidated: reclaim of 0.5792 with volume — resumes the spike move to new highs ✅ Encouraged Confirmation Order book is heavily buy-skewed (79% B vs 21% S), suggesting underlying demand despite the price drift Price is holding just above EMA28 rather than breaking down through it — the base hasn't failed yet ❌ Discouraged Confirmation MACD has been negative and declining for several candles now — momentum clearly favors sellers short-term despite the buy-heavy order book ONDO's broader 2026 history shows a repeated pattern of spikes fading without follow-through — this consolidation could resolve lower given that track record Volume has dried up significantly since the spike, meaning there's little conviction behind either the bulls or bears right now 🎯 Take Profit Levels (conditional on bullish confirmation — not guaranteed) TP1: 0.5511 (recent local resistance) TP2: 0.5607 (24h high) TP3: 0.5792 (spike high — full range reclaim) 💡 Suggestions This is a "let it settle" chart — order book sentiment is bullish, but momentum and ONDO's historical pattern both urge caution against assuming an easy continuation EMA28 (~0.5415) is the level that separates healthy consolidation from a deeper pullback #ByXIMPACT $ONDOUSDT