Fancy
15421Like0Shares283Fans11Follow
I'm following you
I'm following you
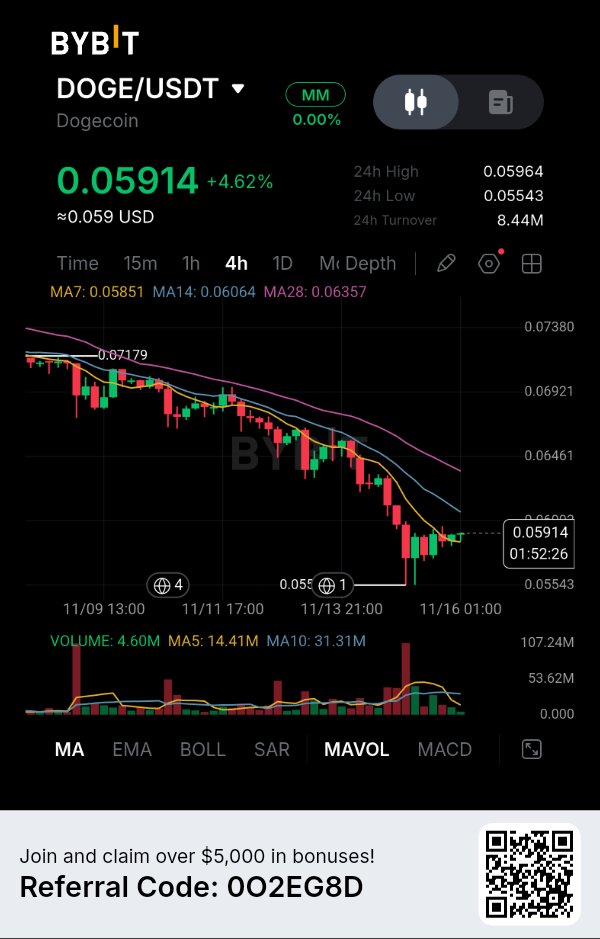
$DOGEUSDT — Dogecoin Is Recovering, But the Bigger Trend Has Not Changed Yet. Dogecoin has gained 4.62% in your 4H screenshot, but I am not convinced that buyers have regained control. The interesting part is that DOGE has bounced from its recent low while remaining below two important moving averages. At the same time, something is changing behind the project: developers are working to give DOGE more practical uses through an application ecosystem. This creates an interesting contrast between improving utility and a technically weak market structure. MARKET DATA — BYBIT 4H CHART According to your chart: * Price: $0.05914 * 24H change: +4.62% * 24H high: $0.05964 * 24H low: $0.05543 * 24H turnover: $8.44M * MA7: $0.05851 * MA14: $0.06064 * MA28: $0.06357 For today's separate market snapshot, November 16, CoinMarketCap reports DOGE around $0.05895, approximately $9.24 billion market capitalization and $1.15 billion in 24H volume. Circulating supply is approximately 156.76 billion DOGE, with no fixed maximum supply. WHAT THE CHART IS REVEALING DOGE has been moving inside a declining structure, falling from the visible $0.07179 region toward $0.05543. Buyers have recently defended the lower area and pushed price back above MA7 at $0.05851. However, MA14 at $0.06064 and MA28 at $0.06357 remain overhead resistance. Another detail deserves attention: displayed volume is 4.60M, compared with MA5 volume of 14.41M and MA10 volume of 31.31M. This suggests the latest recovery has not yet attracted participation comparable to previous trading activity. For me, $0.06064 is the first important level buyers need to reclaim. THE DEVELOPMENT MOST PEOPLE SHOULD WATCH Dogecoin's ecosystem is attempting to move beyond simple transfers and payments. On November 11, DogeOS announced that its first version was developed and audited, with mainnet described as very close, although no confirmed launch date was provided. The project aims to introduce an Ethereum-compatible application layer supporting DeFi, trading, lending and gaming. More than 100 builders are reportedly working on applications. What makes this particularly interesting is that DogeOS intends to use DOGE for transaction fees rather than introducing another native token. However, there is an important limitation: DogeOS is a separate application layer, not a direct upgrade to Dogecoin's base blockchain. Its current security model still relies on selected validators, while a proposed upgrade for native zero-knowledge proof verification has not been approved. THE TOKEN VALUE QUESTION I keep coming back to one issue. If DogeOS successfully attracts developers and applications, DOGE could gain additional utility through transaction fees and application activity. But development completion does not guarantee user adoption. The real evidence will come from actual application usage, transaction demand and the amount of DOGE circulating through these new services. Dogecoin has an established network and substantial liquidity, but its inflationary supply structure also means demand needs to remain relevant over time. MY TRADING PLAN — CONDITIONAL SHORT The broader 4H structure still favors sellers, despite the recent bounce. Trigger: Rejection around $0.0600–$0.0606, followed by a 4H close below $0.0585. Entry: $0.0582–$0.0585. Stop-loss: $0.0600. TP1: $0.0565. TP2: $0.05543. TP3: $0.0535. Using a representative entry of $0.05835: Potential downside to TP3: 8.32%. Defined risk: 2.83%. Estimated risk-to-reward: 2.94:1. This setup is conditional. I would not enter without the resistance rejection and subsequent breakdown. MY FINAL VIEW Dogecoin is entering an interesting development phase. DogeOS could give DOGE additional financial applications, but the market still needs evidence that developers can turn this infrastructure into consistent user activity. I don't think the most important question is whether Dogecoin can attract more attention. It's whether Dogecoin can evolve from an asset people primarily hold and transfer into one they have additional reasons to actively use. That transition could become more important for DOGE's long-term value than another short-lived price recovery. $DOGEUSDT #ByXIMPACT

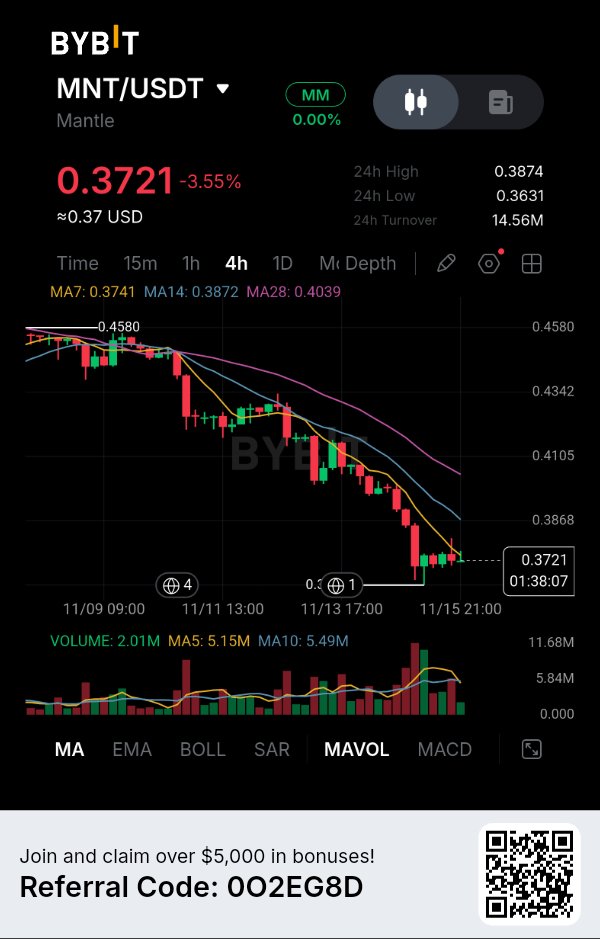
The Selling Pressure Has Not Disappeared — Another Resistance Test Could Create an Opportunity. Mantle is struggling to recover after an extended decline, and one detail on this 4-hour chart deserves attention: price is consolidating near its recent low while all three moving averages remain positioned above it. This suggests that buyers are attempting to stabilize the market, but sellers still have control over the broader structure. I am particularly interested in whether the next recovery toward resistance will attract buyers or simply give sellers another opportunity. MARKET STRUCTURE — THE DOWNTREND REMAINS IN CONTROL MNT is currently trading around $0.3721, down 3.55%, with a 24-hour high of $0.3874 and a low of $0.3631. Looking at the 4-hour chart, Mantle has declined from approximately $0.4580, creating a persistent sequence of lower highs and lower lows. The previous recovery attempts have repeatedly failed to establish a meaningful bullish reversal. More recently, sellers accelerated the decline toward $0.3631. Price has since started moving sideways around $0.37, but this consolidation has not yet produced a convincing structural recovery. For me, the important question is whether this sideways movement represents temporary stabilization or simply a pause within the existing downtrend. THE MOVING AVERAGES ARE STILL FAVORING SELLERS Three technical readings stand out: - MA7: $0.3741 - MA14: $0.3872 - MA28: $0.4039 All three moving averages are above the current price. Their positioning is also bearish, with MA7 below MA14 and MA14 below MA28. This arrangement reflects persistent weakness across the displayed moving-average periods. The first resistance area is around $0.3741, followed by $0.3872. Above these levels, MA28 near $0.4039 represents a much stronger recovery challenge. What interests me most is the gap between current price and MA28. Buyers have considerable technical resistance to overcome before the broader structure can improve. VOLUME — THE MARKET IS LOSING PARTICIPATION The volume data provides another useful perspective: - Current volume: 2.01M - MA5: 5.15M - MA10: 5.49M Current volume is significantly below both displayed averages. This suggests that recent trading participation has cooled compared with the preceding activity. I would not automatically interpret declining volume as accumulation or distribution. However, it tells me that the current consolidation is not yet supported by convincing buying participation. If MNT attempts another recovery, I want to see volume expand alongside price. Without that confirmation, a move toward resistance could struggle to attract sustained demand. THE IMPORTANT DETAIL — $0.3631 The recent low is becoming the most important reference point for this setup. Buyers have managed to prevent an immediate continuation below $0.3631, but they have not yet demonstrated the strength required to reclaim the moving-average resistance cluster. This creates an interesting market situation. Price is attempting to stabilize, but the broader structure remains bearish. If MNT recovers toward $0.3741–$0.3872 and sellers defend that region again, the market could revisit its recent low. A decisive breakdown below $0.3631 would create the possibility of another downside extension. On the other hand, reclaiming $0.3872 with stronger volume would weaken my current bearish interpretation. MY TRADING STRATEGY — SHORT My preferred direction is SHORT because the prevailing market structure and moving-average alignment continue to favor sellers. I would rather wait for a recovery into resistance than chase MNT near its current support. - Direction: SHORT - Entry Zone: $0.3790–$0.3860 - Confirmation: 4H bearish rejection from the entry zone. - Stop Loss: $0.3970 - TP1: $0.3631 - TP2: $0.3500 - TP3: $0.3380 Estimated Risk/Reward: Approximately 1:1.5 to 1:3.5, depending on entry and execution. TP1 is based on the visible chart low, while TP2 and TP3 are projected downside extensions rather than confirmed support levels shown in the screenshot. A sustained 4-hour move above $0.3970 would invalidate this setup. If MNT continues falling without offering the planned entry, I would avoid chasing the move. WHAT COULD CHANGE MY VIEW? A convincing recovery above $0.3872, followed by stronger buying volume and progress toward $0.4039, would make me reconsider the bearish outlook. That would indicate buyers are beginning to challenge the structure that has controlled the decline. FINAL THOUGHT Mantle is approaching an important decision point. The market has slowed its decline, but slowing down is not the same as reversing direction. The next resistance test could reveal whether buyers are finally gaining strength or whether sellers still have unfinished business. $MNTUSDT #ByXIMPACT

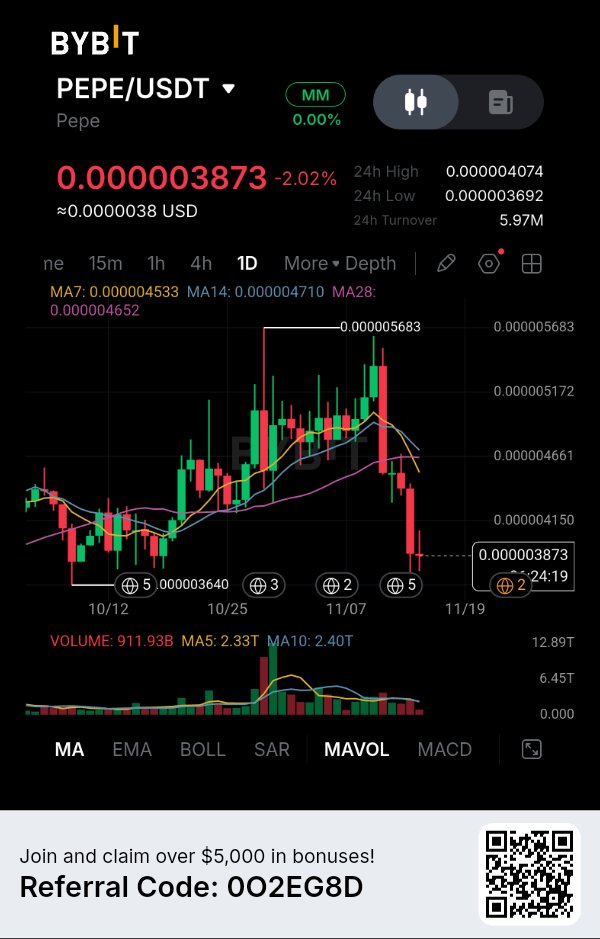
$PEPEUSDT — The rally toward $0.00000568 has completely changed character, and I'm watching whether sellers can turn the next recovery into another lower high. What makes this chart interesting to me is how quickly PEPE lost the ground it had gained during the previous rally. On the daily chart, PEPE climbed toward $0.000005683, but buyers failed to maintain that momentum. Price has since experienced a sharp rejection and is now trading around $0.000003873, down 2.02%. The important part isn't simply the size of the decline. It's where price is trading in relation to its moving averages. The MA7 is currently around $0.000004533, the MA14 around $0.000004710, and the MA28 around $0.000004652. All three are above the current price, suggesting that the recovery still has significant resistance to overcome. There is another level I don't want to ignore. PEPE recently approached the $0.000003692 area, while the previous visible support sits around $0.000003640. This is where I want to see how buyers respond. A bounce from this region is possible, but I wouldn't consider it a bullish reversal unless price starts reclaiming the moving averages and establishing higher lows. My preferred approach is to wait for a recovery toward $0.00000445–$0.00000465. If sellers reject that region on the daily chart, it could provide a more structured opportunity to follow the existing bearish momentum. I'm not interested in chasing the decline at current levels. I want the market to offer a better entry rather than selling after the move has already happened. My conditional trading plan: * Direction: SHORT * Entry Zone: $0.00000445–$0.00000465 * Stop Loss: $0.00000480 * TP1: $0.000003873 * TP2: $0.000003692 * TP3: $0.000003400 (projected extension) The setup requires a confirmed bearish rejection from the entry zone. A sustained daily recovery above $0.00000480 would invalidate this particular idea. I've seen meme coins recover sharply after aggressive sell-offs, so I don't want to assume that every breakdown will continue. If buyers reclaim the moving-average cluster, I'll reconsider the bearish outlook. For now, the question isn't how quickly PEPE can return to its previous high. It's whether buyers can defend the recent lows before sellers attempt another leg down. $PEPEUSDT #ByXIMPACT

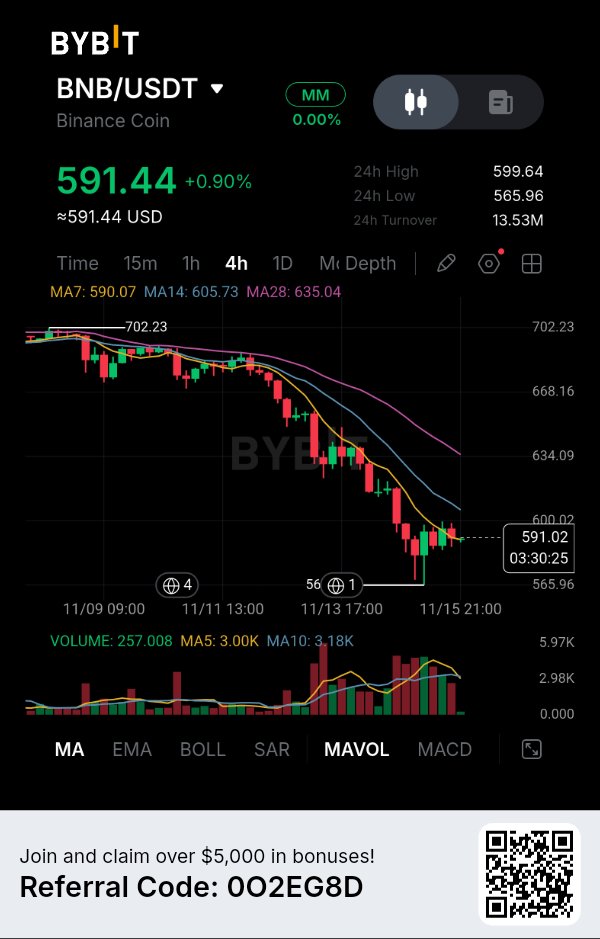
$BNBUSDT — Network Activity Remains High, But the Token Is Struggling to Recover. BNB is showing a small recovery on the 4H chart, but I don't think buyers have regained control yet. The interesting part is that BNB Chain continues processing millions of transactions while its native token is trading well below its recent price levels. This creates an important distinction between network activity and market demand. A busy blockchain does not automatically mean its native asset must appreciate. MARKET DATA — BYBIT 4H CHART According to your chart: Price: $591.44 24H change: +0.90% 24H high: $599.64 24H low: $565.96 24H turnover: $13.53M MA7: $590.07 MA14: $605.73 MA28: $635.04 For separate market context, the latest November 15 aggregated snapshot reports BNB around $598.52, with approximately $78.58B market capitalization and $1.48B futures volume. These figures are separate from your chart snapshot. WHAT THE CHART IS REVEALING BNB has experienced a sustained decline from the visible $702.23 region. The recent selling pushed price toward $565.96, where buyers attempted a recovery. Price has now moved slightly above MA7 at $590.07, but MA14 at $605.73 and MA28 at $635.04 remain overhead. This is an important distinction: the short-term bounce is visible, but the broader 4H structure remains weak. The $599–$606 region is the immediate resistance area I am watching. Meanwhile, $565.96 remains the important support. THE FUNDAMENTAL SIDE — BNB CHAIN IS STILL EXPANDING One development worth watching is the upcoming Jenner upgrade. On November 3, BNB Chain released version 1.8.2, scheduling the BSC mainnet Jenner hard fork for December 8, 2026. One important addition is Payment Lane, which reserves 5% of block gas capacity by default for eligible BNB transfers and approved payment transactions. This matters because BNB Chain is trying to make payment transactions more reliable during periods of network congestion. There is also measurable network activity. On November 14, BNB Smart Chain recorded approximately 17.42 million transactions, while network fees reached 713.21 BNB for that day. Its stablecoin supply stood around $11.56 billion. These figures suggest that BNB Chain has substantial usage beyond speculative trading. TOKEN ECONOMICS — THE BURN MECHANISM On October 19, BNB Chain completed its 37th quarterly burn, removing 1,646,196.44 BNB from circulation, worth approximately $1.197 billion at the time. The remaining supply was reported at approximately 131.51 million BNB. BNB also serves as the gas and governance asset across the BNB Chain ecosystem. What interests me is the combination of network utility and systematic supply reduction. However, burns do not guarantee price appreciation, particularly when broader market demand is weakening. MY INTERPRETATION I keep coming back to one contradiction: BNB Chain is processing substantial transaction activity, but BNB's chart still reflects considerable selling pressure. The network has a clear development roadmap, and the upcoming Payment Lane upgrade could strengthen its payment infrastructure. However, the market needs more than network activity to establish a sustainable recovery. Buyers must demonstrate that they are willing to absorb selling pressure around the current resistance zones. MY TRADING PLAN — CONDITIONAL SHORT The broader 4H structure currently favors downside continuation. Trigger: 4H candle closes below $565.96, followed by a failed retest. Entry: $563–$566. Stop-loss: $578. TP1: $552. TP2: $540. TP3: $525. Using a representative entry of $564.50: Potential downside to TP3: 7.00%. Defined risk: 2.39%. Estimated risk-to-reward: 2.93:1. This is a conditional setup, not an immediate entry. I would wait for the support breakdown and failed retest. MY FINAL VIEW BNB has something many tokens struggle to demonstrate: an established network with substantial transaction activity, payment infrastructure and a recurring supply-reduction mechanism. But the current chart highlights an important distinction between ecosystem strength and token performance. For me, the next test is whether BNB can turn its network activity into enough market demand to reclaim the $605–$635 resistance region. Until then, the recovery remains technically incomplete. $BNBUSDT #ByXIMPACT

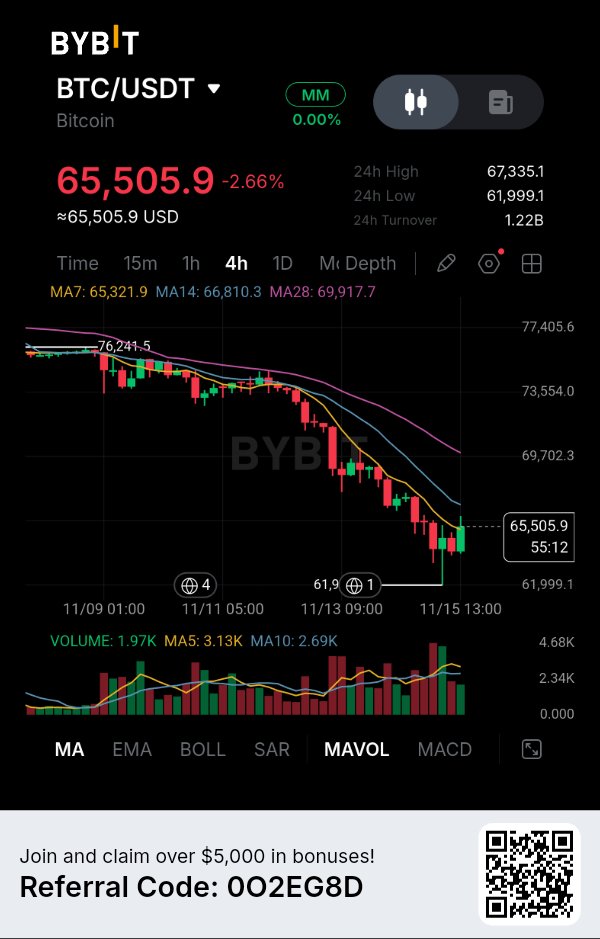
$BTCUSDT — Bitcoin is attempting to recover from $61,999, but the bigger question is whether buyers can turn this bounce into an actual change in market structure. What makes this chart interesting to me is the distance Bitcoin has travelled from its previous highs. On the 4H chart, BTC has declined from the $76,241 region, consistently forming lower highs and lower lows. The latest sell-off pushed price toward $61,999 before buyers stepped in and produced a noticeable recovery. Bitcoin is now trading around $65,505.9. That's an encouraging reaction, but I don't want to confuse a recovery candle with a confirmed reversal. The moving averages give me another reason to remain cautious. The MA7 is around $65,321.9, while the MA14 sits at $66,810.3 and the MA28 is near $69,917.7. Price has managed to reclaim the short-term MA7, but the other two moving averages remain overhead. This creates an important test for buyers: can they recover $66,810 and eventually challenge the $69,900 region, or will sellers use this bounce to establish another lower high? I'm particularly interested in the $66,800–$67,335 area. It combines the MA14 with the visible 24H high, making it an important region to watch for a potential rejection. My preferred scenario is a SHORT, but only if Bitcoin recovers into that zone and sellers demonstrate that they are still defending resistance. 🎯 MY DOWNSIDE TARGETS TP1: $64,000 TP2: $62,000 tP3: $60,000 (estimated extension) Risk Management My conditional trading plan: Entry Zone: $66,800–$67,335 Stop Loss: $70,100 Confirmation: 4H bearish rejection from the entry zone. Invalidation: Sustained 4H acceptance above $70,100. The final target is a projected extension, not a confirmed support level. These levels describe a potential setup, not an executed position. If Bitcoin reclaims the MA14 and starts building higher lows, I'll reconsider my bearish outlook. I don't want to remain committed to a short idea if the market begins proving otherwise. I've learned that after a prolonged decline, the first recovery can be deceptive. Sometimes the most important decision isn't predicting where Bitcoin will go next, but waiting to see whether buyers can actually defend the ground they've recovered. For now, I'm watching one important question: Is Bitcoin building a foundation for recovery, or are buyers simply giving sellers another opportunity to push the market lower? $BTCUSDT #ByXIMPACT

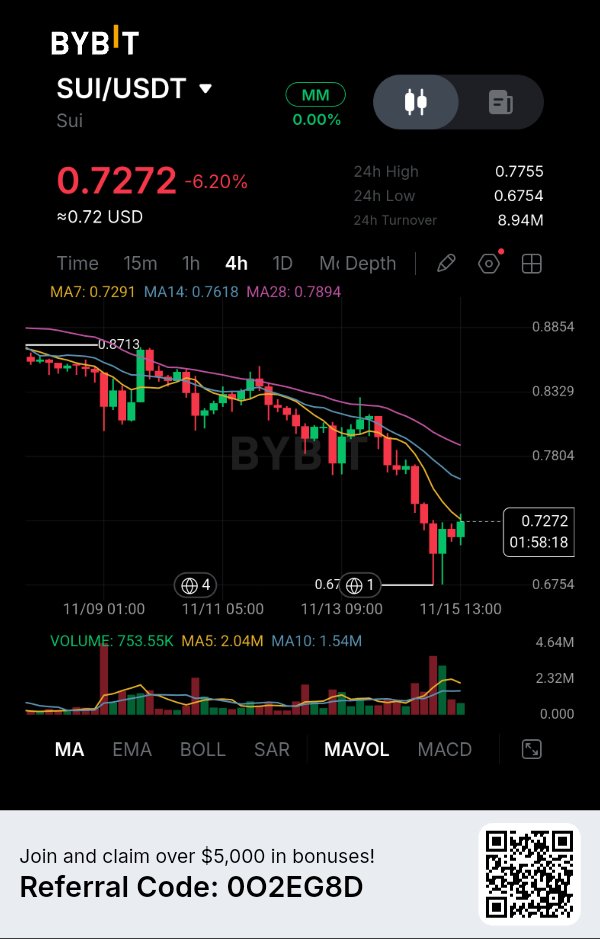
The Bounce From $0.6754 Is Facing a Much Bigger Problem — Sellers Still Control the Structure. SUI has lost 6.20%, but what interests me most is the behavior following its latest sharp decline. Buyers managed to produce a recovery from $0.6754, yet the price is still struggling around its fastest moving average. This creates an important question: are buyers preparing a genuine recovery, or is this simply another temporary bounce inside an established downtrend? I am leaning toward the second possibility until the chart provides stronger evidence. MARKET STRUCTURE — THE DOWNWARD PRESSURE HAS NOT DISAPPEARED SUI is currently trading around $0.7272, with a 24-hour high of $0.7755 and a low of $0.6754. Looking at the 4-hour chart, the broader structure has deteriorated considerably from the previous high near $0.8713. Price has continued forming lower highs and lower lows, with recovery attempts repeatedly failing to reclaim previous resistance levels. The latest selling wave pushed SUI toward $0.6754, where buyers finally stepped in. The subsequent green candles show some buying interest, but the recovery remains relatively small compared with the preceding decline. For me, the important distinction is that buyers have defended a low, but they have not yet changed the broader market structure. THE MOVING AVERAGES ARE CREATING AN OVERHEAD BARRIER Three readings deserve particular attention: - MA7: $0.7291 - MA14: $0.7618 - MA28: $0.7894 SUI is currently trading slightly below MA7 and considerably below MA14 and MA28. The arrangement also remains bearish, with the fastest moving average below the medium-term average and both below MA28. This creates a resistance sequence that buyers must overcome. The first challenge is reclaiming $0.7291. Beyond that, the $0.7618 region becomes particularly important. I would pay even more attention to $0.7894 because reclaiming the longer moving average would represent a more meaningful improvement in the 4-hour structure. Until these levels are recovered, I see the current bounce as a recovery attempt rather than a confirmed trend reversal. VOLUME — THE RECOVERY IS MISSING AN IMPORTANT INGREDIENT Here is something that strengthens my caution. The displayed volume is approximately 753.55K, while: - MA5: 2.04M - MA10: 1.54M Current volume is substantially below both averages. This suggests that the latest recovery is not attracting the same level of participation seen during recent trading activity. I do not interpret this alone as proof of distribution, but it makes the current bounce less convincing. If buyers genuinely intend to reverse the trend, I want to see stronger participation accompanying a reclaim of resistance. A few green candles without meaningful volume expansion are not enough to change my assessment. THE LEVEL THAT COULD DECIDE THE NEXT MOVE The $0.6754 region is now an important reference point. Buyers defended this level, but the market still needs to demonstrate that it can establish a higher high and sustain a recovery above the moving-average cluster. If SUI rallies toward $0.7480–$0.7620 and encounters another rejection, that could provide sellers with a fresh opportunity. However, a strong 4-hour breakout above the resistance structure would weaken the bearish thesis. This is why I am more interested in how SUI reacts during a recovery than in chasing the current decline. MY TRADING STRATEGY — SHORT My preferred direction remains SHORT, based on the declining market structure, bearish moving-average alignment, and relatively weak volume during the recovery. - Direction: SHORT - Entry Zone: $0.7480–$0.7620 - Confirmation: Bearish rejection from the entry zone on the 4H chart. - Stop Loss: $0.7950 - TP1: $0.6754 - TP2: $0.6500 - TP3: $0.6250 Estimated Risk/Reward: Approximately 1:1.5 to 1:3.8, depending on entry and execution. TP1 is based on the visible chart low, while TP2 and TP3 are projected downside extensions rather than confirmed support levels shown in the screenshot. A sustained 4-hour move above $0.7950 would invalidate this setup. I would avoid chasing the trade if price falls without offering the planned entry. WHAT COULD CHANGE MY VIEW? A convincing reclaim of $0.7618 followed by a move above $0.7894 with stronger buying volume would make me reconsider the bearish outlook. That would suggest buyers are finally doing more than defending lower prices. FINAL THOUGHT SUI has found buyers near $0.6754, but finding support is only the beginning. The real test is whether those buyers can reclaim the resistance levels that have repeatedly stopped the recovery. $SUIUSDT #ByXIMPACT

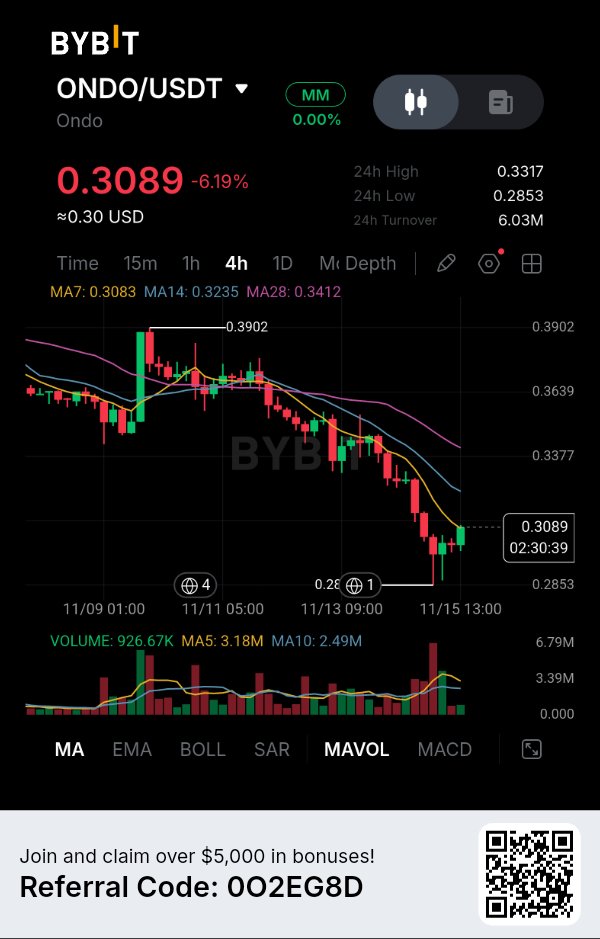
$ONDOUSDT — Real-World Asset Adoption Is Expanding, But the Token Is Facing a Different Reality. ONDO is experiencing selling pressure even as the real-world asset sector continues to develop. What makes this chart interesting is the gap between Ondo's expanding financial products and the weakness currently visible in its token price. I'm particularly interested in the upcoming supply schedule. The project is developing new financial use cases, but the market also has to absorb additional tokens over time. MARKET DATA — 4H CHART According to your Bybit chart: Current price: $0.3089 24H change: -6.19% 24H high: $0.3317 24H low: $0.2853 24H turnover: $6.03M MA7: $0.3083 MA14: $0.3235 MA28: $0.3412 The latest market snapshot on November 15 places ONDO around $0.30, with approximately $1.47B market capitalization and $184M in global 24-hour trading volume. Circulating supply is approximately 4.87 billion against a maximum supply of 10 billion tokens. WHAT THE CHART IS REVEALING ONDO has been forming a declining structure after failing to maintain its earlier recovery toward $0.3902. The price is now trading below MA14 and MA28, while MA7 sits close to the current price. This shows that short-term buyers are attempting to stabilize the market, but the broader 4H structure remains weak. The immediate support is $0.2853. Buyers reacted from this level, producing a small recovery toward $0.3089. However, volume tells another part of the story. The latest displayed volume is 926.67K, compared with MA5 at 3.18M and MA10 at 2.49M. The rebound has not yet demonstrated convincing participation. THE FUNDAMENTAL STORY — ONDO IS EXPANDING ITS PRODUCT RANGE One recent development caught my attention. On November 14, Spout Finance announced plans for USDC loans backed by tokenized US stocks on Solana. Ondo is an investor in Spout, and the announcement indicates that Ondo-backed tokenized assets are expected to be accepted as collateral when the product launches. This is interesting because tokenized financial assets could eventually become useful beyond simply holding them. Using them as collateral introduces another potential financial application. Ondo's broader platform also reports approximately $965.79M in TVL, showing that its tokenized-asset ecosystem has substantial capital associated with it. THE TOKENOMICS CONTRADICTION This is where I become more cautious. According to DefiLlama's unlock schedule, approximately 918.05 million ONDO tokens are scheduled to unlock on January 17, 2027. At the November 15 reference price, that allocation is valued around $274.64 million, equivalent to approximately 18.85% of circulating supply. This doesn't mean every unlocked token will immediately be sold. However, it creates a meaningful supply consideration. Currently, approximately 48.7% of ONDO's maximum supply is circulating. That makes future distribution an important factor when evaluating its valuation. MY INTERPRETATION I keep coming back to one distinction: Ondo's product expansion and ONDO token demand are two separate things. Tokenized stocks, financial products and collateral applications can strengthen the ecosystem. But investors still need to understand how these developments translate into direct value for the native token. The upcoming unlock adds another variable to that equation. MY TRADING PLAN — CONDITIONAL SHORT The current 4H structure favors a downside continuation setup. Trigger: 4H candle closes below $0.2853, followed by a failed retest. Entry: $0.2830–$0.2860. Stop-loss: $0.2960. TP1: $0.2750. TP2: $0.2650. TP3: $0.2550. Using a representative entry of $0.2845: Potential downside to TP3: 10.37%. Defined risk: 4.04%. Estimated risk-to-reward: 2.57:1. TP2 and TP3 are projected targets below the visible chart support, not established support levels. This setup remains inactive until the breakdown and failed retest occur. MY FINAL VIEW Ondo is building around an important financial trend: bringing traditional assets into blockchain-based financial systems. But I don't think ecosystem expansion alone guarantees token appreciation. The next challenge is proving that new financial products can generate sustainable economic demand while the circulating supply continues to increase. For ONDO, the relationship between real-world asset adoption, token utility and future supply may become more important than the next short-term price recovery. $ONDOUSDT #ByXIMPACT

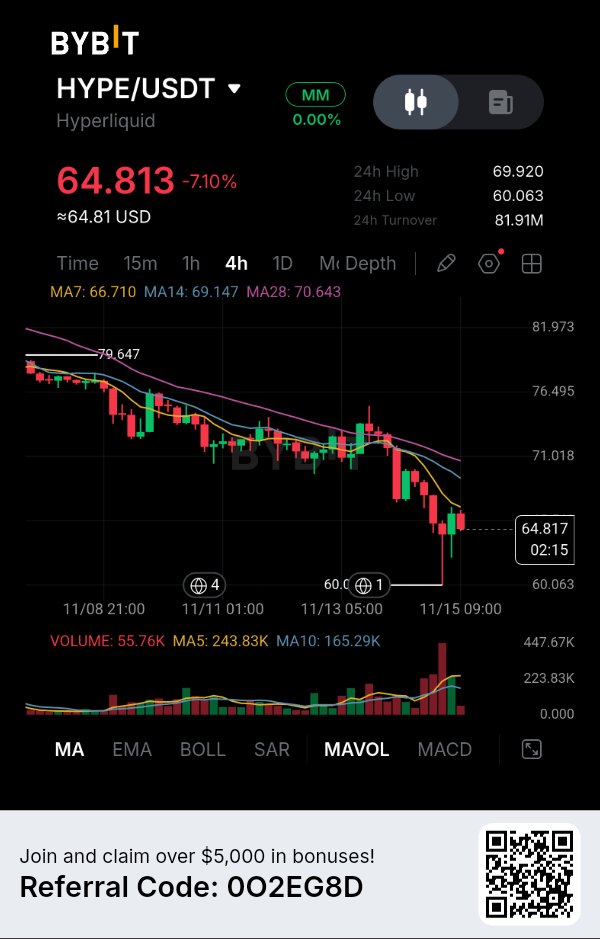
$HYPEUSDT — The bounce from $60.06 is worth watching, but the broader 4H structure is still giving sellers the advantage. What caught my attention is how sharply HYPE lost ground after trading near the $79.64 region. The decline wasn't just a small pullback. Price continued forming lower highs, and the latest sell-off pushed it toward $60.063 before buyers managed to produce a recovery. HYPE is currently trading around $64.81, down 7.10%. Although the rebound shows some buying interest, I'm not yet convinced that sellers have lost control. The moving averages explain why I'm being cautious. The MA7 sits at $66.71, MA14 at $69.14, and MA28 at $70.64. All three remain above the current price, creating a resistance area that buyers need to overcome. There's one detail I find particularly interesting: the sharp rejection near $60.06 came alongside increased trading activity. Buyers responded, but the recovery has not yet changed the sequence of lower highs. I don't want to mistake a reaction from support for a confirmed trend reversal. My preferred approach is to watch for a recovery toward $66.70–$69.15. If HYPE reaches that area and sellers produce another rejection, I believe the existing bearish structure could offer a better short opportunity. I'm looking toward $62 first, followed by the recent low around $60.06. If that level breaks with sustained selling pressure, a further extension toward $57.50 becomes possible. Risk Management My conditional trading plan is: Direction: SHORT Entry Zone: $66.70–$69.15 Stop Loss: $71.30 TP1: $62.00 TP2: $60.06 TP3: $57.50 (estimated extension) I want to see bearish confirmation inside the entry zone rather than placing an order simply because price reaches it. A sustained 4H move above $71.30 would invalidate this particular setup. The biggest risk I see is another strong recovery from the $60 support area. If buyers reclaim the moving averages and begin establishing higher lows, I'll have to reconsider my bearish view. I've learned that after a sharp sell-off, patience can be more valuable than trying to catch the next candle. For now, I'm watching whether $HYPE turns its next recovery into another lower high, or whether buyers finally have enough strength to challenge the broader downtrend. $HYPEUSDT #ByXIMPACT

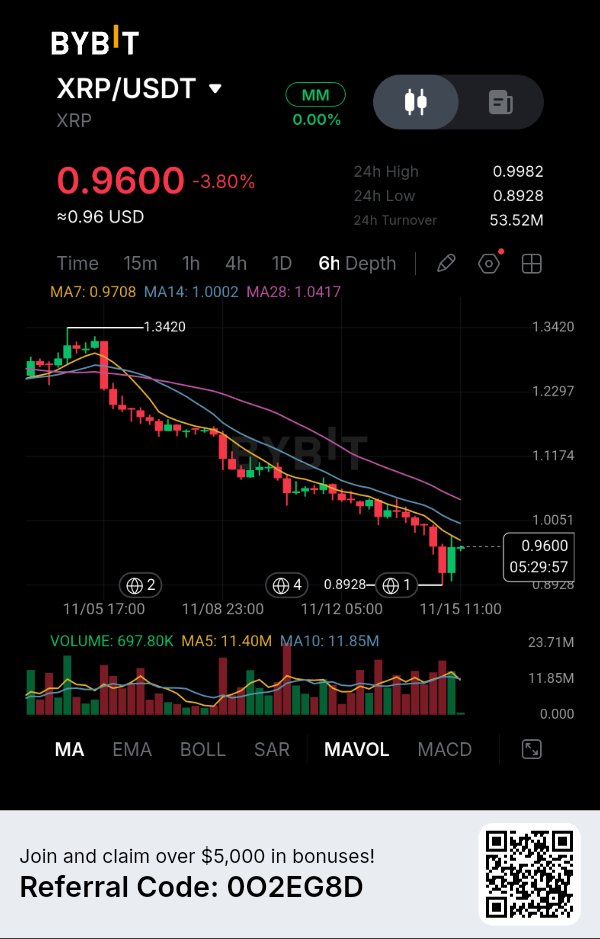
The Bounce From $0.8928 Looks Interesting, But Sellers Haven't Lost Control Yet. XRP has recovered from its recent low, but I am not treating this rebound as evidence of a trend reversal. What stands out on the 6-hour chart is the distance between the current price and the three moving averages. Buyers have managed to interrupt the decline, yet they still have several resistance levels to overcome before the broader structure can change. Sometimes the most important signal is not how strongly price bounces, but where that bounce starts losing momentum. MARKET STRUCTURE — THE DOWNTREND REMAINS INTACT XRP is currently trading around $0.9600, down 3.80%, with a 24-hour high of $0.9982 and a low of $0.8928. The broader 6-hour structure shows a persistent decline from approximately $1.3420. Lower highs and lower lows have dominated the chart, with several recovery attempts failing to establish a meaningful bullish reversal. The latest selling wave pushed XRP toward $0.8928, where buyers finally attempted to defend the market. Price has since recovered toward $0.9600, but this movement remains a short-term rebound inside a much larger declining structure. I want to see whether this recovery can reclaim resistance or whether sellers will use it as another opportunity to enter. THREE MOVING AVERAGES, ONE CLEAR MESSAGE The displayed moving averages are: - MA7: $0.9708 - MA14: $1.0002 - MA28: $1.0417 All three averages remain above the current price. Their bearish arrangement is particularly important because the fastest average is below the medium-term average, which is itself below the longer average. This suggests that the selling pressure is not limited to one isolated candle. The first resistance area is around $0.9708, followed by $1.0002. Above these levels, MA28 near $1.0417 represents another significant obstacle. For buyers, reclaiming these averages would be an important step toward repairing the damaged market structure. Until then, I remain cautious about calling this recovery a reversal. VOLUME — THE RECOVERY STILL NEEDS PARTICIPATION One detail deserves special attention. The displayed volume is approximately 697.80K, compared with MA5 at 11.40M and MA10 at 11.85M. Current volume is substantially below both displayed averages. This indicates that the latest recovery is not currently accompanied by strong volume participation relative to those averages. I would not automatically interpret this as sellers disappearing or buyers accumulating. Instead, I want to see whether trading activity expands when XRP approaches the moving-average resistance cluster. Without stronger participation, the recovery could struggle to develop into a sustainable upward move. THE $0.8928 LEVEL IS MORE IMPORTANT THAN IT LOOKS For me, the interesting part of this chart is the relationship between the recent low and the overhead resistance. Buyers have defended $0.8928, but they have not yet reclaimed the levels that previously acted as support during the decline. That creates an important imbalance. The market has demonstrated some willingness to buy lower prices, but it has not demonstrated enough strength to challenge the broader bearish structure. If XRP approaches $0.98–$1.00 and encounters another rejection, that could create a more attractive downside opportunity. However, a strong recovery above $1.0002 with expanding volume would make the bearish interpretation less convincing. MY TRADING STRATEGY — SHORT My preferred direction is SHORT, based on the prevailing 6-hour trend and the positioning of the moving averages. I would rather enter on a recovery into resistance than chase XRP after an already extended decline. - Direction: SHORT - Entry Zone: $0.9850–$0.9980 - Confirmation: 6H bearish rejection within the entry zone. - Stop Loss: $1.0250 - TP1: $0.8928 - TP2: $0.8600 - TP3: $0.8300 Estimated Risk/Reward: Approximately 1:2.6 to 1:5.0, depending on entry and execution. TP1 is based on the visible chart low, while TP2 and TP3 are projected downside extensions rather than confirmed support levels on this screenshot. A sustained 6-hour move above $1.0250 would invalidate this setup. If price declines without offering the planned entry, I would avoid chasing it. WHAT COULD CHANGE MY VIEW? A convincing reclaim of $1.0002 followed by stronger buying participation would weaken my bearish outlook. A subsequent move above $1.0417 would provide further evidence that the broader structure is improving. FINAL THOUGHT XRP has shown that buyers are willing to defend $0.8928. The next challenge is proving they can reclaim the resistance levels that sellers have controlled throughout this decline. A bounce can change the candles, but only a structural recovery can change the trend. $XRPUSDT #ByXIMPACT

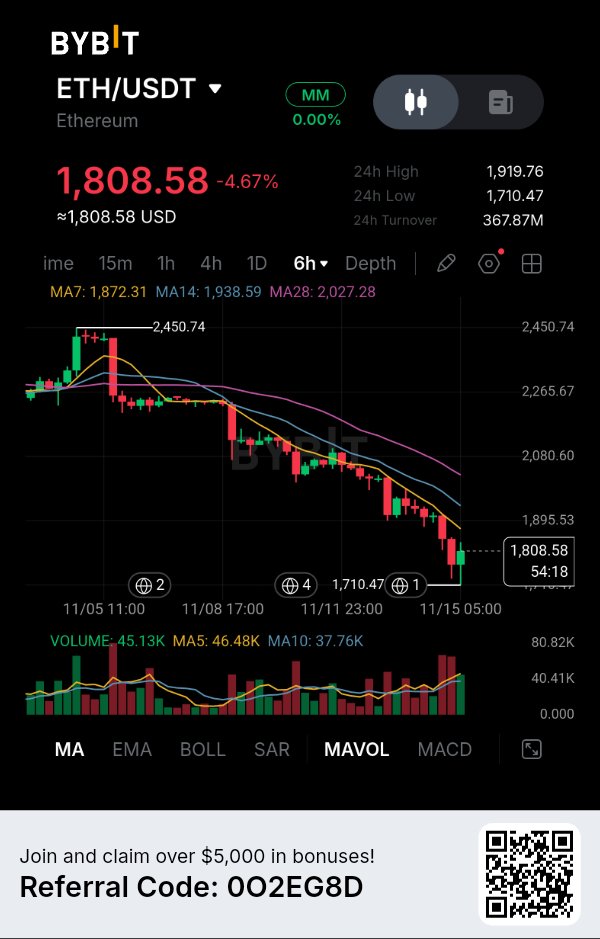
$ETHUSDT — The recovery from $1,710 is interesting, but I'm not convinced buyers have done enough to change the larger structure. Ethereum is trading around $1,808.58 on the 6H chart after an extended decline from the $2,450 area. What caught my attention is the latest reaction near $1,710.47. Buyers managed to push price away from that low, but the recovery is still facing several obstacles. The part I find most important is the position of the moving averages. The MA7 is sitting at $1,872.31, the MA14 at $1,938.59, and the MA28 at $2,027.28. All three remain above the current price and are pointing downward. To me, this suggests that the market has not yet established a convincing recovery structure. A bounce from support is worth watching, but I don't want to mistake it for a confirmed trend reversal. I'm particularly interested in what happens around $1,850–$1,872. If ETH returns to this region and buyers fail to reclaim the MA7, another rejection could give sellers an opportunity to continue the existing trend. My preferred scenario is a SHORT after confirmation of that rejection. I'm not interested in selling simply because price has already fallen. I'd rather let the market recover into resistance and show whether sellers are still willing to defend it. My downside objectives are $1,750 first, followed by the recent low around $1,710. If that support breaks with continued selling pressure, an extended move toward $1,650 becomes a possibility. Risk Management My conditional setup uses: Entry Zone: $1,850–$1,872 Stop Loss: $1,945 TP1: $1,750 TP2: $1,710 TP3: $1,650 (estimated extension) A sustained recovery above $1,945 would invalidate this particular bearish idea. These levels are a proposed setup, not an executed position. I also don't want to ignore the possibility of buyers defending $1,710 again. If ETH starts reclaiming its short-term moving averages, I'll have to reconsider my bearish outlook rather than remain attached to one direction. I've learned that the best entries don't always come when the market is moving fastest. Sometimes the more important opportunity appears when price returns to a level where both buyers and sellers have something to prove. For now, I'm watching whether ETH turns the next recovery attempt into another lower high, or finally gives buyers a reason to challenge the broader downtrend. $ETHUSDT #ByXIMPACT

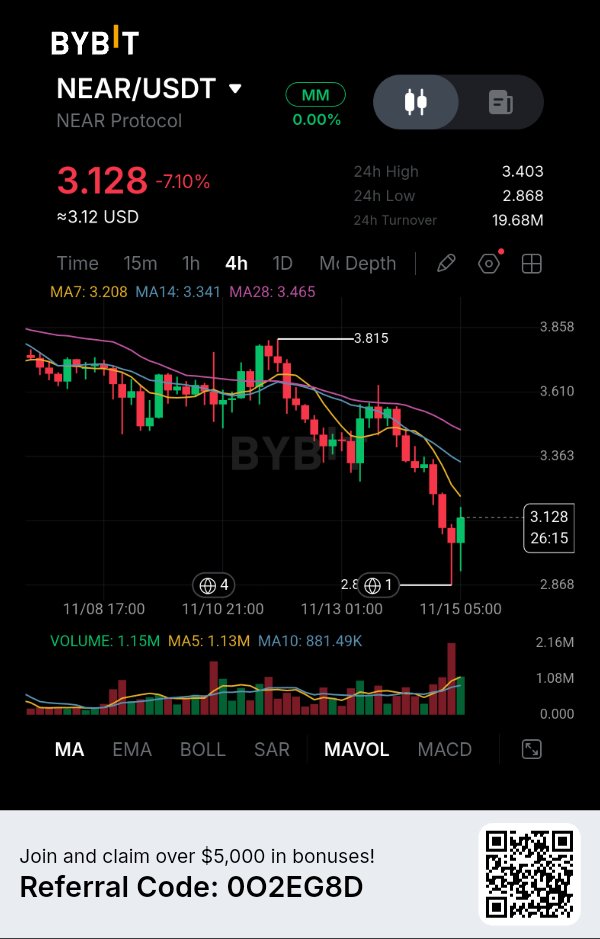
The $2.868 Level Has Become the Most Important Test for Buyers. NEAR has lost more than 7% on the 4H chart, and the interesting part is how quickly sellers pushed price below all three moving averages. Buyers managed to recover from $2.868, but I don't think one rebound is enough to change the market structure. What stands out to me is the combination of declining price, increasing trading activity and weakening DeFi liquidity. There is a difference between a project continuing to develop and its token finding genuine demand. MARKET DATA — YOUR BYBIT CHART Price: $3.128 24H change: -7.10% 24H high: $3.403 24H low: $2.868 24H turnover: $19.68M MA7: $3.208 MA14: $3.341 MA28: $3.465 These are the figures visible in your screenshot, not a live exchange quote. WHAT THE CHART IS REVEALING NEAR has been forming a declining structure after failing to sustain its recovery toward $3.815. The latest sell-off pushed price below MA7, MA14 and MA28. Their current positions also show a bearish alignment, with the longer moving average sitting highest. The $2.868 area is the immediate support to watch. Price reacted from that level, producing a recovery candle toward $3.128, but the bounce remains below MA7 at $3.208. Volume adds another detail. The displayed volume is 1.15M, slightly above MA5 at 1.13M and above MA10 at 881.49K. This indicates increased participation during the latest price movement. THE FUNDAMENTAL CONTRADICTION NEAR's infrastructure story remains active, but its economic data deserves closer attention. According to DefiLlama's November 14 data, NEAR's broader tracked ecosystem had approximately $265.38M in TVL, while 30-day fees reached $6.38M and protocol revenue reached $1.92M. However, TVL had declined approximately 23% over the previous 30 days. The native NEAR chain separately recorded approximately $149.33M in DeFi TVL, $133.38M in stablecoin value and $9.52M in daily DEX volume. This distinction matters because ecosystem-wide activity and native-chain liquidity are not the same thing. There is also a risk worth monitoring: DefiLlama records a $3.8M bridge and cross-chain security incident on October 1, 2026. This makes cross-chain security an important part of NEAR's infrastructure story, particularly as the ecosystem expands across multiple networks. For additional market context, CoinGlass reported NEAR around $2.94 on November 15, with a 14.53% 24-hour decline and approximately $659M in futures open interest. This is a separate live market snapshot, not the price shown in your Bybit screenshot. MY INTERPRETATION I keep coming back to the difference between network expansion and capital confidence. NEAR has meaningful infrastructure activity, but falling TVL and a declining token price suggest that ecosystem development isn't currently enough to offset broader selling pressure. I would pay particular attention to $2.868. If buyers cannot defend that level, the recovery attempt could lose its remaining strength. MY TRADING PLAN — CONDITIONAL SHORT I'm selecting SHORT because the 4H structure currently favors sellers. Trigger: 4H candle closes below $2.868, followed by a failed retest. Entry: $2.85–$2.87. Stop-loss: $2.98. TP1: $2.78. TP2: $2.68. TP3: $2.55. Using a representative entry of $2.86: Potential downside to TP3: 10.84%. Defined risk: 4.20%. Estimated risk-to-reward: 2.58:1. TP2 and TP3 are projected levels, not established support levels visible in the screenshot. This setup remains conditional; I would not enter before the breakdown and failed retest. MY FINAL VIEW NEAR is facing two different challenges: maintaining confidence in its ecosystem infrastructure and restoring demand for its native token. The next important signal isn't simply another green candle. It's whether buyers can defend meaningful support while the broader ecosystem demonstrates that its activity is translating into sustainable economic value. $NEARUSDT #ByXIMPACT

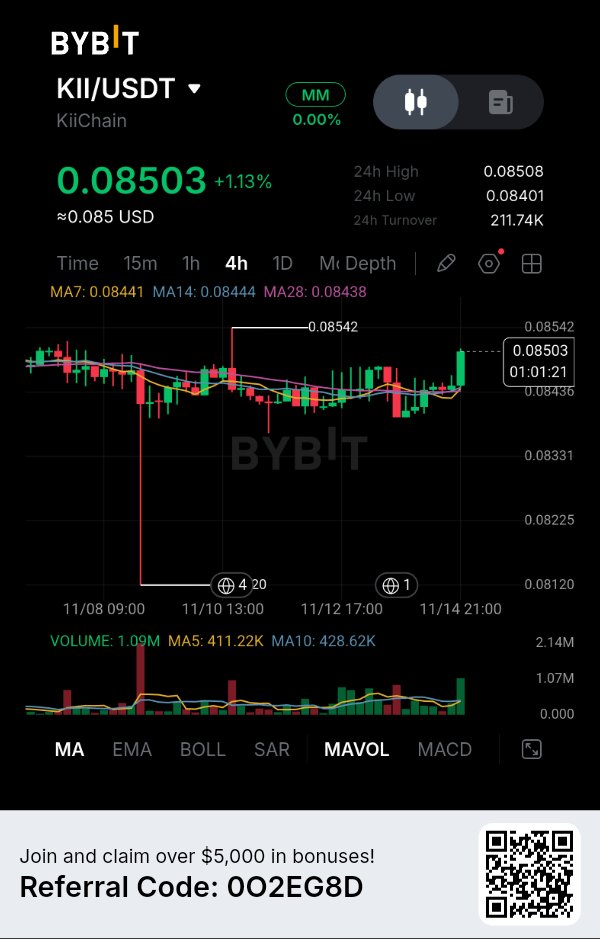
KiiChain Is Building Financial Infrastructure, But Its Token Supply Tells Another Story. KII is trading near $0.085, with buyers attempting to push price above a relatively tight consolidation range. What interests me is the contrast between KiiChain's expanding financial infrastructure and the amount of token supply that has yet to enter circulation. I think this is an important distinction: a blockchain can attract financial institutions and process real transactions, but its native token still needs a sustainable economic demand mechanism. MARKET DATA — 4H CHART According to your Bybit chart: Price: $0.08503 24H change: +1.13% 24H high: $0.08508 24H low: $0.08401 24H turnover: $211.74K MA7: $0.08441 MA14: $0.08444 MA28: $0.08438 The latest available market snapshot on November 15 places KII around $0.0844, with approximately $26.38M market capitalization and $5.81M daily volume. WHAT THE CHART IS REVEALING KII has been moving sideways around $0.0840–$0.0850, with a previous downside wick reaching approximately $0.08120. The interesting development is that price has moved above all three moving averages. MA7, MA14 and MA28 are clustered around $0.0844, suggesting that buyers have gained short-term control. The immediate resistance is $0.08542. A confirmed breakout above this level could give buyers room to challenge higher prices. Volume also deserves attention. The latest displayed volume is 1.09M, compared with MA5 at 411.22K and MA10 at 428.62K. Participation has increased, although sustained activity is still needed. THE PROJECT STORY — REAL FINANCIAL USE CASES KiiChain is developing infrastructure for cross-border payments, foreign-exchange liquidity and stablecoin settlement. On September 9, KiiChain announced agreements involving Financiera Juriscoop and Banco Agrario in Colombia. The objective is to connect regulated financial institutions with its 24/7 FX and settlement infrastructure. The announcement also reported more than $500M in processed volume and over 200 enterprise clients. Another development came on October 22, when Finoa Consensus Services confirmed its validator and oracle price-feeder role on KiiChain mainnet. This adds institutional infrastructure participation to the network. These developments matter because KiiChain is attempting to solve an actual financial infrastructure problem rather than relying exclusively on speculative blockchain activity. THE TOKENOMICS CONTRADICTION This is where I become more cautious. KII has a maximum supply of 1.8 billion tokens. Market-data providers report circulating supply figures ranging from approximately 312M to 354M, highlighting differences in their supply calculations. Its FDV is around $152M. There is also an important supply event. Tokenomics.com lists a November 14 unlock of approximately 17 million KII, representing around 0.9% of maximum supply. The scheduled date has passed, but the actual distribution and resulting market impact require confirmation. My interpretation is that KiiChain's infrastructure expansion is interesting, but future token emissions and unlocks could influence how much value existing holders retain. MY TRADING PLAN — CONDITIONAL LONG The short-term chart structure favors a conditional breakout attempt. Trigger: 4H candle closes above $0.08542, followed by a successful retest. Entry: $0.08540–$0.08555. Stop-loss: $0.08430. TP1: $0.08620. TP2: $0.08700. tP3: $0.08800. Using a representative entry of $0.08545: Potential upside to TP3: 2.99%. Defined risk: 1.35%. Estimated risk-to-reward: 2.21:1. The setup remains inactive until the breakout and retest occur. MY FINAL VIEW KiiChain's most interesting opportunity is its attempt to connect traditional financial workflows with always-on blockchain settlement. However, I don't think institutional integrations alone are enough to establish long-term token value. The real test is whether increasing FX activity, financial partnerships and network usage can create sustainable demand for KII while additional supply continues entering circulation. That's the relationship I will be watching most closely. $KIIUSDT #ByXIMPACT

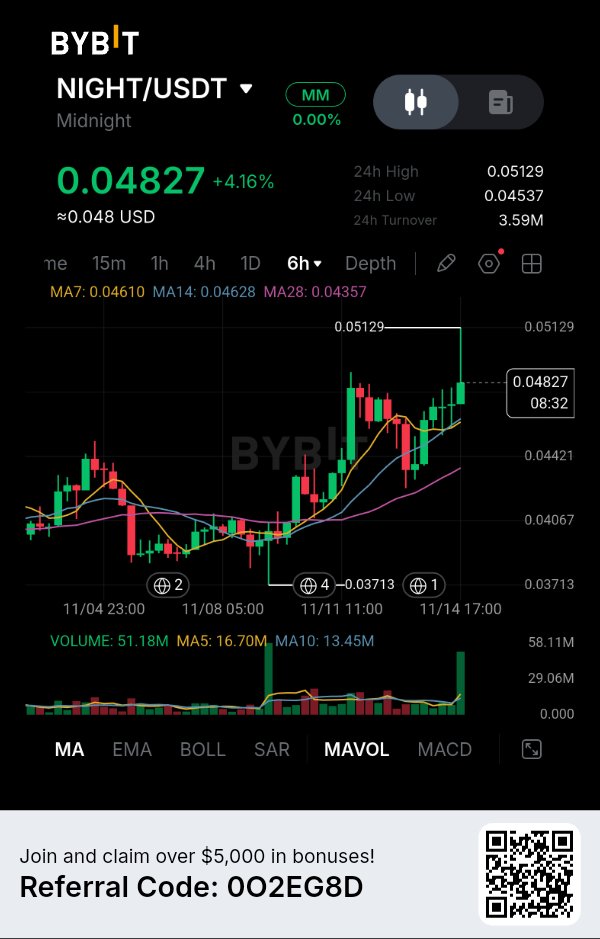
A Powerful Volume Expansion Is Changing the Short-Term Market Structure. NIGHT has gained 4.16%, but the most interesting development on this 6-hour chart is not the percentage increase. It is the combination of expanding volume, a strong recovery above all three moving averages, and a fresh attempt to challenge the $0.05129 resistance. What caught my attention is that this move looks different from the earlier sideways trading. Buyers are finally showing stronger participation, and the market is beginning to reflect that change. MARKET STRUCTURE — BUYERS HAVE TAKEN THE INITIATIVE NIGHT is currently trading around $0.04827, with a 24-hour high of $0.05129 and a low of $0.04537. Looking at the broader 6-hour structure, price previously spent considerable time consolidating around the $0.04000–$0.04200 region. The important change came when buyers pushed price above that range and accelerated the recovery. Since then, NIGHT has established stronger upward momentum, although the rejection near $0.05129 shows that sellers are still defending higher prices. I am particularly interested in whether the latest breakout can establish a higher support base rather than becoming another temporary upward spike. THE MOVING AVERAGES ARE SUPPORTING THE RECOVERY Three readings stand out: - MA7: $0.04610 - MA14: $0.04628 - MA28: $0.04357 Price is currently trading above all three moving averages. More importantly, the MA7 and MA14 are positioned above MA28, while price has moved considerably higher than the longer average. This suggests that short-term momentum has improved and the previous consolidation has developed into a stronger recovery structure. The $0.04610–$0.04628 region is particularly important because it contains both faster moving averages. If buyers defend this area during a pullback, it could become a useful foundation for another upward attempt. VOLUME — THIS IS THE SIGNAL I FIND MOST INTERESTING The volume data provides another important piece of evidence. - Current volume: 51.18M - MA5: 16.70M - MA10: 13.45M Current volume is substantially above both displayed averages. This is significant because the latest upward movement is accompanied by increased market participation. I would distinguish this from a low-volume price recovery, where a token rises without attracting meaningful trading activity. Here, the expansion in volume suggests that the latest move has attracted considerably more attention. However, high volume near resistance can also represent profit-taking. I want to see whether buyers can maintain participation rather than assuming every large volume candle represents accumulation. THE $0.05129 RESISTANCE BATTLE For me, this is where the next important decision will happen. NIGHT has already approached $0.05129, but the market has not yet established a convincing breakout above it. A successful 6-hour close above this level, supported by sustained volume, could open the door toward higher projected price areas. On the other hand, rejection followed by a breakdown below the moving-average support region would weaken the current bullish interpretation. The important distinction is that momentum has improved, but resistance still needs to be overcome. MY TRADING STRATEGY — LONG My preferred direction is LONG because the current price structure, moving-average positioning, and volume expansion favor buyers. I would prefer entering on a controlled pullback rather than chasing the latest green candle. - Direction: LONG - Entry Zone: $0.04650–$0.04720 - Confirmation: 6H support hold followed by renewed buying momentum. - Stop Loss: $0.04480 - TP1: $0.05129 - TP2: $0.05400 - TP3: $0.05700 Estimated Risk/Reward: Approximately 1:1.8 to 1:3.8, depending on entry and execution. TP1 is based on the visible resistance, while TP2 and TP3 are projected extensions rather than established resistance levels shown in the screenshot. A sustained 6-hour breakdown below $0.04480 would invalidate this setup. If price continues upward without offering the planned entry, I would avoid chasing it. WHAT COULD CHANGE MY VIEW? A rejection from $0.05129 followed by weakening volume and a loss of the moving-average support region would make me reconsider the bullish outlook. I want to see buyers defend the progress they have made, not simply create another temporary spike. FINAL THOUGHT NIGHT is showing something worth watching: price is rising alongside a substantial expansion in trading activity. The next challenge is turning that momentum into a sustainable breakout above resistance. $NIGHTUSDT #ByXIMPACT

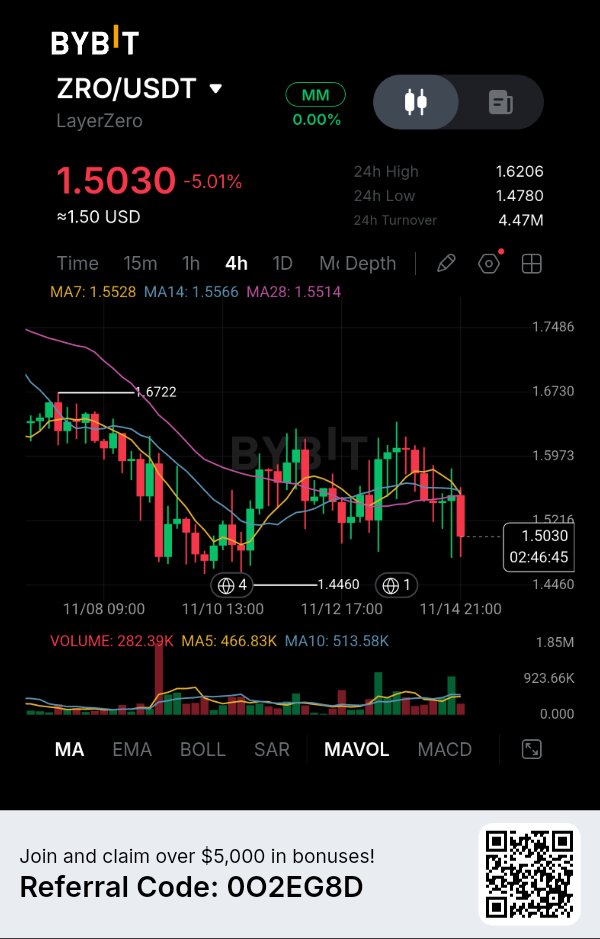
LayerZero Is Facing a Market Test as Selling Pressure Returns. ZRO is down 5.01% on the 4H chart, and what catches my attention is not just the decline. It's the fact that price has slipped below all three moving averages while approaching the $1.478 support area. For me, this creates an important question: is the market simply correcting after consolidation, or is demand weakening enough to push ZRO toward its previous swing low? MARKET DATA — 4H CHART Current price: $1.5030 24H change: -5.01% 24H high: $1.6206 24H low: $1.4780 24H turnover: $4.47M MA7: $1.5528 MA14: $1.5566 MA28: $1.5514 WHAT THE CHART IS REVEALING ZRO previously found support around $1.4460 and recovered toward the $1.60 region. However, buyers struggled to maintain that recovery. The latest decline has pushed price below MA7, MA14 and MA28. All three averages are clustered around $1.55, creating an overhead resistance zone. Another detail worth watching is volume. The latest displayed volume is 282.39K, below MA5 at 466.83K and MA10 at 513.58K. Selling pressure is visible, although the latest candle alone does not establish whether sellers are gaining sustained participation. The immediate support is $1.4780, followed by the previous swing low around $1.4460. THE FUNDAMENTAL STORY — A SUPPLY EVENT IS APPROACHING There is another reason I'm paying attention to ZRO right now. According to LayerZero's November 3 ecosystem update, holders of STG can continue converting their tokens into ZRO until December 15. The project is also updating ZRO's security configuration ahead of Zero mainnet, increasing the required DVN verification threshold to 4/4. The upcoming Zero mainnet launch, currently scheduled for November 30, is another important milestone. It could expand ZRO's role beyond governance into staking, gas payments and network security. But there's a supply consideration that deserves attention. DefiLlama's latest unlock schedule shows approximately 23.63 million ZRO tokens scheduled to unlock on November 19, worth around $35 million at the displayed valuation. This represents approximately 5.92% of the circulating float. That doesn't mean all unlocked tokens will immediately enter the market. However, it creates a potential supply overhang while traders are already dealing with weak technical structure. TOKEN ECONOMICS — AN IMPORTANT DISTINCTION LayerZero reports that its entities have deployed approximately $112.7 million into ZRO buybacks since September 2025. Stargate revenue has also been directed toward ZRO buybacks since April 2026. This creates an interesting economic structure: the project has mechanisms intended to connect ecosystem revenue with token demand, but upcoming unlocks introduce another variable. I think the market needs to evaluate both sides rather than focusing exclusively on buybacks or supply expansion. MY INTERPRETATION What stands out to me is the timing. Zero mainnet is approaching, LayerZero is strengthening its infrastructure, and the token has a scheduled unlock just days before the planned launch. The project has meaningful developments, but the token's immediate price behavior is showing hesitation. I would pay particular attention to whether the $1.478 support level survives. Losing it could expose the previous $1.446 low. MY TRADING PLAN — CONDITIONAL SHORT I'm selecting one direction because the current 4H structure favors downside continuation. Trigger: A confirmed 4H candle close below $1.478, followed by a failed retest. Entry: $1.465–$1.478. Stop-loss: $1.535. TP1: $1.446. TP2: $1.400. TP3: $1.350. Using a representative entry of $1.470: Potential downside to TP3: 8.16%. Defined risk: 4.42%. Estimated risk-to-reward: 1.85:1. This setup is conditional. I would not enter before the support breakdown and failed retest. MY FINAL VIEW LayerZero is approaching an important transition. Zero mainnet could introduce additional utility for ZRO, while the upcoming token unlock creates a near-term supply consideration. For me, the interesting question isn't simply whether LayerZero can expand its infrastructure. It's whether the upcoming network launch can create enough sustainable token demand to absorb new supply and strengthen the market structure. That relationship between network expansion, token economics and actual market demand is what makes ZRO worth watching. $ZROUSDT #ByXIMPACT

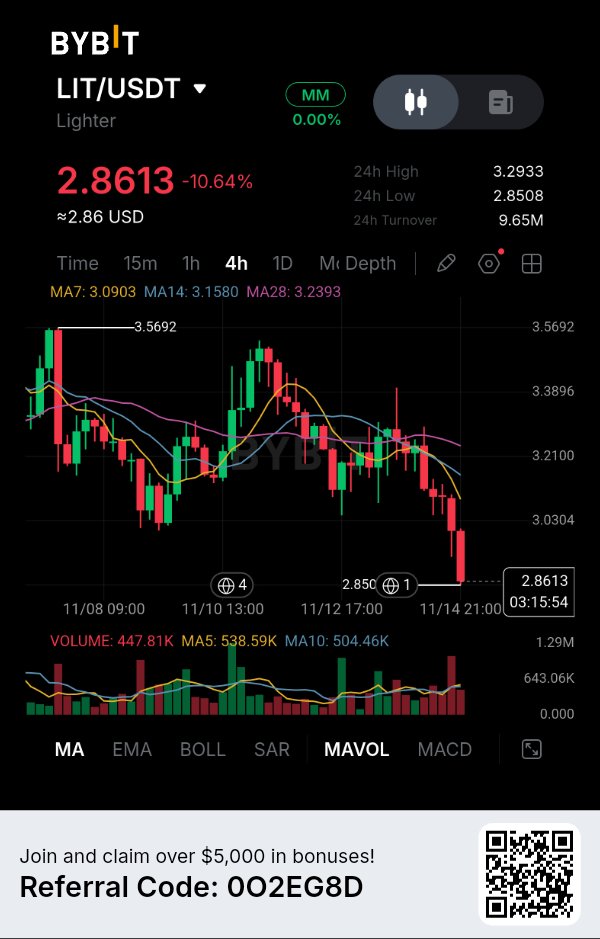
$LITUSDT — A 10.64% DROP, AND SELLERS ARE NOW TESTING THE LAST VISIBLE SUPPORT! What makes this chart interesting to me isn't just the sharp decline. It's the fact that LIT has finally broken below a consolidation area that previously kept price moving sideways. LIT is currently trading around $2.8613, down 10.64% on the 4H chart, after testing a low near $2.8508. The latest candles show strong selling pressure, and buyers haven't demonstrated a convincing recovery yet. THE TECHNICAL PICTURE The moving averages are showing a clear bearish alignment: MA7: $3.0903 MA14: $3.1580 MA28: $3.2393 Price is trading below all three averages, with the short-term MA7 positioned beneath MA14 and MA28. Another detail worth watching is volume: Current Volume: 447.81K MA5 Volume: 538.59K MA10 Volume: 504.46K The decline is significant, but I want to see whether selling participation increases if support breaks again. MY MARKET INTERPRETATION The $2.8508 area is the immediate level I'm watching. If LIT loses this support and a 4H candle confirms the breakdown, another downward move could develop. However, after such a sharp decline, chasing the current price doesn't look attractive to me. A weak recovery toward $3.00–$3.09 could offer a better opportunity if sellers reject that zone. MY CONDITIONAL TRADING PLAN — SHORT Entry Zone: $3.00–$3.09 Stop Loss: $3.17 TP1: $2.8508 TP2: $2.75 TP3: $2.65 INVALIDATION: A sustained 4H recovery above $3.17 would weaken this bearish setup. TP2 and TP3 are projected targets, not confirmed support levels on the visible chart. The short setup requires a confirmed rejection before entry. WHAT I'M WATCHING NEXT I don't want to assume that one large red candle guarantees another decline. The real test is whether buyers can defend $2.8508 or whether sellers turn this level into another resistance zone. If support fails, the market could open the door to further downside. Will $LIT defend $2.85, or are sellers preparing to push it toward $2.65? $LITUSDT #ByXIMPACT

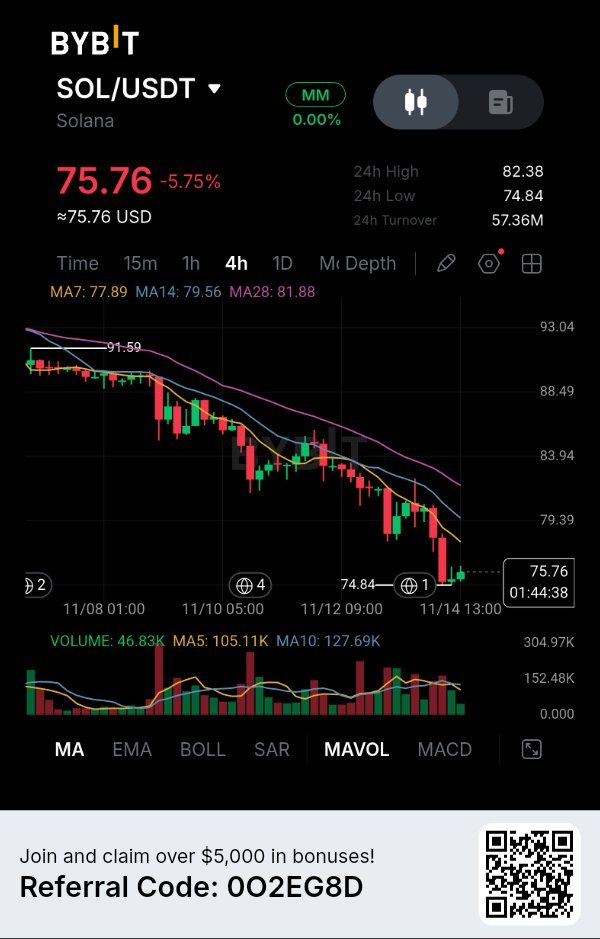
Solana Is Losing Support, and the Latest Bounce Isn't Convincing Yet. Solana has dropped 5.75%, but the most interesting detail on this 4-hour chart is not the size of the decline. It is how consistently sellers have defended the moving-average resistance zones. Every recovery attempt has struggled to change the broader structure, and the latest move toward $74.84 suggests buyers are still fighting an uphill battle. I am paying particular attention to whether this level becomes a temporary stopping point or simply another pause before the next downside move. MARKET STRUCTURE — THE SELLERS STILL CONTROL THE TREND SOL is currently trading around $75.76, with a 24-hour high of $82.38 and a low of $74.84. Looking at the 4-hour chart, the decline from approximately $91.59 has developed into a persistent sequence of lower highs and lower lows. What stands out is the absence of a meaningful structural recovery. Buyers have attempted several rebounds, but those moves have repeatedly encountered selling pressure before reclaiming previous swing levels. The latest decline has brought SOL close to its recent low of $74.84. This is an important area because a decisive breakdown could open the door to another downward extension. THE MOVING AVERAGES ARE REVEALING THE BIGGER PICTURE Three technical readings deserve attention: - MA7: $77.89 - MA14: $79.56 - MA28: $81.88 All three moving averages are above the current price, and their arrangement remains bearish. The fastest average is below the medium-term average, while both remain below MA28. This tells me that weakness is not limited to the latest candles. The broader 4-hour trend is also under pressure. The $77.89–$79.56 region is the first important recovery barrier. Above that, $81.88 represents another significant moving-average resistance. Until SOL starts reclaiming these levels, I would be cautious about interpreting short-lived green candles as a genuine reversal. VOLUME — A DETAIL THAT MAKES THE RECOVERY QUESTIONABLE The displayed volume is approximately 46.83K, compared with: - MA5: 105.11K - MA10: 127.69K Current volume is substantially below both volume averages. This suggests that the latest trading activity is relatively subdued compared with recent participation. I find this important because a sustainable recovery requires more than a temporary change in price direction. If buyers want to challenge the existing bearish structure, I would expect stronger participation during an upward move. Without that confirmation, any recovery toward the moving averages could attract renewed selling pressure. THE HIDDEN BATTLE AROUND $74.84 There is one level I believe deserves more attention than the daily percentage change: $74.84. This is the recent visible low, and SOL is trading relatively close to it. A successful defense could produce a short-term relief bounce toward $77.89. However, repeated pressure on the same support area can become dangerous for buyers, particularly when the broader structure continues producing lower highs. My interpretation is that sellers currently have the advantage, but I want to avoid entering directly into support. The more attractive opportunity would be a recovery toward overhead resistance followed by evidence that buyers cannot sustain the move. MY TRADING STRATEGY — SHORT I currently favor a SHORT setup because the 4-hour structure, moving-average alignment, and recent price behavior support continued downside pressure. - Direction: SHORT - Entry Zone: $77.80–$78.80 - Confirmation: Bearish rejection within the entry zone. - Stop Loss: $80.30 - TP1: $74.84 - TP2: $72.80 - TP3: $70.50 Estimated Risk/Reward: Approximately 1:1.2 to 1:3.3, depending on entry and execution. TP1 is based on the visible chart low, while TP2 and TP3 are projected downside extensions rather than confirmed support levels shown in the screenshot. A sustained 4-hour move above $80.30 would invalidate this setup. I would not chase the price if SOL continues falling without providing the planned entry. WHAT COULD CHANGE MY VIEW? A strong recovery above $79.56, followed by a successful reclaim of $81.88 with expanding volume, would make me reconsider the bearish outlook. That would suggest buyers are finally challenging the structure that has controlled this decline. FINAL THOUGHT Solana's next important move may depend less on how quickly it can bounce and more on whether buyers can reclaim the levels that sellers have repeatedly defended. For now, the trend deserves respect, and patience around resistance matters more than chasing every recovery candle. $SOLUSDT #ByXIMPACT

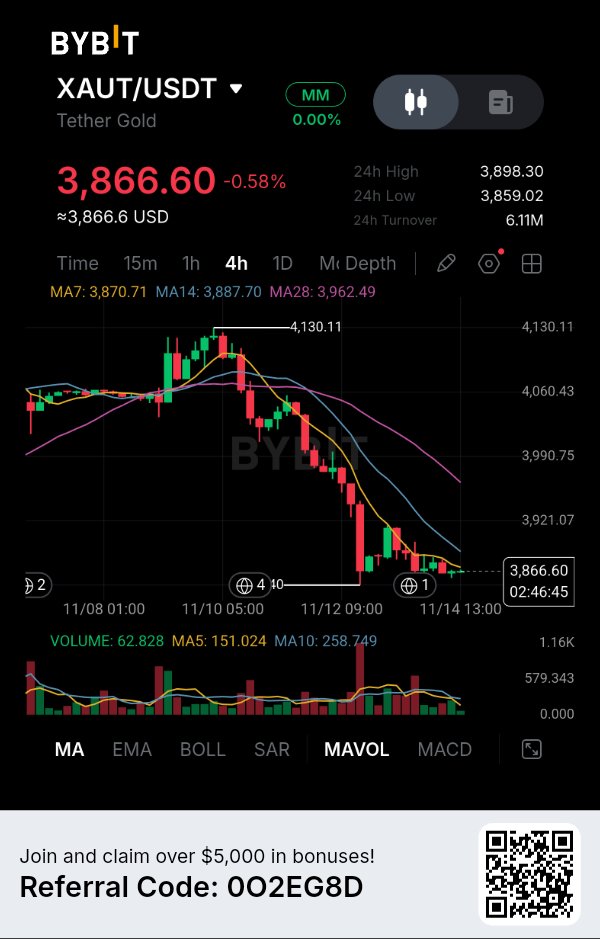
Gold Is Holding Its Value, But the 4H Chart Is Showing a Different Story. The interesting part of XAUT right now is the difference between its role as a gold-backed asset and its short-term market structure. Gold exposure may remain attractive, but the chart shows that buyers have not yet regained control after a sharp decline. I'm paying particular attention to the $3,850–$3,870 region because the market is attempting to stabilize there after falling from approximately $4,130. MARKET DATA — 4H CHART Current price: $3,866.60 24H change: -0.58% 24H high: $3,898.30 24H low: $3,859.02 24H turnover: $6.11M MA7: $3,870.71 MA14: $3,887.70 MA28: $3,962.49 WHAT THE CHART IS REVEALING XAUT experienced a strong decline from the $4,130 area, followed by a series of lower highs and lower lows. The latest candles show some stabilization around $3,860, but the price remains below all three moving averages. MA7 at $3,870.71 is the nearest resistance, followed by MA14 at $3,887.70. The more significant overhead barrier is MA28 at $3,962.49. Volume also deserves attention. The displayed latest volume is 62.828, compared with MA5 volume of 151.024 and MA10 volume of 258.749. This suggests that the latest stabilization has not yet attracted particularly strong participation. THE FUNDAMENTAL STORY — A NEW TRUST MILESTONE FOR TETHER GOLD An important development arrived on November 12. Tether announced that KPMG U.S. completed an independent audit of TG Commodities, the issuer of XAUT, covering its 2025 financial statements. The audit received an unqualified opinion, and Tether reported that individual gold bars backing the tokens were physically inspected and counted. For a gold-backed digital asset, this matters because its value proposition depends on more than market demand. Investors also need confidence that the underlying physical gold actually exists. There is another significant figure. According to Tether's September 30, 2026 reserve report, XAUT was backed by 827,417.63 fine troy ounces of physical gold, equivalent to approximately 25.7 metric tonnes. The reported reserve value reached $3.44 billion. Each XAUT represents ownership of one fine troy ounce of gold. This gives XAUT a fundamentally different valuation model from conventional cryptocurrencies. THE MARKET CONTRADICTION Despite this progress in reserve transparency, the market has experienced a noticeable correction. CoinGecko's November 14 historical data places XAUT's market capitalization around $3.13 billion, with approximately $193 million in 24-hour trading volume. Its November 13 closing price was approximately $3,872.86. What stands out to me is that improved reserve transparency does not automatically prevent short-term price declines. XAUT follows the underlying gold market. Its price can therefore decline even when its physical backing remains intact. That distinction is important when evaluating this asset. MY TECHNICAL INTERPRETATION The 4H chart shows a clear decline from approximately $4,130 to the $3,850–$3,860 region. The current price of $3,866.60 remains below: MA7: $3,870.71 MA14: $3,887.70 MA28: $3,962.49 All three moving averages are positioned above the market, indicating that the recovery has not yet changed the short-term structure. The immediate resistance zone is $3,870–$3,900. The $3,859 area is the first important nearby support, based on the displayed 24-hour low. Volume also remains relatively limited compared with its displayed moving averages, suggesting that buyers have not yet demonstrated strong participation. MY TRADING PLAN — CONDITIONAL SHORT I'm watching for a breakdown of the $3,859 support rather than entering simply because the chart looks weak. Trigger: 4H candle closes below $3,859, followed by a failed retest. Entry: $3,855–$3,860. Stop-loss: $3,898. TP1: $3,840. TP2: $3,815. TP3: $3,785. Using a representative entry of $3,857.50: Potential downside to TP3: 1.88%. Defined risk: 1.05%. Estimated risk-to-reward: 1.79:1. The lower targets are projected levels, not confirmed historical support zones. This setup remains inactive until the breakdown and retest conditions occur. MY FINAL VIEW I find XAUT interesting because it connects traditional gold ownership with blockchain-based asset transfer. The recent KPMG audit strengthens the transparency story, while the reported physical reserves provide an important foundation for its value proposition. However, I separate confidence in the backing from confidence in the short-term price direction. For now, the chart remains under pressure, and $3,859 is the level I am watching. The bigger story is whether tokenized gold can continue expanding as a financial instrument while maintaining the transparency and physical backing that make it valuable in the first place. $XAUTUSDT #ByXIMPACT

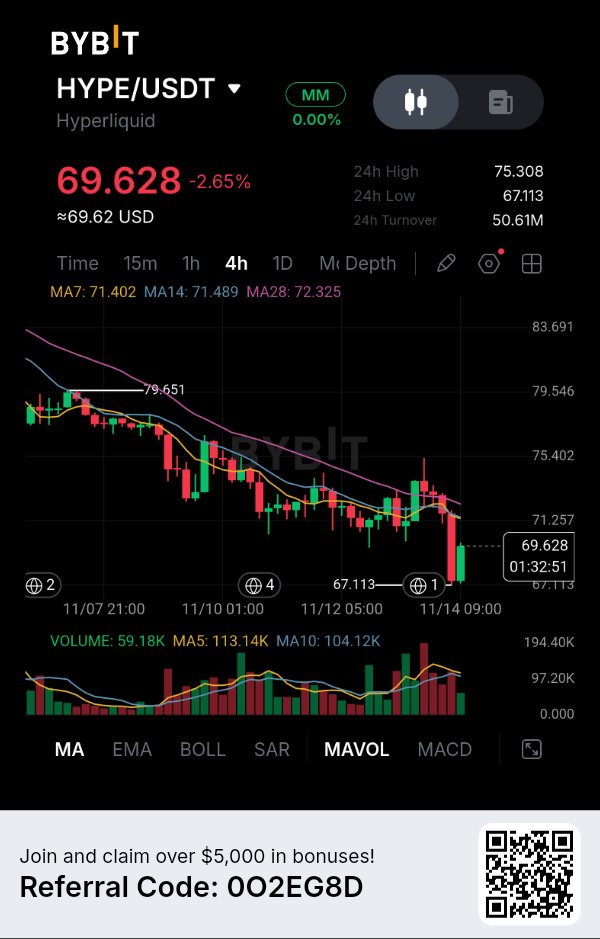
$HYPEUSDT — A SHARP BREAKDOWN TO $67.11, BUT THE RECOVERY ISN'T CONVINCING YET! What caught my attention on the 4H chart is how quickly HYPE lost ground after failing to sustain its recovery attempts. Price is currently trading around $69.628, down 2.65%, after dropping to $67.113 before producing a small rebound. That bounce is worth watching, but I don't see enough evidence yet to call it a trend reversal. THE TECHNICAL STORY The moving averages are providing a clear picture of the current pressure: MA7: $71.402 MA14: $71.489 MA28: $72.325 All three averages are sitting above the current price. This suggests the broader 4H structure remains bearish. Another detail caught my attention: displayed volume is 59.18K, while MA5 and MA10 volume averages are 113.14K and 104.12K. The latest recovery needs stronger participation before I would consider it a meaningful change in momentum. THE LEVEL THAT MATTERS The immediate resistance area is around $71.40–$72.33. If HYPE attempts to recover into this zone but fails to reclaim it, sellers could get another opportunity. The $67.113 low remains the important downside reference. MY CONDITIONAL TRADING PLAN — SHORT I'm interested in a short only if price produces a weak recovery and confirms rejection. Entry Zone: $71.40–$72.30 Stop Loss: $73.30 TP1: $67.15 TP2: $65.80 TP3: $64.50 INVALIDATION: A sustained 4H breakout above $73.30 would invalidate this proposed short setup. TP2 and TP3 are projected targets, not confirmed support levels on the visible chart. WHAT I'M WAITING FOR I don't want to chase HYPE after such a sharp decline. I'd rather see price revisit resistance, fail to establish acceptance above the moving averages, and give sellers another opportunity. The interesting question now is whether $67.11 was simply a temporary stopping point or the beginning of a deeper correction. Can HYPE reclaim $72, or will sellers use the next recovery to push price lower? $HYPEUSDT #ByXIMPACT

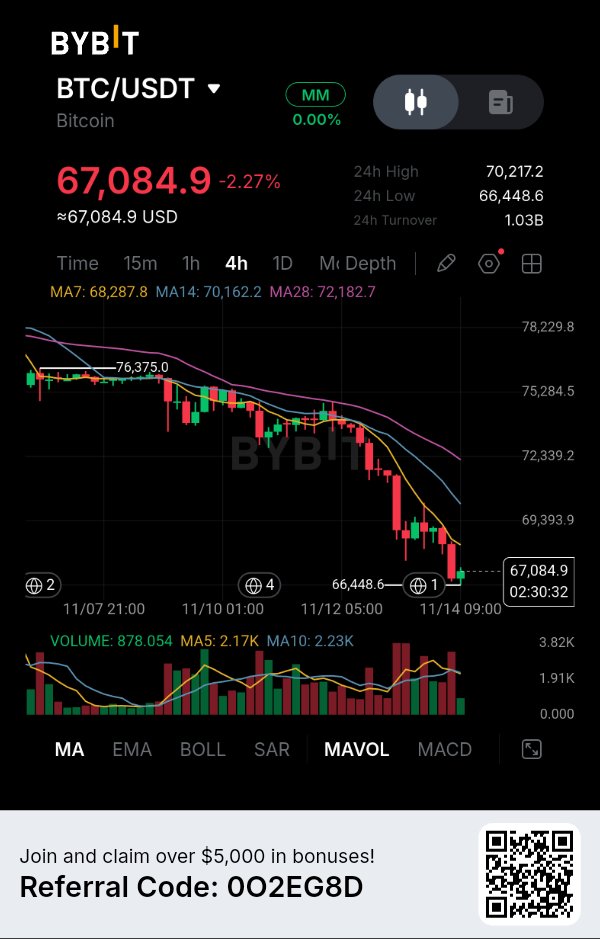
Bitcoin Is Approaching a Critical Support, But the Bigger Problem Is What Happened Before It Got Here. Bitcoin is trading near $67,084 after another significant decline, but what concerns me most is not the latest red candle. It is the speed at which buyers have lost control of the 4-hour market structure. Every recovery attempt has struggled to challenge the previous resistance, while the moving averages continue to point downward. I believe the current price action deserves more attention than simply calling this another market correction. MARKET STRUCTURE — SELLERS HAVE THE ADVANTAGE BTC is currently trading around $67,084.9, down 2.27%, with a 24-hour high of $70,217.2 and a low of $66,448.6. Looking at the 4-hour chart, Bitcoin has declined from approximately $76,375, creating a sequence of lower highs and lower lows. The latest selling wave pushed price toward $66,448.6, where some buying interest appeared. We can now see a small recovery candle near $67,084. However, I am not interpreting this bounce as a reversal. The broader structure remains bearish, and Bitcoin has not reclaimed any major moving-average resistance. Until that changes, sellers have the stronger technical position. THE MOVING AVERAGES REVEAL THE REAL PROBLEM Three readings stand out: - MA7: $68,287.8 - MA14: $70,162.2 - MA28: $72,182.7 All three moving averages are positioned above the current price. Even more importantly, they are arranged in bearish order, with MA7 below MA14 and MA14 below MA28. This reflects persistent downward momentum across the displayed moving-average periods. The first recovery challenge is around $68,287, followed by the much stronger resistance region near $70,162. For me, these levels represent more than technical lines. They are areas where a recovery must prove that buyers can actually regain control. VOLUME — THE BOUNCE NEEDS MORE PARTICIPATION Another detail caught my attention. The displayed volume is approximately 878.054, compared with MA5 at 2.17K and MA10 at 2.23K. Current volume is considerably below both averages. This suggests that the latest small recovery candle does not yet demonstrate strong buying participation. Meanwhile, the preceding decline contained several substantial volume bars, showing that the selling phase attracted significant market activity. I would therefore be careful about treating the current bounce as evidence of strong accumulation. A recovery needs participation, not just a change in candle color. THE DETAIL MANY TRADERS MAY OVERLOOK Bitcoin is approaching an important psychological decision point. After falling from above $76,000, the market is now attempting to stabilize around $67,000. But there is a difference between finding temporary support and building a sustainable recovery. The $66,448 region is the immediate level I am watching. If sellers break it convincingly, the market could extend its correction toward lower price areas. On the other hand, reclaiming $68,287 with stronger volume would be the first indication that downside momentum is weakening. My concern is that traders may become too optimistic after seeing a small bounce while the broader technical structure remains under pressure. MY TRADING STRATEGY — SHORT My preferred direction remains SHORT, ideally after a temporary recovery into resistance rather than chasing Bitcoin near its recent low. - Direction: SHORT - Entry Zone: $69,200–$69,800 - Confirmation: 4H bearish rejection within the entry zone. - Stop Loss: $70,500 - TP1: $66,450 - TP2: $65,500 - TP3: $64,500 Estimated Risk/Reward: Approximately 1:1.5 to 1:3.3, depending on entry and execution. TP1 is based on the visible recent low, while TP2 and TP3 are projected downside extensions rather than confirmed support levels on this screenshot. A sustained move above $70,500 would invalidate this setup. If Bitcoin continues falling without providing the planned entry, I would not chase the move. WHAT COULD CHANGE MY VIEW? A strong 4-hour recovery above $70,162, supported by expanding volume, would make me reconsider the bearish outlook. Reclaiming that moving average would represent a meaningful improvement in market structure. Until then, I prefer to respect the prevailing trend instead of anticipating a reversal. FINAL THOUGHT Bitcoin does not need another temporary bounce to change the market narrative. It needs to reclaim important resistance and prove that buyers can sustain control. Until that happens, the recovery remains something to question rather than celebrate. $BTCUSDT #ByXIMPACT

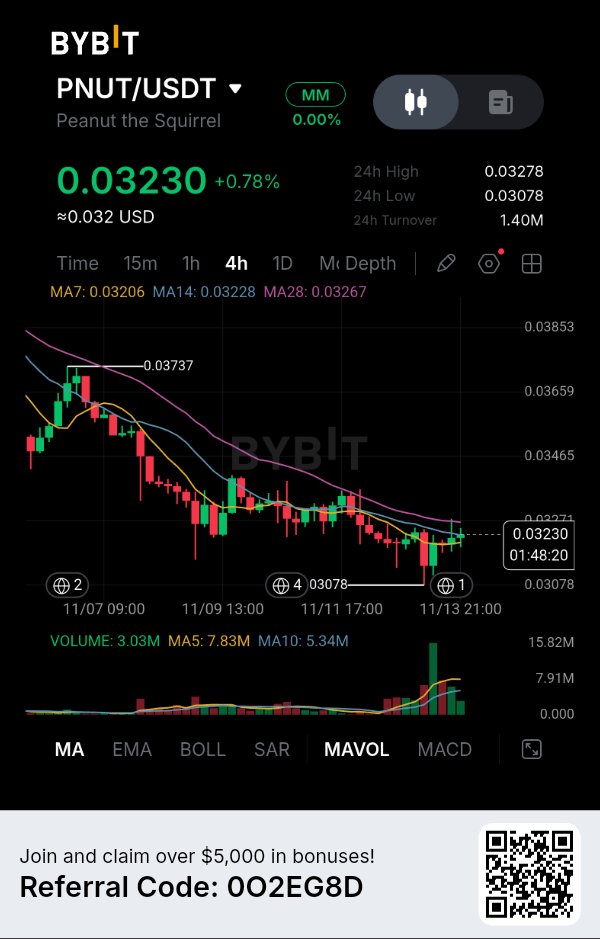
$PNUTUSDT Buyers Are Attempting a Recovery, But One Resistance Zone Could Decide the Next Move. PNUT has started showing signs of recovery after touching $0.03078, but I am not convinced that buyers have regained control. The interesting part of this chart is the difference between short-term momentum and the broader trend: price is recovering above its fastest moving average while remaining underneath the longer moving-average resistance. That creates a potentially important decision point for the next 4-hour candles. MARKET STRUCTURE — A RECOVERY INSIDE A DECLINING TREND PNUT is currently trading around $0.03230, up 0.78%, with a 24-hour high of $0.03278 and a low of $0.03078. Looking at the broader 4-hour structure, the token has declined from approximately $0.03737, establishing a sequence of lower highs and lower price levels. Recently, sellers pushed price toward $0.03078, where buyers appeared and attempted to stabilize the market. The latest candles show some recovery, but the larger descending structure remains intact. For me, this is an important distinction. A recovery from support can create a trading opportunity without necessarily confirming a complete trend reversal. THE MOVING AVERAGE BATTLE The displayed moving averages provide three important reference points: - MA7: $0.03206 - MA14: $0.03228 - MA28: $0.03267 Price has moved above MA7 and is trading around MA14, which suggests that immediate selling pressure has eased. However, MA28 remains overhead resistance. I am particularly interested in the $0.03260–$0.03278 region. This area combines the longer moving average with the recent 24-hour high. If buyers cannot reclaim this region, the current recovery could turn into another lower high. That would reinforce the existing bearish market structure. VOLUME — A RECOVERY THAT STILL NEEDS CONFIRMATION There is another detail worth examining. The displayed volume is approximately 3.03M, while MA5 stands at 7.83M and MA10 at 5.34M. Current volume is below both averages. The chart also shows a noticeable earlier green volume expansion during the recent recovery attempt. However, participation has subsequently cooled. This is where I become cautious. Price is recovering, but the latest volume reading does not demonstrate sustained buying strength. I would want to see stronger participation before treating this move as a genuine bullish breakout. A price increase without consistent volume expansion can struggle when it reaches established resistance. THE DETAIL OTHER TRADERS MIGHT MISS The most interesting part of PNUT's current structure is that buyers have managed to defend the $0.03078 region, but they have not yet changed the sequence of lower highs. This means the market is currently showing two different signals. Short-term stabilization is visible, while the broader trend still favors sellers. I believe the resistance region around $0.03267–$0.03278 deserves more attention than the current 0.78% gain. If sellers defend this area again, PNUT could revisit its recent support. MY TRADING STRATEGY — SHORT My preferred scenario is a conditional SHORT on a failed recovery into resistance. - Direction: SHORT - Entry Zone: $0.03255–$0.03275 - Trigger: Bearish rejection from the resistance zone on the 4H chart. - Stop Loss: $0.03305 - TP1: $0.03150 - TP2: $0.03078 - TP3: $0.03020 Estimated Risk/Reward: Approximately 1:2.3 to 1:4.9, depending on entry and execution. TP1 is an intermediate projected support, TP2 is the visible chart low, and TP3 is an estimated extension below the displayed structure. A sustained 4-hour reclaim above $0.03305 would invalidate this short setup. I would also avoid chasing the trade if price falls without offering the planned entry. WHAT COULD CHANGE MY VIEW? A strong 4-hour breakout above $0.03278, supported by expanding volume, would weaken my bearish interpretation. Reclaiming MA28 and establishing higher highs would provide stronger evidence that buyers are taking control. Until then, I see the current recovery as a test of resistance rather than proof of a new uptrend. FINAL THOUGHT PNUT has shown that buyers are willing to defend lower prices. Now the market needs to prove they can do more than defend support — they need to overcome the resistance that has controlled the broader trend. $PNUTUSDT #ByXIMPACT