BlockchainSecurity
Learn how to protect your crypto assets with practical security habits: enable two-factor authentication, use unique passwords, activate withdrawal address whitelists and anti-phishing codes, review wallet approvals regularly, avoid unknown links and signatures, and store long-term holdings in a secure wallet. Stay alert to hacks, scams and unauthorized transactions.

🔐 Secure Your Crypto!
We spend hours analyzing charts and finding opportunities, but how often do we protect what we already own? One careless click can cost everything. Here are 6 essential security habits: 🔸 Enable 2FA for extra protection. 🔸 Use strong, unique passwords. 🔸 Activate withdrawal whitelists. 🔸 Set up anti-phishing codes. 🔸 Review wallet approvals regularly. 🔸 Store long-term assets in secure wallets. Remember, protecting your crypto is just as important as growing it. Protect your assets before chasing profits. 🔐 What's your most important crypto security habit? #BlockchainSecurity $BTCUSDT $XRPUSDT



World Liberty Financial is turning to token buybacks after a difficult period for its governance token. The announcement arrived as $WLFIUSDT faced renewed selling pressure following the US midterm elections, exposing how closely the project's market sentiment remains connected to political developments. But a buyback announcement alone cannot reverse a prolonged decline. Investors still need to know how much capital will enter the market, how purchases will be executed and whether the programme creates lasting demand. On November 6, World Liberty Financial announced that it was launching a buyback programme funded through an initial allocation that may include fees generated from reserves backing its USD1 stablecoin and other sources. The stated objective is to encourage governance participation and increase the voting power of long-term holders. The project also described buybacks as an ongoing part of its strategy, with the pace and scale depending on ecosystem growth and participation. The missing details are important. World Liberty has not disclosed the initial funding allocation, a purchase schedule or a specific amount of WLFI it intends to acquire. Without those figures, the market cannot estimate the programme's potential buying pressure. There is also a distinction between buying tokens and burning them. A purchase does not automatically remove tokens from circulation; that depends on what happens to the acquired supply afterwards. WLFI's market performance explains why the announcement attracted attention. Reuters reported on November 6 that the token had fallen approximately 10% following the election results and more than 60% since the beginning of 2026. Around 32% of its maximum supply of 100 billion tokens was reportedly in circulation. This means future supply releases remain relevant even if the buyback programme creates additional demand. The proposed funding source introduces another variable. If income from USD1 reserves contributes meaningfully to purchases, the relationship between stablecoin adoption and WLFI demand becomes more direct. Greater USD1 activity could potentially generate more revenue for the programme. However, the company has not disclosed how much of the funding will come from reserve income, so the scale of that relationship remains uncertain. Governance is equally important. WLFI voting power is linked to token holdings, meaning buybacks could increase the relative influence of holders who retain their tokens. That may encourage longer-term participation, but it also raises questions about how concentrated voting power could become. The programme should therefore be assessed not only by its effect on price, but also by its transparency and impact on governance. For WLFI, the next meaningful evidence will be actual on-chain purchases, disclosed funding and clear reporting on the treatment of acquired tokens. Until those details emerge, the announcement is a proposed source of support rather than proof that selling pressure has been absorbed. Key questions: 1. Can WLFI buybacks create sustained demand after a decline of more than 60%? 2. Will USD1 reserve income provide meaningful and consistent funding? 3. Could concentrating voting power among long-term holders weaken governance participation? #BlockchainSecurity

Greece Approves New Crypto Tax Rules for Investors
Crypto regulations in Europe keep moving forward. Greece's parliament has officially approved a new crypto tax framework. Now, if you trade crypto or earn income through DeFi in Greece, you need to understand the new tax rules. Let's break down what is happening. 10% Tax on Crypto Gains Greece has approved a 10% tax on cryptocurrency investment gains. But there is some relief for smaller investors. Annual crypto gains of up to €500 will remain tax-free. This means that if you make profits from crypto investments, you will need to consider this exemption when calculating your taxes. 15% Tax on DeFi Income There is also an important update for DeFi users. Income earned through staking, crypto lending and liquidity pools will face a 15% tax. This means that taxes will not only apply to trading profits but also to income earned by using crypto assets on DeFi platforms. Investors will need to include this extra cost when calculating their actual returns. 12 Months to Declare Previous Gains There is some relief for investors here. People who have not declared their previous crypto gains will get 12 months to report eligible past gains. Those who declare within this period may avoid late-filing penalties and interest, subject to the applicable conditions. What About Crypto-to-Crypto Swaps? There is still one important question that needs a clear answer. If an investor converts Bitcoin into Ethereum or swaps one cryptocurrency for another, how will the tax apply to that transaction? We will have to wait for the final implementation guidelines to understand this properly. My Take Greece's decision shows that crypto regulations in Europe are getting closer to traditional financial rules. Investors will now need to look beyond entry prices, exit prices and trading fees. Tax rules are also becoming an important part of managing a crypto portfolio. But the real test will be how these rules are implemented. It will be interesting to see how the new framework affects crypto investors and DeFi users. What do you think? Will taxing crypto profits make the market more regulated, or could it push investors away from crypto trading and DeFi? #ByXIMPACT #WSOT2026 #BybitAIEvolving #BlockchainSecurity


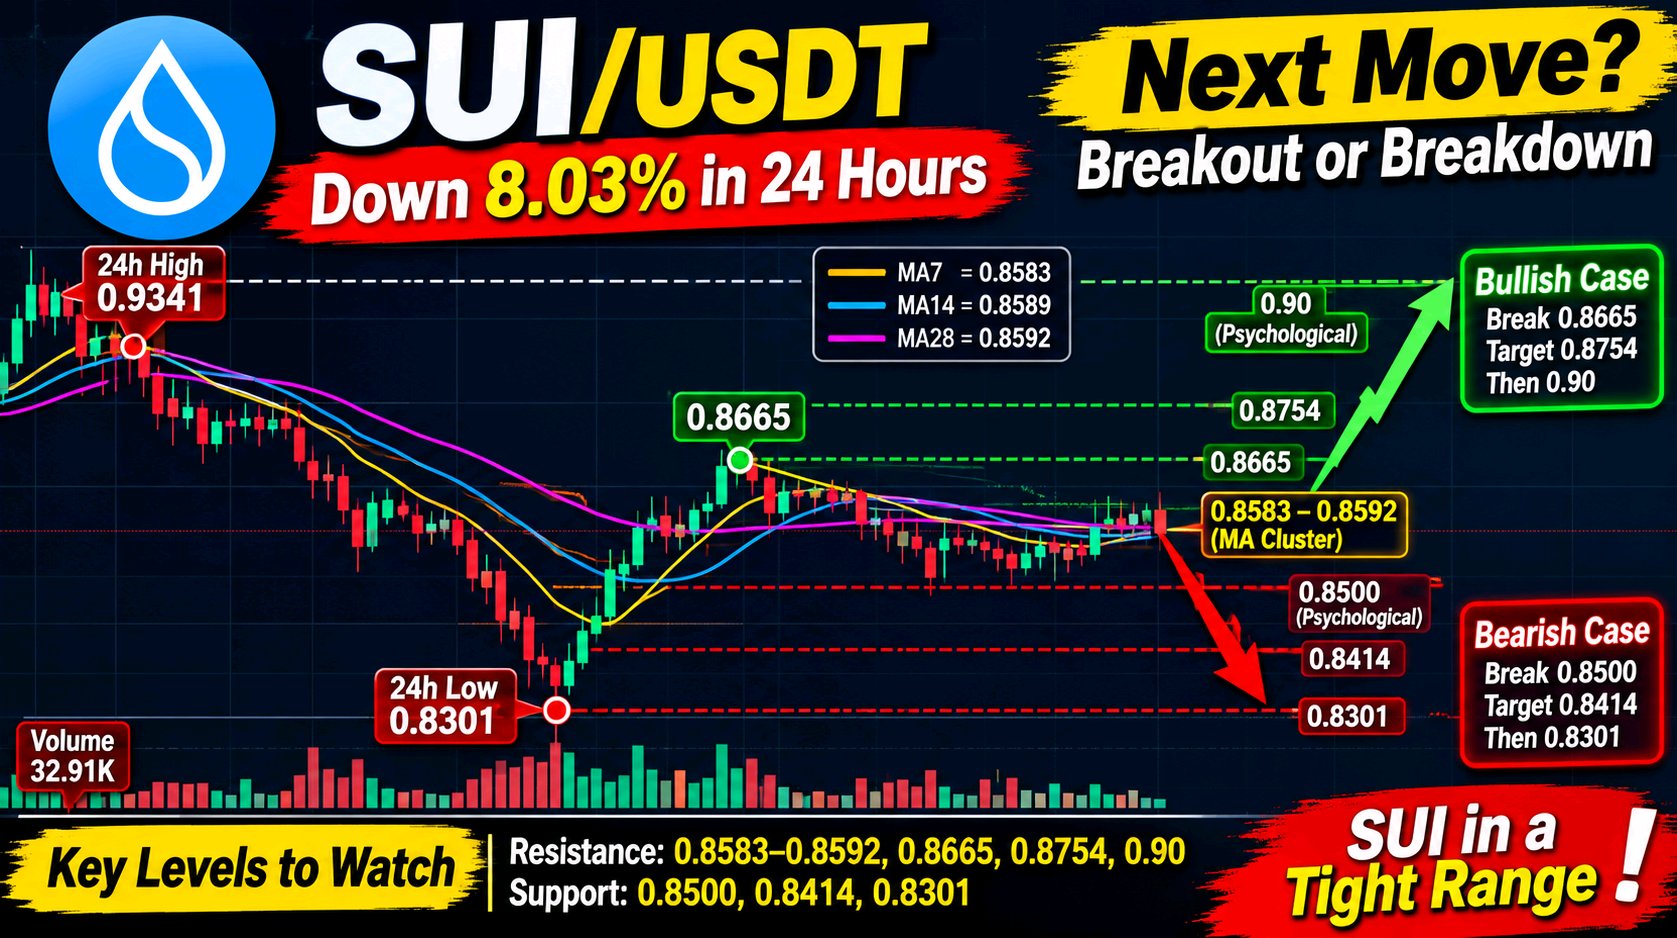
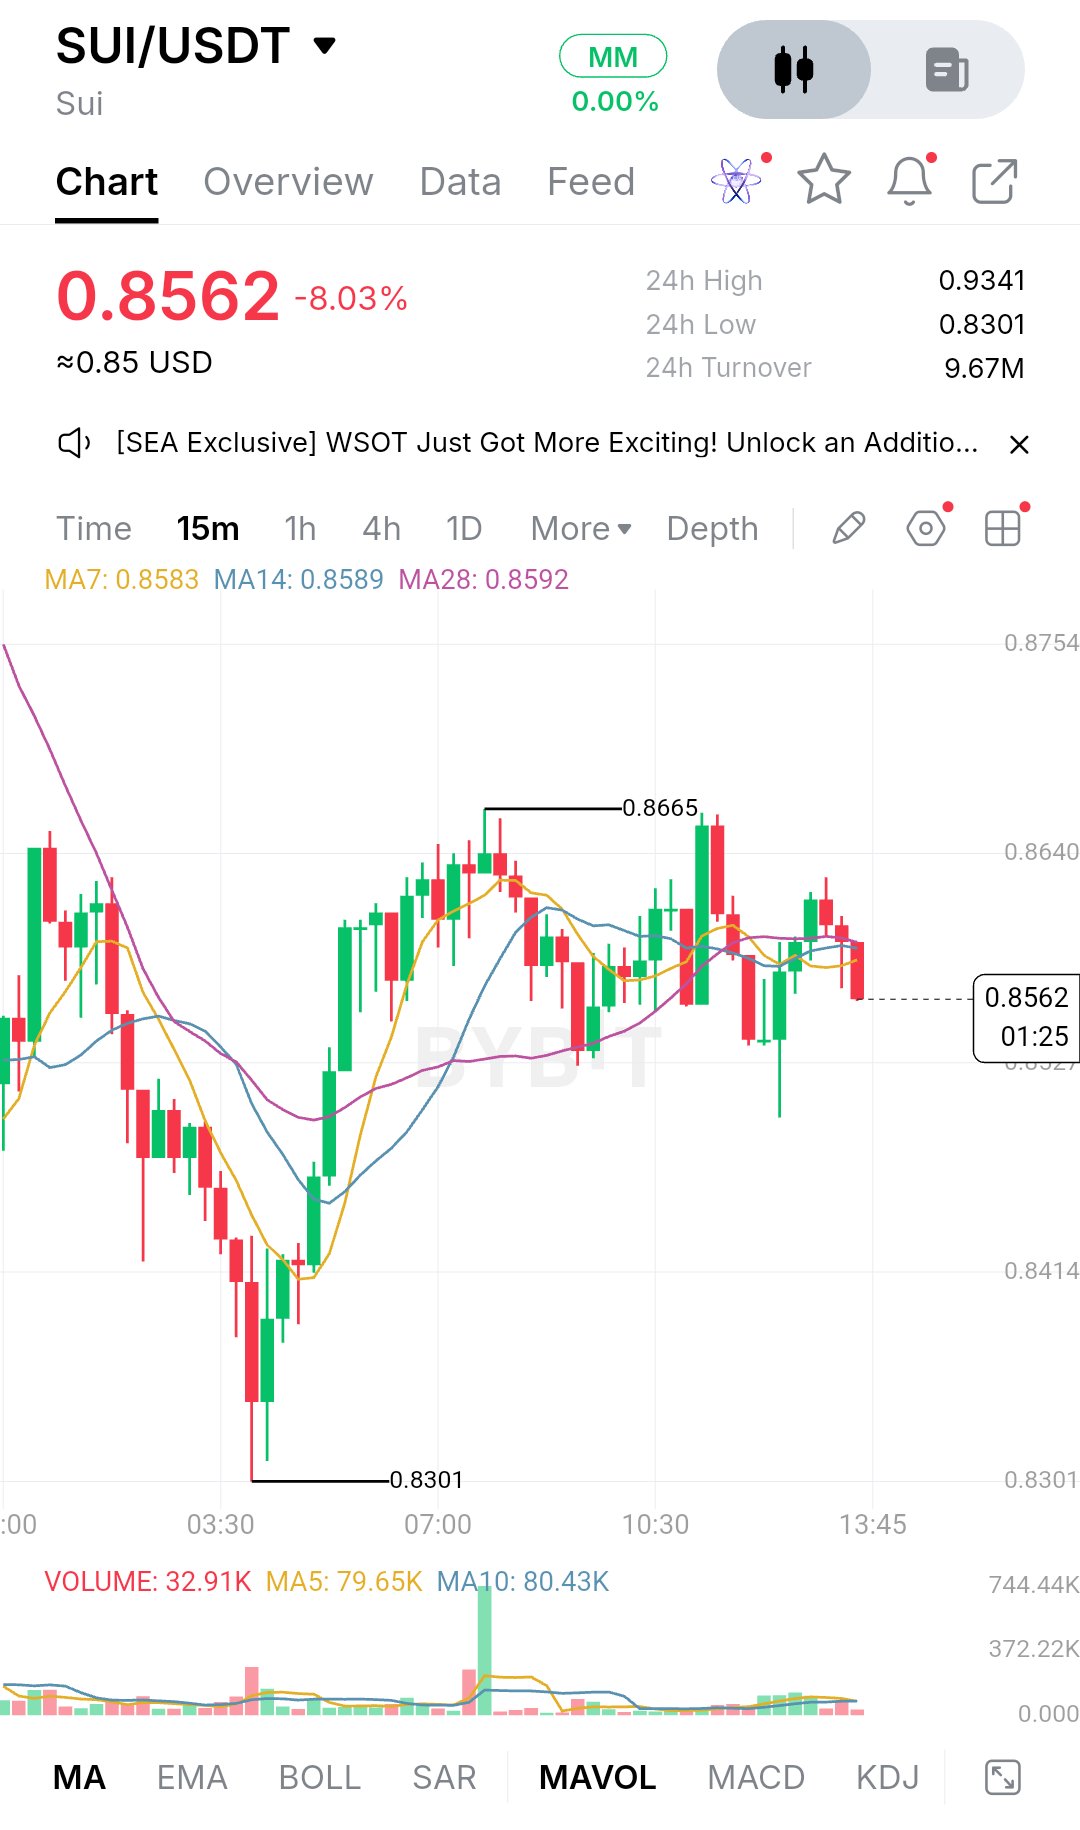
$SUIUSDT is trading at 0.8562, down 8.03% over the last 24 hours. The day began with buyers pushing price as high as 0.9341, but that strength didn't hold, and sellers took control from there. The slide ended at 0.8301, which is where the real damage stopped. That low was marked by a long wick, a sign that dip buyers showed up aggressively once price got there. Since then the chart has told a more cautious story. Price bounced hard from 0.8301, climbed back to a local high of 0.8665 around 07:15, and has spent the hours since moving sideways with a slightly heavier tone. The recovery was clean, but it never turned into a full reversal. Rallies keep stalling in the same area, and each push up is being sold into. The structure right now is a tight range sitting inside a larger downtrend. After a fast flush and a sharp rebound, the market is digesting. The candles are getting smaller, wicks are showing up on both sides, and price keeps rotating around the same band. That is classic consolidation, but the direction of the earlier move matters. Until buyers prove otherwise, this reads more like a pause than a bottom. On the moving averages, MA7 sits at 0.8583, MA14 at 0.8589 and MA28 at 0.8592, all bunched together right above the current price. When they compress like this, it usually means momentum has gone flat. Price is now trading slightly under all three, which turns that cluster into overhead resistance rather than support. The most recent candles are red and closing below the group, so short-term control leans toward sellers for the moment. Volume adds some context. The biggest spike of the session came during the push toward 0.8665, which is where buyers made their strongest attempt and where sellers answered. Since then activity has dried up. The latest volume reading is 32.91K against MA5 at 79.65K and MA10 at 80.43K, so current participation is well below recent averages. Low volume in a range tells you neither side is convinced, and it often comes before a larger move once one side commits. The first support to watch is the 0.8500 area, a round number sitting just below current price, and the level most likely to be tested next if sellers keep pressing. Below that, the 0.8414 zone on the chart's price axis is the next reference point. The big one is 0.8301, the session low and the spot where the rebound began. If price comes back there and holds again, buyers will have defended it twice, which strengthens the range. A clean break below with strong volume would be a different story. It would erase the entire recovery and open the door to fresh lows, because there is no obvious structure beneath it on this chart. On the upside, the immediate resistance is the moving average cluster around 0.8583 to 0.8592. Above that sits 0.8640, a level the chart has reacted to before, followed by the swing high at 0.8665. A move through that high would be the first real sign of strength. Beyond it, 0.8754 is the top of the visible range and the next logical target, and the 0.90 psychological zone sits higher still, with the 24-hour high of 0.9341 as the major ceiling for the day. For the bullish case, buyers first need to reclaim the moving average cluster and hold above it on closing candles. After that, they need to take out 0.8665 with rising volume, not the thin participation we have now. If that happens, 0.8754 becomes a realistic next stop, and a sustained hold above it would put 0.90 back in play. The key is follow-through. A breakout on weak volume has a much higher chance of fading. The bearish case is simpler. If price keeps getting rejected under 0.8590 and prints lower highs, sellers stay in control. That likely brings 0.8500 into play first, then 0.8414. If those give way, a retest of 0.8301 becomes likely, and a close below it would confirm that the earlier bounce was just a relief move inside a larger decline. Key price levels: - Resistance: 0.8583 to 0.8592 (MA cluster), 0.8640, 0.8665 (swing high), 0.8754, 0.90 (psychological), 0.9341 (24h high) - Support: 0.8500 (psychological), 0.8414, 0.8301 (24h low) - Current price: 0.8562 Overall, SUI is sitting in a compressed range after a sharp drop and a strong bounce, with price pinned just beneath a flat cluster of moving averages and volume fading. That combination usually does not last long. The next meaningful move will likely come from either a volume-backed break above 0.8665 or a decisive loss of 0.8500 and then 0.8301. Rather than guessing direction, it makes more sense to watch how price reacts at those edges, because the quality of that reaction will say a lot about whether the next expansion is a recovery or a continuation lower. This is not financial advice, so manage your risk accordingly. #BlockchainSecurity $ETHUSDT

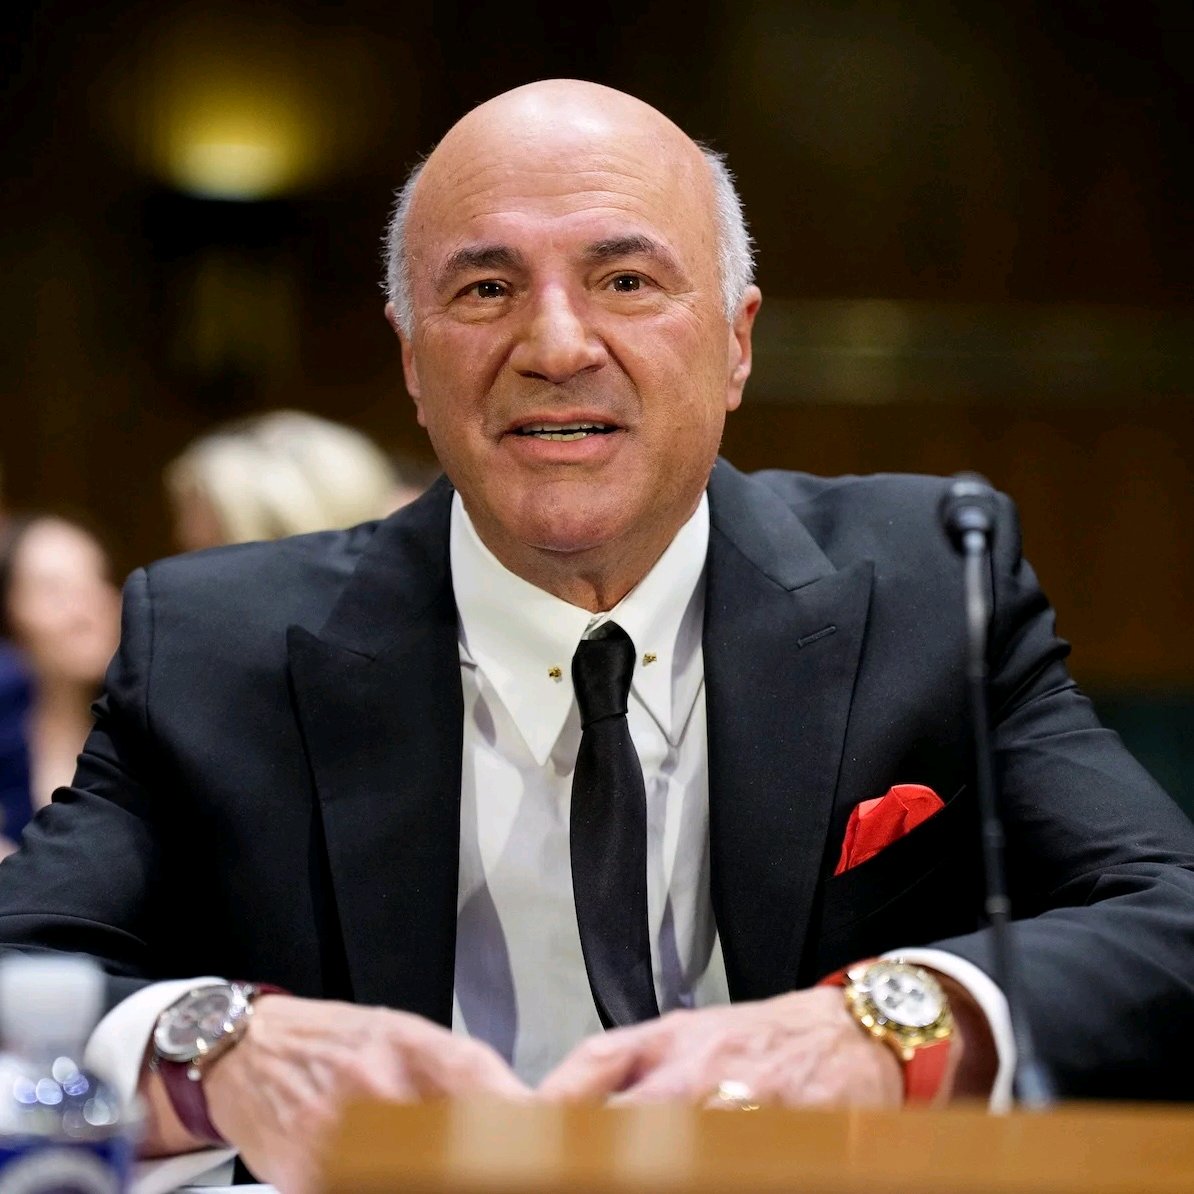
Binance and CZ have subpoenaed Kevin O'Leary in the ongoing $1.76 billion FTX lawsuit. ₿ $BTC The legal battle centres on a 2021 deal in which FTX repurchased Binance's ownership stake. Bankruptcy administrators allege that the transaction was funded using misappropriated customer assets. Binance and CZ have denied wrongdoing and attempted to dismiss the lawsuit, arguing that responsibility for FTX's collapse lies with Sam Bankman-Fried. A US bankruptcy judge ruled in July that the $1.76 billion recovery claim could proceed, keeping the dispute alive. $BTCUSDT #USPayrollsAndRateDecisionsDriveMacroWeek #BlockchainSecurity #BybitAIEvolving #OilVolatilityTracksIranPeaceTalks #ByXIMPACT


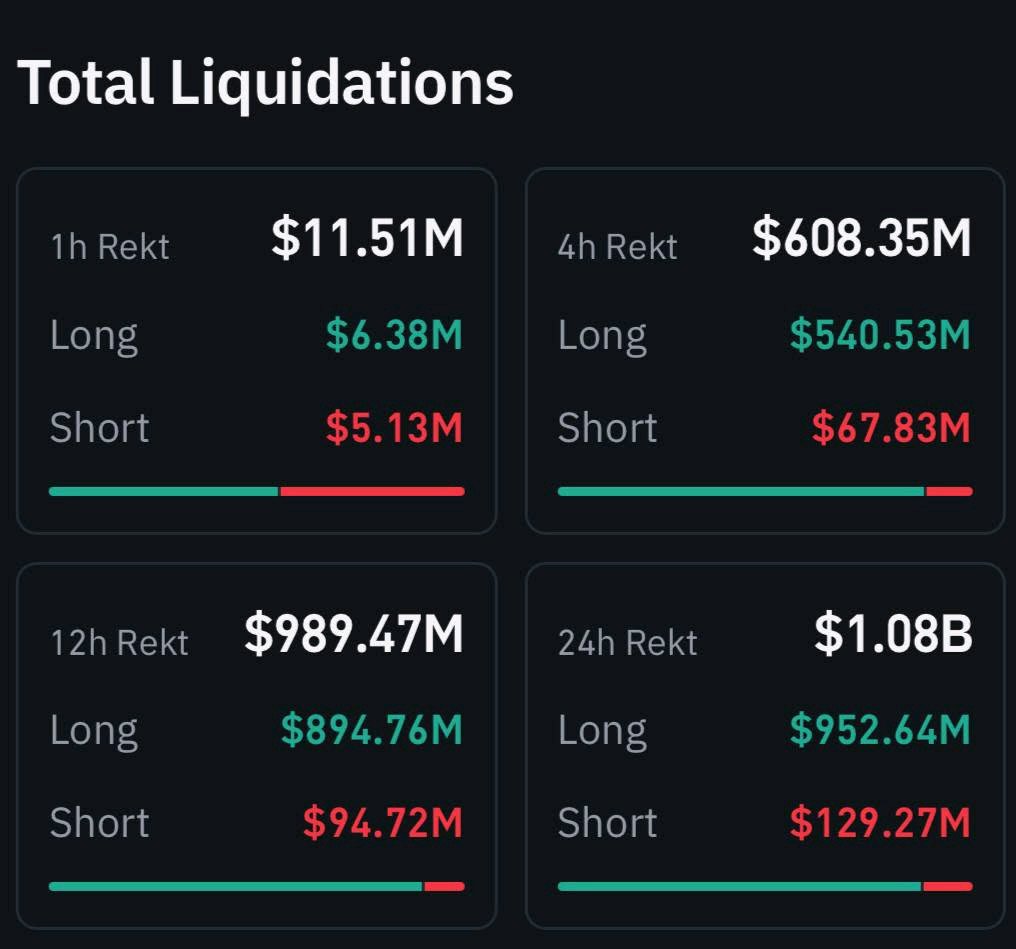
What on earth is happening in the financial markets right now ? honestly, this is becoming one of the most difficult periods to navigate, not just for stock investors but for crypto traders as well. The combination of political uncertainty, Trump's influence over government decisions, shifting economic expectations and growing market anxiety is creating an environment where confidence can disappear incredibly fast. And the consequences are showing up everywhere. Stocks and Crypto Are Feeling the Pressure what concerns me most is how quickly sentiment has changed. Investors who were comfortable holding risk asets are suddenly becoming more defensive. When uncertainty increases around government policy, trade decisions, economic direction, and interest rates, traditional markets can react aggressively. The stock market is particularly sensitive to these developments because large companies depend on stable economic conditions, predictable policies, and investor confidence. But crypto is not isolated from that environment. Bitcoin and the broader cryptocurrency market are still heavily influenced by global liquidity and overall risk appetite. When investors start reducing exposure to risky assets, crypto often feels the pressure alongside technology stocks and other growth-oriented investments. That is why we can see selling pressure across multiple markets at the same time. $1 BILLION+ LIQUIDATIONS. That's Not Something to Ignore. 🔴 The liquidation figure makes the situation even more concerning. When more than $1 billion in leveraged positions gets liquidated, it shows how dangerous excessive leverage can become during sudden market movements. Long positions can get wiped out when prices fall sharply. Then, if the market rebounds aggressively, overleveraged short positions can become the next targets. This creates a chain reaction. price drops trigger liquidations, liquidations add further selling pressure, and panic encourages more traders to exit their positions. Before long, the market can move much further than many participants expected. However, I would separate forced liquidations from genuine long-term selling. They are not necessarily the same thing. What Am I Watching Now? I am not interested in blindly buying every dip, but I am also not convinced that every sharp correction means the entire market cycle is finished. My focus is on three things. First, whether Bitcoin can establish a meaningful support zone instead of continuing to print lower lows. Second, whether traditional stock markets can regain stability. A sustained recovery in risk sentiment could help crypto as well. Third, whether liquidation pressure starts cooling down. Until excessive leverage is cleared, sudden volatility can remain a serious problem. for now, capital preservation matters more to me than trying to catch every falling candle. I would rather miss the first part of a recovery than enter too early and get caught in another liquidation wave. My Personal Trading Strategy I am keeping my leverage low, avoiding emotional entries, and watching important support and resistance levels before making decisions. If the market stabilizes, I will look for confirmation before considering new positions. If selling pressure continues, I am comfortable staying patient and keeping some capital available for better opportunities. One thing is certain: political headlines can change market sentiment quickly, but price action still needs to confirm the direction. This is a market where risk management is not optional. what do you think is driving this situation more right now: Trump's political influence, macroeconomic uncertainty, institutional selling, or excessive leverage across the financial markets? Are we looking at a temporary liquidity shock, or could this be the beginning of a much deeper correction? Let's hear your thoughts. #BlockchainSecurity #Oracle20BFundingPlanTestsTheAITrade #AnthropicIPOTestsTheAIBoom #BOERateDecision #BybitAIEvolving $BTCUSDT $ETHUSDT


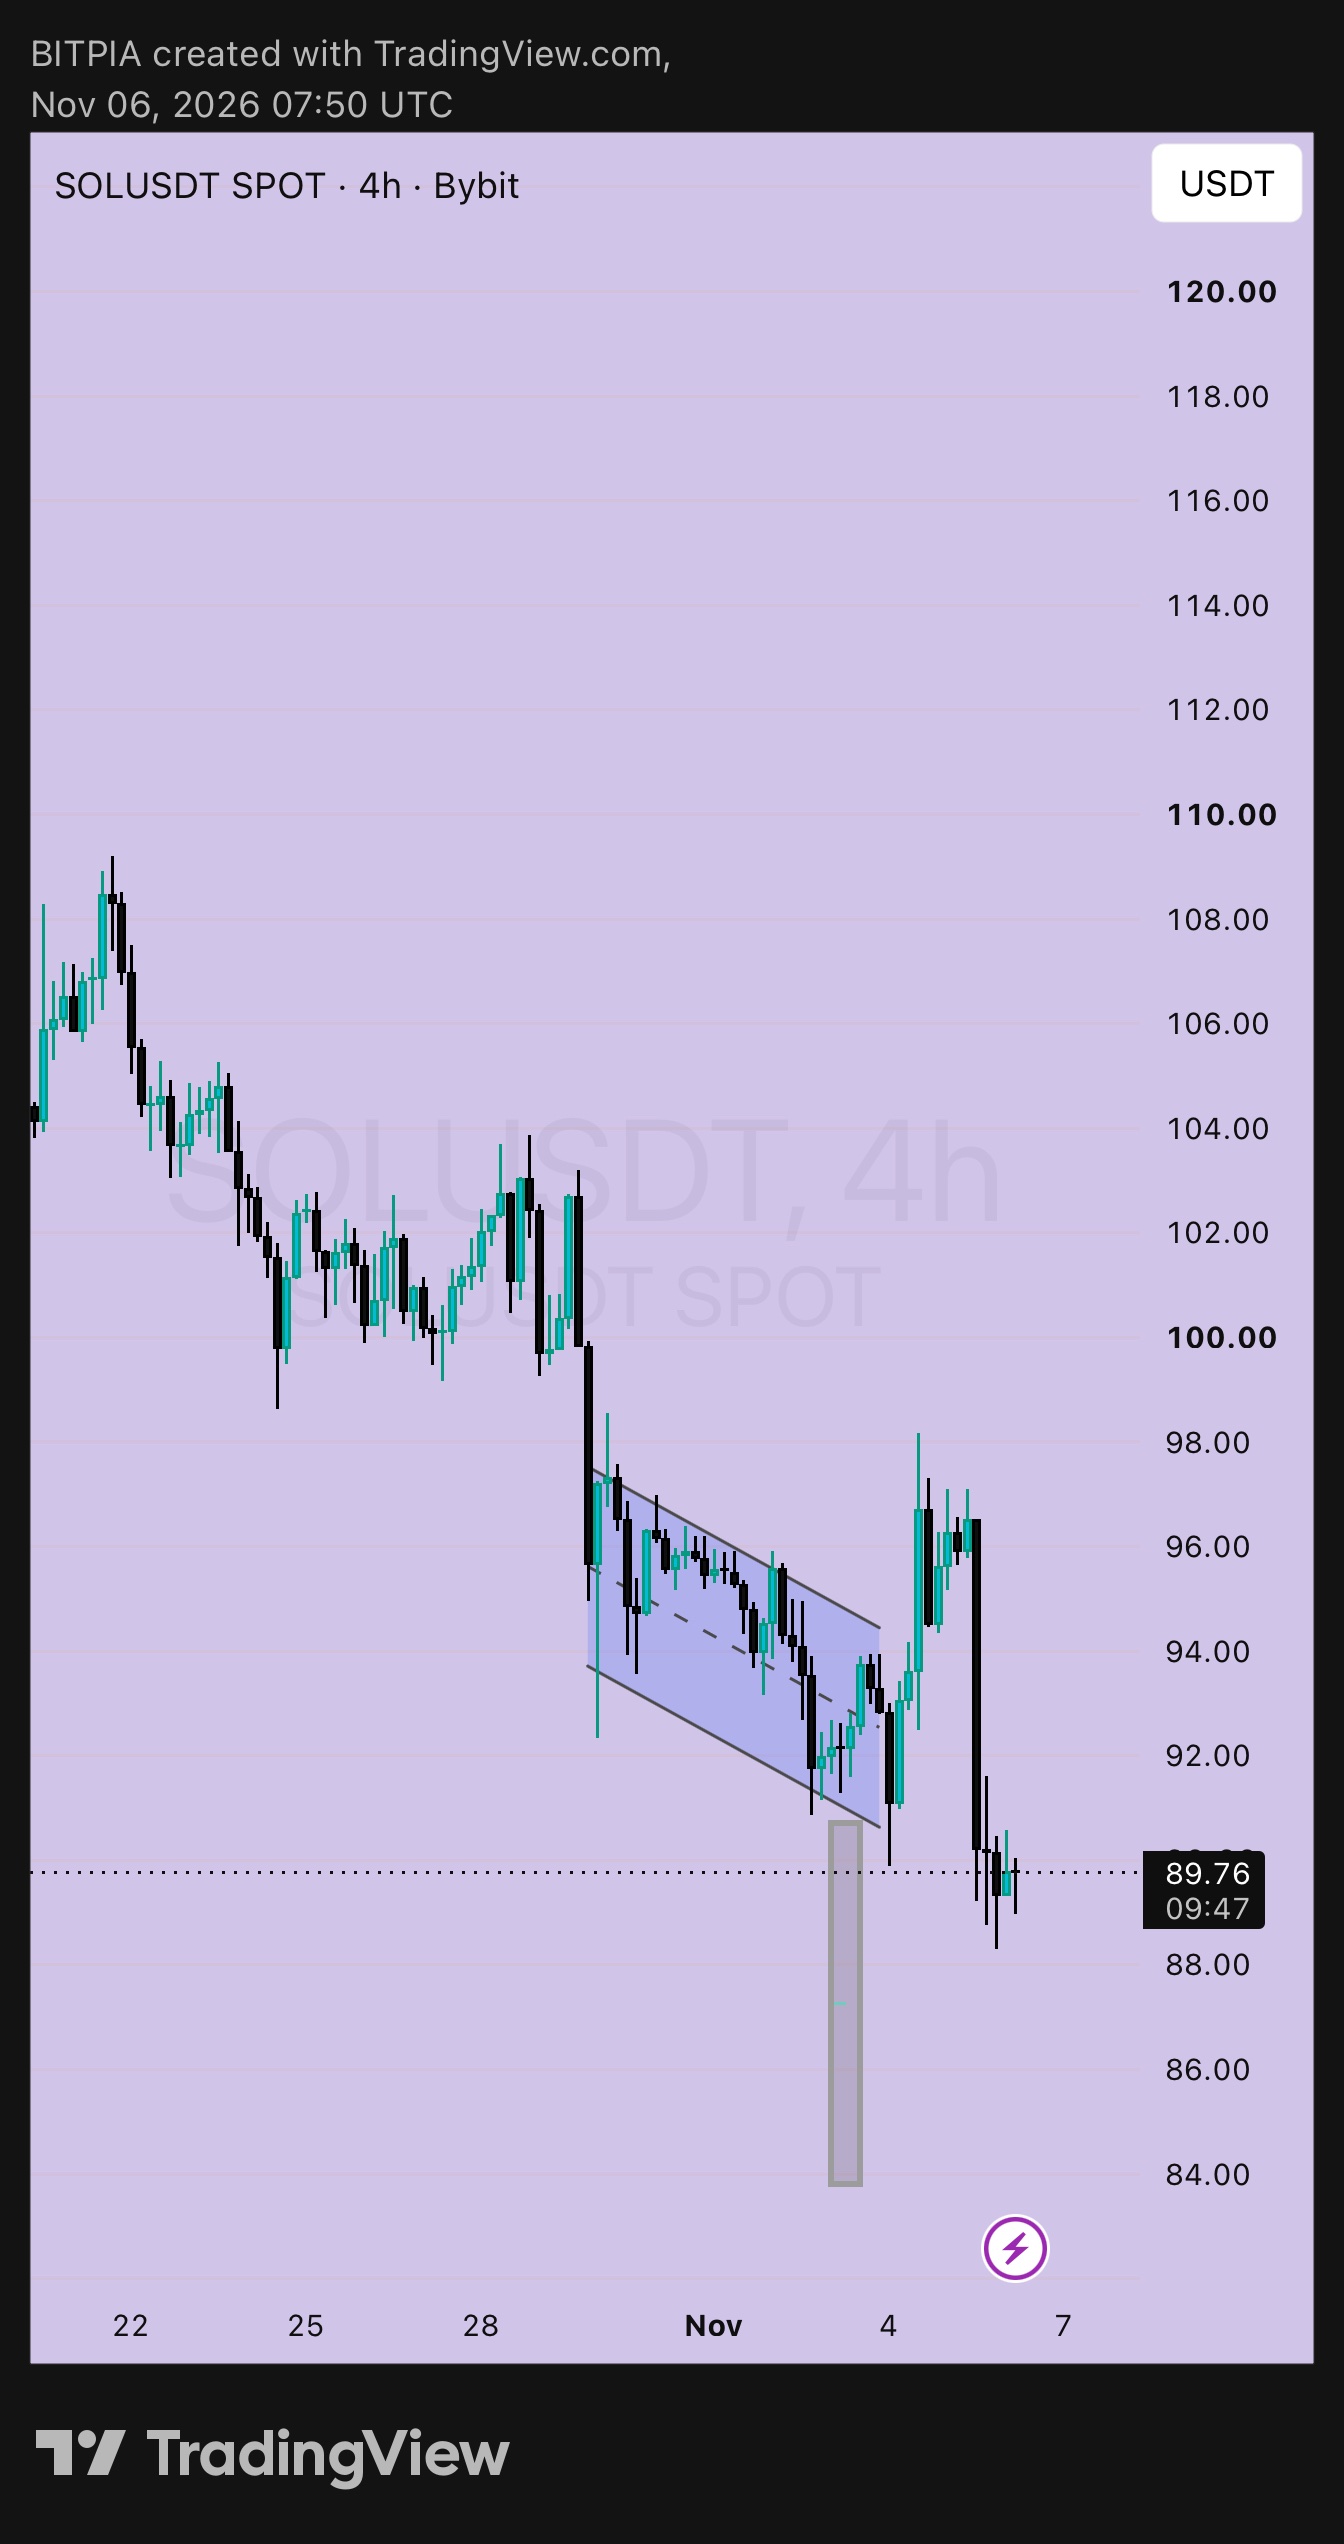
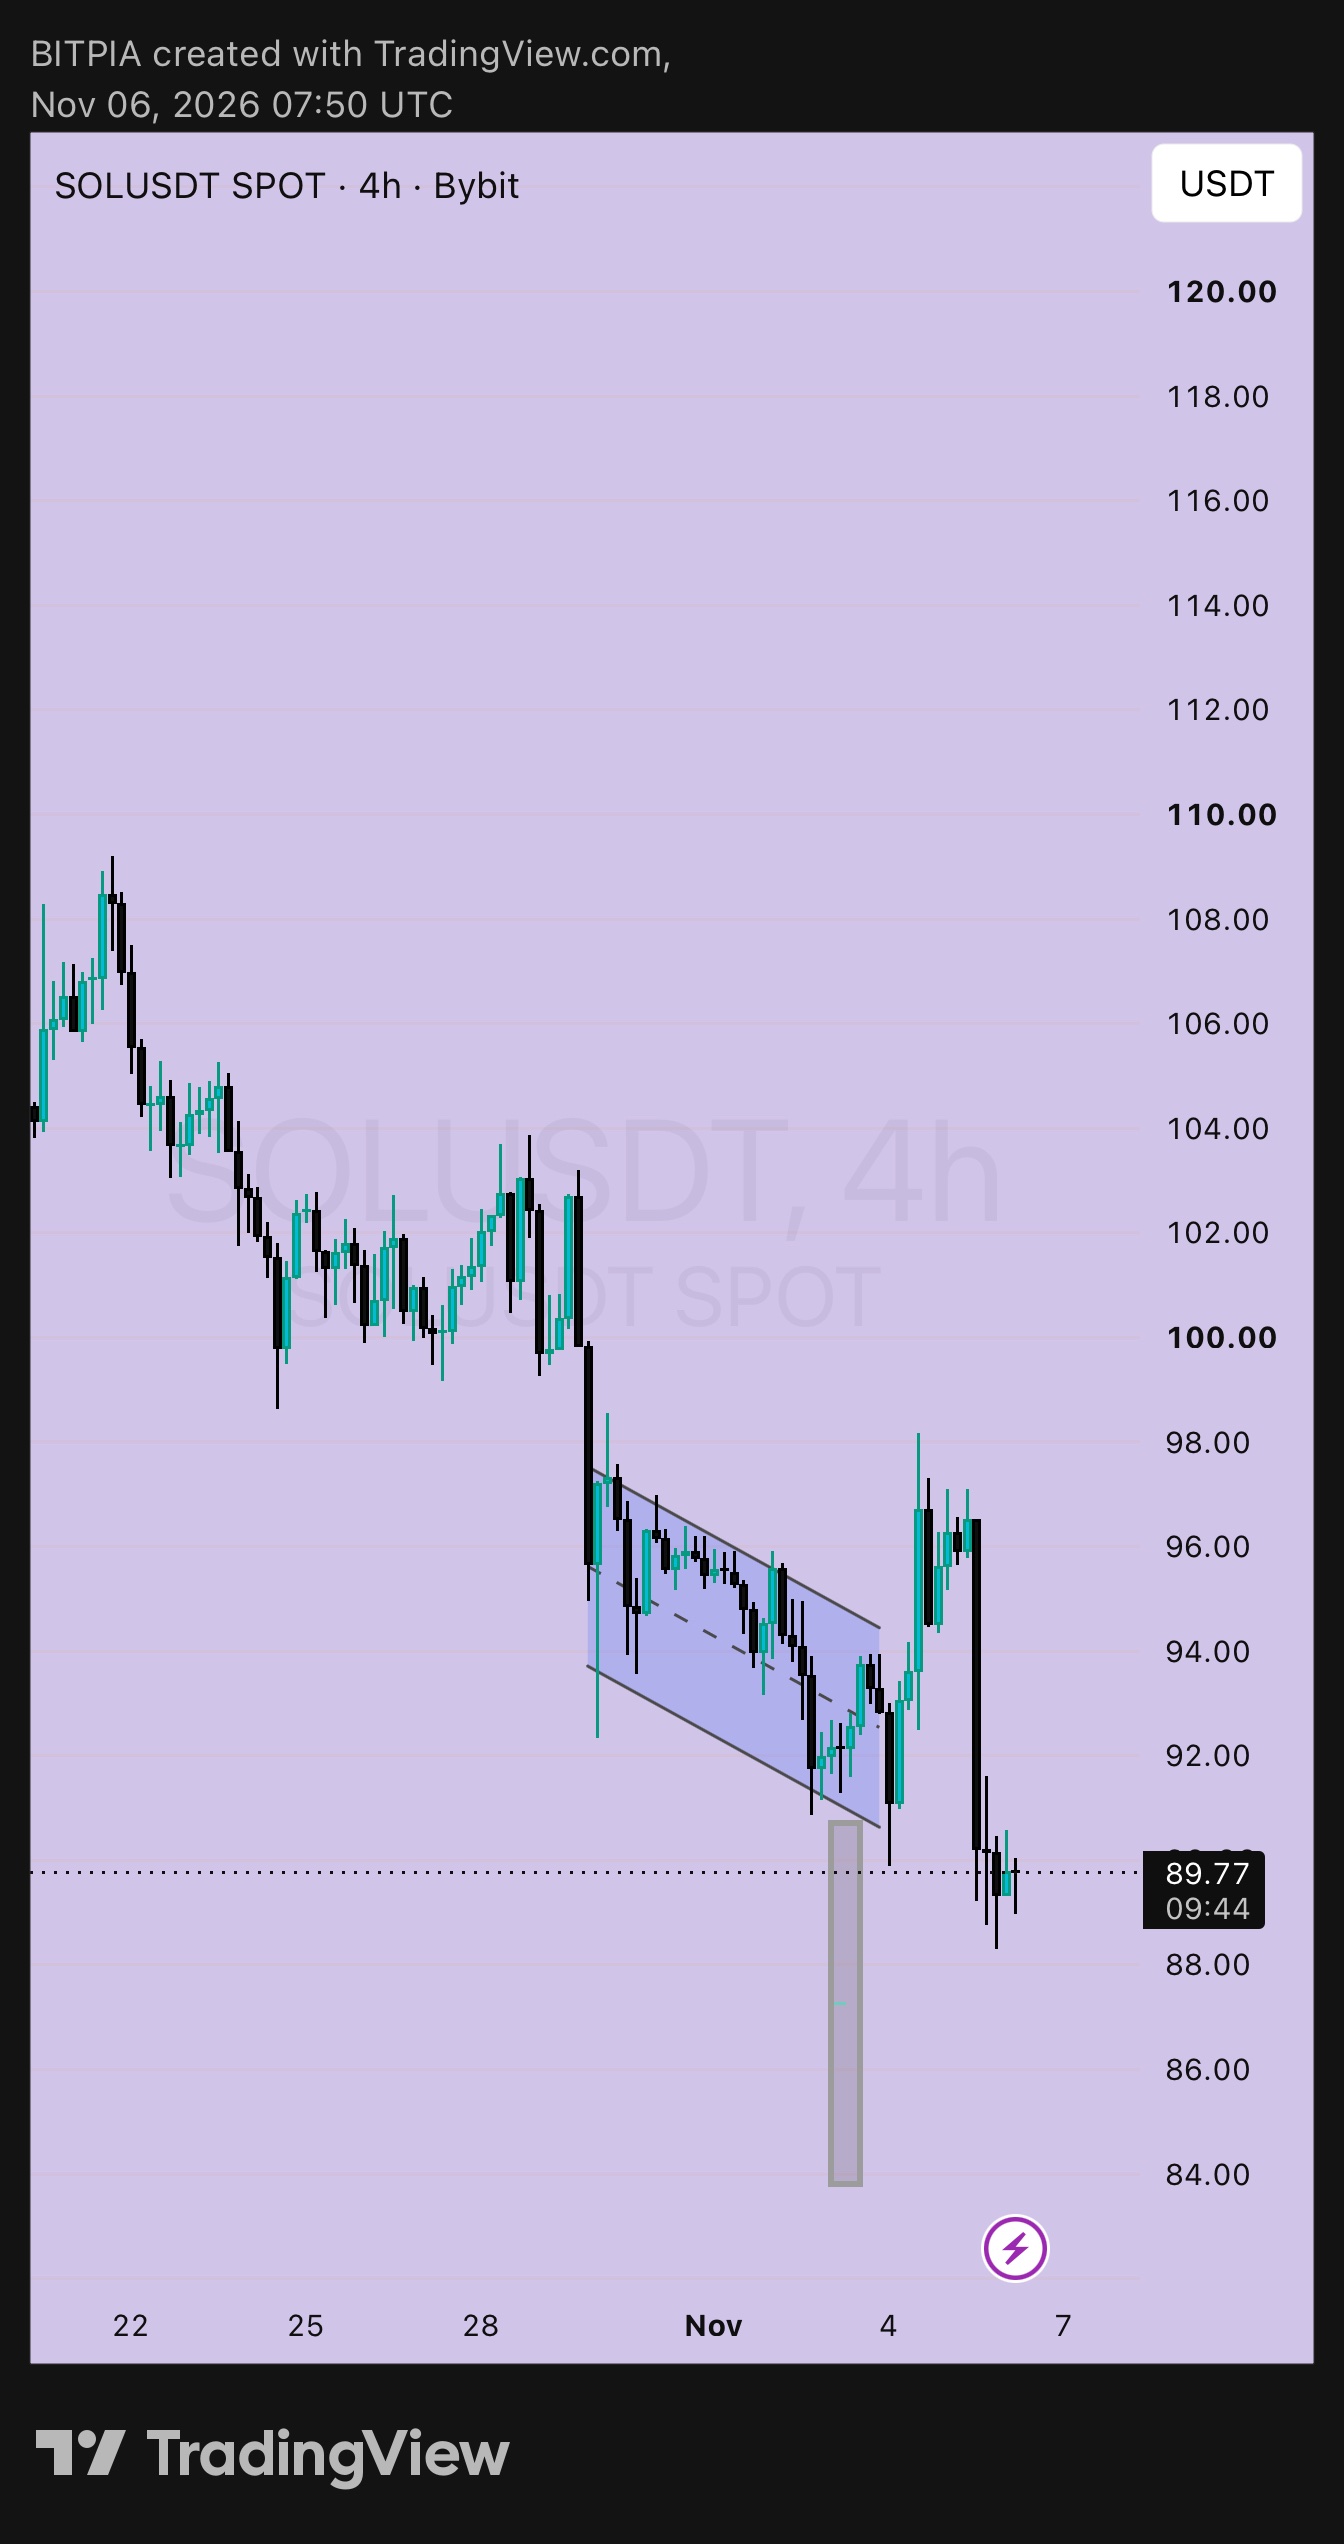
SOL 4h: both sides of the trade
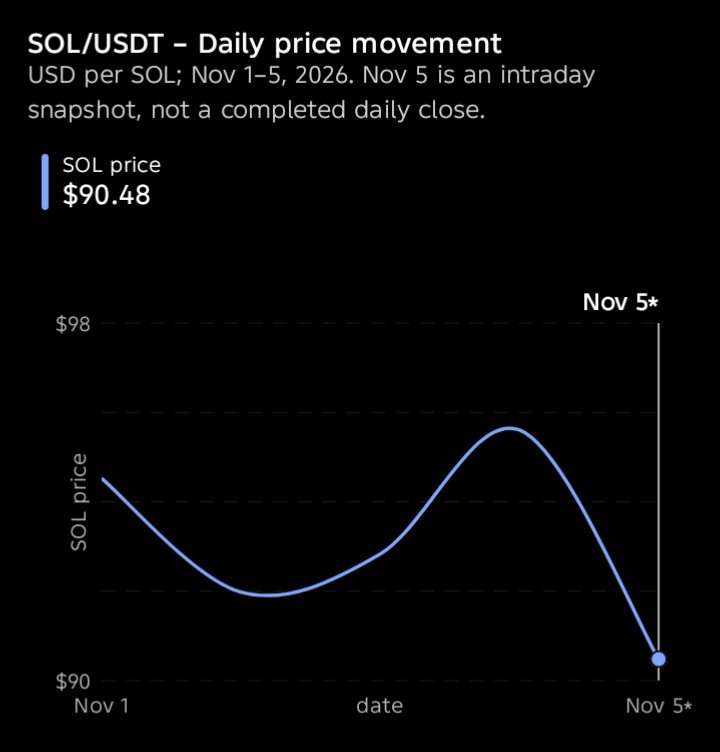
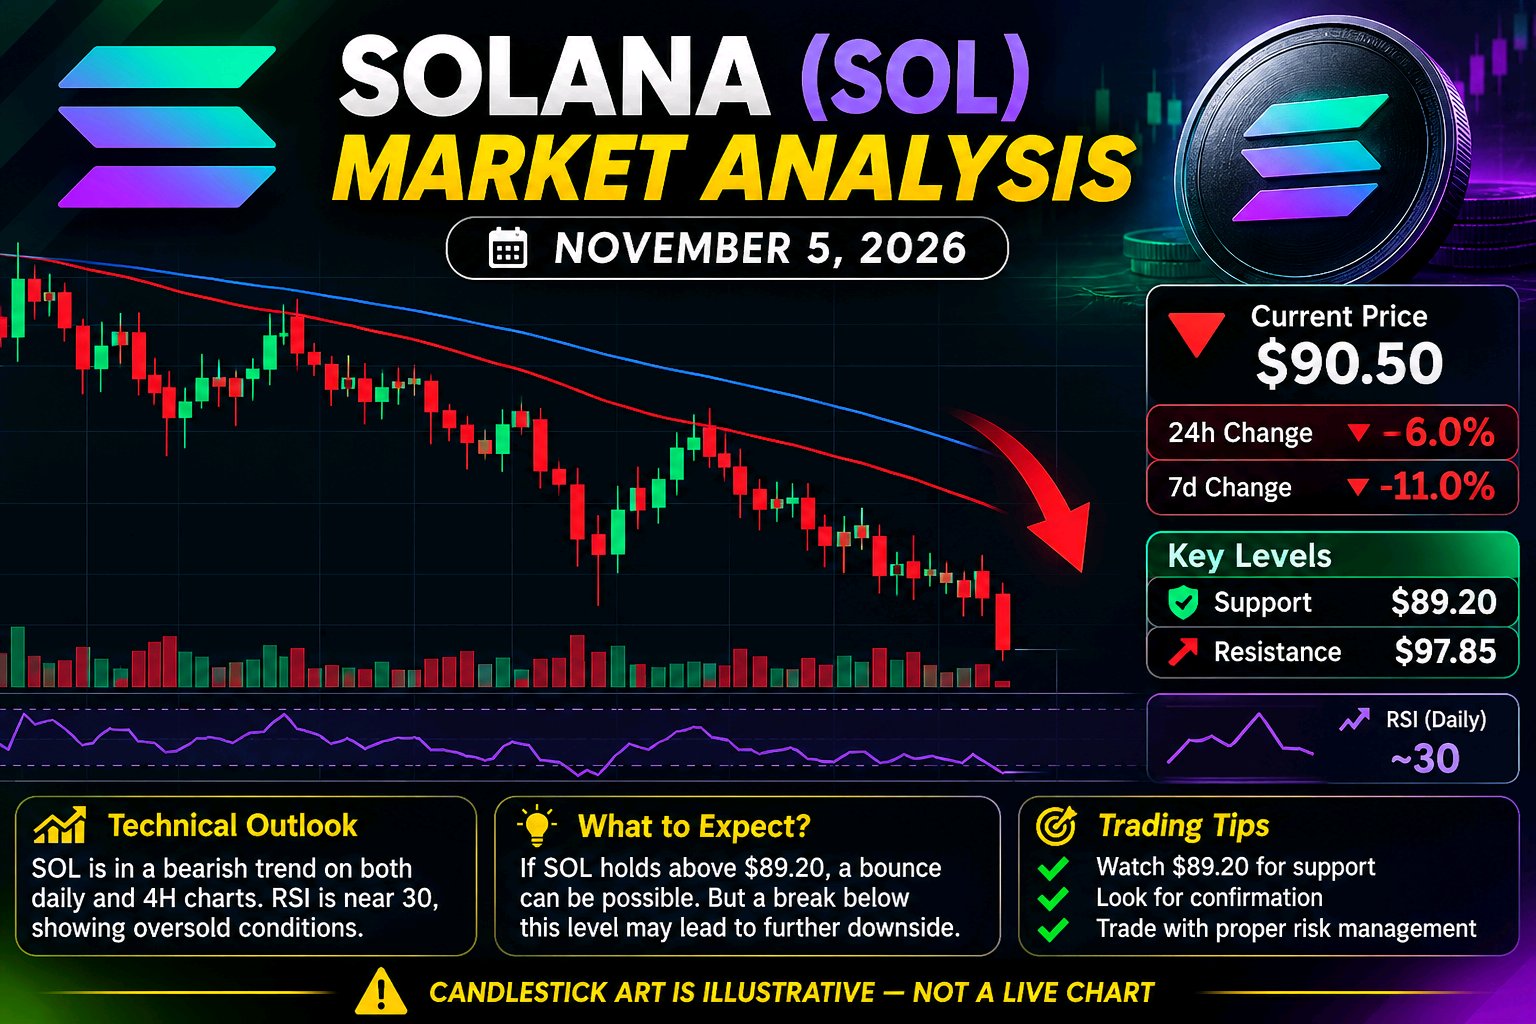
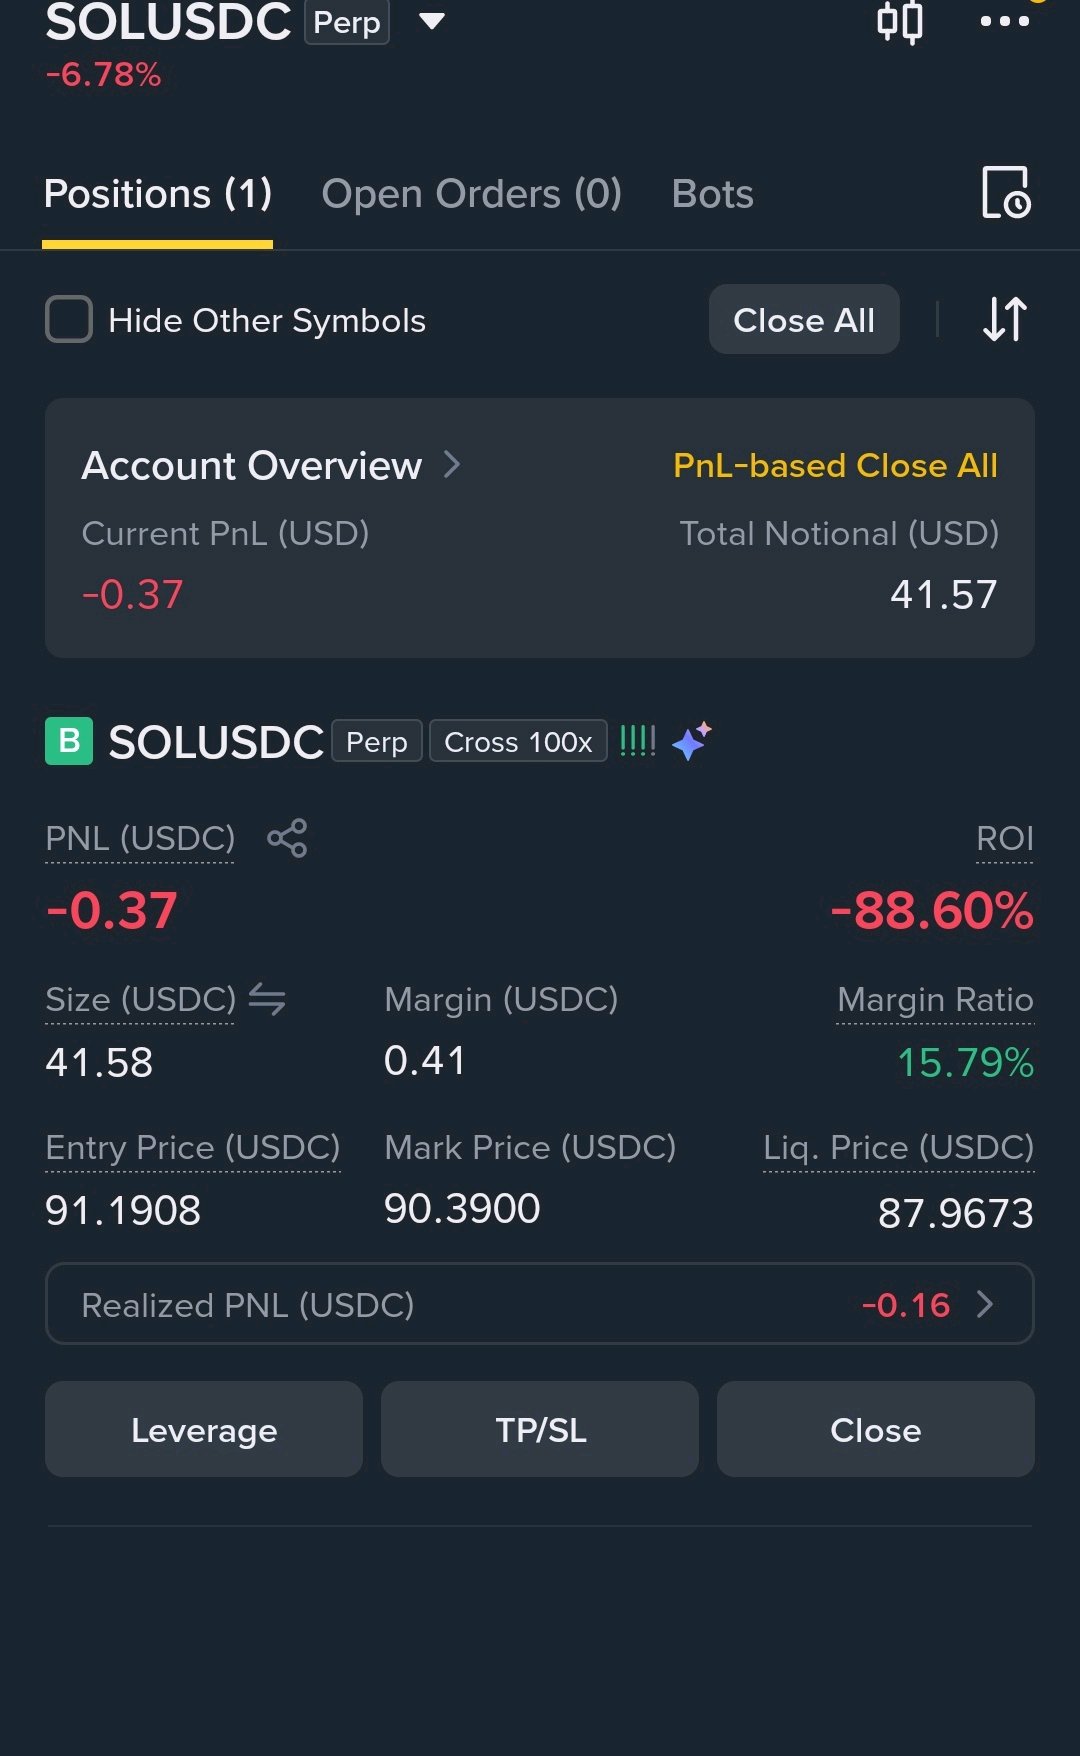
$SOLUSDT is at 89.77. The flag I've been tracking broke lower, price bounced to about 98, and then it rolled back under the old flag low near 90.5. The measured move from the flag points to roughly 84, which is the grey box on my chart. So I'm looking at this from both directions. ➤ What I see ▸ The bounce to 98 failed and sellers took back control ▸ Price is now below the flag, and the 90.5 area has flipped from support to resistance ▸ The wick low near 88.5 is the first level to watch ➤ Side 1: short on a retest ▸ Entry: around 91.5, if price retests the flag low and gets rejected ▸ Stop-loss: above 94.0 ▸ Risk per unit: 2.5 ▸ Targets: 86 (+5.5, about 2.2R) and 84 (+7.5, about 3R) ➤ Side 2: long near the target zone ▸ Entry: around 85, only if price reaches the 84 to 86 area and buyers show up ▸ Stop-loss: below 82.5 ▸ Risk per unit: 2.5 ▸ Targets: 90.5 (+5.5, about 2.2R) and 94.5 (+9.5, about 3.8R) ➤ What I'm not doing Not opening anything at 89.77. That's the middle of nowhere, with no level close enough for a tight stop. ➤ What changes my view A 4h close back above 94.5, the top of the old flag, tells me the breakdown failed and sellers lost control. I'd drop the short idea and look at 98 again. Both ideas depend on the levels holding, so keep size small and leverage low if you use perps. Not financial advice. Do your own research and only risk what you can afford to lose. #ByXIMPACT #WSOT2026 #BlockchainSecurity

$PIEVERSEUSDT is showing an unusual kind of strength: it is moving against the broader market instead of simply following Bitcoin's direction. In the November 6 market snapshot, PIEVERSE gained around 7% while BTC dropped 5.37% and ETH lost 7.34%. That relative strength is worth watching, but the question is whether real spot demand is supporting it. The derivatives picture deserves attention. Open interest is around $46.4M, while 24-hour futures turnover reached approximately $50.8M against just $9.1M in spot volume. This suggests speculative positioning is playing a much bigger role than spot activity. It can accelerate a breakout, but it can also make a reversal sharper. My technical focus is the $1.19–$1.34 range. The $1.19 area is the first important defense, while $1.31 is the reclaim level that could improve the short-term structure. A sustained move above $1.34 would open the way toward $1.445. On the downside, losing $1.19 puts the $1.16 support area back in focus. There is another factor traders should not ignore: 33.4 million PIEVERSE tokens are scheduled to unlock on November 14. That represents approximately 3.3% of total supply. Not every unlocked token will be sold, but the market will need enough genuine demand to absorb the additional supply. Pieverse has a real infrastructure angle through agent-native payments, verifiable receipts and compliance-focused transactions. Its token also has governance, staking and fee-discount utilities. However, product adoption only becomes a strong token catalyst when it translates into measurable token demand. I would avoid chasing momentum before seeing how price reacts around the reclaim zone. If $1.19 holds and $1.31 is recovered, the bullish case improves. If support breaks, the setup changes. Is PIEVERSE's relative strength evidence of genuine accumulation, or is leveraged trading creating a rally that could struggle when the unlock approaches? #WSOT2026 #BlockchainSecurity

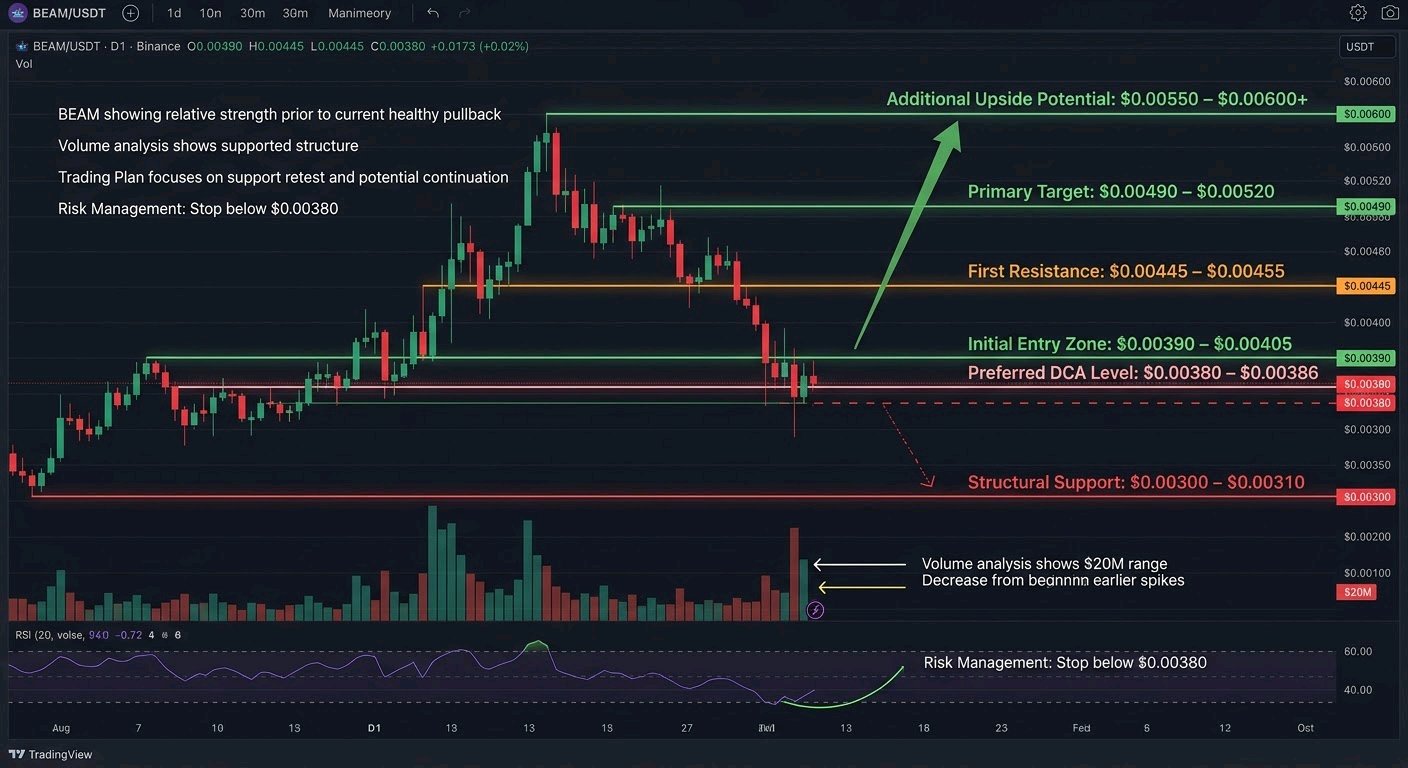
$BEAMUSDT - STRONG RELATIVE STRENGTH EARLIER THIS WEEK, NOW PULLING BACK HARD. I’M WATCHING THE $0.0038–$0.0039 ZONE CLOSELY FOR THE NEXT MOVE.** Beam has been one of the clearer relative-strength names in the gaming/GameFi sector over the past month. While large parts of the market chopped or sold off, BEAM pushed a multi-week uptrend, broke higher on elevated participation late October, and briefly extended toward the $0.006 area. That move has now given back a good portion of the recent gains. Price is currently trading near $0.00395–$0.0040 after a roughly 15% decline over the last 24 hours, with the 24h range stretching from roughly $0.00394 to $0.00479. On the higher timeframes the structure still looks constructive. The broader uptrend from the June lows remains intact, price is holding above several key moving averages on the daily, and the October breakout that flipped prior resistance into potential support is still in play. What we’re seeing now is a classic post-impulse pullback after an overextended push. Relative strength versus Bitcoin over the last 30 days has been notable, even if the last day or two has shown some mean-reversion. **Volume Analysis** 24-hour volume is running in the $20M range across major venues (spot + perps). That is still elevated compared with quieter periods earlier in the month, though it has cooled from the extreme spikes seen during the late-October breakout. The volume profile of the recent advance was healthy — participation expanded as price moved higher. The current pullback has not yet shown the kind of aggressive high-volume selling that would signal a full trend reversal. I’m treating the volume as still supportive of the larger structure rather than a distribution event, provided the key demand zones hold. **My Trading Plan** I’m treating this as a potential continuation setup after the pullback, not a fresh breakout chase. - **Initial Entry Zone**: $0.00390 – $0.00405 (current area and slight dips). This is where I’m looking for the first signs of buyers stepping back in after the recent flush. - **Preferred DCA Level**: $0.00380 – $0.00386. This zone has acted as short-term support recently and aligns with prior structure and order-block type demand from the impulse move. A controlled fill here improves the overall risk-reward. - **First Resistance**: $0.00445 – $0.00455. This is the immediate area price needs to reclaim and hold to signal the pullback is likely complete. - **Primary Target**: $0.00490 – $0.00520. A clean move back through this zone would put the recent local highs back in play. - **Additional Upside Potential**: $0.00550 – $0.00600+ if momentum returns and the broader market cooperates. These levels were tested during the late-October spike and remain logical extensions of the current structure. Confirmation for me is a higher low forming on the 4H/ daily combined with a reclaim of the $0.00445 area on rising volume. Without that, I stay patient and size smaller. **What Could Go Wrong?** The biggest risk is that this pullback deepens into a larger correction. A decisive break and daily close below $0.00380 would weaken the short-term bullish structure and open the door toward the $0.00340 – $0.00350 demand zone that launched the latest leg higher. Below that, the next meaningful structural support sits closer to the $0.00300–$0.00310 region. If volume expands sharply on the downside while the broader market remains soft, the relative-strength story can fade quickly. I’m also watching for any sustained weakness in the gaming sector as a whole. A failure to hold the $0.00380 area on volume would invalidate the immediate long setup for me and force a reassessment of the higher-timeframe structure. **My Perspective** Beam remains interesting because it has shown genuine relative strength inside a still-fragile altcoin environment. The multi-month uptrend, the clean breakout structure, and the fact that it held up better than many peers during recent market stress keep it on my radar. The current pullback looks like healthy digestion after a sharp run rather than the start of a major top — at least as long as the $0.00380–$0.00390 zone continues to attract buyers. I’m watching two things next: whether buyers defend the current support cluster with improving volume, and whether price can reclaim $0.00445 without heavy selling on the attempts. If those conditions develop, I’m expecting a continuation move that retests the recent highs and potentially extends further. If support fails cleanly, I’ll step aside and wait for a clearer higher-low structure to form lower. No guarantees in this market — just levels, structure, and risk management. BEAM is still one of the names I’m actively tracking for a potential next leg higher once this pullback stabilizes. #ByXIMPACT #WSOT2026 #BlockchainSecurity

$SOL | A strong ecosystem doesn't guarantee a strong price. Market confirmation still matters. Solana is trading around $89 after losing the $92 support zone during the latest market sell-off. Despite continued activity across its DeFi, meme-coin and trading ecosystems, SOL still needs to demonstrate that buyers are willing to defend current levels. Here's what traders should watch: • $89: Immediate price zone to monitor. • $85–$87: Key potential support area. • $92.30: Important resistance to reclaim. • $98: Next upside target if bullish momentum strengthens. A sustained move above $92.30, supported by stronger spot volume, could improve the short-term structure and open the door towards $98. However, continued rejection below resistance could leave SOL vulnerable to further downside. My take: Solana's ecosystem growth is worth watching, but network activity and token price performance are two different things. Traders should focus on demand, volume and confirmation before anticipating a recovery. Strong fundamentals matter. Price confirmation matters too. #Solana #SOL #Bybit #DeFi #CryptoTrading #BlockchainSecurity #MidtermsMarketWatch
$DOGE | Community strength can attract attention, but only buying pressure can sustain a rally. Dogecoin is facing renewed selling pressure, trading around $0.072–$0.073 after losing the $0.0724 support level. Despite continued speculative interest, price action suggests sellers still have the upper hand. Here's what traders should watch: • $0.0710: Immediate support to defend. • $0.0702: Next potential downside level. • $0.0770: Key resistance and recovery level. A sustained reclaim of $0.0770, backed by stronger spot volume, could signal a shift in short-term momentum. However, a confirmed breakdown below $0.0710 would increase downside risk and strengthen the bearish outlook. My take: DOGE needs genuine demand to support a recovery. Traders should monitor volume, Bitcoin's stability and reactions around key levels before positioning for the next move. Meme momentum is powerful, but market structure still matters. #Dogecoin #DOGE #Bybit #Memecoins #CryptoTrading #BlockchainSecurity #MidtermsMarketWatch
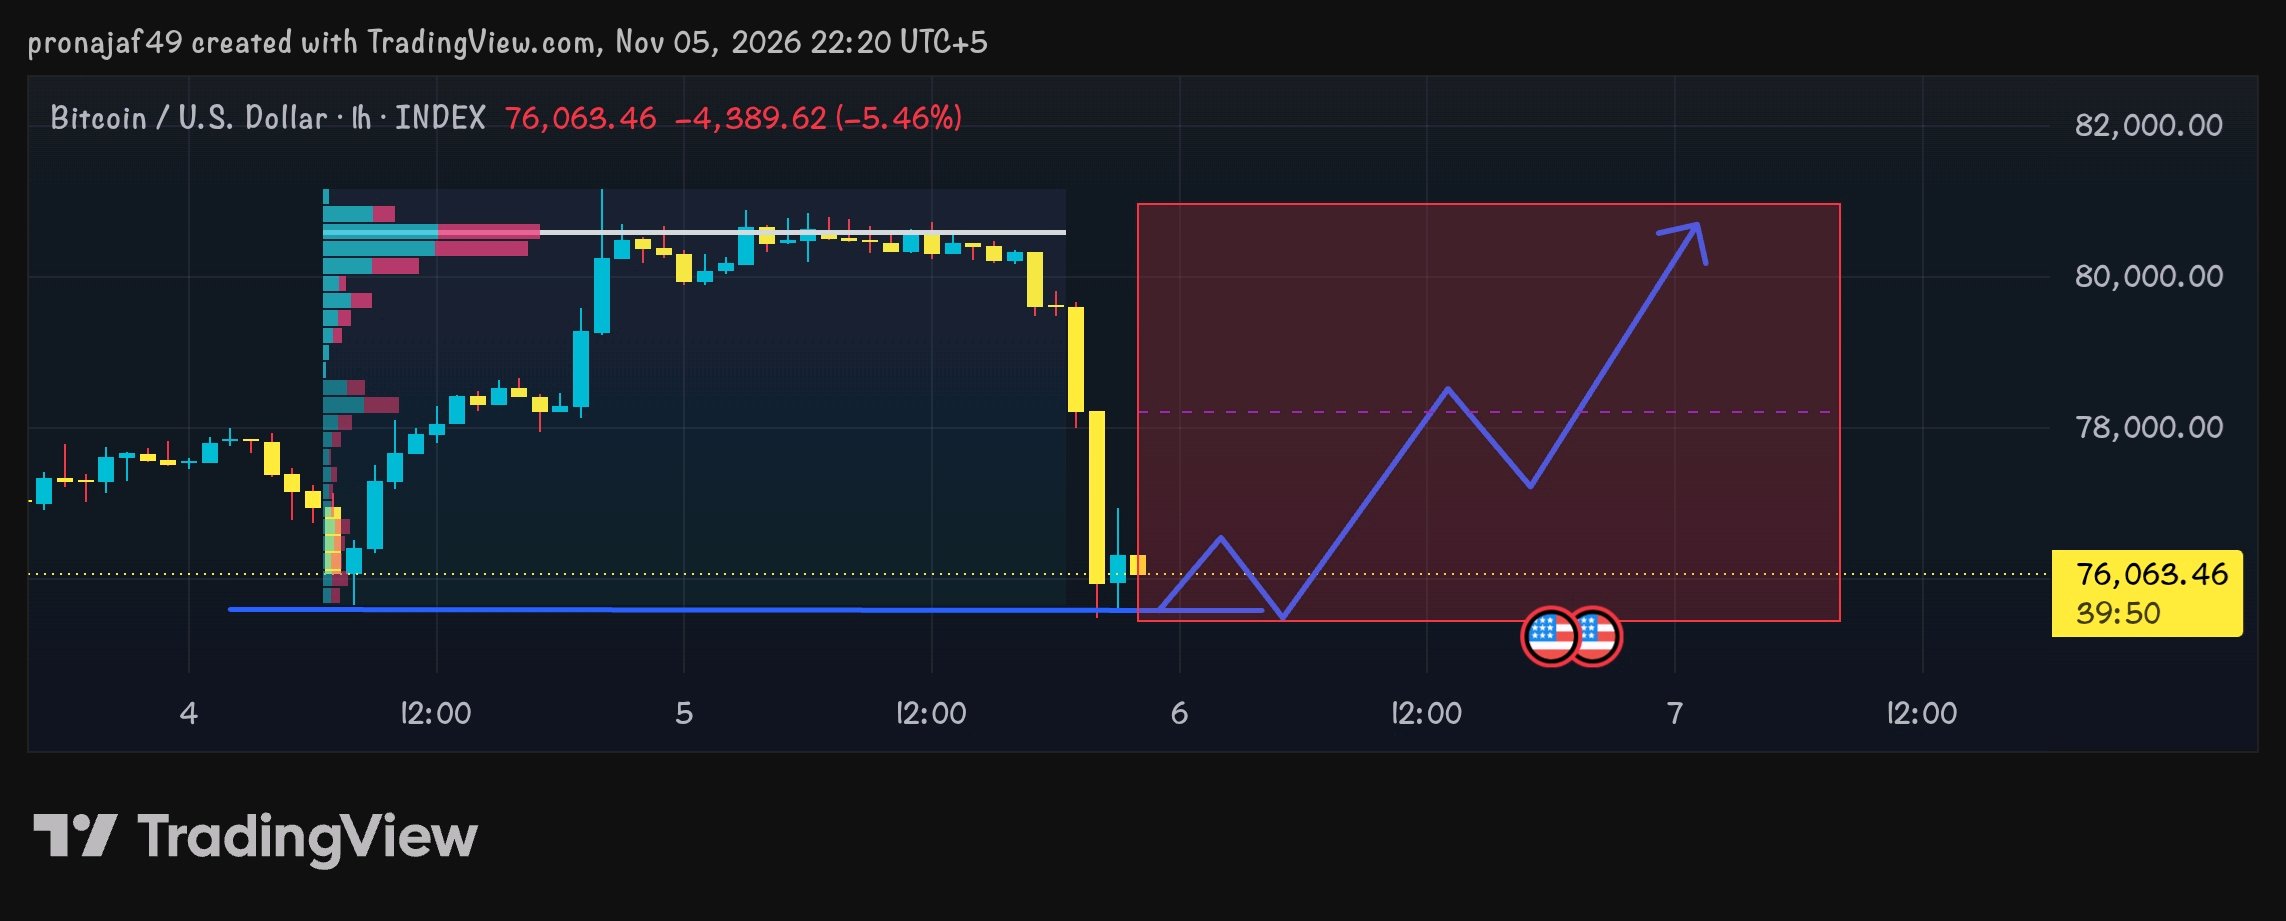
$BTC | Bitcoin is at a critical point. The next move needs confirmation, not speculation. Bitcoin is facing renewed selling pressure around $76,000 after losing a key support zone. Buyers now need to demonstrate strength to prevent further downside. Here's what traders should watch: • $74,900–$75,000: Key support zone to defend. • $73,300: Next potential downside target if selling pressure increases. • $76,600: Immediate resistance and first recovery level. • $78,000: Major reclaim level that could strengthen bullish momentum. The current market structure remains weak, with buyers yet to establish convincing control. My take: A sustained reclaim of $76,600, supported by strong spot volume, could improve Bitcoin's short-term outlook. Until then, patience, risk management and capital preservation should remain priorities. In this market, confirmation matters more than prediction. #Bitcoin #BTC #Bybit #CryptoTrading #MarketAnalysis #BlockchainSecurity #WSOTPicktoEarn10U

ETHEREUM LATEST MARKET UPDATE
$ETHUSDT ETHEREUM MARKET ANALYSIS | 6 NOVEMBER 2026 💰 ETH Price: $2,236 📉 24H Change: -7.78% 📊 Technical Overview Ethereum is showing signs of a short-term recovery on the 4H chart, while the daily trend remains bearish. Traders should watch key support and resistance levels before entering the market. 🟢 SUPPORT LEVELS - $2,227 - $2,217 - $2,206 🔴 RESISTANCE LEVELS - $2,279 – $2,289 - $2,321 – $2,330 - $2,390 – $2,400 📈 BULLISH SCENARIO If ETH breaks above $2,289 with strong volume, the next targets could be $2,321, $2,330 and $2,400. 📉 BEARISH SCENARIO If ETH loses the $2,217 support level, further downside towards $2,206 could be possible. 🎯 TRADING STRATEGY - Entry: Wait for breakout confirmation. - Stop Loss: Below confirmed support. - Targets: $2,289 / $2,330 / $2,400. 🔥 FINAL VERDICT Ethereum is attempting a short-term recovery, but the overall daily trend remains bearish. A confirmed breakout above resistance is needed before expecting a stronger bullish move. ⚠️ Trade carefully and always manage your risk. #WSOT2026 #USPayrollsAndRateDecisionsDriveMacroWeek #BybitAIEvolving #BlockchainSecurity #OilVolatilityTracksIranPeaceTalks $DOGEUSDT #Ethereum #ETH #ETHUSDT #CryptoAnalysis #BinanceSquare #CryptoTrading #TechnicalAnalysis


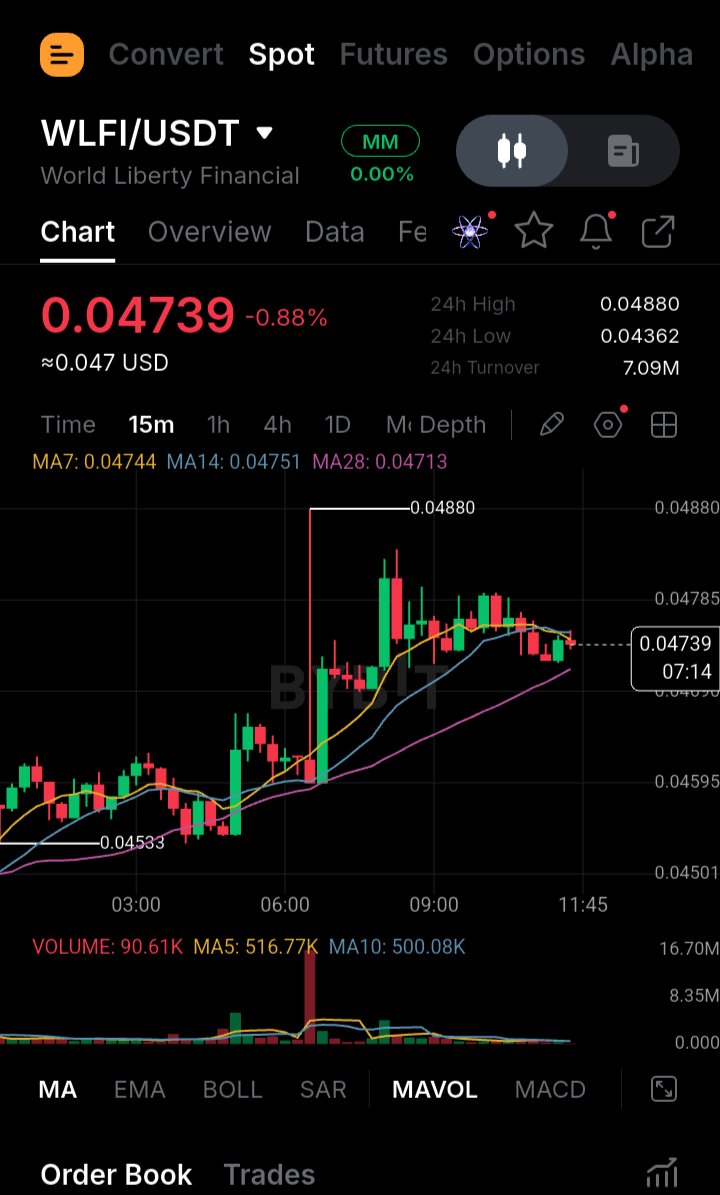
$WLFI Shows Signs of Recovery After a Healthy Pullback WLFI experienced a controlled retracement while maintaining its overall market structure. Buyers are gradually returning, suggesting that bullish momentum may be rebuilding. The key factor now is whether price can maintain support and attract sustained buying pressure. A strong move above nearby resistance could strengthen the recovery, while losing support may lead to another downside test. Key figures $0.0472–$0.0473 — Important short-term price zone $0.0465 — Critical support to monitor #BybitAIEvolving #BlockchainSecurity $WLFIUSDT


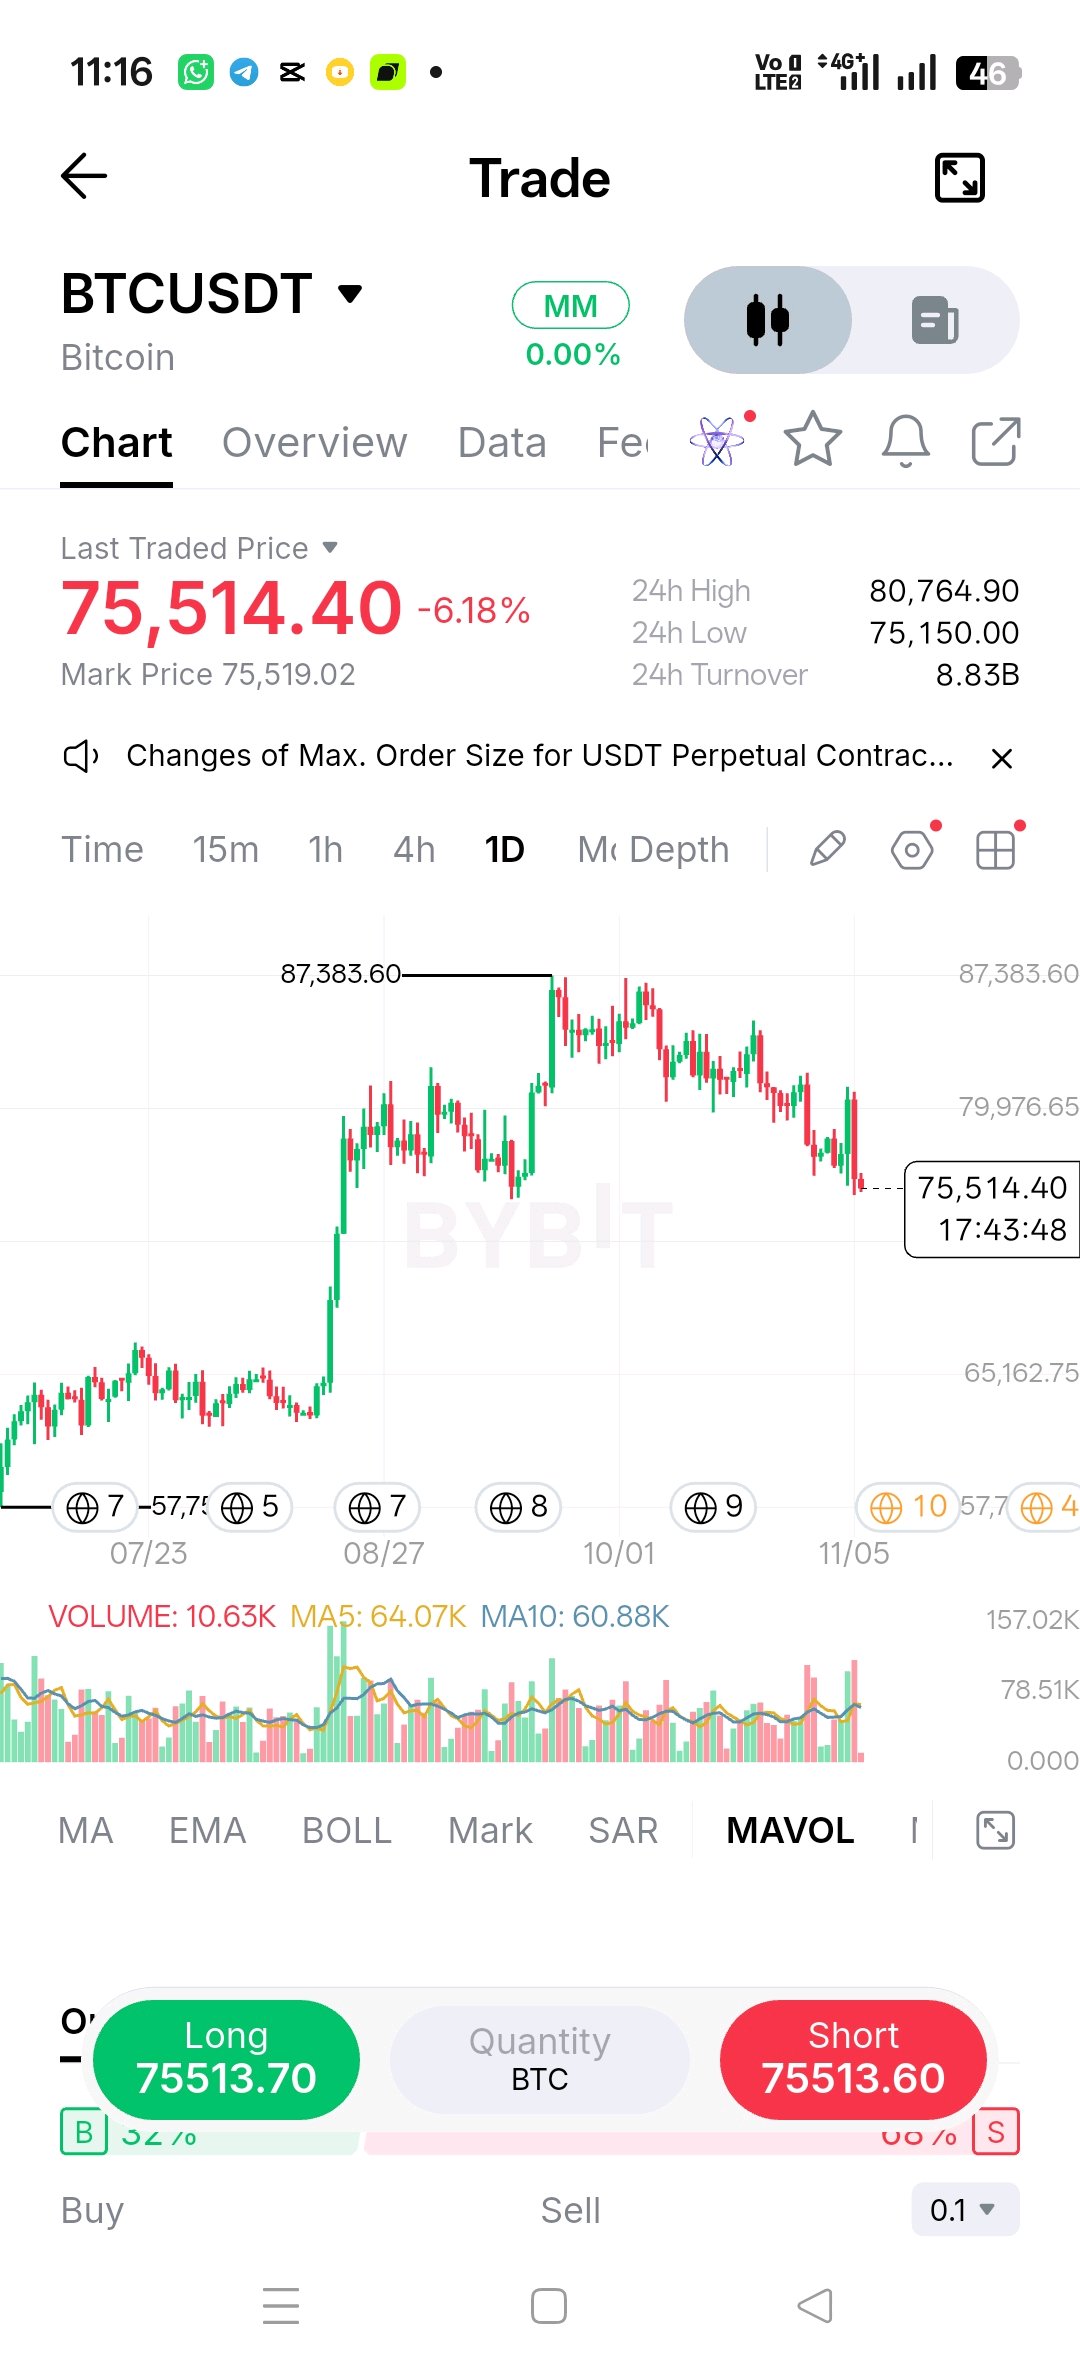
BTC Pullback: 75K Support in Focus
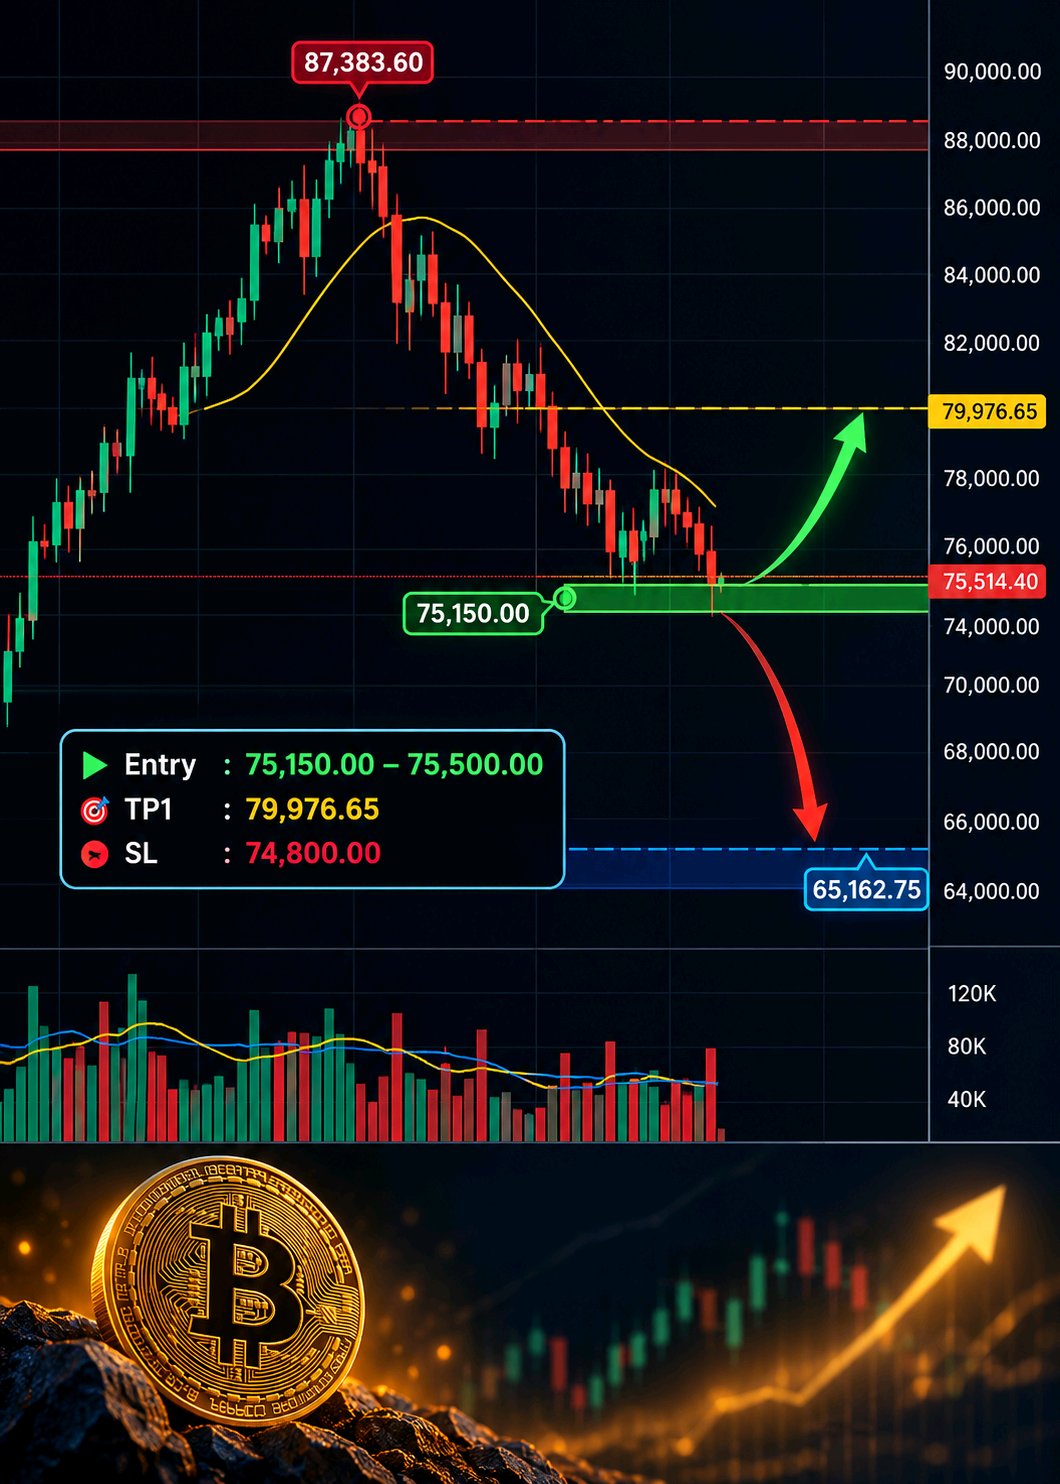
$BTCUSDT The daily chart for BTCUSDT shows a notable shift in momentum, with the price currently trading at 75,514.40, down -6.18% over the last 24 hours. The price is currently sitting near the lower end of the recent daily range, testing immediate support. 📊 Market Structure: Looking at the visible daily timeframe, the market structure previously established a strong upward trend, printing a clear local peak at 87,383.60. Since that high, the structure has shifted into a corrective phase, characterized by a series of lower highs and lower lows. · Immediate Support: The current area is critical, with the 24h low sitting at 75,150.00 acting as immediate visible support. · Resistance: The nearest visible intermediate resistance is around the 79,976.65 level, while the major structure resistance remains the peak at 87,383.60. · Volume: The visible MAVOL indicator shows current volume (10.63K) is significantly lower than the moving averages (MA5 at 64.07K, MA10 at 60.88K), suggesting a pause or exhaustion in the current downward movement for this specific candle. · Deeper Support: If the current level fails, the next visible historical consolidation support zone on the chart is located around the 65,162.75 area. 🎯 Potential Setup: Based purely on the current price testing a visible support level (24h low), here is a potential reactive scenario: · Entry: 75,150.00 - 75,500.00 zone (current price area). · TP1: 79,976.65 (visible intermediate resistance). · TP2: Not clearly defined on this timeframe without a confirmed change in market structure; focus on taking partials at TP1. · SL / Invalidation: 74,800.00 (A decisive daily close below the 24h low of 75,150.00). ⚠️ Confirmation: For this scenario to gain validity, we would want to see the current daily candle close above the 75,514.40 level, ideally with a long lower wick, indicating buyers are stepping in. Furthermore, a bullish bounce should be accompanied by an increase in trading volume to confirm the support. ❌ Invalidation: This setup is invalidated if the price breaks down and closes decisively below the 75,150.00 (24h low) mark. A sustained break below this level would confirm the continuation of the downward structure, potentially opening the door for a deeper retracement toward the 65K zone. 🧠 Risk Note: We are currently in a short-term downward structure. Counter-trend longs at support levels carry higher risk. Always use strict stop-losses to protect your capital, manage your position sizing appropriately, and do not over-leverage. #IMPACTbyTrade $XAUTUSDT #BlockchainSecurity #Oracle20BFundingPlanTestsTheAITrade
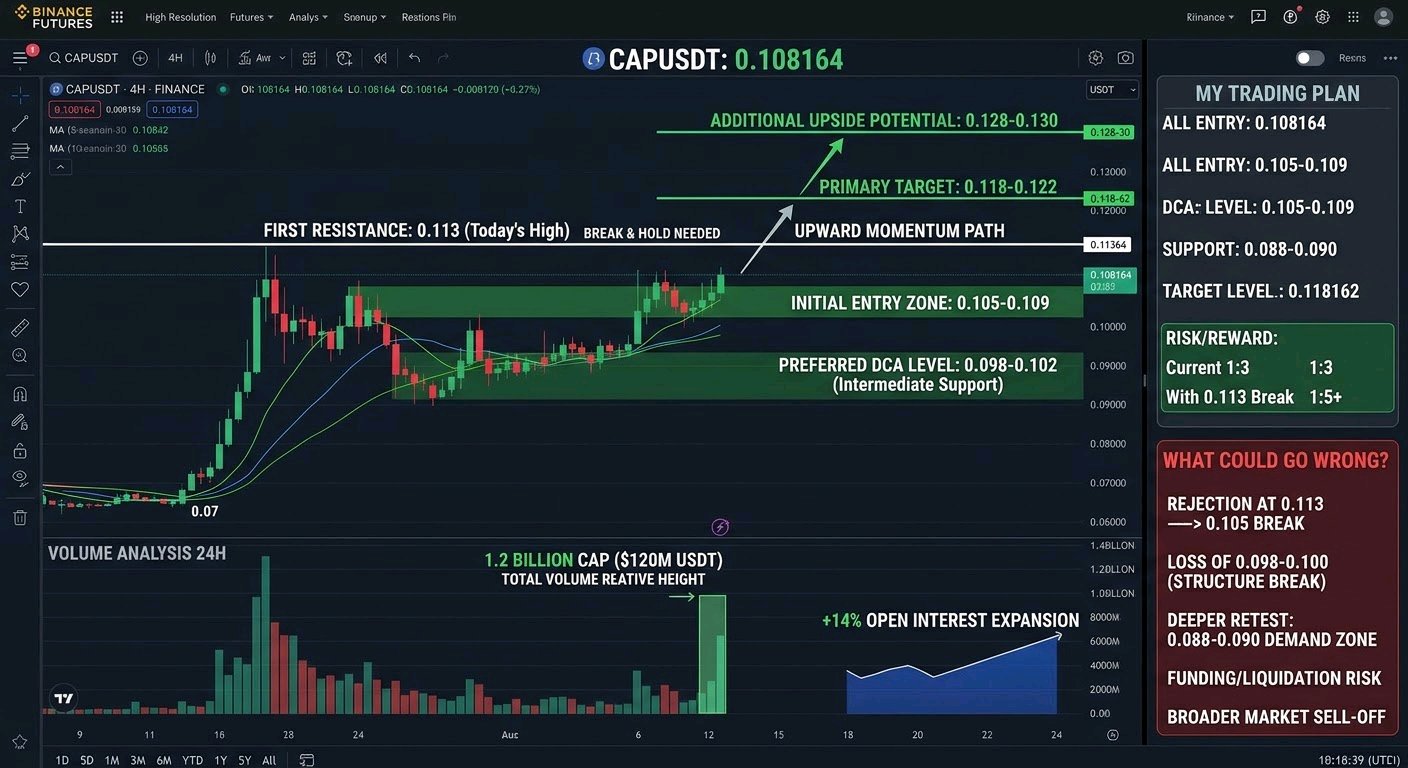
$CAPUSDT USDT - VOLUME STAYS ELEVATED AND PRICE IS HOLDING NEAR THE HIGHS, I’M WATCHING FOR A CLEAN BREAK ABOVE 0.113 CAP continues to show relative strength against the broader market. While majors have been choppy, this one has pushed higher over the past 24 hours and is currently trading near 0.108–0.109 after tagging a high of 0.11291. The daily structure improved after the strong recovery from the 0.07 region earlier in the week, and price is sitting comfortably above the short-term moving averages. The key question now is whether buyers can force a sustained move through the recent high. Volume Analysis 24-hour volume remains solid at roughly 1.2 billion CAP and over $120 million in USDT notional on Binance futures. Open interest has expanded in the process, and funding has stayed positive. This level of participation supports the recent advance rather than painting it as a thin, low-conviction move. As long as volume holds up on any push higher, the odds of continuation improve. My Trading Plan I’m approaching this from a momentum-and-structure perspective with clear levels. Initial entry zone: 0.105–0.109 (current area or shallow dips that hold the higher-low structure) Preferred DCA level: 0.097–0.102 (near the zone that marked the recent acceleration and intermediate support) First resistance: 0.112–0.113 (today’s high — a decisive break and hold here would open the next leg) Primary target: 0.118–0.122 (prior swing high region) Additional upside potential: 0.128–0.130 if momentum and volume expand after the breakout Confirmation for me would be a clean close above 0.113 accompanied by steady volume, followed by a successful retest that turns the level into support. What Could Go Wrong? After a multi-day run, a rejection at 0.112–0.113 is always possible. A drop back below 0.105 would weaken the short-term bullish structure and increase the chance of a deeper pullback. Losing the 0.097–0.100 area would put the recent higher lows at risk and likely send price toward the 0.088–0.090 demand zone. Elevated funding and rising open interest also mean any downside move can accelerate through liquidations. A broader market sell-off would add further pressure regardless of CAP’s relative strength . My Perspective CAP is interesting right now because the volume and open-interest growth have accompanied the price advance, and the market structure has shifted higher after the sharp recovery. The current action near the recent highs matters because a successful break could open room toward the previous swing highs, while a failure would simply reset the short-term picture. Continuation still looks more likely than an immediate deep correction as long as 0.105 holds and participation remains healthy, but I am treating any extension with defined risk. I’m watching the reaction at 0.113 closely and will adjust if the structure breaks. Overall the setup remains constructive while staying realistic about the risk of a healthy pullback. #ByXIMPACT #BlockchainSecurity #WSOT2026
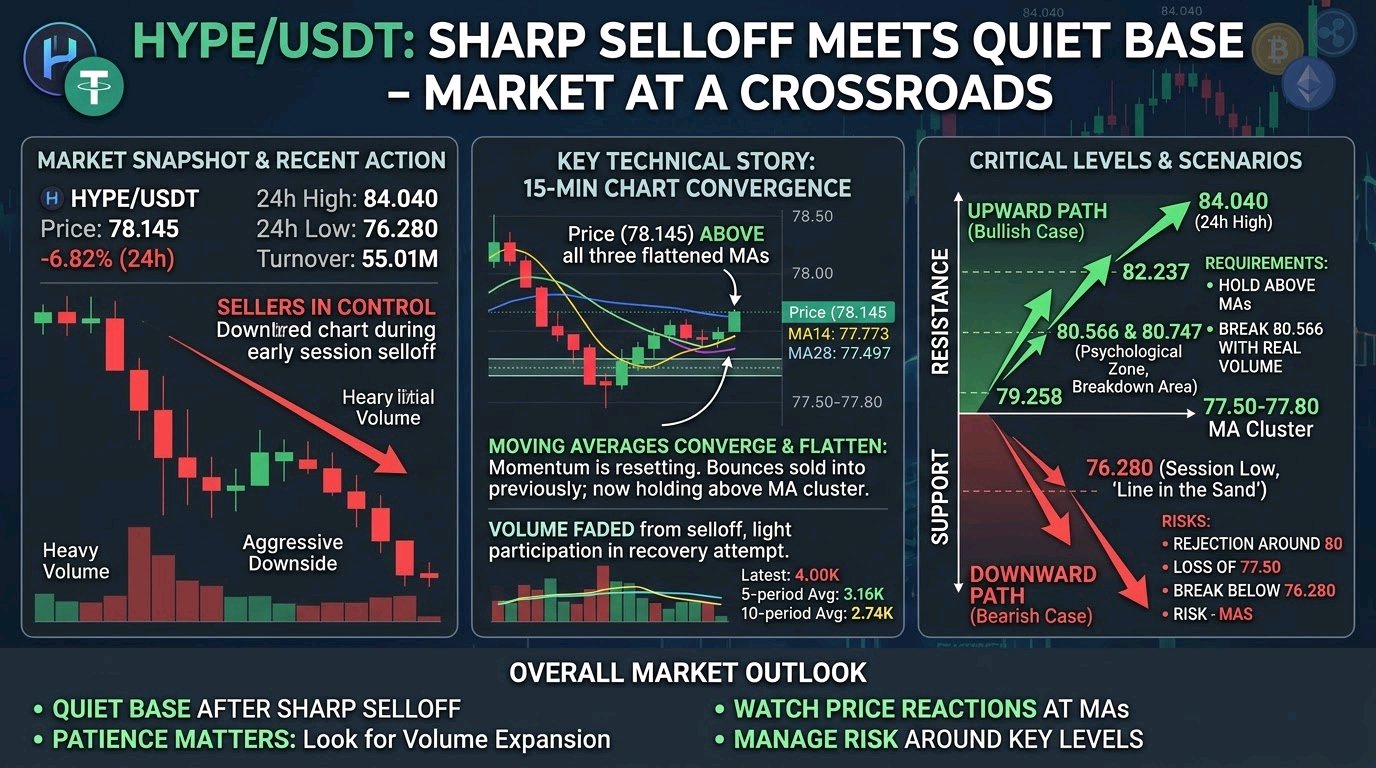
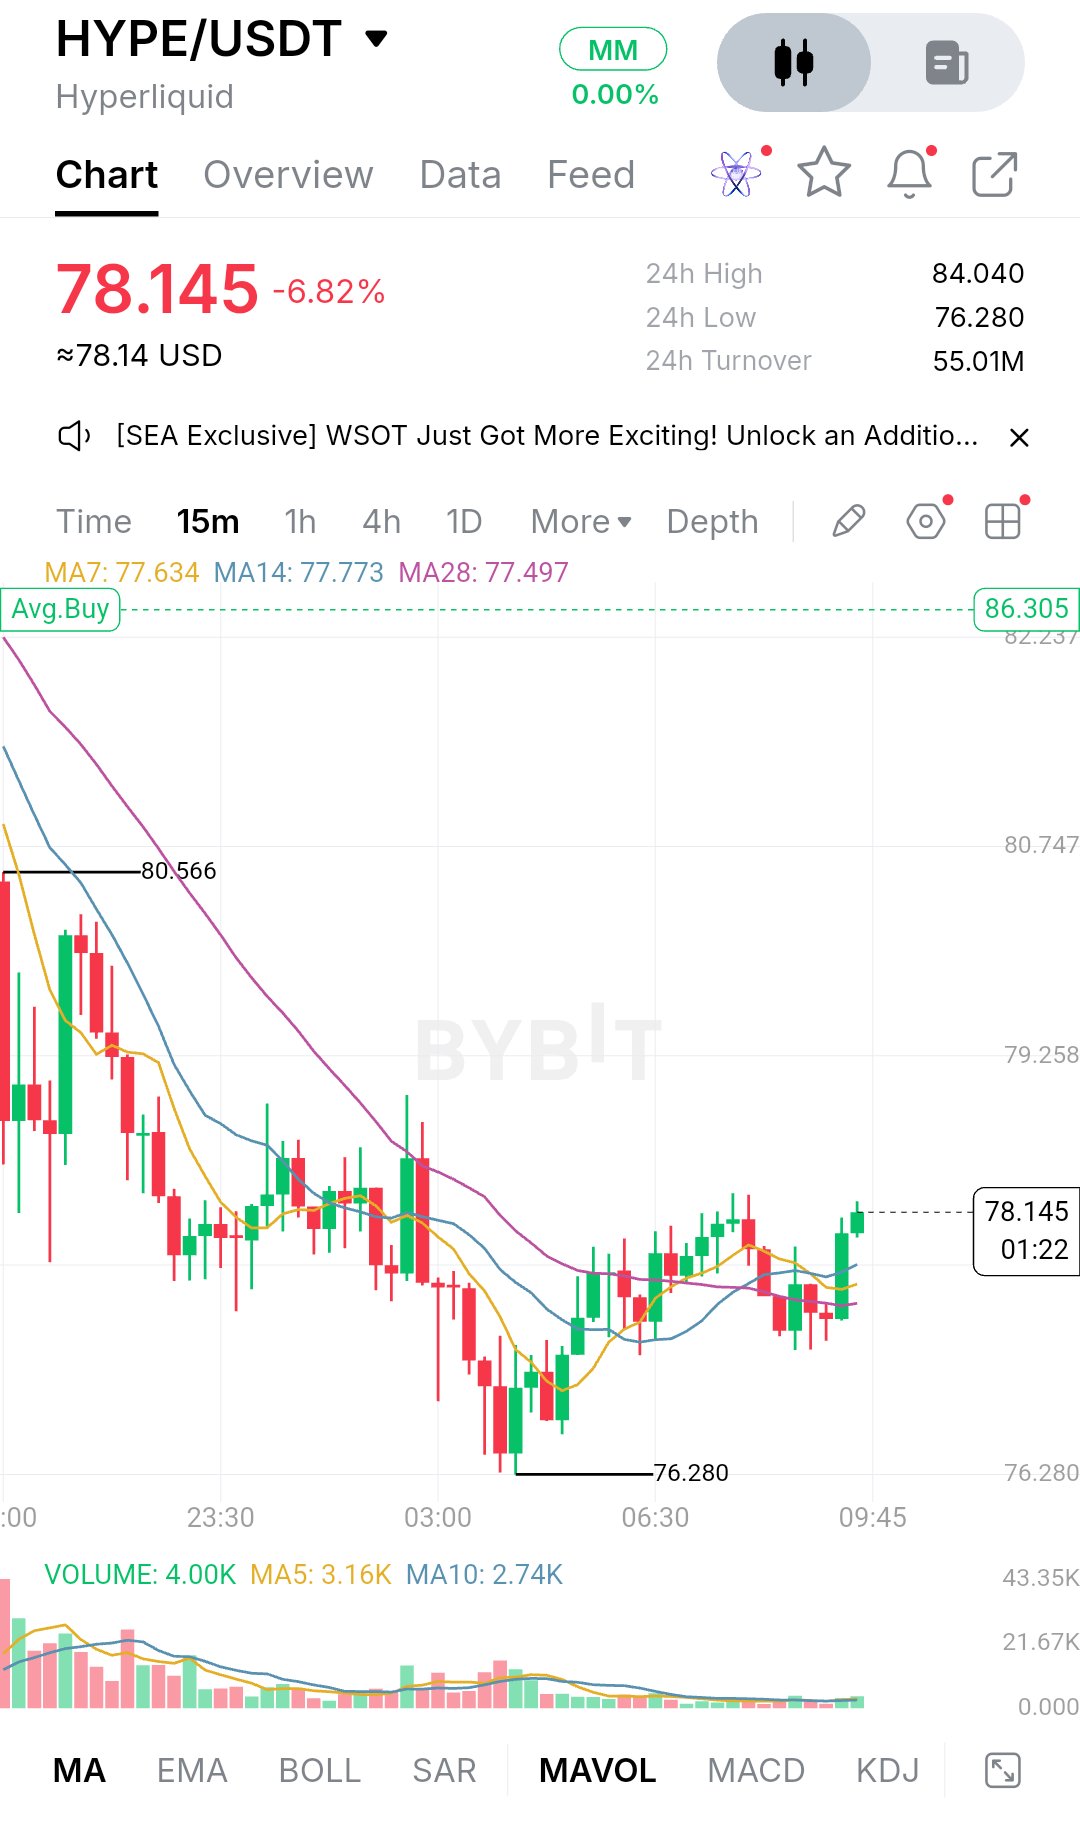
$HYPEUSDT is trading at 78.145, down 6.82% over the last 24 hours, and the move tells a clear story. The 24h high sits at 84.040, and from there sellers took control and pushed price steadily lower until it found a floor at 76.280. The selling was heavy early on, with large red candles and the biggest volume of the session, and each bounce along the way got sold into. Turnover is around 55.01M, so this was a real move, not a thin drift. Since that low, the character of the chart has changed. Price made its bottom around 76.280, bounced, and has spent the last several hours moving sideways to slightly higher, with candles overlapping and no more of the aggressive downside we saw earlier. This looks like a base or early recovery attempt rather than a trend reversal. Sellers have clearly lost some urgency, but buyers haven't taken charge yet. On the 15-minute chart, the moving averages are the main story. MA7 is at 77.634, MA14 at 77.773 and MA28 at 77.497, all bunched together right under the current price. After a long downtrend where they were stacked well above price and sloping down, they have now flattened and converged. That's usually what a market looks like when momentum is resetting. Price has pushed back above all three, and the latest green candles are holding above them, which is a small but real sign of improvement. Volume is the part I'd be cautious about. It has faded a lot from the selloff, with the latest reading at 4.00K against a 5-period average of 3.16K and a 10-period average of 2.74K. The slight uptick is encouraging, but it's still very quiet compared to the early session. The recovery so far is happening on light participation, which means it hasn't been fully proven. For support, the first area is the 77.50 to 77.80 zone, where the three moving averages are clustered. If price pulls back and holds there, it would show buyers are defending the new base. Below that, the real line in the sand is 76.280, the session low. That level has been tested and held once, and it's where sellers ran out of steam. A clean break below it would put the whole recovery in question and could open the door to a deeper move, since there is no visible structure below it on this chart to slow things down. On the upside, the nearest resistance is 79.258, followed by 80.566, which was a prior swing high and lines up closely with the 80.747 level on the price scale. That 80 to 81 area is a psychological round number and a former breakdown zone, so I'd expect sellers to show up there. Above it, 82.237 is the next marker, and the 24h high at 84.040 is the bigger target if momentum really picks up. The bullish case is straightforward. Buyers need to keep price above the moving average cluster, push through 79.258, and then close above 80.566 with real volume behind it. If that happens, a move toward 82.237 becomes realistic, and a retest of 84.040 would be possible if strength continues. The key is volume expanding on the breakout, not just price drifting up. The bearish case is that price stalls below 79.258 or gets rejected around 80, then loses the moving averages again. That would turn this bounce into a simple relief rally inside a downtrend. A loss of 77.50 would shift attention back to 76.280, and a break below that would confirm sellers are still in control. Key price levels: - Resistance: 79.258, 80.566, 80.747, 82.237, 84.040 - Current price: 78.145 - Support: 77.80 to 77.50 (MA cluster), 76.280 (session low) Overall, HYPE has gone from a sharp selloff into a quiet base, and that's the phase where patience matters most. The next real expansion will likely come from either a volume-backed break above 80.566 or a breakdown of 76.280. Until one of those happens, the market is mostly choosing direction, so I'd watch how price reacts at the moving averages and whether volume starts to build, rather than chasing the small candles in between. None of this is a guarantee, and traders should manage risk around these levels. $BTCUSDT #BlockchainSecurity
🚨 CARDANO (ADA) PRICE ANALYSIS
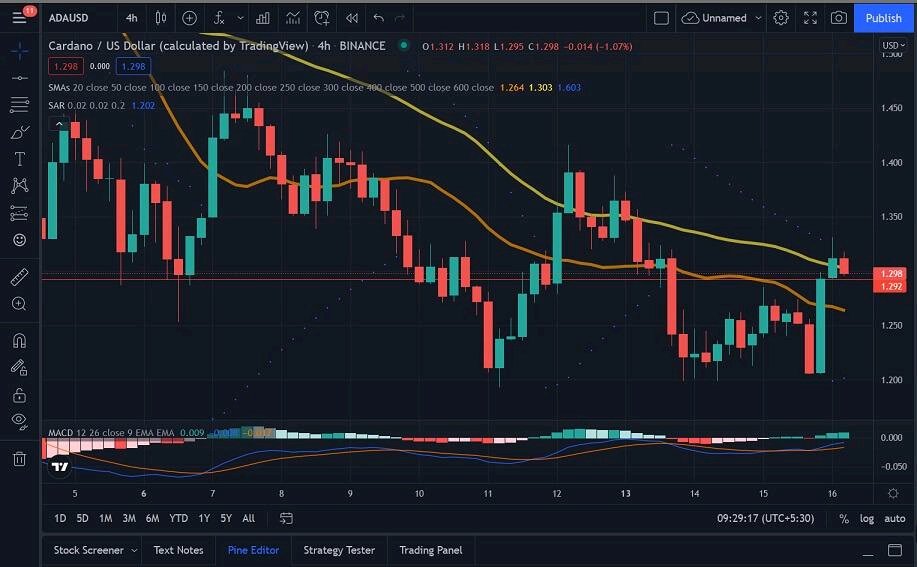
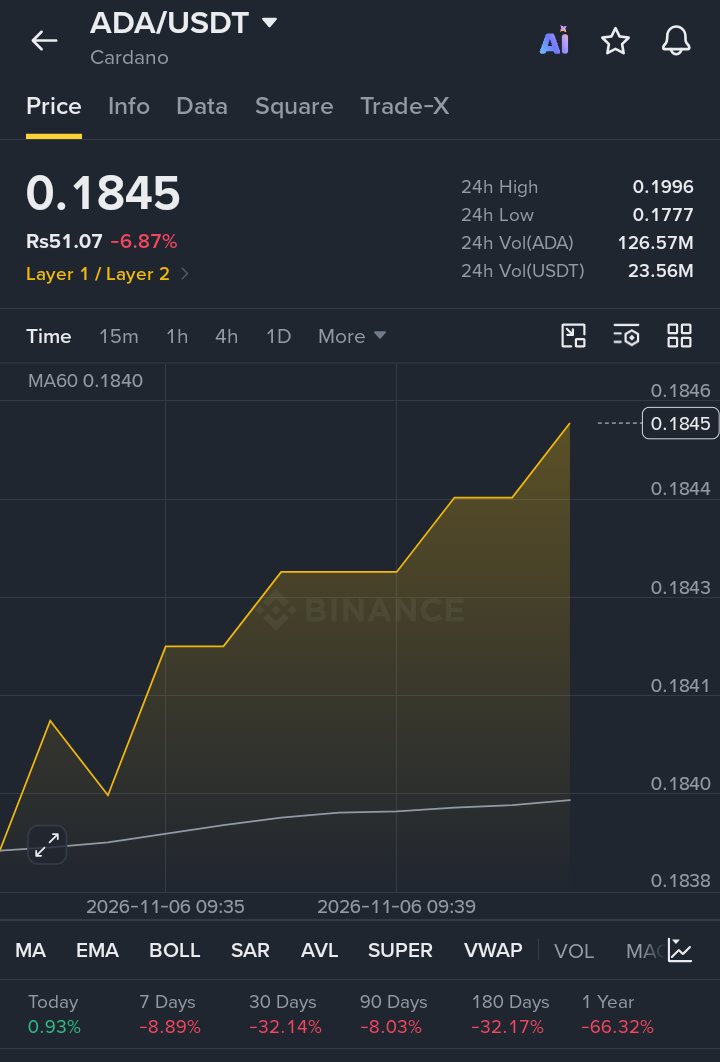
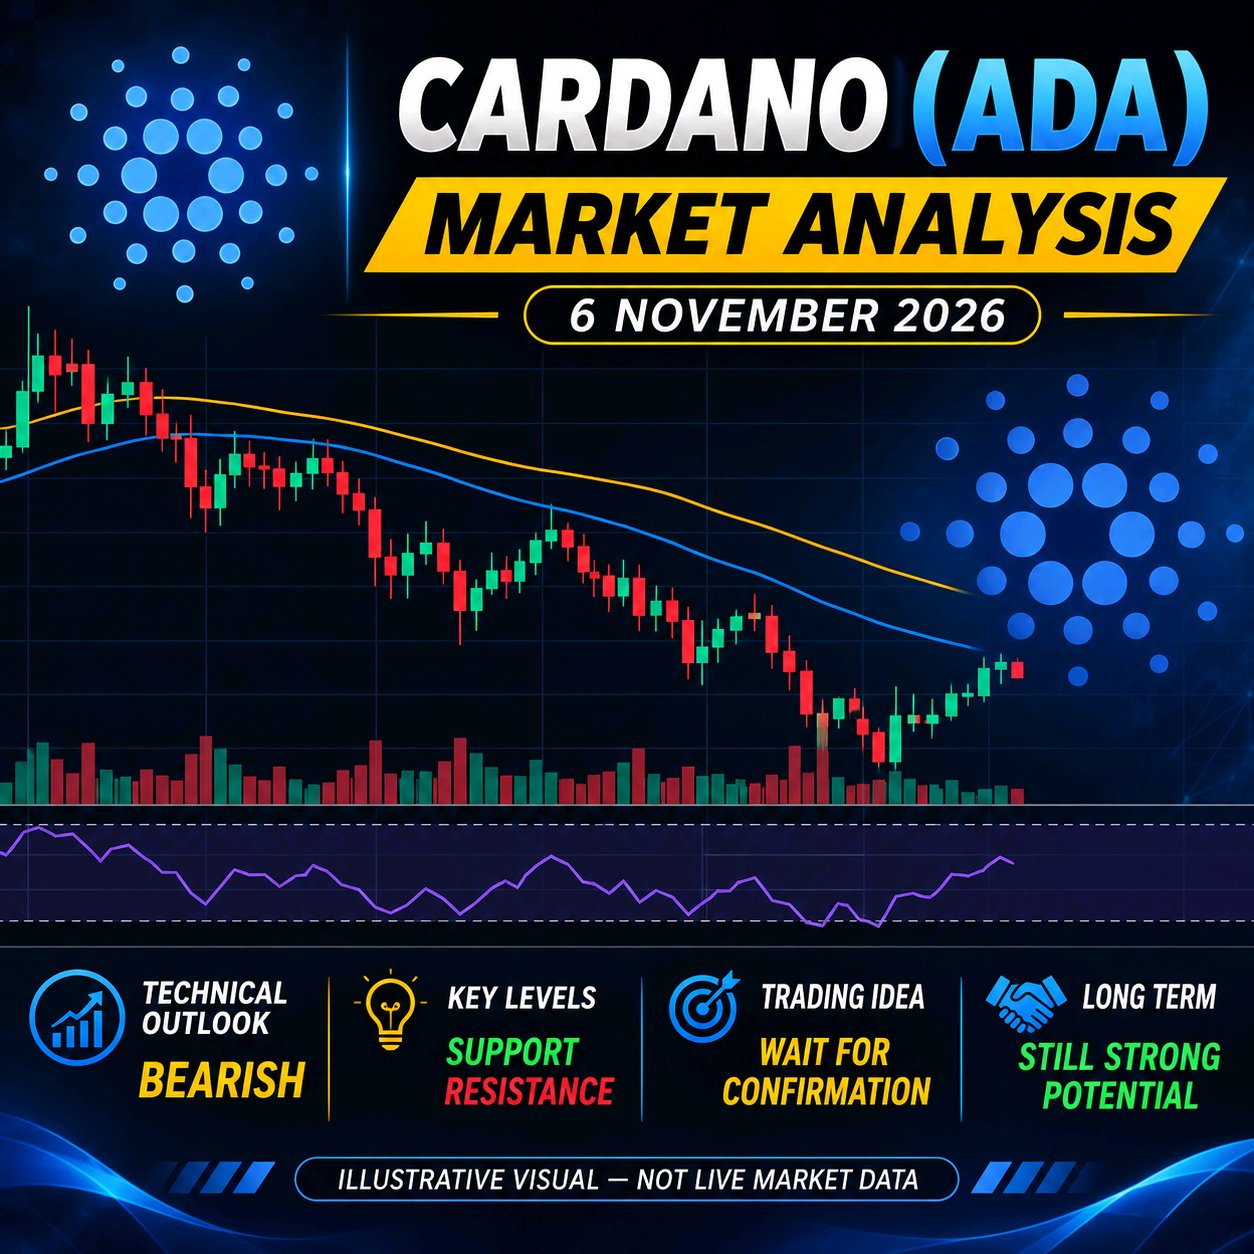
$ADAUSDT PRICE ANALYSIS — NOVEMBER 6, 2026 🔹 Current Price: Around $0.181–$0.185 🔹 Market Trend: Bearish 🔹 Daily RSI: Around 31–32 🔹 Market Momentum: Weak 🔹 Trading Sentiment: Sellers currently dominate. 📉 TECHNICAL ANALYSIS Cardano is facing strong selling pressure. ADA is trading below its major moving averages, indicating that the broader trend remains bearish. RSI is approaching oversold territory, which means a short-term recovery could happen, but buyers need to confirm their strength. 🔻 SUPPORT LEVELS • $0.1766 • $0.1738 • $0.1712 🚀 RESISTANCE LEVELS • $0.1885 • $0.1930 • $0.1957 📊 BULLISH SCENARIO If ADA reclaims $0.1885 with strong buying volume, the next potential targets are $0.1930 and $0.1957. 📉 BEARISH SCENARIO If ADA breaks below $0.1766, further downside towards $0.1738 and $0.1712 becomes possible. 🎯 TRADING STRATEGY Avoid rushing into long positions. Wait for a confirmed breakout, stronger volume and RSI recovery before considering a bullish entry. 🔥 FINAL VERDICT ADA remains bearish in the short term. However, oversold conditions could create a temporary relief bounce. Trade carefully and always manage your risk. #ADA #Cardano #CryptoAnalysis #BinanceSquare #Altcoins #CryptoTrading #BlockchainSecurity #MidtermsMarketWatch #USPayrollsAndRateDecisionsDriveMacroWeek #WSOTPicktoEarn10U #WSOT2026
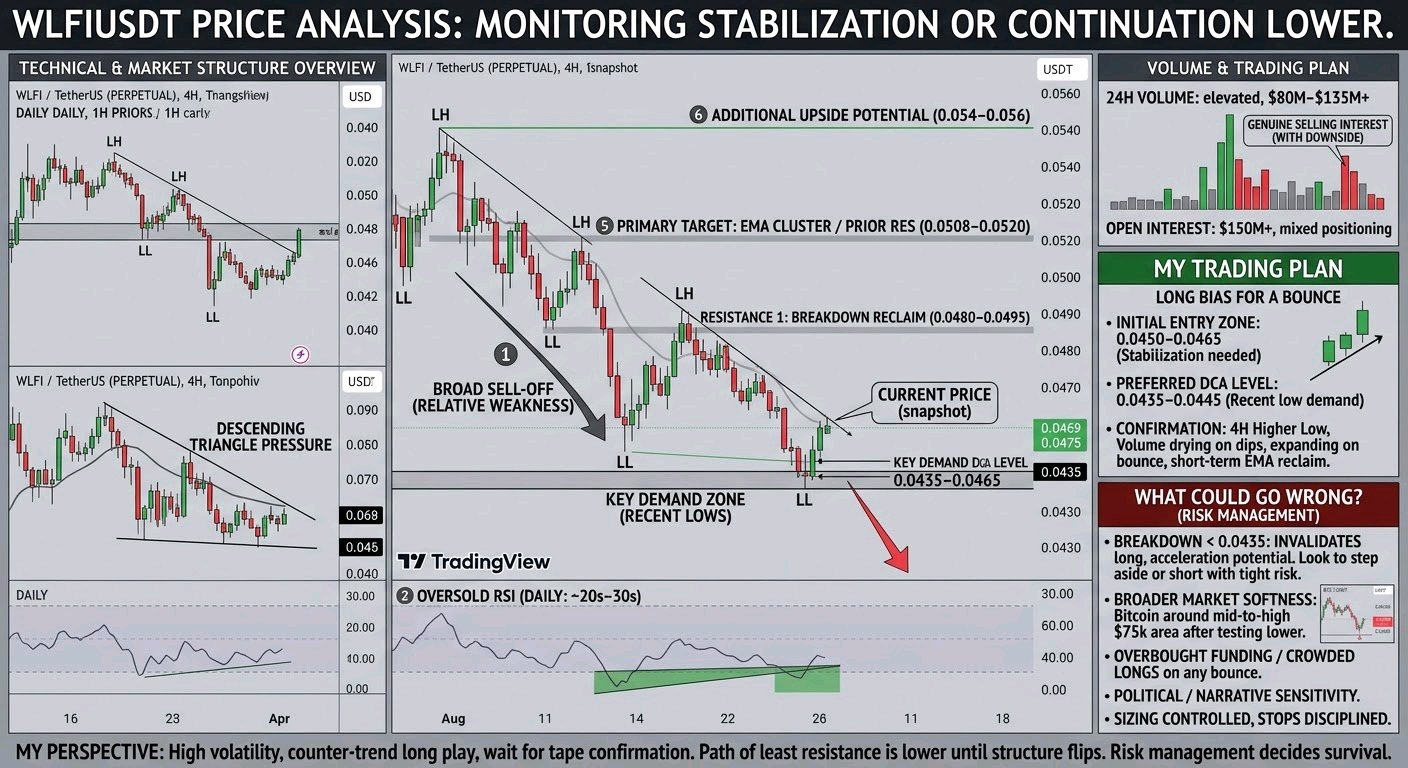
$WLFIUSDT USDT - PRICE SITTING NEAR RECENT LOWS AFTER THE SELL-OFF, AND I’M WATCHING FOR A STABILIZATION OR CONTINUATION LOWER.** WLFI has been under clear pressure. While Bitcoin has also pulled back sharply in recent sessions (trading around the mid-to-high $75k area after testing lower), WLFI has shown relative weakness, printing fresh multi-week or recent lows near the $0.0435–$0.046 region and currently hovering around $0.0469–$0.0475 depending on the exact snapshot. Higher timeframes remain bearish: daily and 4h trends are down, with price below key EMAs and RSI on the daily sitting in oversold territory (low 20s to mid-30s across sources). The structure shows lower highs and lower lows, with a descending triangle type of pressure visible on the daily in some analyses. On the shorter timeframes there’s some mixed action and occasional bounce attempts, but the overall market structure still favors sellers until proven otherwise. Recent 24h range has seen highs near $0.0488–$0.0508 and lows around $0.0435–$0.0464. **Volume Analysis** 24h volume remains elevated in the $80M–$135M range across reports (with some spikes higher), ranking it actively among mid-cap pairs. This is solid participation relative to market cap (around $1.5B). The volume has accompanied the downside moves, which typically supports continuation or at least shows genuine selling interest rather than a quiet drift lower. Elevated open interest in the futures (often $150M+) and mixed long/short positioning add to the active tape. Increased participation like this often means the move has conviction behind it—whether that leads to a flush lower or a sharp mean-reversion bounce is what I’m tracking next. **My Trading Plan** I’m treating this as a high-volatility name that can move fast in either direction from oversold conditions, so I’m keeping size controlled and levels clean. - **Initial Entry Zone (long bias for a bounce):** Looking near current levels or a dip into the $0.0450–$0.0465 area if it stabilizes with higher lows on the 1h/4h. - **Preferred DCA Level:** Deeper into the $0.0435–$0.0445 zone (recent low / demand area). A hold and reclaim here would improve the risk/reward for a counter-trend long. - **First Resistance:** $0.0480–$0.0495. This is where previous breakdowns and short-term supply sit. A clean break and hold above would be the first real sign of strength. - **Primary Target:** $0.0508–$0.0520 region (prior resistance / EMA cluster). - **Additional Upside Potential:** If momentum builds, the $0.054–$0.056 area becomes interesting, but that requires a clear shift in structure first. Confirmation for the long side would be a higher low forming on the 4h with volume drying up on dips and expanding on the bounce, plus a reclaim of short-term EMAs. I’m not forcing entries—waiting for price action to show buyers are stepping in with conviction. **What Could Go Wrong?** The broader market is soft and WLFI has been lagging. A breakdown below the recent low near $0.0435 with expanding volume would open the door to deeper support and potentially accelerate the downtrend. In that case the setup for any bounce long is invalidated, and I’d step aside or look at the short side only with tight risk. Deeper demand exists lower, but chasing without structure is a quick way to get chopped. Overbought funding or crowded longs on any bounce could also reverse quickly. Political or narrative sensitivity around this token can amplify moves in either direction, so I’m staying disciplined on stops. **My Perspective** WLFI is interesting right now precisely because it’s been sold hard into oversold territory while volume stays active. That combination often produces either a sharp relief bounce or a final flush before larger players decide the next direction. The higher-timeframe structure is still bearish, so any long is a counter-trend trade until we see a clear break of the downtrend and reclaim of resistance. I’m watching the $0.0435–$0.0465 demand zone closely for reaction, and the $0.048–$0.050 resistance for rejection or acceptance. Overall expectation: more volatility near these lows is likely. A stabilization and move back toward $0.050+ is possible if buyers defend, but the path of least resistance remains lower until the structure flips. I’m staying patient, sizing small, and letting the tape confirm before committing size. This is the kind of setup where risk management decides who survives the next move. #IMPACTbyTrade #BlockchainSecurity #WSOT2026
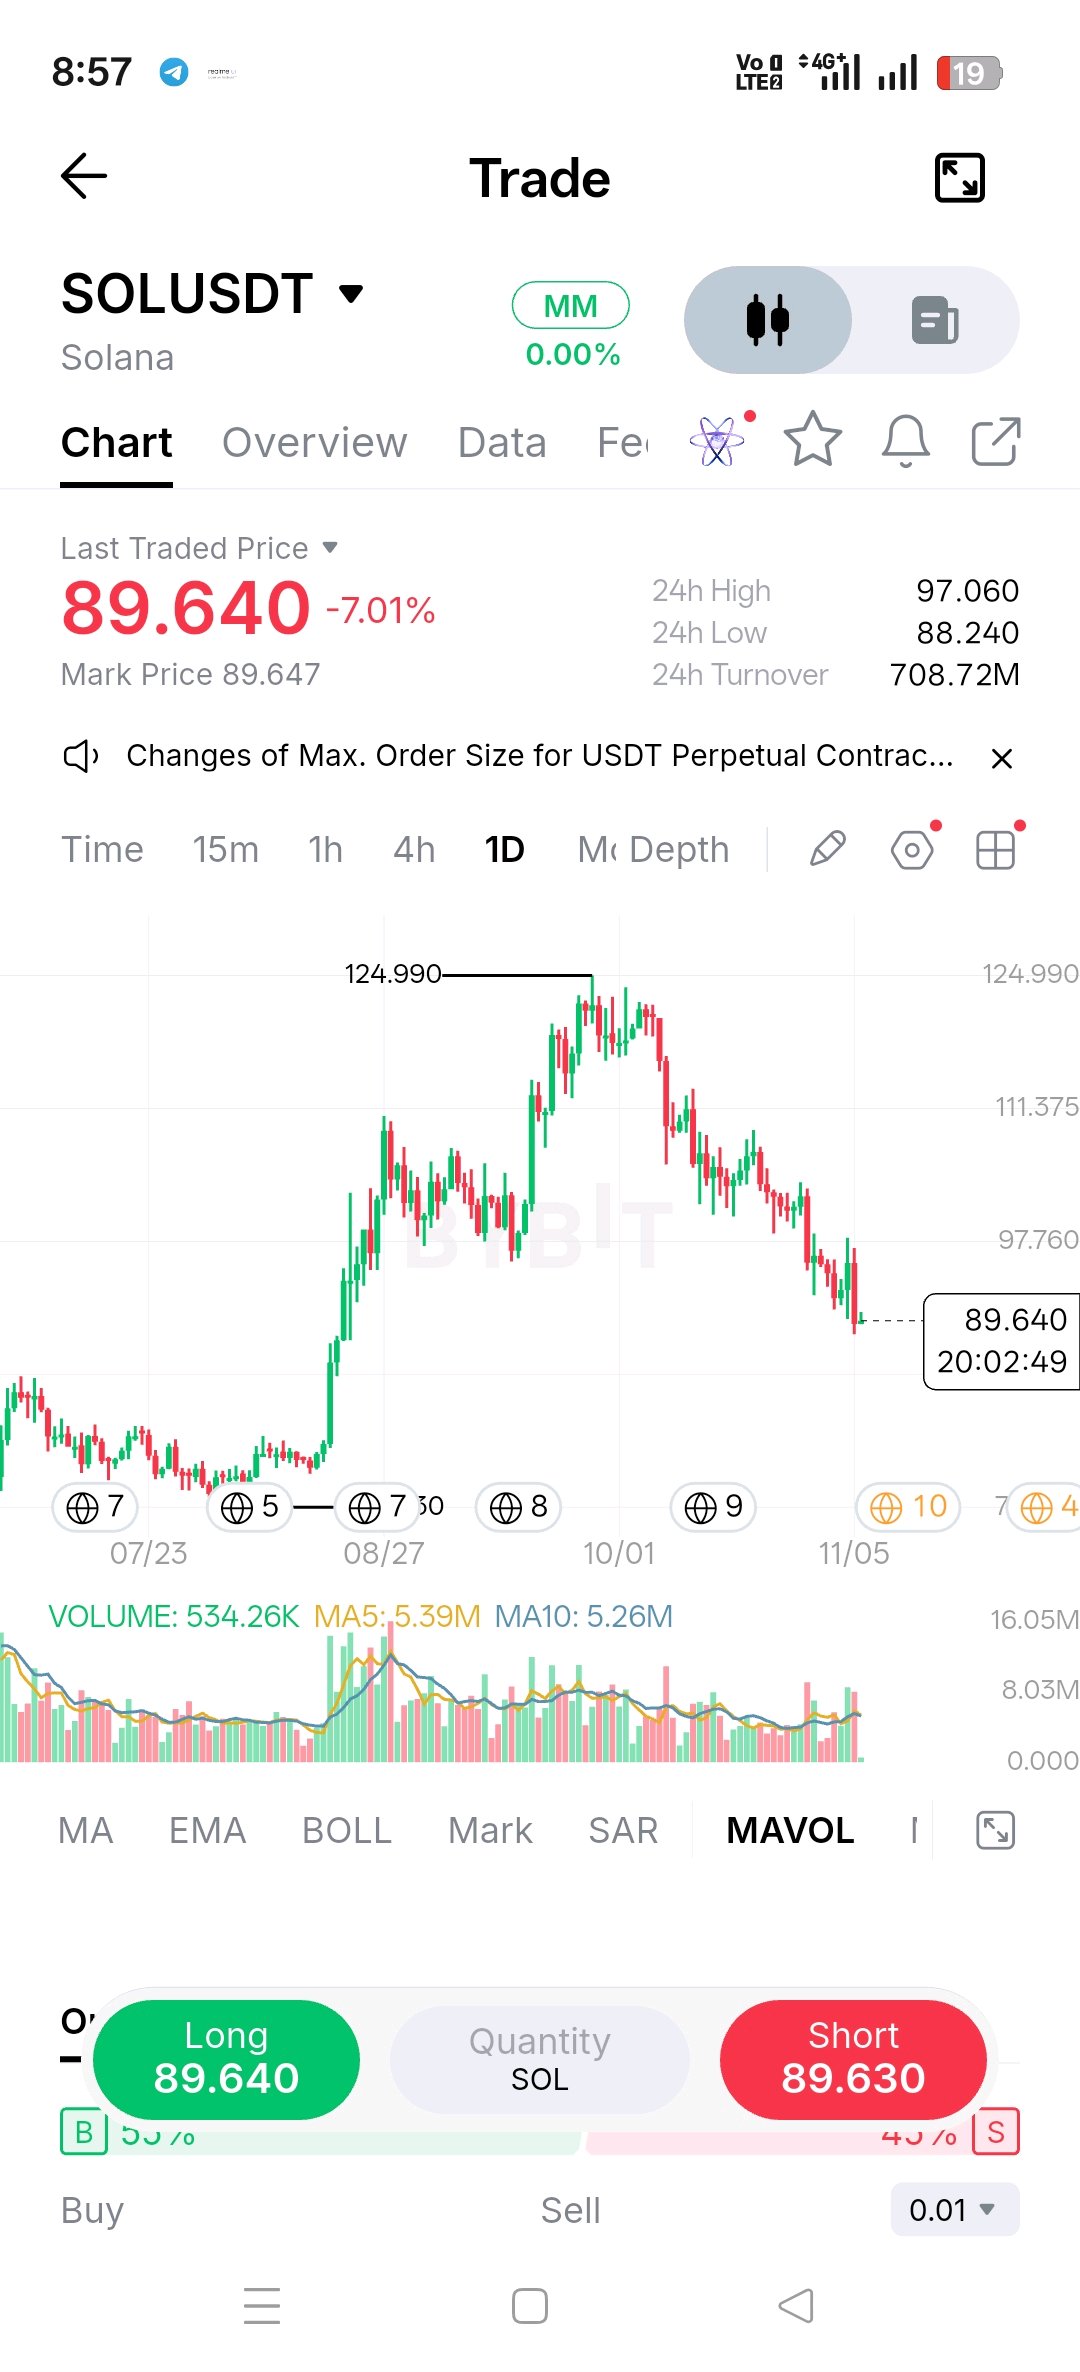
🔥 SOL Tests Critical Support
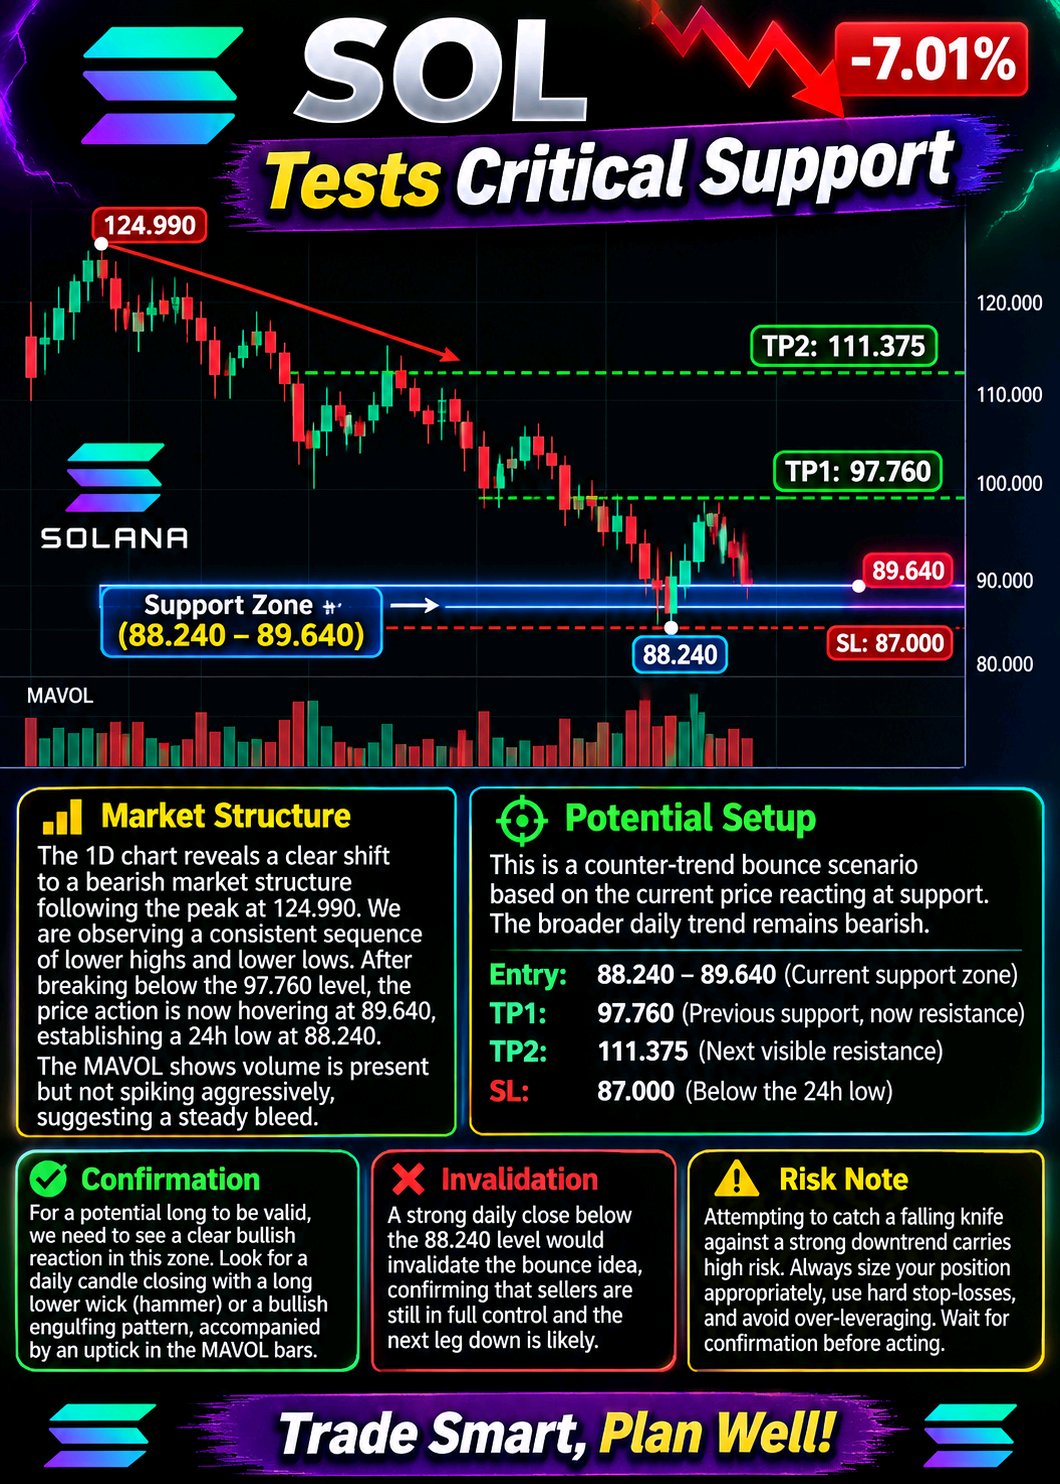
Solana is currently experiencing heavy selling pressure, printing a notable red daily candle with a -7.01% change. Price has retraced significantly from its recent highs and is now testing a critical lower boundary. 📊 Market Structure: The 1D chart reveals a clear shift to a bearish market structure following the peak at 124.990. We are observing a consistent sequence of lower highs and lower lows. After breaking below the 97.760 level, the price action is now hovering at 89.640, establishing a 24h low at 88.240. The MAVOL indicator shows volume is present but not spiking aggressively, suggesting a steady bleed rather than a capitulation event. The current zone aligns with consolidation levels seen back in early August. 🎯 Potential Setup: This is a counter-trend bounce scenario based on the current price reacting to support. The broader daily trend remains bearish. Entry: 88.240 - 89.640 (Current support zone) TP1: 97.760 (Previous support, now potential resistance) TP2: 111.375 (Next visible structural resistance) SL / Invalidation: 87.000 (Below the current 24h low to allow for slight volatility) ⚠️ Confirmation: For a potential long to be valid, we need to see a clear bullish reaction in this zone. Look for a daily candle closing with a long lower wick (hammer) or a bullish engulfing pattern, accompanied by an uptick in the MAVOL bars. ❌ Invalidation: A strong daily close below the 88.240 level would invalidate the bounce idea, confirming that sellers are still in full control and the next leg down is likely. 🧠 Risk Note: Attempting to catch a falling knife against a strong downtrend carries high risk. Always size your position appropriately, use hard stop-losses, and avoid over-leveraging. Wait for confirmation before acting. #ByXIMPACT $BTCUSDT #BlockchainSecurity #WSOTPicktoEarn10U
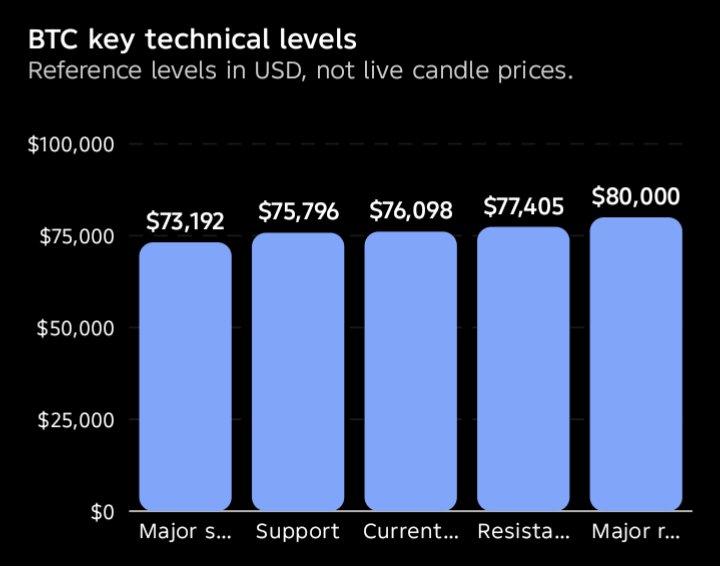
₿ BITCOIN (BTC) LATEST MARKET ANALYSIS
$BTCUSDT latest update 📅 November 6, 2026 💰 Current Price: Approximately $76,098 📊 MARKET OVERVIEW Bitcoin is showing short-term bearish pressure after struggling to maintain its recent recovery. Buyers are attempting to defend the $75,796 support zone, while sellers remain active around $77,405. 🔍 KEY TECHNICAL LEVELS 🟢 Support 1: $75,796 🟢 Major Support: $73,192 🔴 Resistance 1: $77,405 🔴 Major Resistance: $80,000 📉 TECHNICAL INDICATORS • RSI (14): Around 39 • Short-term momentum: Bearish • Market structure: Weak • Buying pressure: Needs confirmation 🚀 BULLISH SCENARIO If BTC breaks above $77,405 and confirms the breakout with strong volume, the next potential target is $80,000. 🐻 BEARISH SCENARIO If Bitcoin loses $75,796, selling pressure could increase, potentially pushing BTC towards $73,192. 🎯 MY MARKET OUTLOOK Bitcoin is currently in a critical zone. Traders should watch the $75,796 support and $77,405 resistance carefully before entering any position. ⚠️ Always use proper risk management. Avoid emotional trading and excessive leverage. #BlockchainSecurity #BybitAIEvolving #Oracle20BFundingPlanTestsTheAITrade #USPayrollsAndRateDecisionsDriveMacroWeek #Bitcoin #BTC #CryptoAnalysis #Binance #CryptoTrading #BTCUSDT
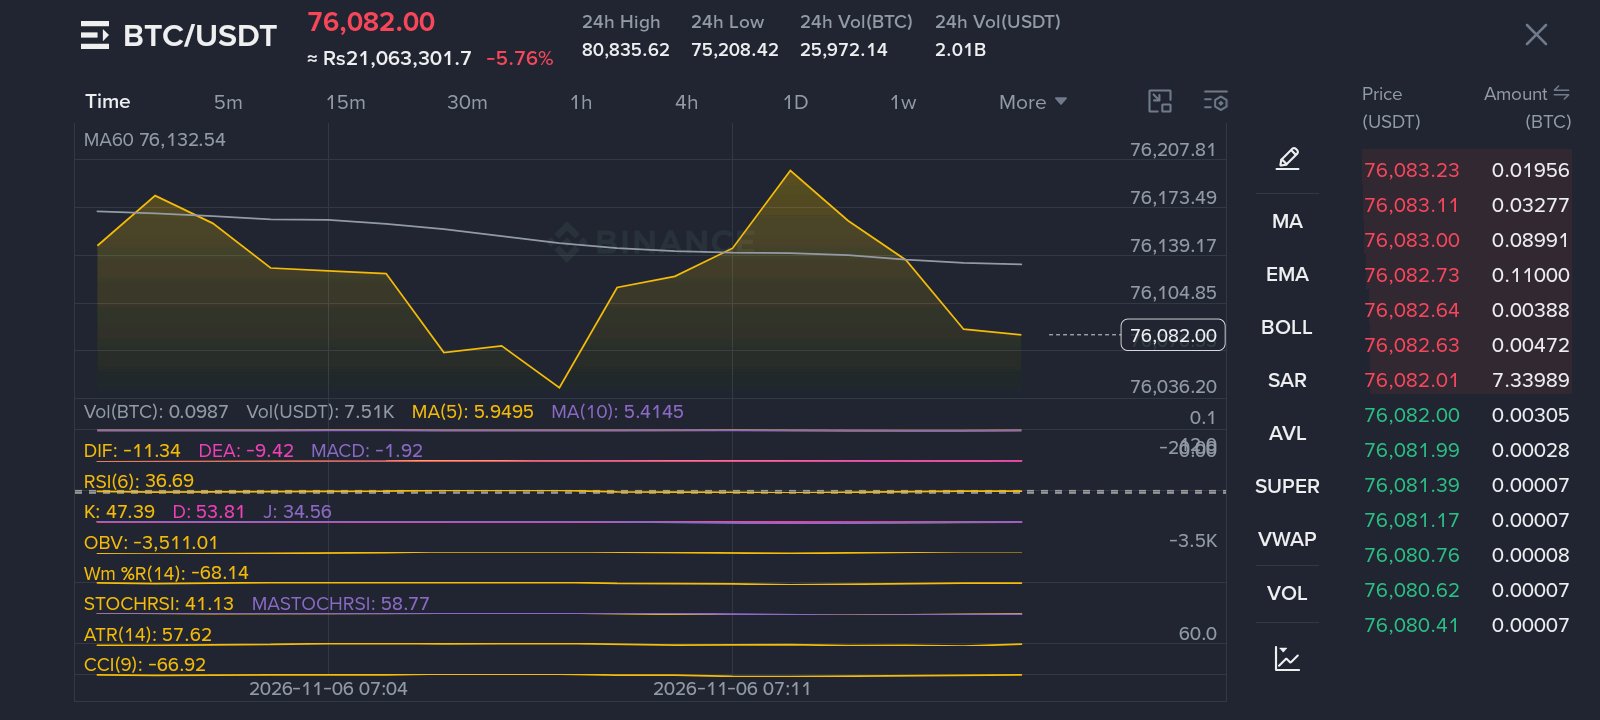
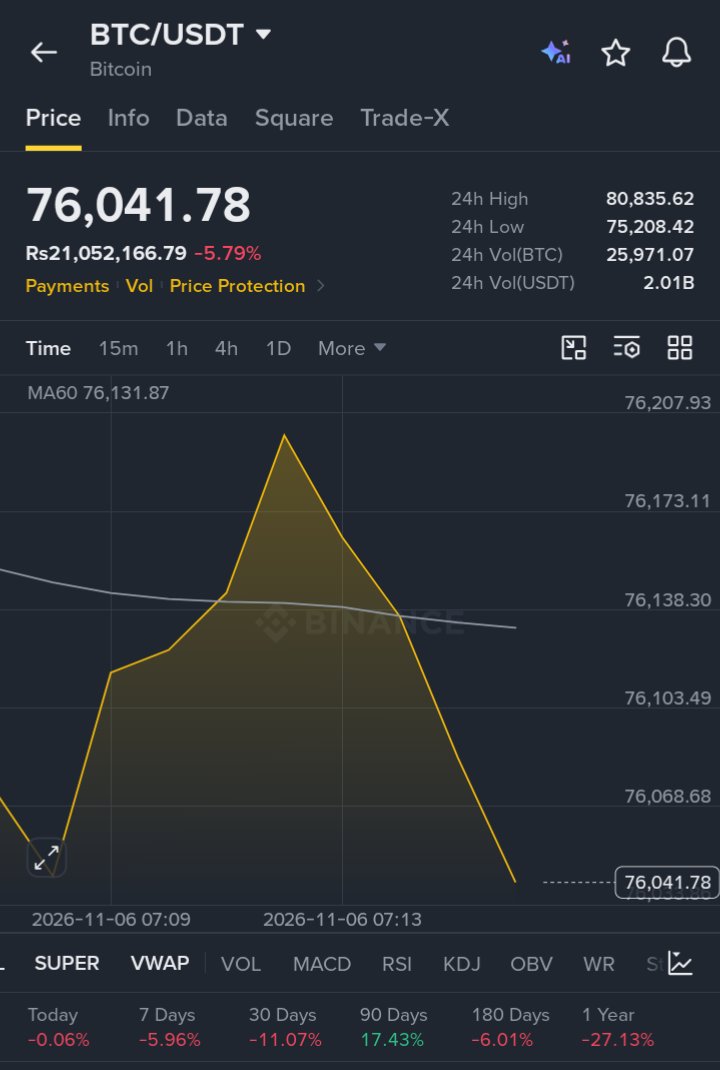

I'm watching $BTCUSDT around $76,021, and what stands out to me is how quickly the market has shifted from holding higher levels to trading below all three major moving averages on the 6H chart. MA7 is around $78,536, MA14 near $77,975, and MA28 around $77,820. That tells me buyers still have some work to do before I can consider the short-term structure healthy again. The recent selling pressure is clear, but I'm not interested in chasing a move simply because the candles look bearish. I'm focusing on the $75,200 area because it marks the recent 24H low and sits close to the lower Bollinger Band around $75,094. If sellers push price into that zone, I want to see how BTC reacts. A clean breakdown with expanding volume would make me cautious about further downside, while a strong rejection could open the door for a recovery attempt. On the other side, I want to see BTC reclaim the $77,800-$78,500 region before taking any bullish setup seriously. Momentum is still weak, with KDJ showing K at 32.8, D at 49.92, and J below zero. Volume also needs attention: current volume is around 1.07K, below both volume averages near 3.98K and 3.85K. I don't see enough confirmation yet to trust a reversal. For now, I'm waiting for either a convincing support reaction or a proper breakdown with volume confirmation. No forced entries, no guessing the bottom, and no chasing a relief bounce. BTC is giving me levels to watch, but not yet a setup worth taking. My current position is simple: WAIT. #WSOT2026 #BlockchainSecurity #WSOTPicktoEarn10U $BTCUSDT $ETHUSDT

🚨 Trezor has increased its passphrase limit from 50 to 128 characters on four device models. The update aims to strengthen the protection of Bitcoin wallets against unauthorized access attempts. #BybitAIEvolving #BlockchainSecurity $SOLUSDT


Trump stated that he accepts the results
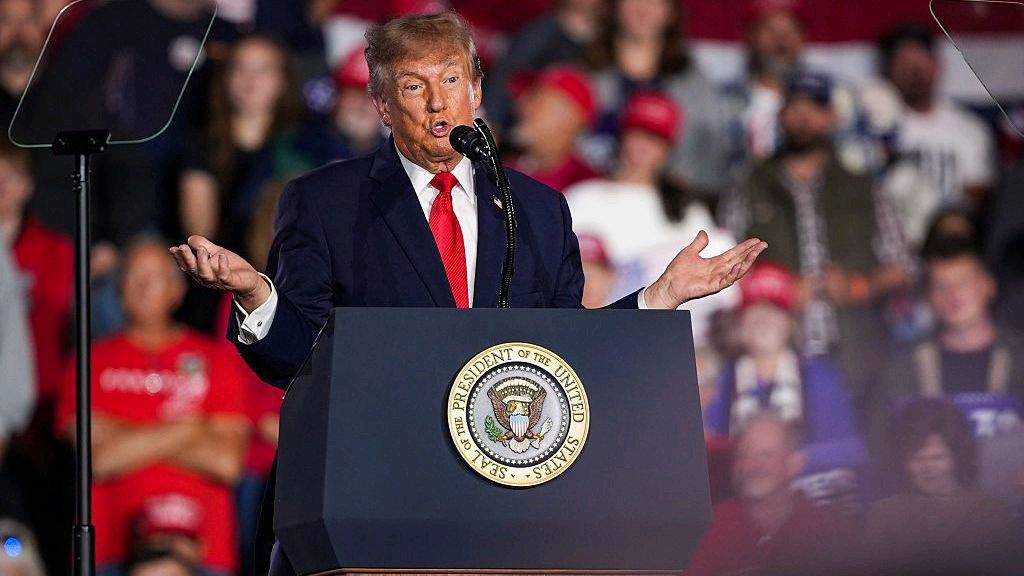
TRUMP and $BNBUSDT on watch as U.S. midterms headline hits market Trump stated that he accepts the results of the U.S. midterm elections and is prepared to work with the Democrats who have gained control of both chambers of Congress according to WSJ live tracker. At same time he wrote on Truth Social "I wasn't on the ballot, but if I had been, we would have won by a landslide!" What the tracker shows in your screenshots at 1:26 AM, Source AP via WSJ. HOUSE 188 Dem gained 13 vs 110 Rep lost 13, 218 seats for majority. SENATE 52 Dem gained 6 vs 40 Rep lost 6, 51 seats for majority. Map shows mixed reporting % still incoming, so this is live count not final certified result. Why I am watching this for crypto, midterms always bring volatility.TRUMP is meme beta for Trump headlines, it pumps and dumps hard on Truth Social posts. $BNB is market beta and Binance ecosystem coin, when political headlines hit risk sentiment it moves with $BTC. I am not chasing green candle on headline alone. For TRUMP $0.03000 area that was 24h high on other meme trackers is first resistance, support is low of the day around $0.02632 zone where $Q also bounced today. For $BNB watch $76,648 level, if BTC holds $76,171 24h low, alts get relief bounce, if $75,736 breaks alts flush again. My plan is simple, no long at top on news. I wait for pullback and confirmation. If TRUMP holds above $0.02810 and reclaims $0.02869 with volume, long toward $0.02970 and $0.03000 stop below $0.02632. If headline fades and price closes below $0.02730 I step aside. Risk 1 to 2% only, news trades are fast and can reverse. Do you think Democrats holding both chambers is bullish or bearish for crypto regulation and momentum? Tap $TRUMPUSDT to trade this election volatility @BybitX @Bybit Learn @612 Ceros @SignalX @Demon - Trader @GhostWriter @VietnexusCrypto @PRADO @IBLOLO @Crypto BOSS #trump #USPayrollsAndRateDecisionsDriveMacroWeek #MidtermsMarketWatch #BlockchainSecurity #WSOT2026 #OilVolatilityTracksIranPeaceTalks

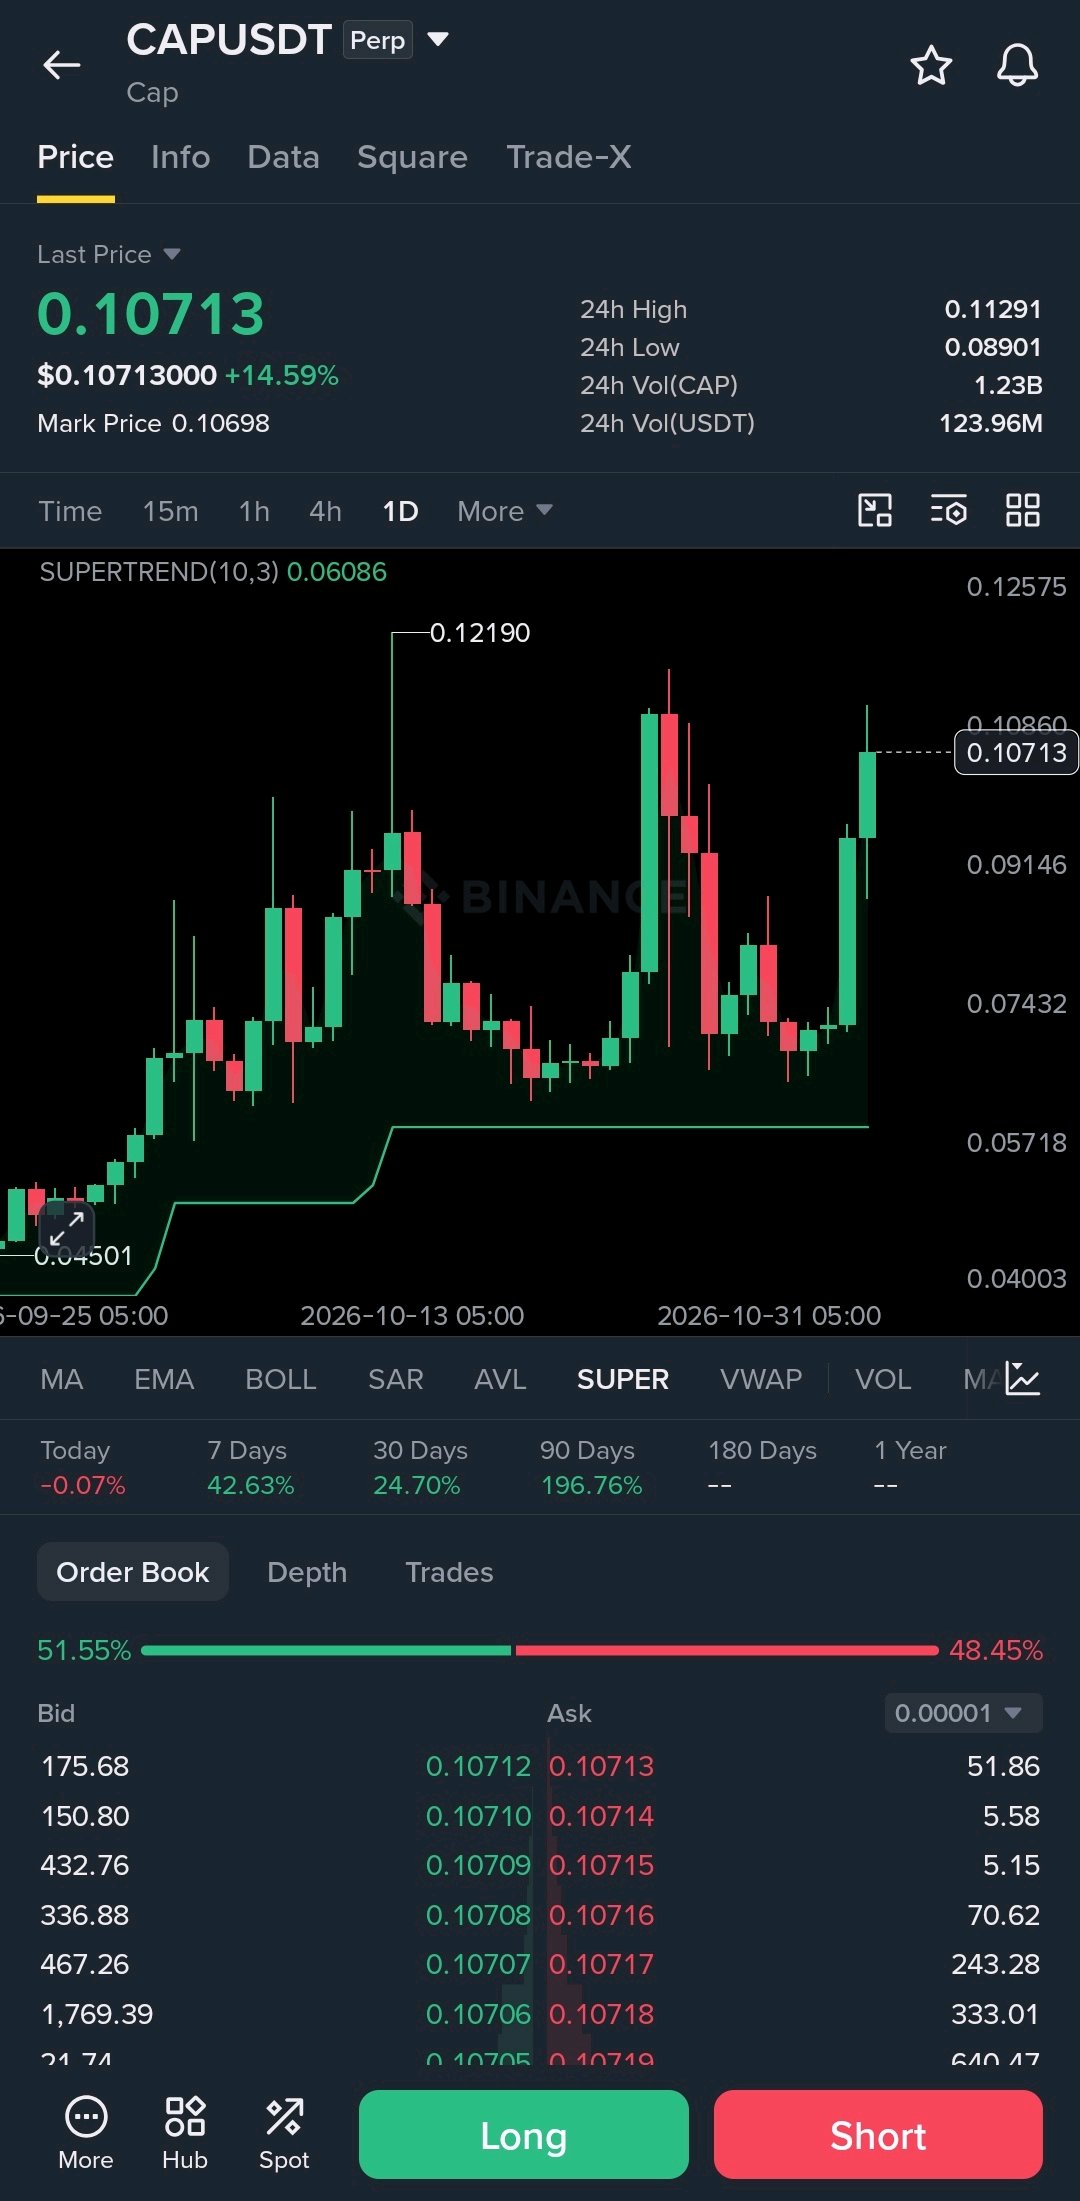
$CAPUSDT is building a strong bullish structure, and buyers are clearly back in control. Price has climbed to $0.1071 after reclaiming the $0.09 area. The daily Supertrend remains bullish at $0.06086, while momentum is now bringing the previous high into focus. Key levels to watch: Support: $0.091–$0.089 Near-term resistance: $0.1129 Major resistance: $0.1219 Trend support: $0.0608 A clean break above $0.1129 could set up a retest of $0.1219. If buyers fail to hold $0.089, a deeper pullback becomes possible. CAP is showing impressive relative strength. The next challenge is turning this momentum into a confirmed breakout. #Oracle20BFundingPlanTestsTheAITrade #BlockchainSecurity
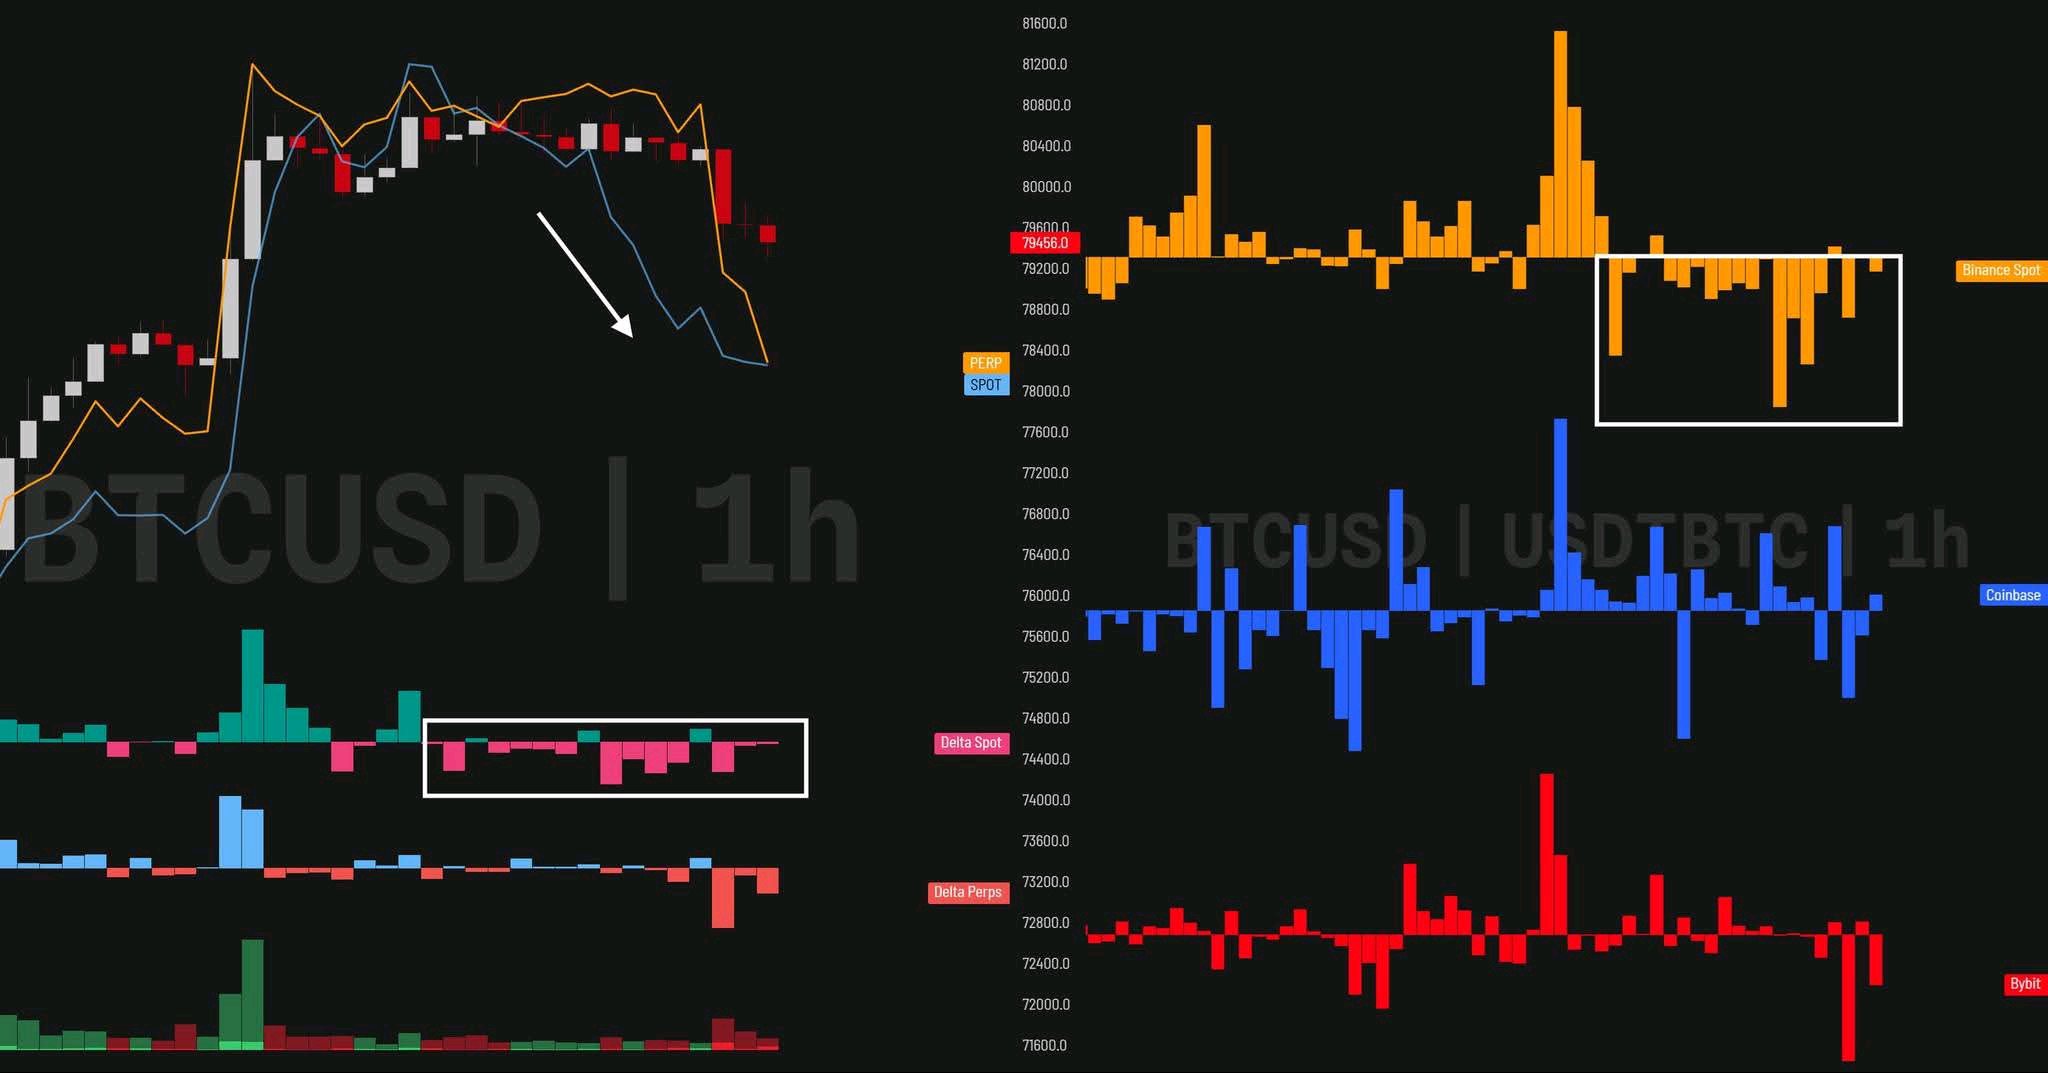
$BTCUSDT Spot volume fading as price drifts down. Not bearish, just normal after a 76k ➜ 80k run. Still in from $76k Looking to add at 78-79k Invalidation unchanged #BlockchainSecurity #USPayrollsAndRateDecisionsDriveMacroWeek #WSOTPicktoEarn10U #WSOT2026 #BybitAIEvolving $MNTUSDT
🚨 ETHEREUM (ETH) LIVE MARKET ANALYSIS
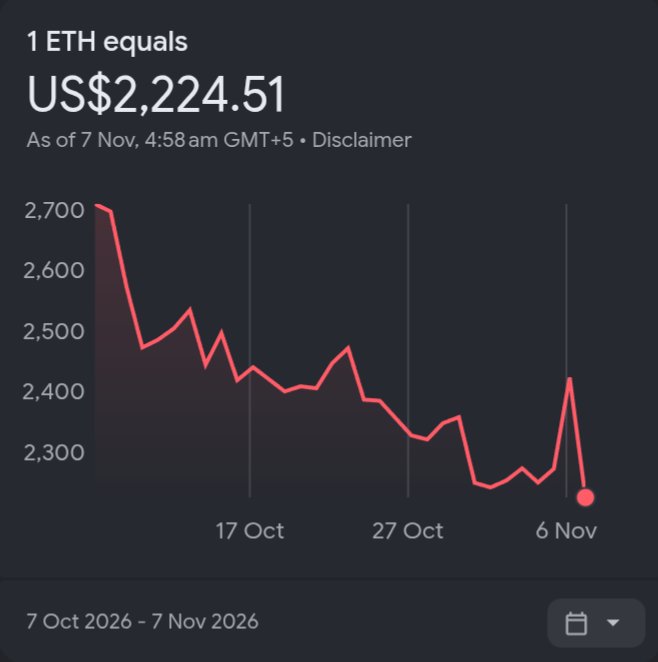
$ETHUSDT (ETH) MARKET UPDATE 📊 ETH/USDT – Market Outlook Ethereum is showing mixed market signals, with short-term bullish momentum on the 4-hour chart but a bearish trend on the daily timeframe. 💰 Latest Retrieved Price Snapshot: $2,286 📉 24H Change: -6.11% 🔍 Key Support Levels - $2,238 - $2,227 🎯 Key Resistance Levels - $2,321 - $2,330 - $2,452 📈 Bullish Scenario: If ETH breaks above $2,330 and maintains momentum, buyers could push the price toward higher resistance zones. 📉 Bearish Scenario: If ETH loses the $2,227 support zone, further downside pressure may develop. 📊 Market Sentiment: Short-term: Mixed / cautiously bullish Daily trend: Bearish 💡 Trading Strategy: Wait for a confirmed breakout or breakdown before entering a trade. Avoid chasing sudden price movements. ⚠️ Always use proper risk management. This analysis is for educational purposes, not financial advice. #ETH #ETHUSDT #CryptoAnalysis #Binance #Trading #CryptoMarket #WSOT2026 #USPayrollsAndRateDecisionsDriveMacroWeek #BybitAIEvolving #BlockchainSecurity

$XAUTUSDT Gold Shows Strong Recovery as Investors Watch Global Economic Developments Gold is gaining attention again as changing market expectations and movements in the US dollar influence precious metals. The $4,200 level is an important area to watch. A sustained move above this resistance could strengthen bullish momentum, while rejection may bring another period of consolidation. Gold remains an important asset to watch amid global economic uncertainty. Stay focused on market confirmation and manage your risk. #Gold #XAUUSD #GoldTrading #PreciousMetals #MarketNewsBinance Continues Security Recovery and Strengthens User Confidence Binance is making further progress with its security recovery efforts, including updates on asset withdrawals and platform protection. Security remains one of the most important factors for any crypto exchange. These developments highlight the importance of transparency, user protection, and stronger security systems across the crypto industry. The crypto community will be watching Binance's next updates closely. #BlockchainSecurity #Oracle20BFundingPlanTestsTheAITrade #MidtermsMarketWatch #AnthropicIPOTestsTheAIBoom #BOERateDecision $BTCUSDT
Bitcoin Shows Recovery Strength as Market Volatility Continues $BTCUSDT Bitcoin is showing signs of recovery after facing strong selling pressure. The market is trying to regain bullish momentum, while investors are closely watching the $82,000 resistance zone. ETF inflows and short liquidations are adding some support to the recovery. However, bulls still need a strong breakout to confirm the next upward move. The coming sessions could be important for Bitcoin's direction. Stay patient, manage risk, and watch key levels. #BlockchainSecurity #Oracle20BFundingPlanTestsTheAITrade #MidtermsMarketWatch #AnthropicIPOTestsTheAIBoom #BybitAIEvolving

$BTCUSDT looks interesting i suggest buy buy buy as much you can this last chance before 90k I'm bullish I'm opening #WSOT2026 #USPayrollsAndRateDecisionsDriveMacroWeek #BybitAIEvolving #AnthropicIPOTestsTheAIBoom #BlockchainSecurity
🔥CAP/USDT: Key Resistance Test
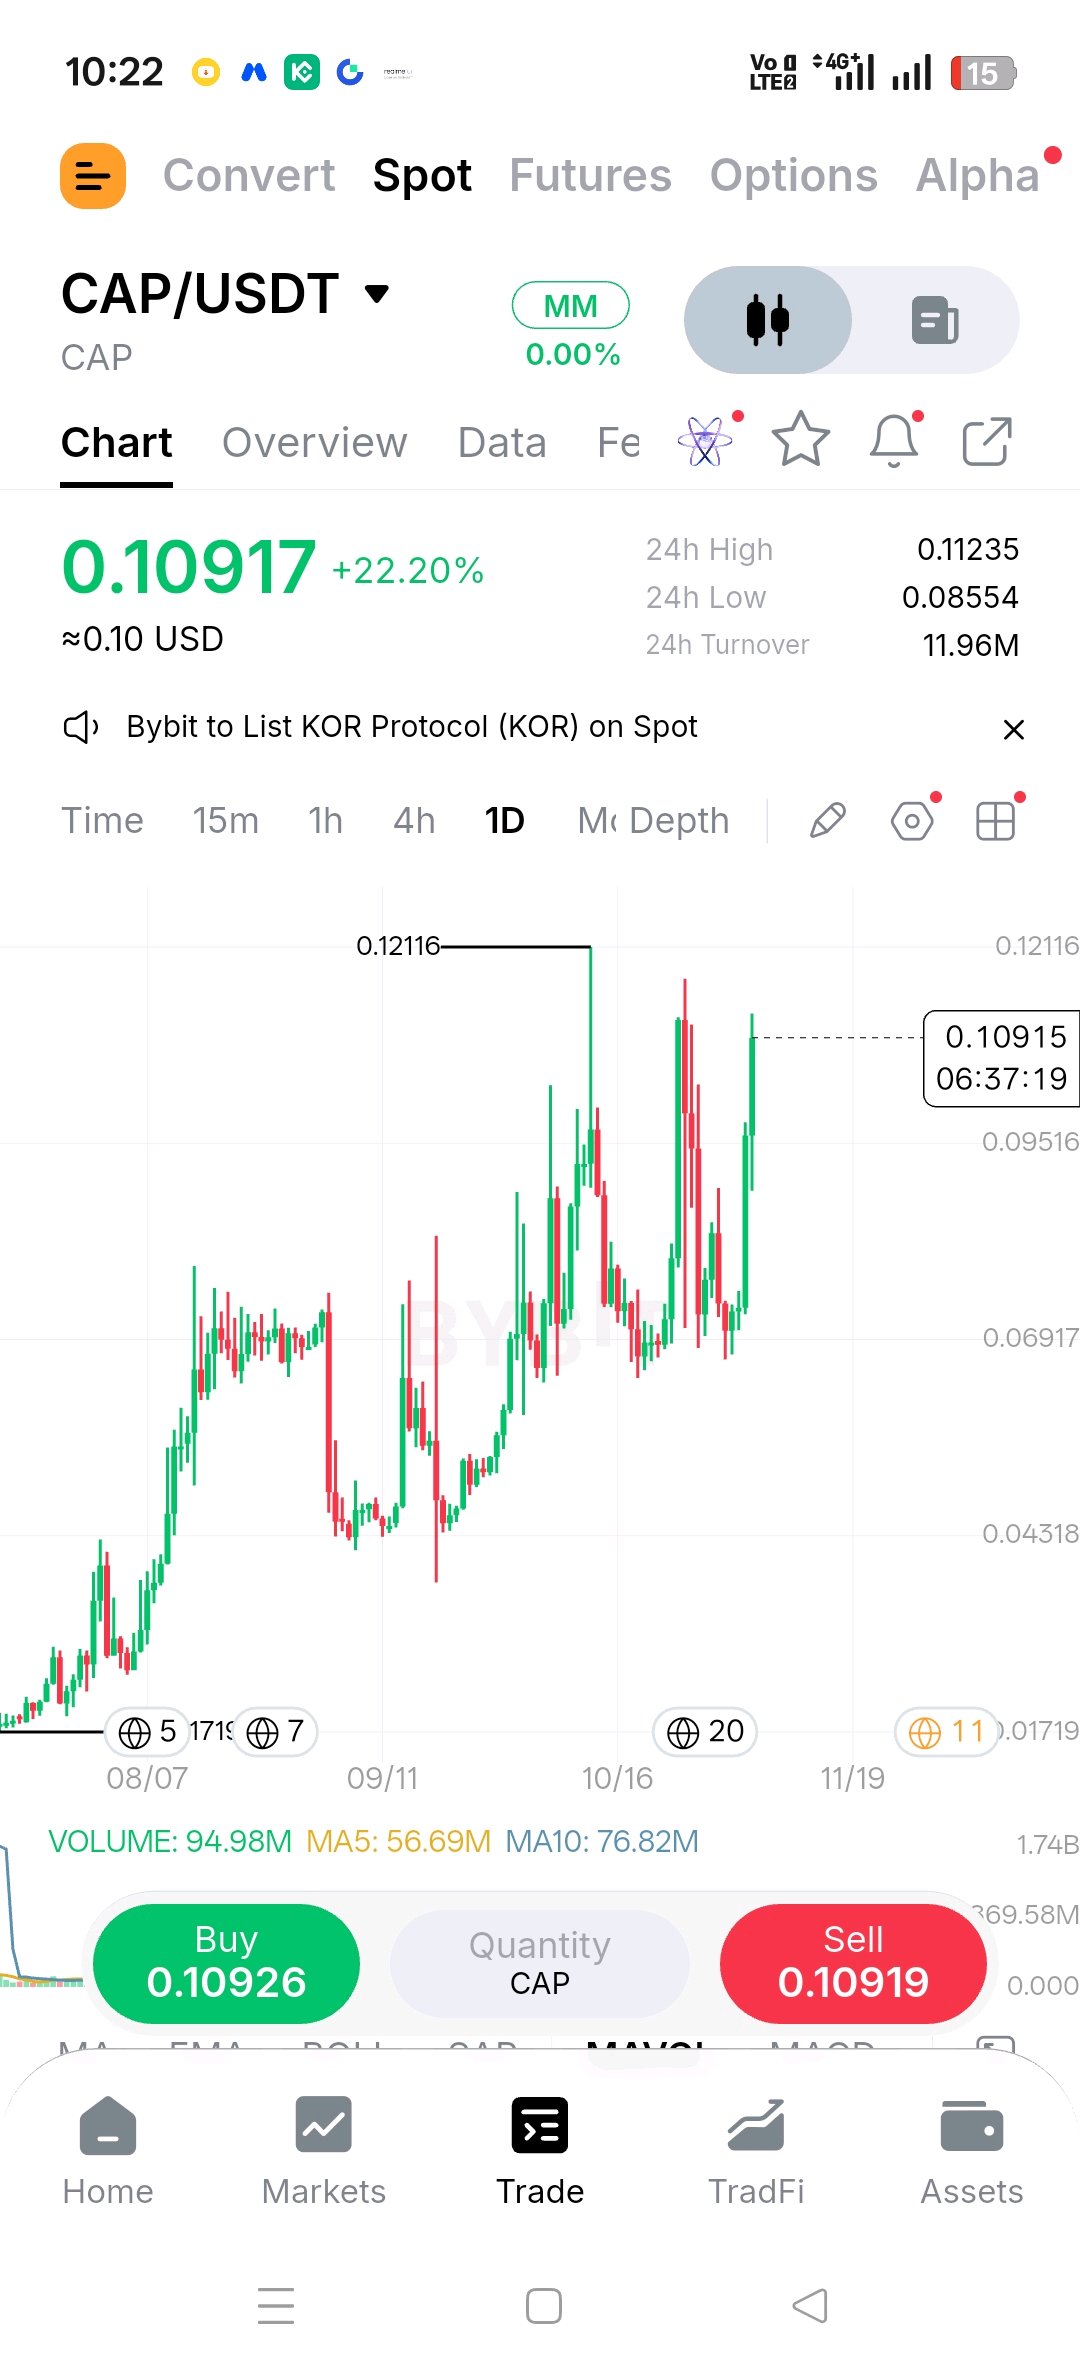
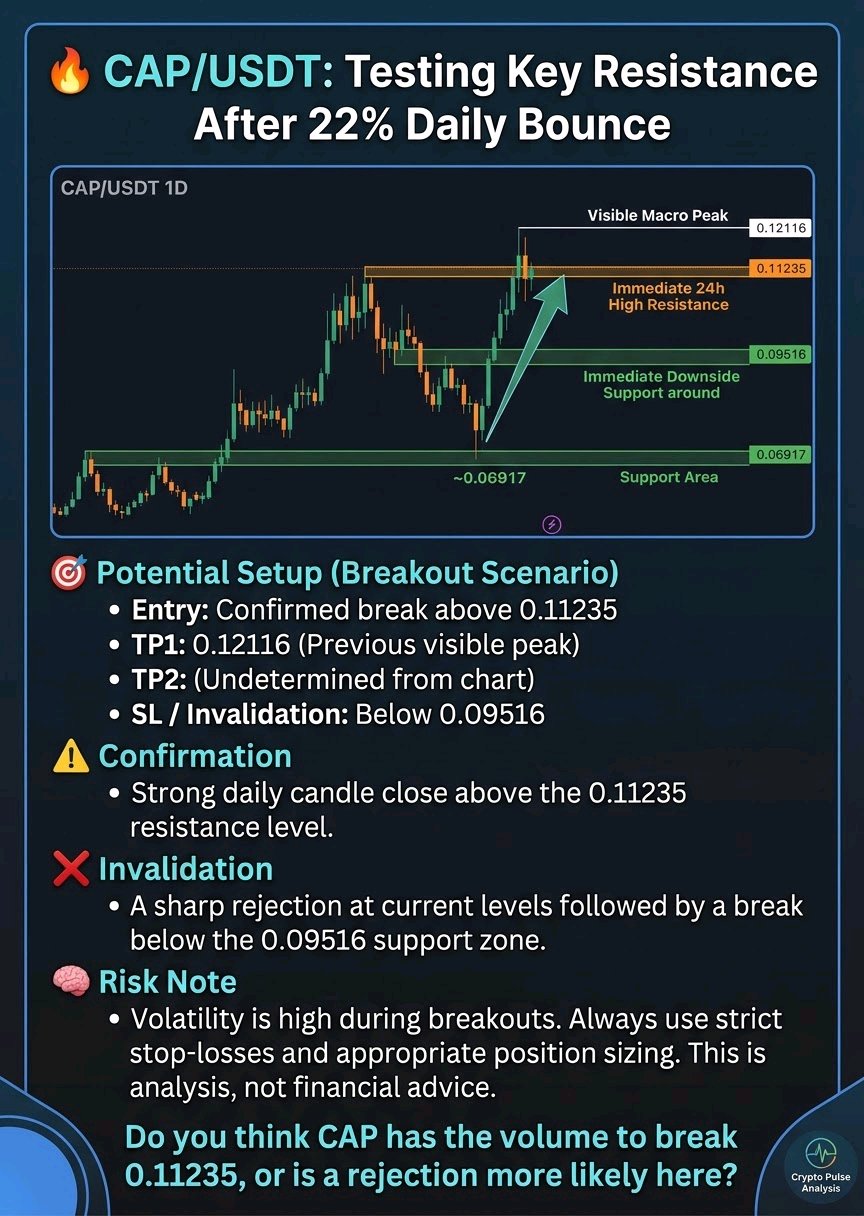
$CAPUSDT CAP is showing strong bullish momentum today, recovering sharply from recent lows to test local resistance. 📊 Market Structure: On the 1D chart, CAP/USDT is in a broader uptrend, having bounced firmly from the ~0.06917 support area. Price is currently challenging the immediate 24h high of 0.11235, with the visible macro peak sitting higher at 0.12116. Immediate downside support is visible around 0.09516. 🎯 Potential Setup (Breakout Scenario): · Entry: Confirmed break above 0.11235 · TP1: 0.12116 (Previous visible peak) · TP2: Not clear from chart · SL / Invalidation: Below 0.09516 ⚠️ Confirmation: A strong daily candle close above the 0.11235 resistance level. ❌ Invalidation: A sharp rejection at current levels followed by a break below the 0.09516 support zone. 🧠 Risk Note: Volatility is high during breakouts. Always use strict stop-losses and appropriate position sizing. This is analysis, not financial advice. #IMPACTbyTrade #BlockchainSecurity #BybitAIEvolving
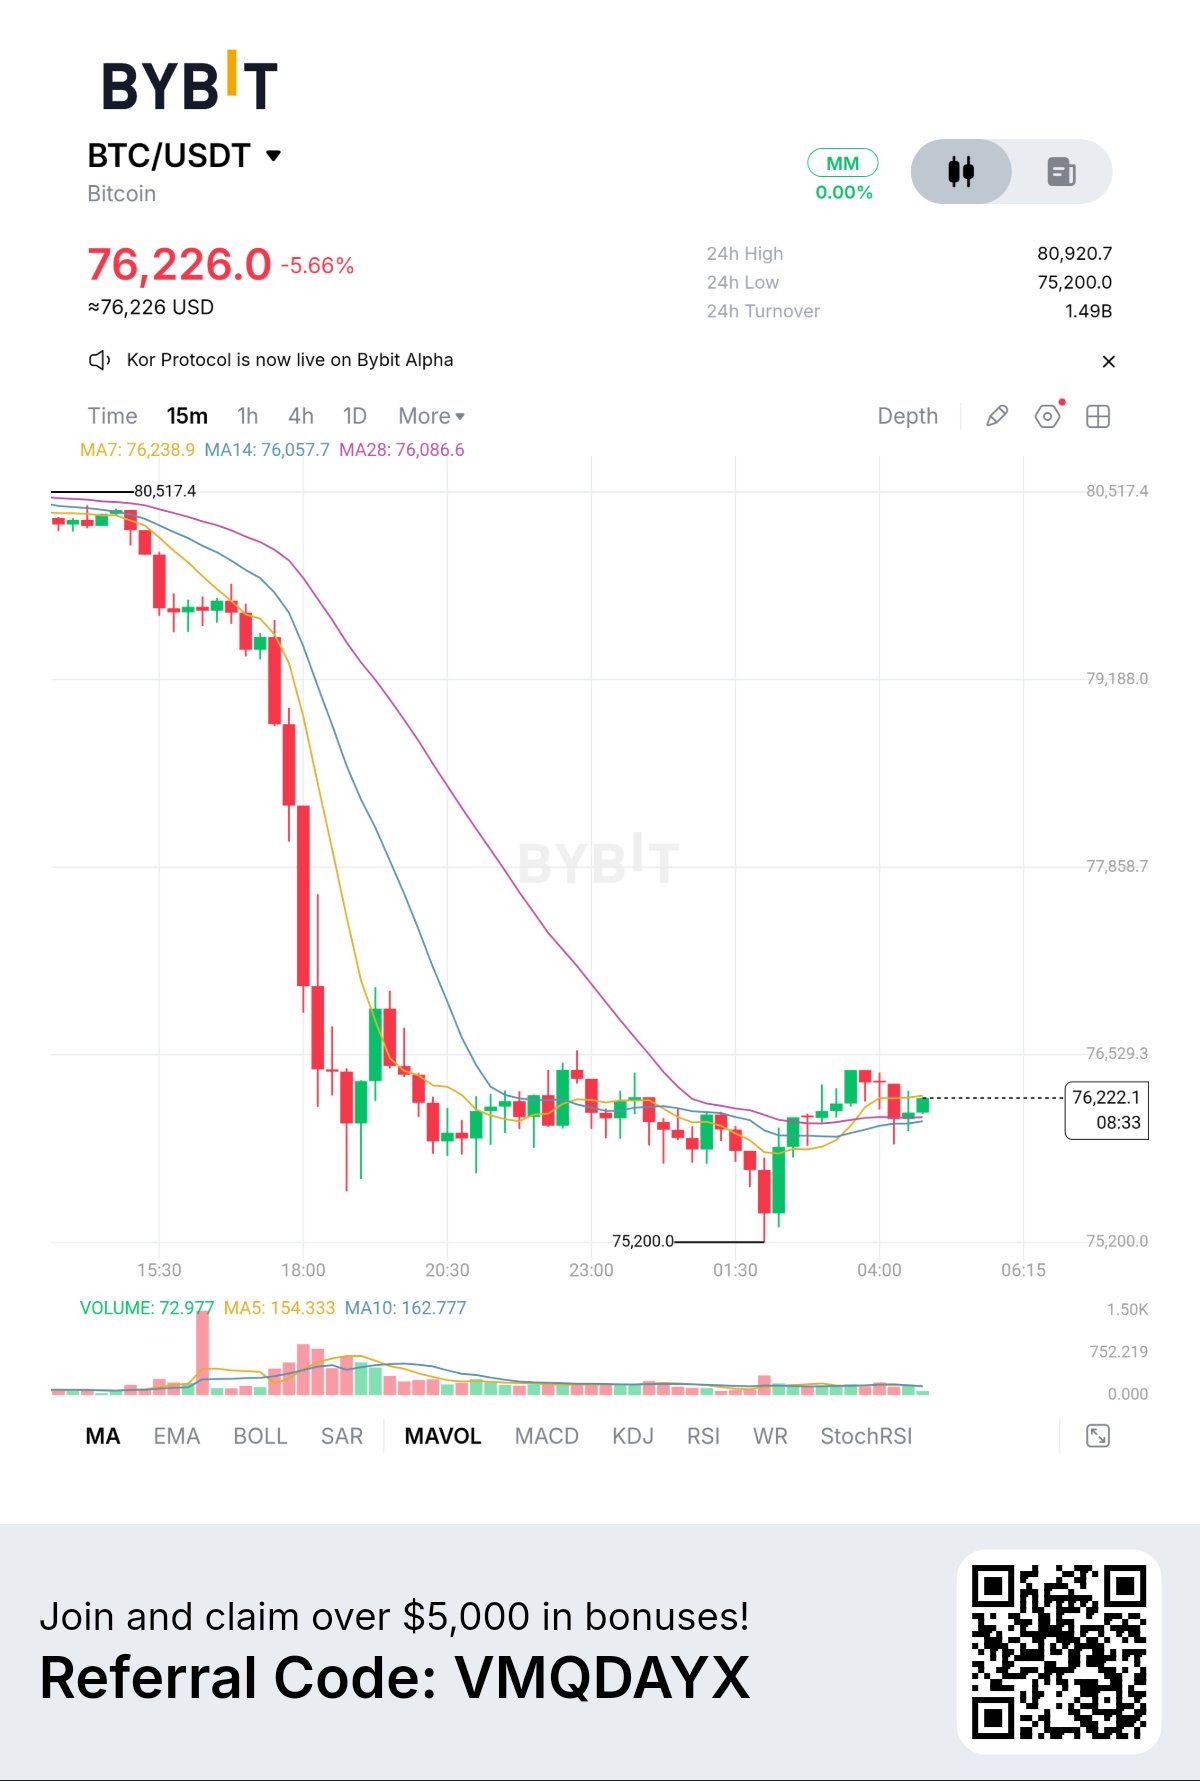
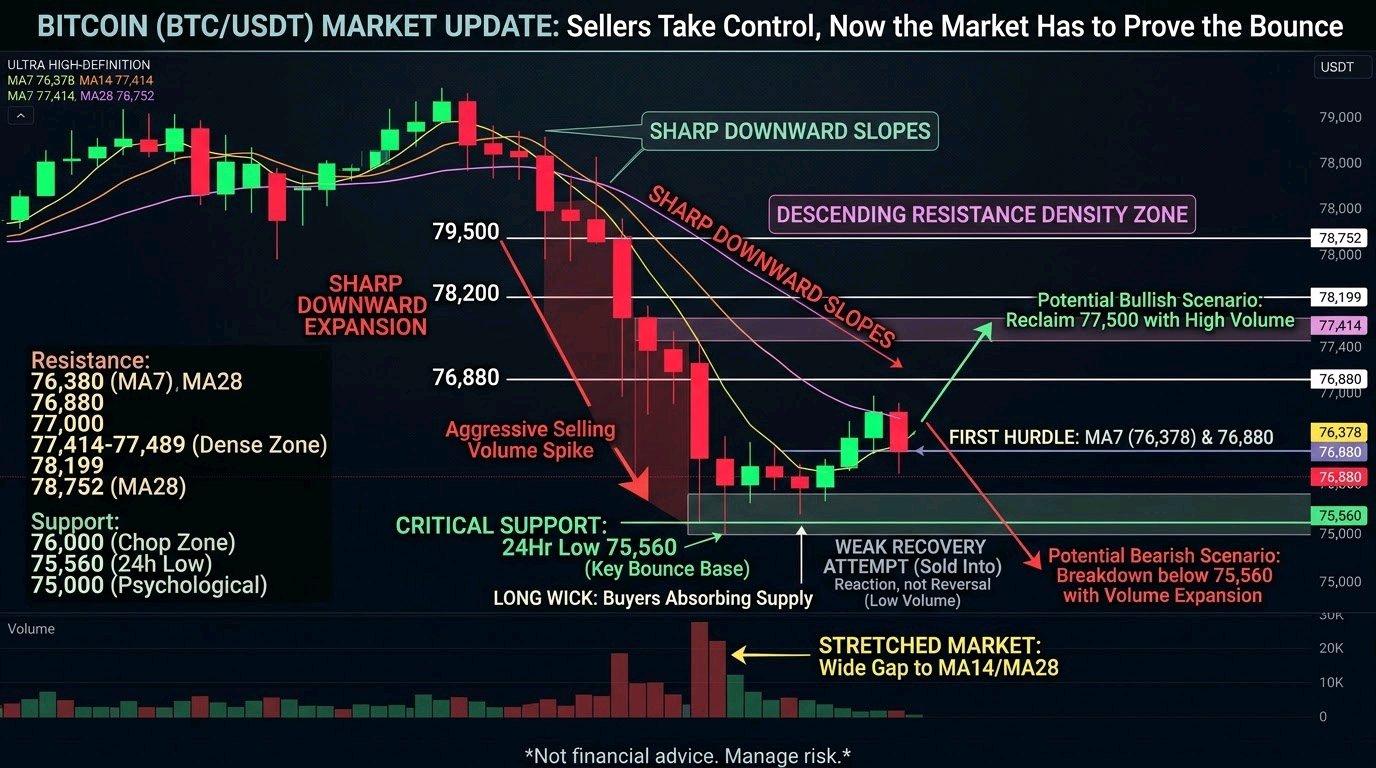
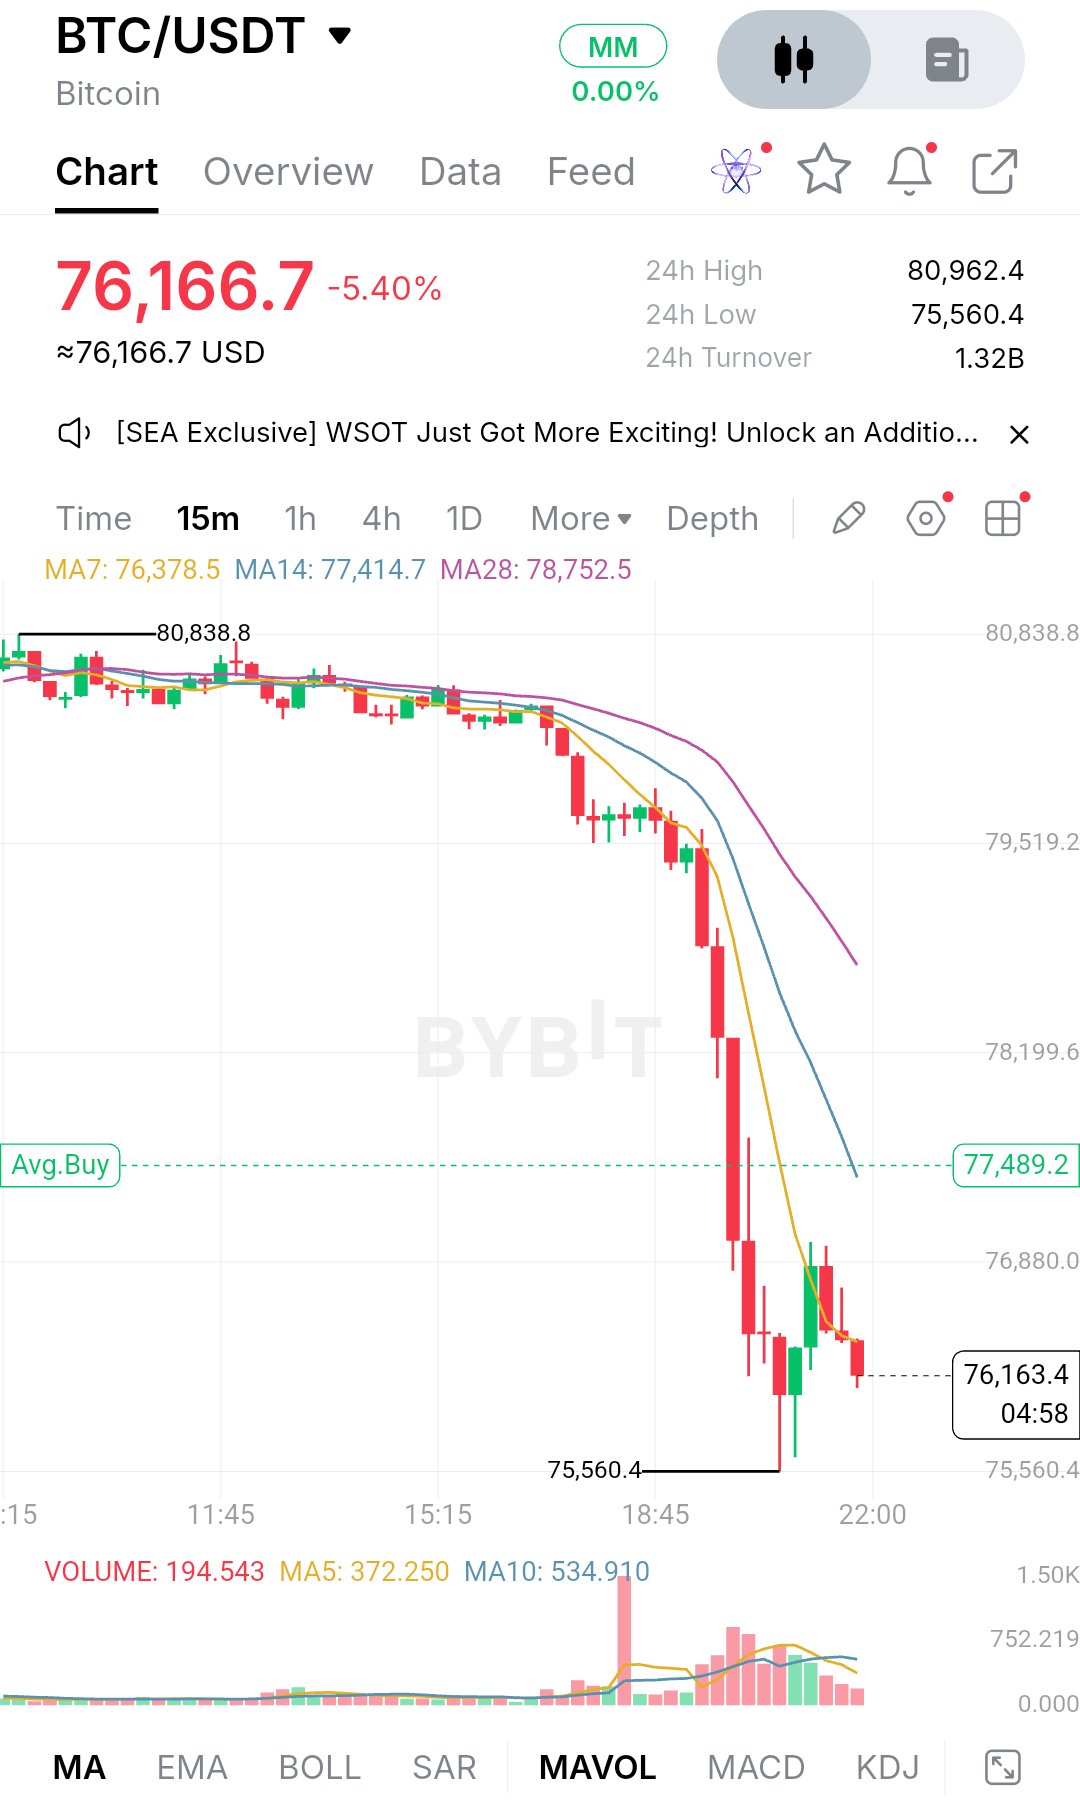
$BTCUSDC: Sellers Took Control, Now the Market Has to Prove the Bounce Bitcoin is trading around 76,166, down about 5.4% on the day. The 24-hour range runs from a high near 80,962 to a low of 75,560, so this was a real repricing, not a slow bleed. Price spent the first part of the session hovering just under 81,000, and sellers kept showing up near the 80,800 area until the market finally gave way. For hours the chart looked like a tired range. Candles were small and overlapping, with no clean direction, and the moving averages were bunched together and flat. That kind of compression rarely lasts. Once price slipped under the cluster of averages, the move accelerated quickly. A sequence of large red candles took BTC through 79,500, 78,200 and 76,880 with very little pause, and the volume spike during the heaviest part of the drop confirms this was forced, aggressive selling rather than a quiet drift lower. After the low at 75,560, buyers did step in. A couple of green candles pushed price back toward the 77,000 region, but the bounce was quickly sold into, and the latest candle is red again. That tells me the recovery is still a reaction, not a reversal. Volume on the bounce is noticeably lower than on the way down, and the current reading sits well below its own short-term average, so there isn't strong conviction from either side right now. Price is stabilizing, but it hasn't built any structure yet. On the indicators I can actually see, the picture is still bearish. The MA7 is at 76,378, the MA14 at 77,414 and the MA28 at 78,752, and all three are stacked in descending order with sharp downward slopes. Price is trading right around the MA7, which is the first line of resistance. Until BTC can close above it and hold, the short-term trend belongs to the sellers. The wide gap between price and the MA14 and MA28 also shows how stretched the drop was, which is why a relief bounce makes sense, but a stretched market can stay stretched. The most important support is the 75,560 low, where the sell-off exhausted itself and the long wick shows buyers absorbing supply. If it holds on a retest, especially with a drop in selling volume, it could become the base of a short-term range. If it breaks, there is no visible support on this chart below it, and the round 75,000 level becomes the next psychological magnet. Between the low and current price, the 76,000 area is the nearest zone where the market is already chopping, so I'd watch how price behaves there first. On the upside, the first hurdle is the MA7 near 76,380, followed by the 76,880 level, which was broken during the fall and now acts as resistance. Above that, 77,000 is the next round-number barrier, and the 77,414 MA14 sits right beside the 77,489 marker, creating a dense resistance zone. Beyond that, 78,199 and the MA28 near 78,752 are the major levels, and a recovery that reaches them would be a meaningful shift in tone. The 79,500 area and then 80,000 are the larger psychological targets, but those are far from current price and would need a sustained change in momentum. For the bullish case, buyers need to reclaim 76,880 and turn it into support, then push through the 77,400 to 77,500 cluster with rising volume. A move like that would flatten the short-term averages and suggest the sell-off has run its course. From there, 78,200 and 78,750 become the realistic next stops. A bounce on thin volume that stalls under the MA14 would not be enough. For the bearish case, the setup is simple. If price rejects around 76,400 to 77,000 and rolls over, the market will likely retest 75,560. A clean break below that low, particularly with an expansion in volume like we saw during the drop, would open the door to 75,000 and a deeper leg lower. Repeated failures at the falling averages would also confirm the bounce was just a pause. **Key Price Levels** - Resistance: 76,380 (MA7), 76,880, 77,000, 77,414 to 77,489 (MA14 area), 78,199, 78,752 (MA28), 79,519, 80,000 - Support: 76,000 (nearby chop zone), 75,560 (24h low), 75,000 (psychological) - Invalidation of the bearish view: sustained hold above 77,500 with strong volume Overall, BTC has moved from a tight, indecisive range into a sharp expansion lower, and the market is now deciding whether that was the start of a trend or an overextended flush. The levels that matter are clear: 75,560 below and the 77,000 to 77,500 zone above. Watch how price reacts at each one, and pay more attention to volume and candle closes than to any single bounce. The next expansion will most likely come out of whichever of those two levels gives way first. This is a chart read for discussion, not financial advice. Always manage your risk. $ETHUSDC #BlockchainSecurity

Buy/Rebound Speculative (Long) SOL
Pair: SOL/USDT Trade Type: Long Buy/Bounce Current Price: $91.24 Suggested Entry Zone: Around the current price or upon testing support near $89.50-$90.00 Momentum Indicators: RSI(6) at 33.51 (approaching oversold territory), MACD showing slowing downward momentum with an attempt at a bullish crossover. Targets (Take Profit): Target 1: $93.00 Target 2: $95.00 Stop Loss: Close below $88.50 $SOLUSDT $NEARUSDT #WSOTPicktoEarn10U #BlockchainSecurity #BybitAIEvolving
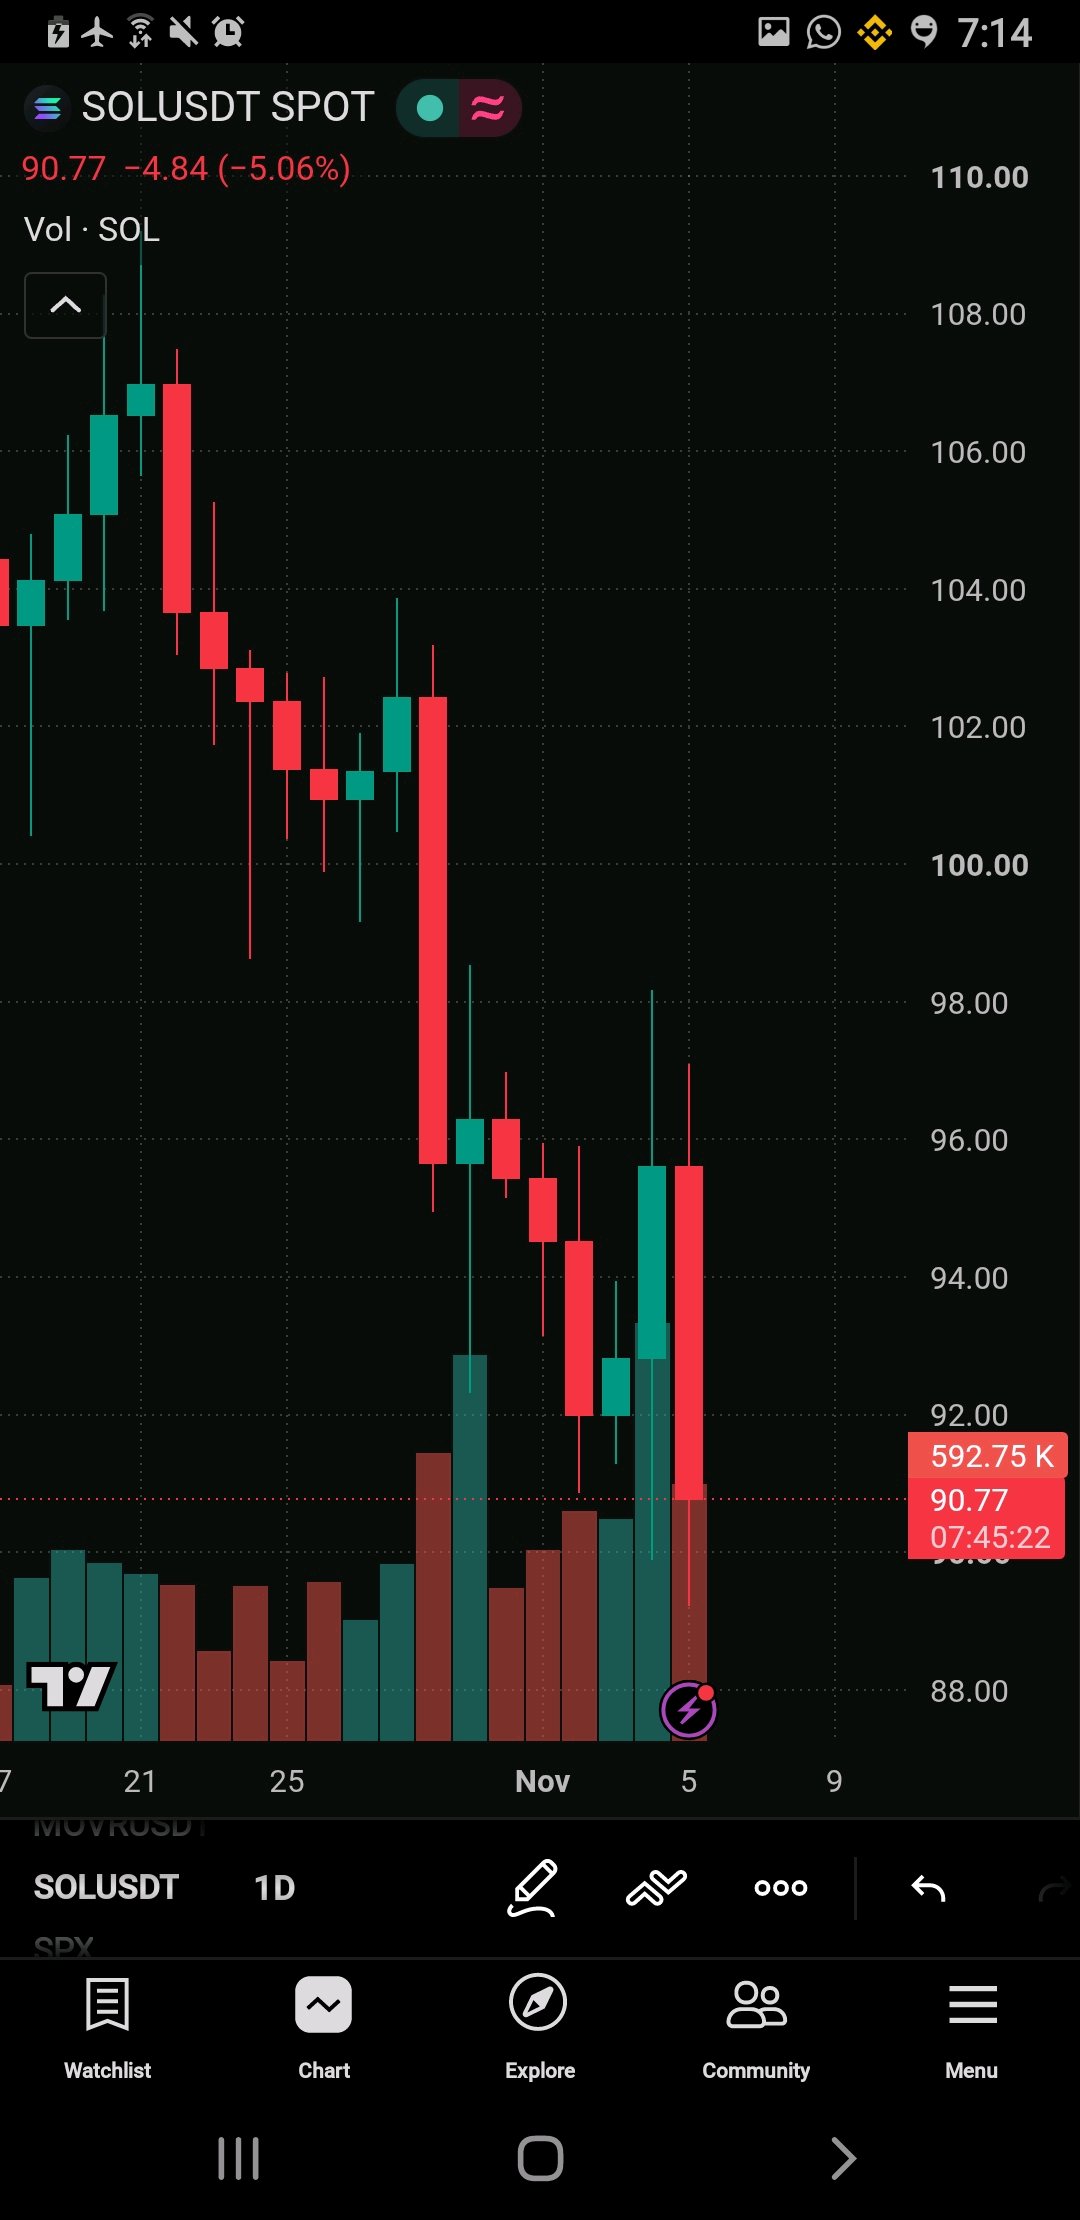

$FOGOUSDT FOGO/USDT – Market Structure Analysis | 1H Current Price: $0.002516 FOGO is trading around $0.002516 after rebounding approximately 15.25% from its recent chart low of $0.002183. While the latest price action shows a meaningful short-term bounce, I am not treating this move as a confirmed recovery yet. The broader structure remains under pressure. FOGO has experienced a prolonged sequence of lower highs and lower lows, and the recent upside move still needs confirmation through sustained spot demand. The key concern is whether buyers can absorb overhead selling pressure or whether this bounce becomes another opportunity for sellers to distribute. # 1\. Price Action & Market Structure * Current Price: $0.002516 * 24H Change: +10.64% * 24H High: $0.002865 * 24H Low: $0.002226 * Recent Chart Low: $0.002183 * Previous Major High: $0.003151 FOGO has recovered from the $0.002183 area, but the broader descending structure has not yet been invalidated. Immediate Resistance: * $0.002667 * $0.002865 * $0.002909 Support Zones: * $0.002425 * $0.002226 * $0.002183 A sustained reclaim above $0.002667 would improve the short-term structure. However, the $0.002865–$0.002909 region remains an important supply area. # 2\. Institutional / Large Capital Picture The chart shows a sharp downside trend followed by an aggressive rebound with elevated price volatility. However, there is no verified institutional flow, exchange wallet movement, or large-holder accumulation data available in the screenshot. The important distinction is that a sharp price rebound does not automatically establish meaningful capital inflows. I would want to see sustained spot buying volume and continued acceptance above reclaimed resistance before interpreting this move as genuine demand. ## 3\. Liquidity & Range Conditions FOGO previously declined from approximately $0.003151 toward $0.002183 before attempting its current rebound. The latest candles show aggressive volatility, including long upper and lower wicks. This suggests considerable short-term price uncertainty. The $0.002425–$0.002667 region is particularly important. A narrow consolidation after a significant decline is not sufficient evidence of accumulation. Stronger spot participation is necessary to establish whether buyers can defend the newly formed support. # 4\. Derivatives Positioning – Critical Risk The provided chart does not display open interest, funding rates, or long/short positioning. Therefore, precise derivatives figures cannot be established responsibly. * Open Interest: Not available. * Funding Rate: Not available. * Long/Short Ratio: Not available. * Long Position Percentage: Not available. This matters because excessive positive funding and crowded long positioning could make the current bounce vulnerable to a downside liquidity sweep. If leverage increases aggressively while spot demand remains weak, a breakdown below support could trigger fresh long liquidations. ## 5\. Key Figures | Metric | Price / Data | | -------------------- | ------------- | | Current Price | $0.002516 | | 24H Change | +10.64% | | Immediate Resistance | $0.002667 | | Major Resistance | $0.002865 | | Upper Resistance | $0.002909 | | First Support | $0.002425 | | Major Support | $0.002226 | | Recent Low | $0.002183 | | Previous High | $0.003151 | | Open Interest | Not available | | Funding Rate | Not available | | Long Percentage | Not available | # 6\. Confirmation Levels Bullish Confirmation: A sustained reclaim above $0.002667 would be the first meaningful improvement in short-term structure. A successful move through $0.002865 could open the way toward $0.002909 and potentially $0.003151. However, resistance breaks need volume confirmation rather than isolated upward wicks. Bearish Confirmation: A breakdown below $0.002425 would weaken the current rebound structure. Further acceptance below $0.002226 would expose the recent low at $0.002183. Losing that level would increase the probability of another downside liquidity sweep. ### 7\. Final Market Outlook FOGO is showing temporary strength, but the broader market structure has n ot yet confirmed a sustainable reversal. The recent +10.64% daily move deserves attention, but aggressive volatility and overhead resistance make chasing the bounce a risky proposition. My focus remains on two things: whether spot buyers can sustain demand above $0.002667 and whether leverage remains controlled during the consolidation. The decisive signal is not another green candle. It is sustained spot buying, a confirmed resistance reclaim, and controlled derivatives positioning. Otherwise, another support breakdown could turn this bounce into a fresh liquidity event. #BlockchainSecurity #BybitAIEvolving #ByXIMPACT
enormous recovery potential
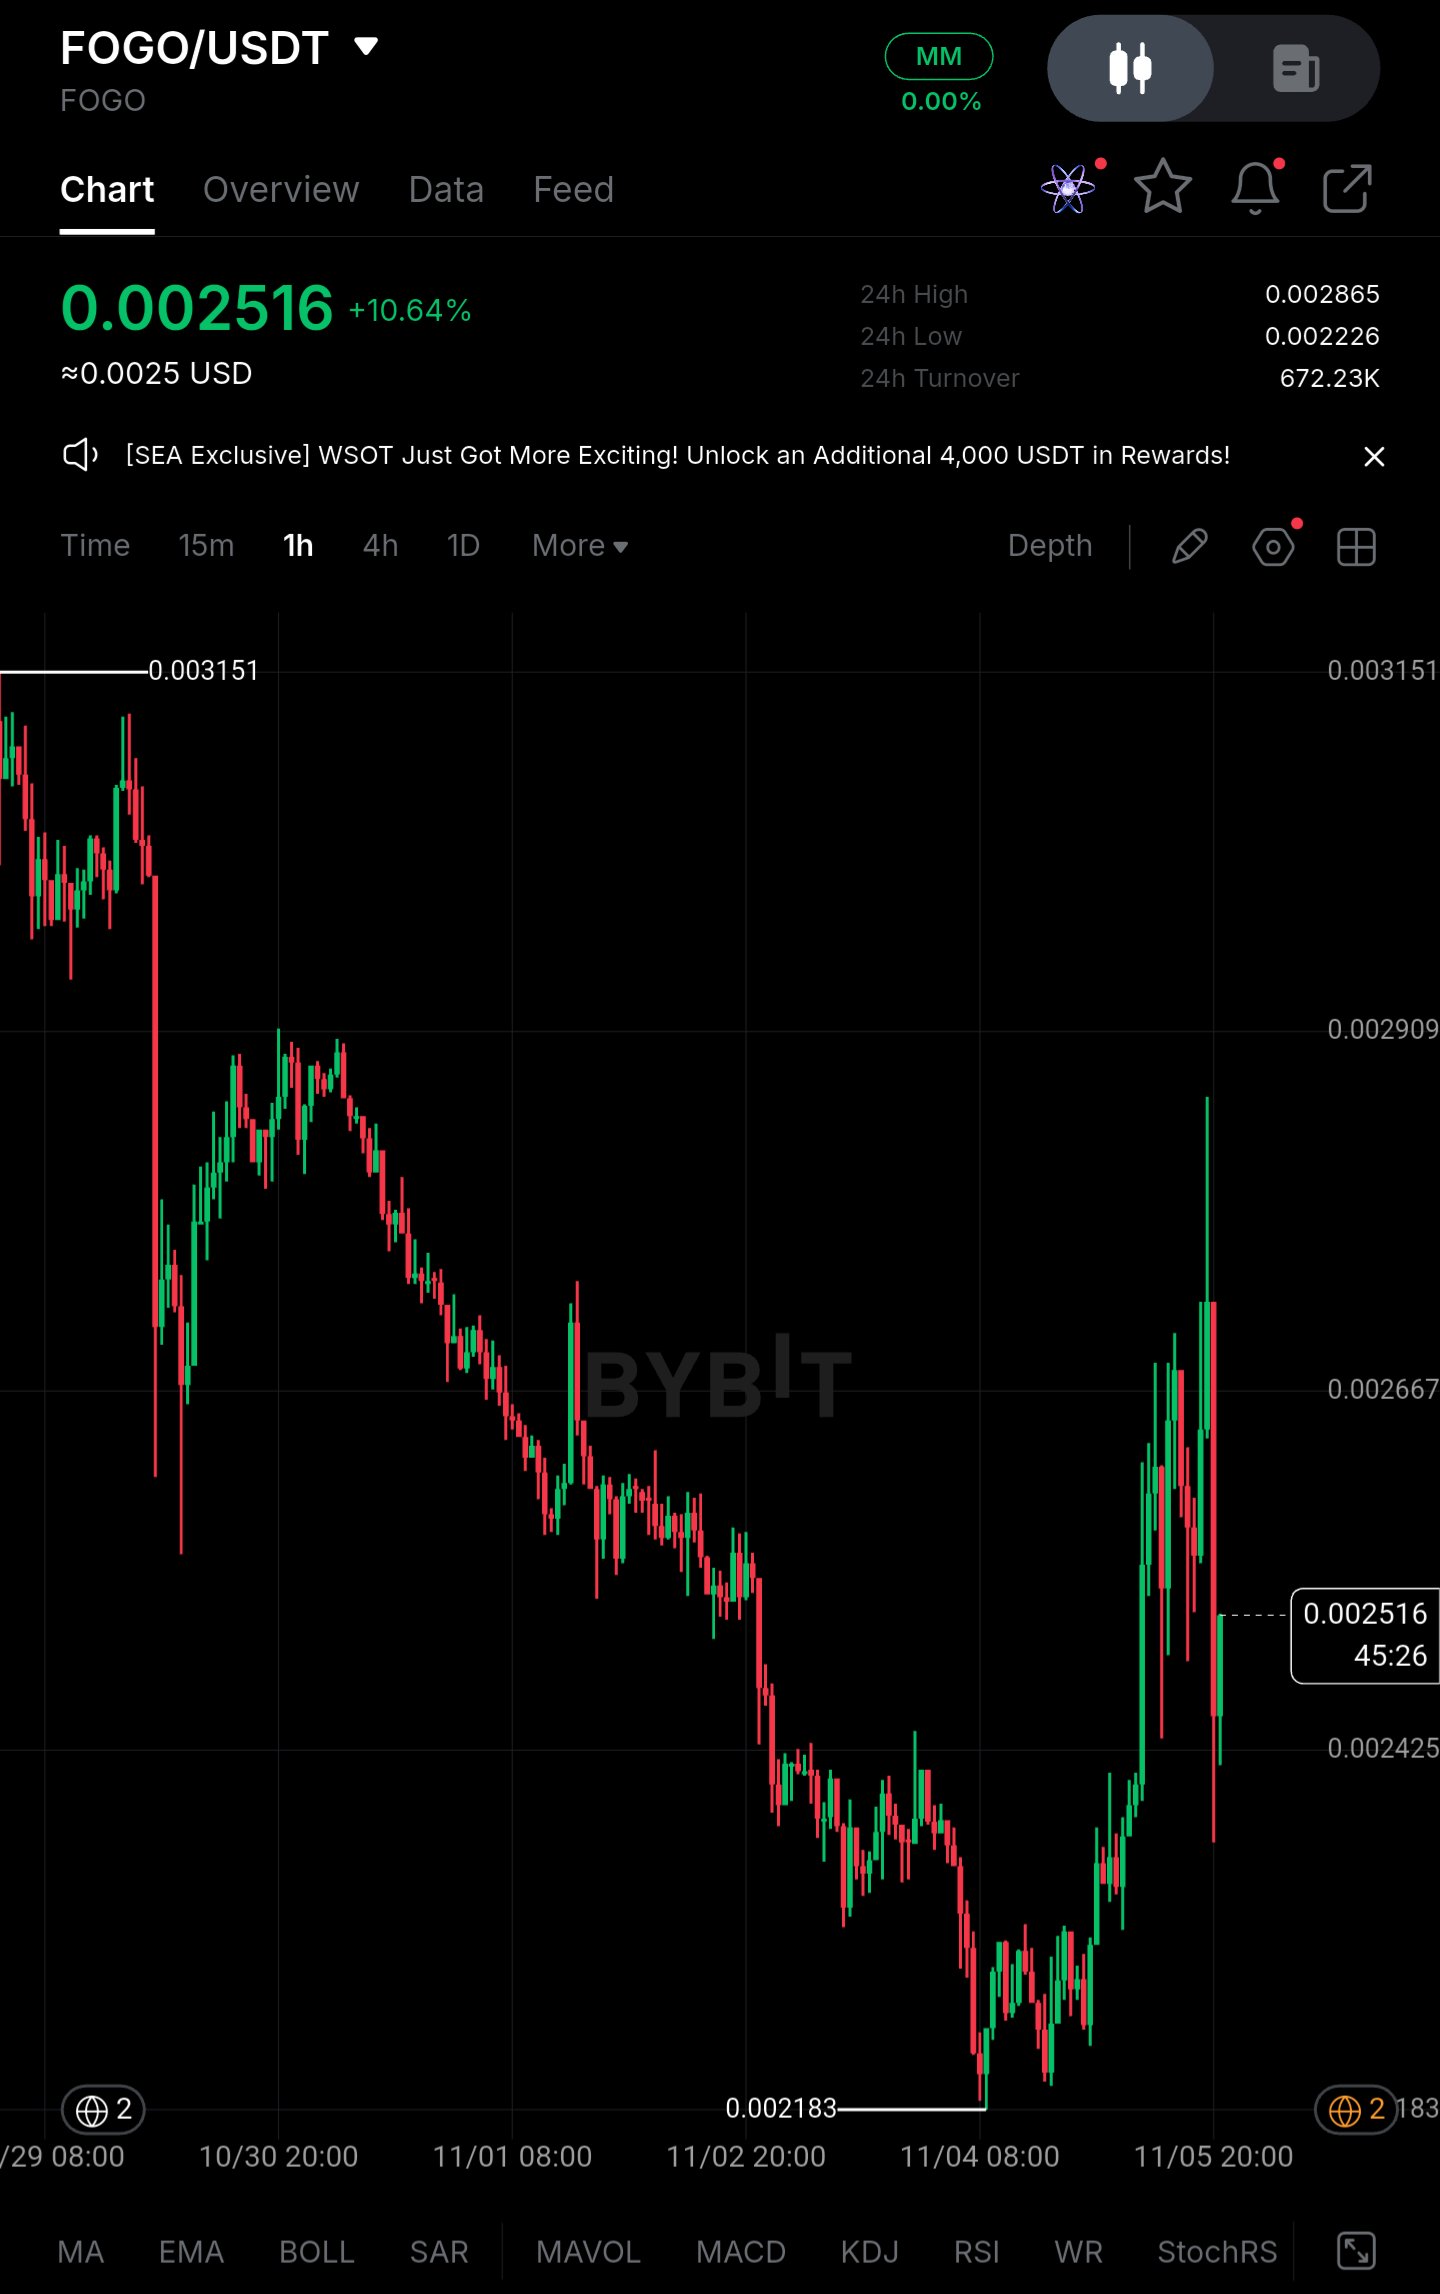
🚀 RENDER Coin (RENDER) - Huge Recovery Potential! Will We Reach $16? 🔥 💰 Current Price: $1.614 (+0.62%) 📊 Technical Analysis: RENDER is showing consolidation near a key support zone between $1.20 and $1.60 after a prolonged downtrend. The weekly chart shows a descending trendline of resistance, while buyers attempt to establish a solid base for a move. 🎯 Potential Targets: Target 1 (TP1): $3 Target 2 (TP2): $6 Target 3 (TP3): $10 Main Target: $16 ⚠️ Key Levels to Watch: A confirmed break above $6 could significantly boost the bullish momentum. A break below support could weaken the outlook. (Reminder: This is a technical forecast for speculation and not a guaranteed target.) 👀 Do you think RENDER can make a strong comeback? $PENDLEUSDT $BTCUSDT #WSOTPicktoEarn10U #BybitAIEvolving #BlockchainSecurity
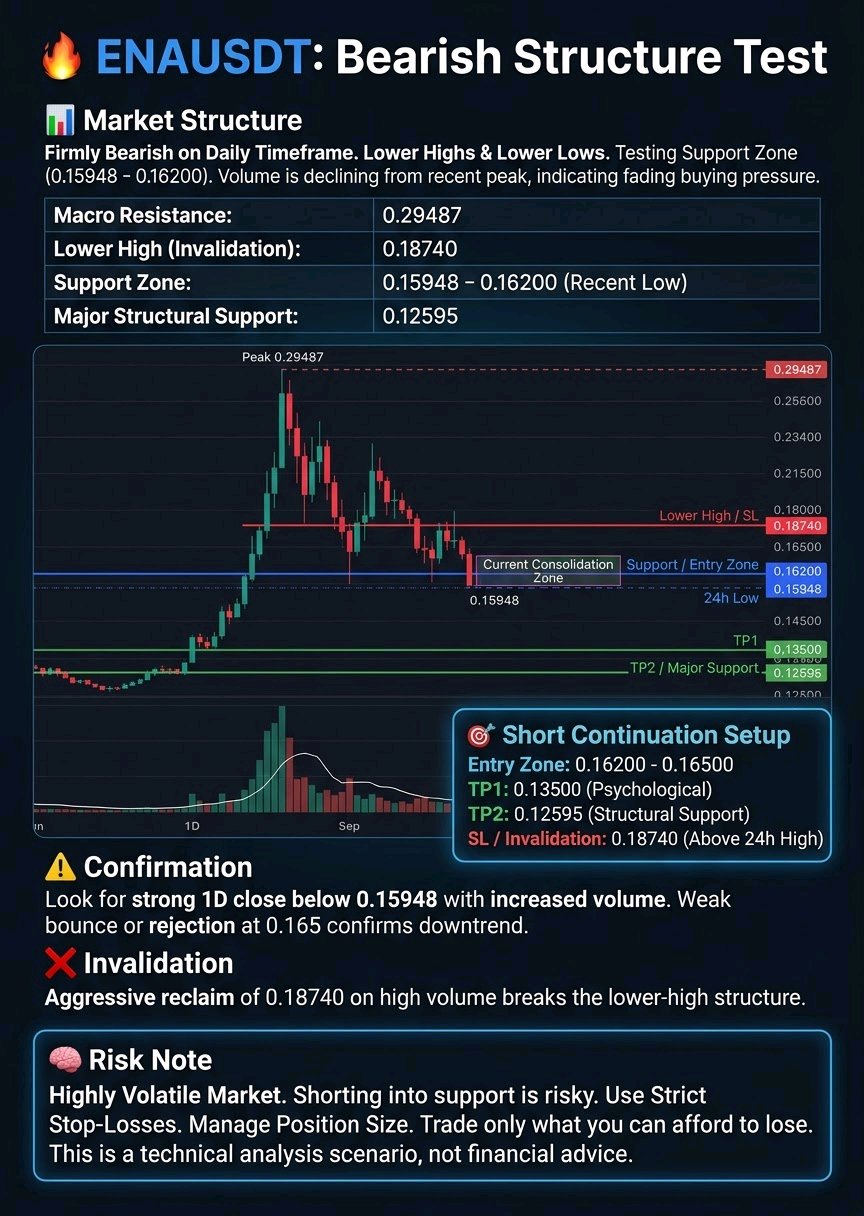
🔥 ENAUSDT: Bearish Structure Test
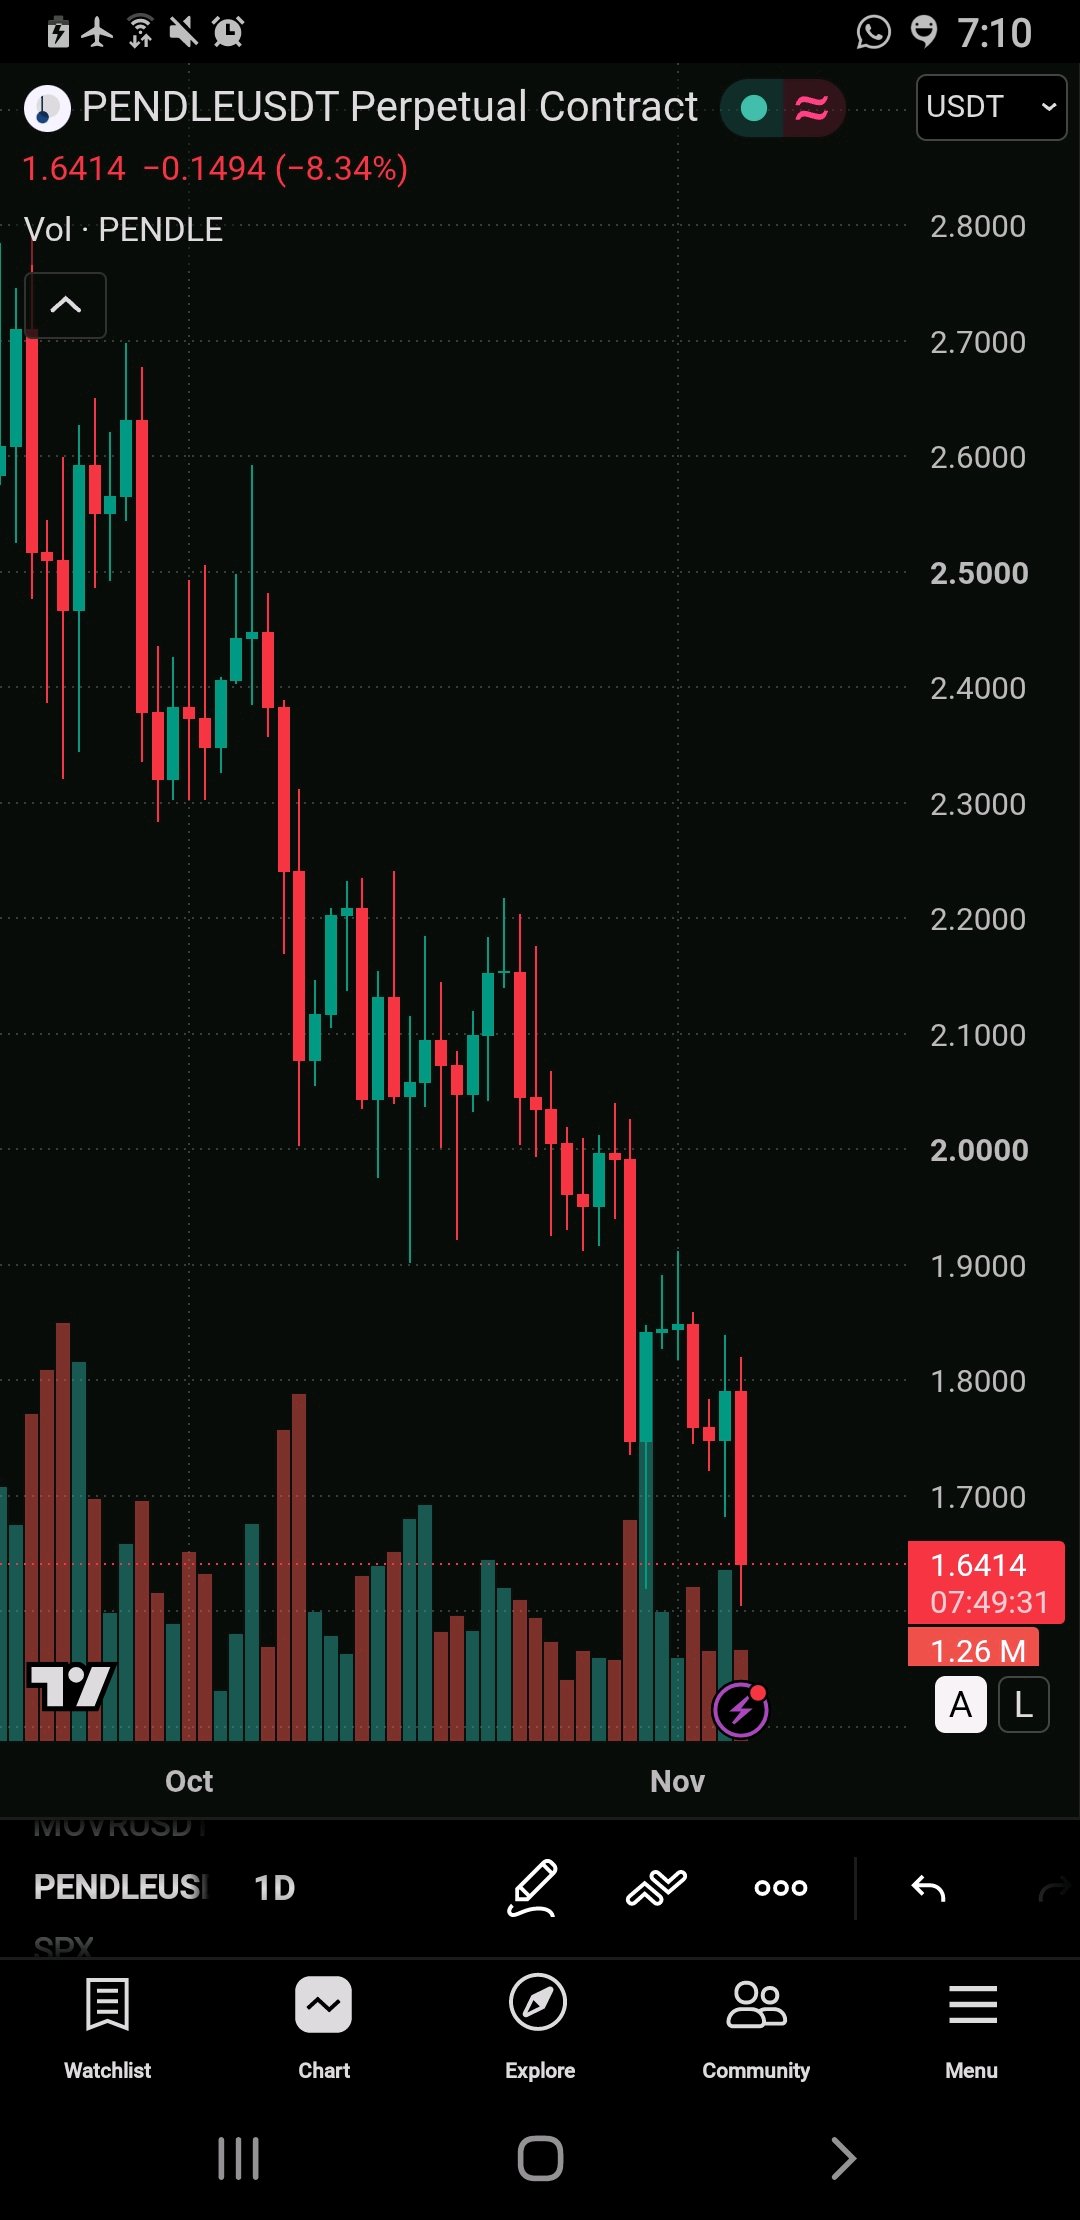
$ENAUSDT The daily chart for ENAUSDT shows a parabolic run followed by a steep corrective phase. After peaking near 0.29487, the asset is forming lower highs and lower lows. 📊 Market Structure: The visible trend on the 1D timeframe is firmly bearish. We are currently testing support around the 0.15948 - 0.16200 zone, which represents a recent 24h low and a potential temporary floor. Volume has notably declined from the massive spike seen during the peak, indicating fading buying pressure. The next major structural support below current levels is visible down at the 0.12595 area. On the upside, immediate resistance is found at the recent lower high around 0.18740, with the macro resistance remaining at 0.29487. 🎯 Potential Setup (Short Continuation): Note: This is a scenario based on the current visible downtrend, not a financial signal. Entry: 0.16200 - 0.16500 (Current consolidation zone) TP1: 0.13500 (Psychological and intermediate visible level) TP2: 0.12595 (Major visible structural support) SL / Invalidation: 0.18740 (Above the 24h high and recent lower high) ⚠️ Confirmation: For this bearish scenario to play out, we would want to see a strong 1D candle close below the 0.15948 support level, accompanied by an increase in downward volume. A weak bounce or rejection at the 0.165 area would further validate the downtrend. ❌ Invalidation: If the price aggressively reclaims the 0.18740 level on high volume, it would break the current market structure of lower highs and indicate a potential trend reversal or deeper retracement upward. 🧠 Risk Note: The crypto market is highly volatile, and shorting into strong support can be risky. Always use strict stop-losses, manage your position size according to your risk tolerance, and never trade more than you can afford to lose. #IMPACTbyTrade $BTCUSDT #BlockchainSecurity #BybitAIEvolving
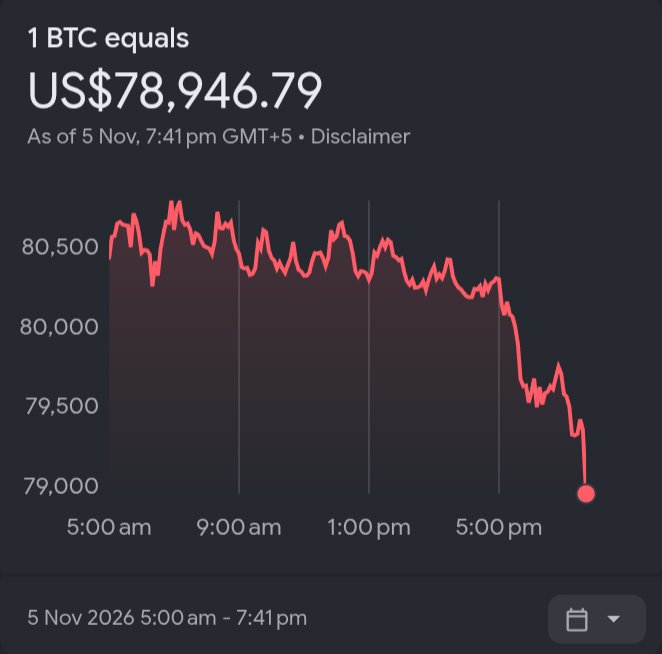
BTC latest update
$BTCUSDT BITCOIN (BTC) LATEST MARKET ANALYSIS – NOVEMBER 5, 2026 Bitcoin is showing signs of recovery after bouncing back above the $80,000 psychological level. The short-term technical outlook is bullish, but BTC needs a confirmed breakout to continue its upward momentum. 📊 KEY MARKET LEVELS 🟢 Current reference price: $80,400 🟢 Support 1: $79,746 🟢 Support 2: $77,820 🔴 Resistance 1: $81,128 🔴 Resistance 2: $82,218 🔴 Major resistance: $83,582 📈 TECHNICAL ANALYSIS • Daily RSI: 50.2 (neutral momentum) • 4H trend: Bullish bias • Daily trend: Bullish bias • Weekly trend: Bullish bias BULLISH SCENARIO 🚀 If BTC breaks and holds above $81,128, the next targets could be $82,218 and $83,582. BEARISH SCENARIO ⚠️ If BTC loses $79,746, selling pressure could increase toward $77,820 and potentially $75,253. 🎯 MY MARKET VIEW Bitcoin is showing recovery potential, but confirmation above resistance is important. Avoid chasing breakouts without volume confirmation. What do you think? 🚀 BTC to $85K or correction toward $77K? #BybitAIEvolving #BlockchainSecurity #AnthropicIPOTestsTheAIBoom #MidtermsMarketWatch #Bitcoin #BTC #CryptoAnalysis #BinanceSquare #BitcoinTrading #CryptoMarket
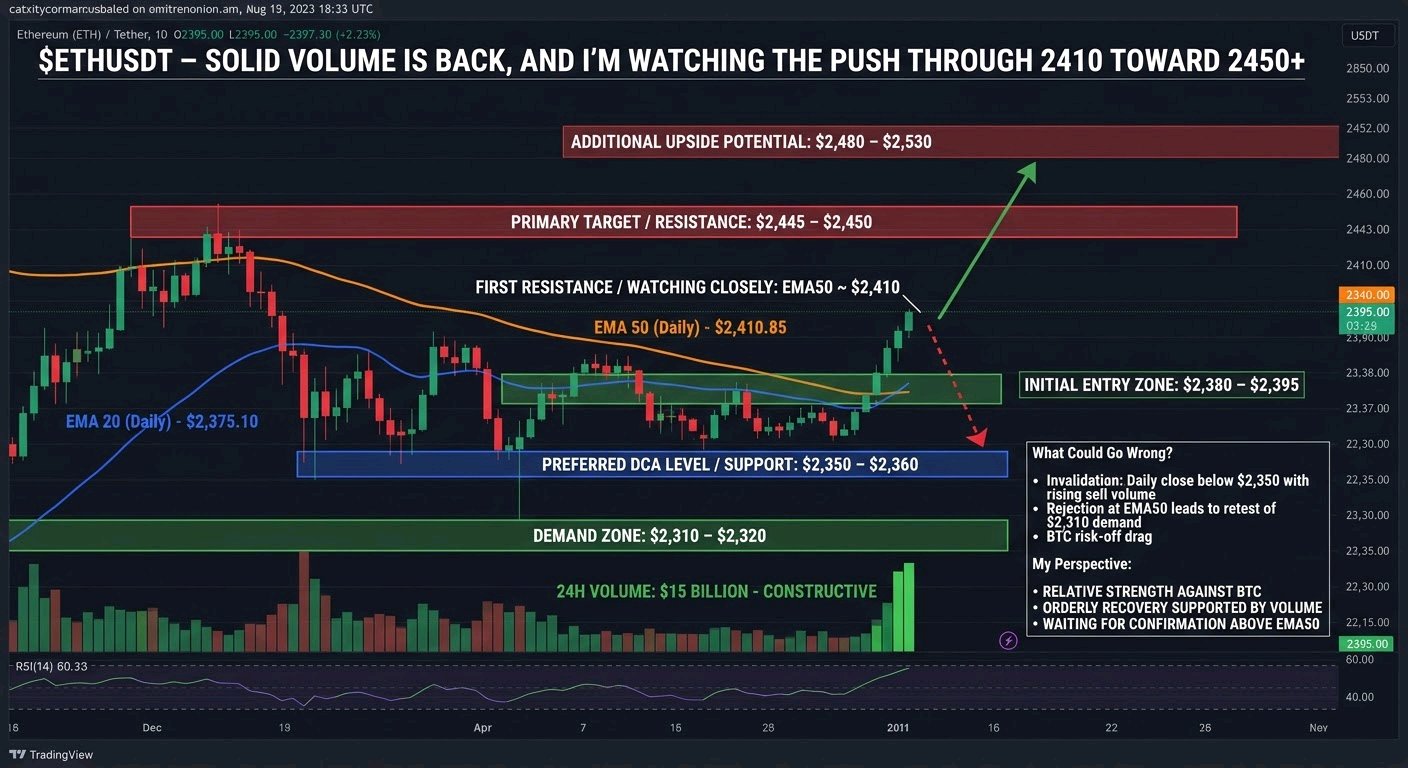
$ETHUSDT USDT – SOLID VOLUME IS BACK, AND I’M WATCHING THE PUSH THROUGH 2410 TOWARD 2450+** Ethereum is showing clear relative strength today. While Bitcoin sits around the $79.6k–$80k area with a more modest gain, ETH is up roughly 3% on the day and trading near $2,387–$2,395. The broader market is in risk-on mode, but ETH is leading the move among the large caps. I’m watching the daily and 4H structure closely here. Price is currently working just below the daily EMA50 near $2,410–$2,411. It has already reclaimed the EMA20 zone and is holding above the mid-$2,300s support band that has been tested multiple times. The 24h range ran from roughly $2,310–$2,450, so we’re sitting in the upper half of that range after a decent recovery. ### Volume Analysis 24h trading volume is sitting around $15 billion. That’s healthy participation for ETH and supports the upside move rather than a thin, low-conviction bounce. When volume expands on green days like this and price holds above the recent demand zone, it usually means larger players are still interested in the continuation rather than just short-covering. I’m treating the volume as constructive for the near-term bullish case. ### My Trading Plan I’m approaching this as a potential continuation setup with defined levels: - **Initial Entry Zone**: $2,380–$2,395 I’m willing to start building here while price is still below the EMA50 but holding the recent recovery structure. - **Preferred DCA Level**: $2,350–$2,360 This is the lower edge of the daily consolidation zone that has seen multiple touches. A controlled pullback into this area would improve the average without breaking the structure. - **First Resistance**: $2,410–$2,415 The daily EMA50. A clean close and hold above this level would be the first real confirmation that buyers are in control again. - **Primary Target**: $2,445–$2,450 The recent 24h high and a clear horizontal level. This is where I expect the first real supply to show up. - **Additional Upside Potential**: $2,480–$2,530 If momentum continues and volume stays elevated after clearing 2450, this zone becomes realistic on a measured move. I’m looking for price to hold above $2,370–$2,380 on any intraday dips and preferably close the day above the EMA50 to keep the setup clean. ### What Could Go Wrong? A sharp rejection at the EMA50 followed by a break back below $2,360 would weaken the short-term bullish case and open the door for a deeper retest of the $2,310–$2,320 demand area. If that level fails with expanding volume, the next structural support sits lower in the $2,250–$2,300 zone. I’m also watching BTC closely — any sudden risk-off move in Bitcoin could drag ETH lower regardless of its relative strength. The setup loses appeal if we lose the $2,350 area on a daily close with rising sell volume. ### My Perspective ETH is interesting right now because it’s showing relative strength against BTC while volume remains solid and the daily structure is attempting to repair itself. We’re not in a clean breakout yet — price still needs to clear and hold the EMA50 — but the recovery from the $2,310 low has been orderly and supported by participation. I’m leaning toward continuation over the next few sessions if buyers can defend the current zone and push through 2410 with volume. A rejection and slide back under 2350 would flip me more cautious and force a wait for better structure. For now, I’m watching the EMA50 reaction and volume closely. This is a constructive area, but it still needs confirmation. #BlockchainSecurity #WSOT2026 #MidtermsMarketWatch
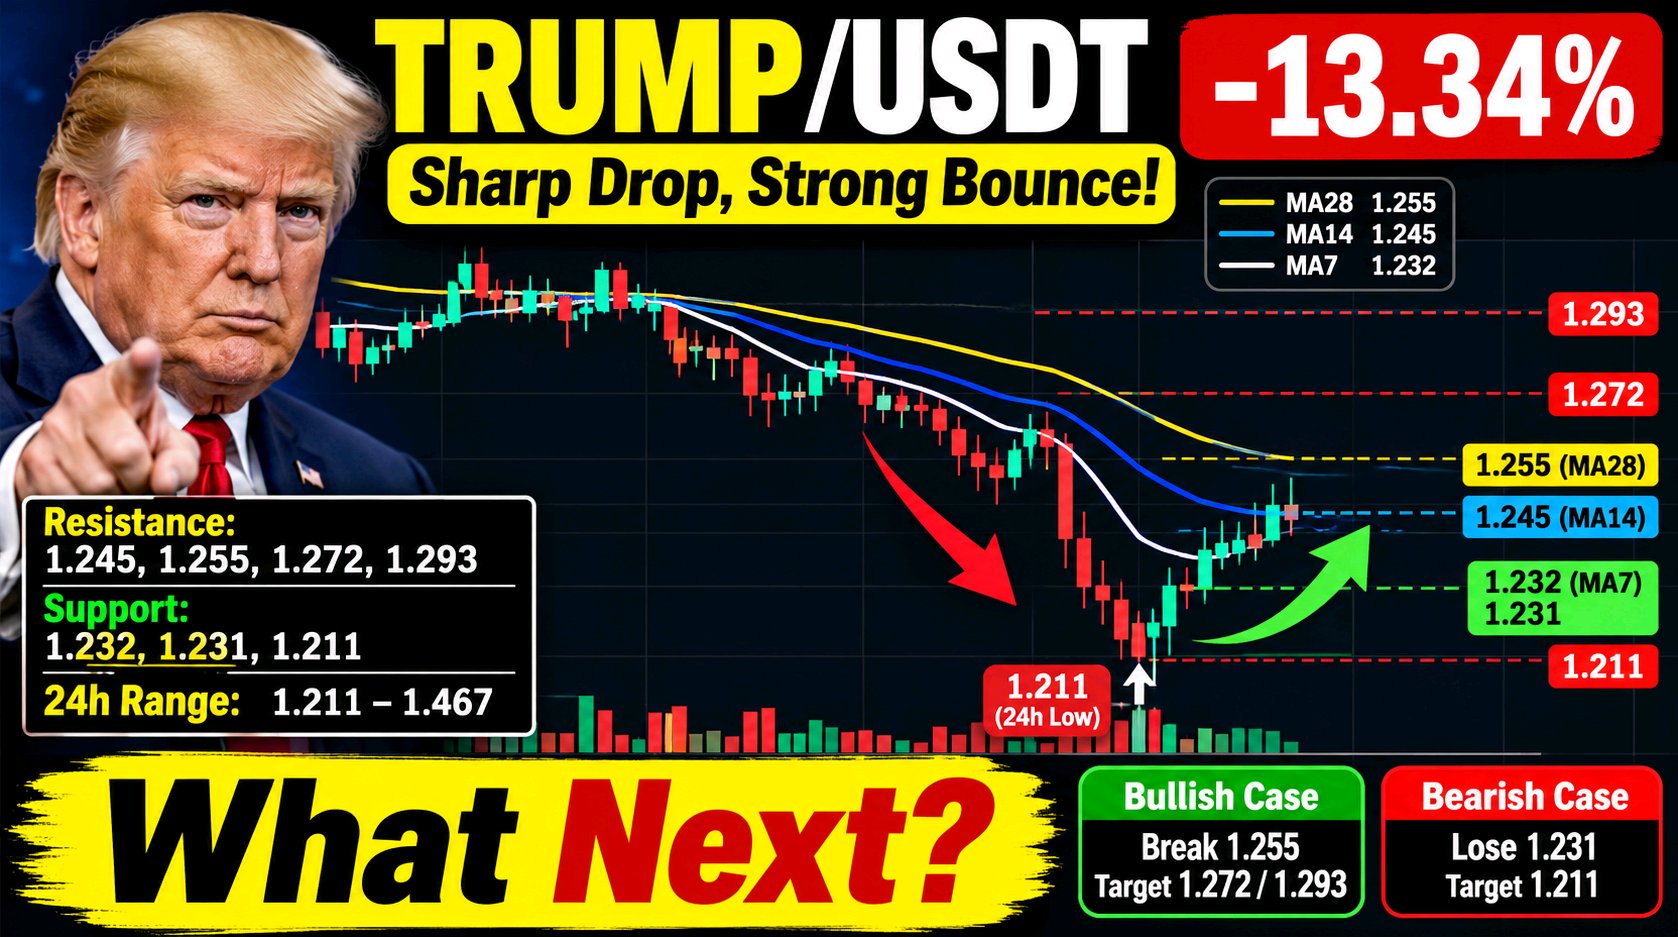
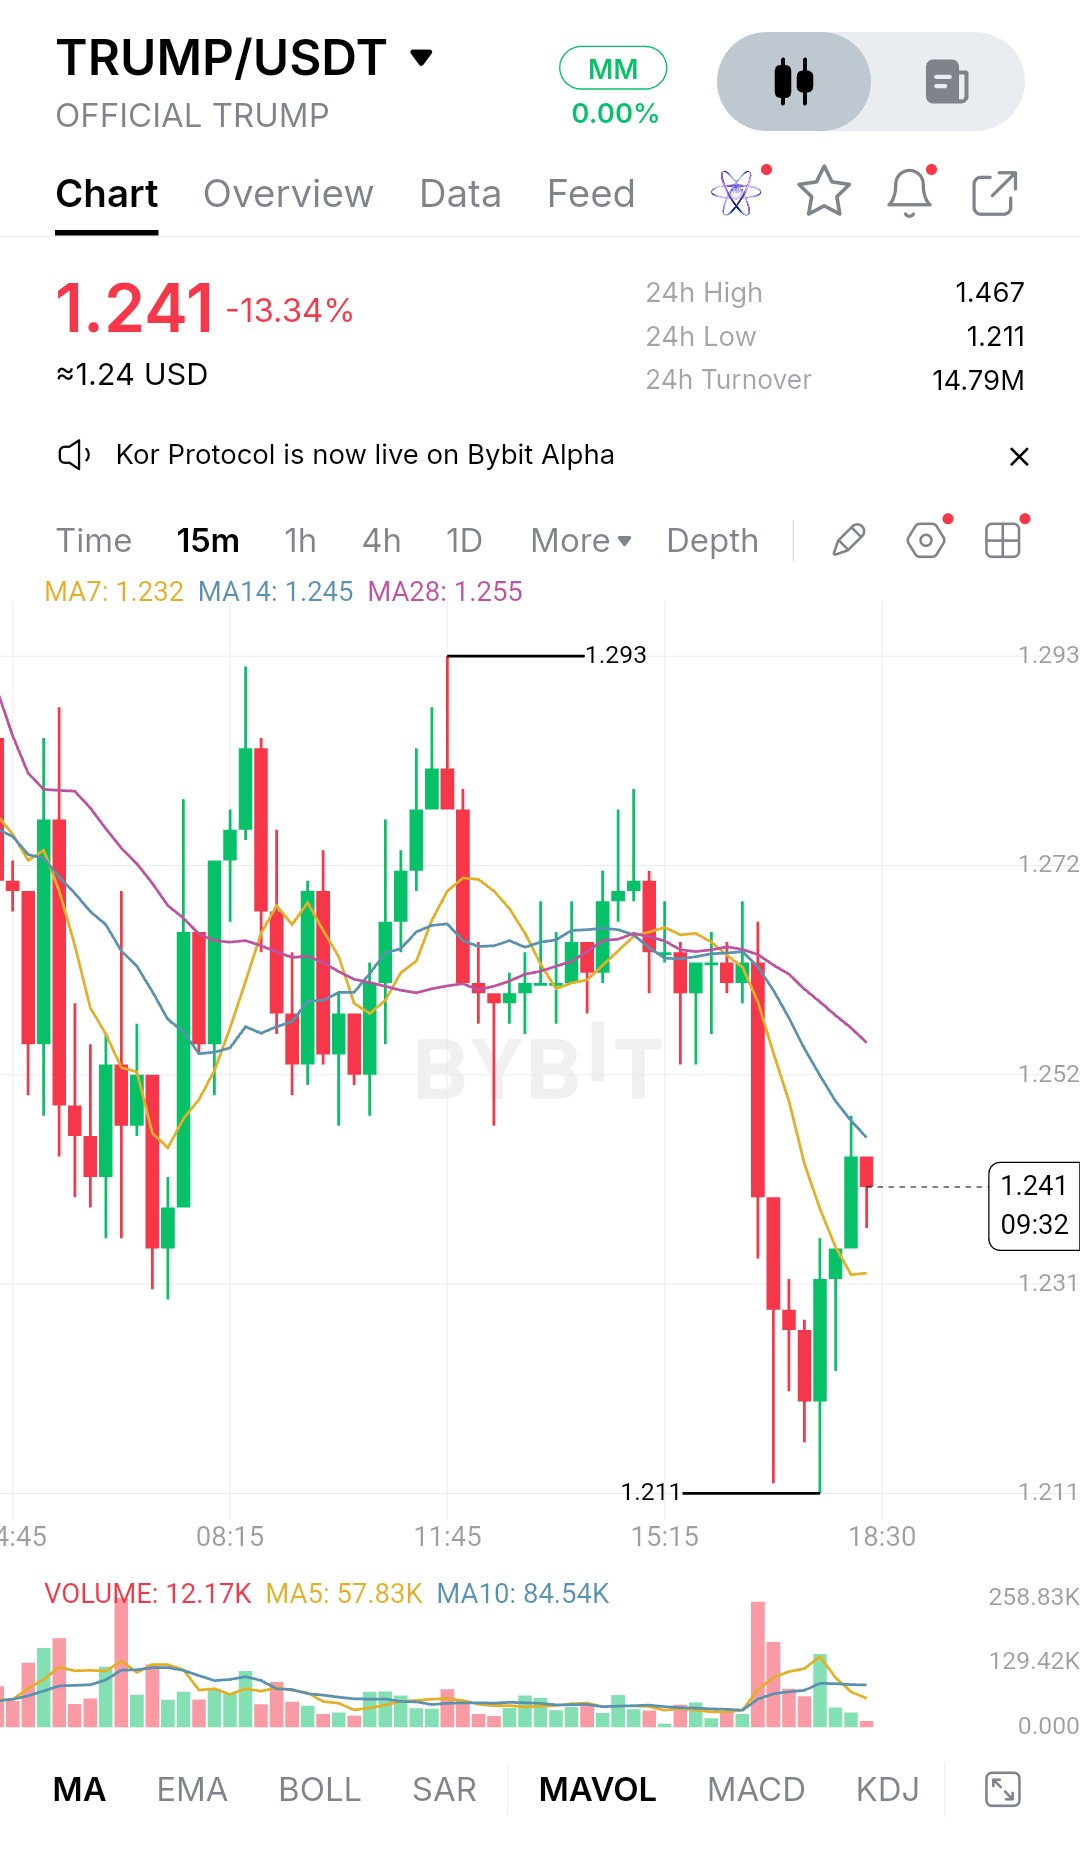
$TRUMPUSDT is trading at 1.241, down 13.34% over the last 24 hours, with a 24h high of 1.467 and a low of 1.211. Turnover sits at 14.79M. That 1.467 high is a long way above current price, which tells you sellers have controlled the broader session. On the 15-minute chart, the most recent damage came in one sharp leg lower. After hovering around the 1.25 to 1.27 area through the middle of the session, price dropped hard on a large red candle backed by one of the heaviest volume bars on the screen. That flush pushed it all the way to 1.211 before buyers stepped in. What happened after the low is the interesting part. The 1.211 candle left a long lower wick, and the next few candles were strong green bodies that pulled price back above 1.23. That looks like a reaction bounce from sellers who got exhausted, not a confirmed reversal. The latest candle is red with a small upper wick, so the recovery is already meeting some hesitation. Structurally, price has gone from a choppy range between roughly 1.25 and 1.29 to a breakdown and a V-shaped bounce. It is trying to stabilize, but nothing has been reclaimed yet. On the indicators actually visible, MA7 sits at 1.232, MA14 at 1.245 and MA28 at 1.255. Price is above the MA7 but still below the MA14 and MA28, and both of those are sloping down. That is a recovering structure inside a short-term downtrend. Volume backs this up: the current bar reads 12.17K against a MA5 of 57.83K and a MA10 of 84.54K, so the bounce is happening on fading participation. A recovery on thin volume can drift, but it needs a volume pickup to be trusted. Support starts at the 1.231 to 1.232 area, where the MA7 and the first pullback zone sit. Below that, 1.211 is the key level, since it is both the 15-minute low and the 24-hour low. A retest that holds there would make it a clean double-bottom type base. A break below it would open price discovery to the downside with no recent structure to lean on. Immediate resistance is the MA14 near 1.245, just above current price. Beyond that, the MA28 near 1.255 lines up with the 1.252 to 1.255 zone that acted as support before the breakdown and may now flip to resistance. Higher up, 1.272 and the 1.293 swing high are the next meaningful ceilings, with 1.30 as a psychological round number. For the bullish case, buyers need to hold above the MA7, push through 1.245, and then close a candle above the MA28 near 1.255, ideally with rising volume. That would turn the short-term averages flat and put 1.272 and then 1.293 in play. For the bearish case, rejection at the MA14 or MA28 followed by a loss of 1.231 would suggest the bounce was just a relief move. That would put 1.211 under pressure again, and a second test of a level usually holds worse than the first. Key price levels: - Resistance: 1.245 (MA14), 1.255 (MA28), 1.272, 1.293 - Support: 1.232 (MA7), 1.231, 1.211 (24h low) - 24h range: 1.211 to 1.467 Overall, TRUMP is sitting in the middle of a decision zone. The sell-off has been absorbed for now, but the bounce lacks volume and has not reclaimed the moving averages above. The next expansion will most likely come from either a volume-backed break above 1.255 or a loss of 1.211. Watch how price behaves around the MA14 before getting too excited about the recovery, and treat all of this as a read on structure, not a guarantee of direction. A note on the chart: it is on the 15-minute timeframe, not the 1h, and it shows only MA7/14/28 and volume with MA5/MA10. There is no EMA200, RSI, MACD or Fibonacci on screen, so I left those out rather than invent values. If you send a 1h screenshot with those indicators, or the LITUSDT reference post, I can match the style and depth more closely. #BlockchainSecurity #MidtermsMarketWatch $BTCUSDT

🚀 BITTENSOR (TAO) – MASSIVE BULLISH REVERSAL POTENTIAL! $800 IN FOCUS? 🔥 💰 Current Price: $223.30 (-0.04%) 📊 Technical Analysis: TAO is approaching a major weekly demand zone around $150–$220. The chart shows a long descending trendline, while buyers are attempting to defend this support area. 🎯 Potential Targets: - TP1: $300 - TP2: $400 - TP3: $600 - Major Target: $800 ⚠️ A breakout above $300 could strengthen bullish momentum. Losing the $150 support zone may invalidate the setup. The $800 target is a long-term chart projection, not a guarantee. 👀 Can TAO make a powerful comeback? #BlockchainSecurity $ETCUSDT $BTCUSDT