SHINGE
784Like0Shares36Fans48Follow
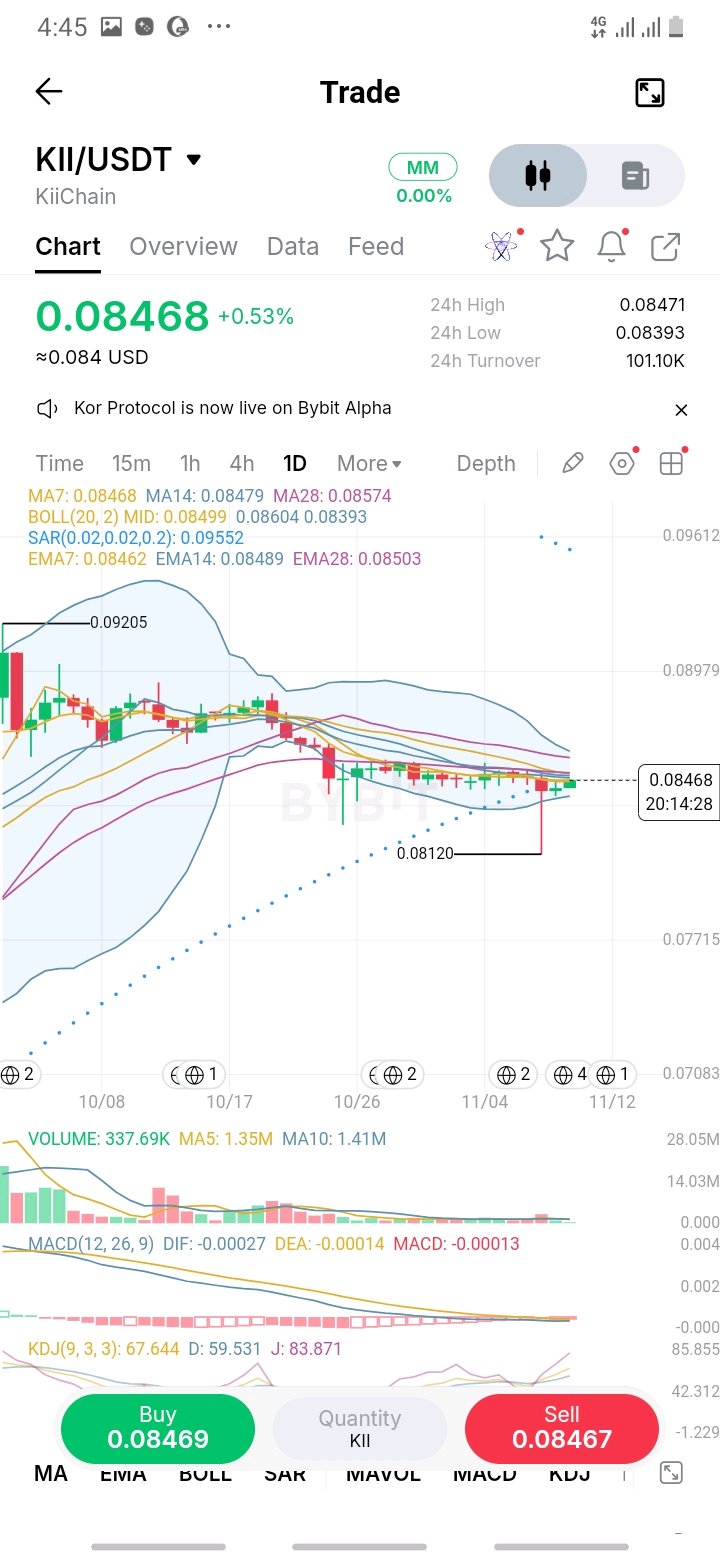
$KII has gone nowhere for about two weeks, and honestly that's the interesting part. The 7, 14 and 28 averages are all bunched between 0.0846 and 0.0857 with price sitting inside them, and the Bollinger bands have pinched to a fraction of the width they had in early October. One thing broke the quiet: a candle that flushed to 0.0812 and got bought straight back. Sellers had one clean shot and couldn't hold it. Volume is the other half of the story though. 337K so far against a 5-day average of 1.35M, so nobody is really committed yet. I'm not picking a side inside this box. A close above 0.0860 (upper band, just over the 28-day) and I start taking an upside break seriously, but only if volume shows up with it. A close under 0.0839 puts the 0.0812 low back in play. Thin pair, so I'd size it like one. $KIIUSDT$ONDOUSDT #ByXIMPACT
$AVAX swept the 7.754 low, found buyers, and the daily is now back above the Bollinger midline near 8.68 with volume running at about double its 5-day average. KDJ has curled up off the floor and the MACD histogram just ticked positive after a long red stretch. Levels on my screen: 8.68 / 8.50: where I want dip buyers to show up if this is real 8.90-9.03: the 28-period averages, and today's upper wick already got pushed back around here 9.12: SAR still sits above price, a daily close over it flips that 7.754: lose it and the whole bounce is void Until 9.0 gets reclaimed on a close, I'm calling this a relief move inside a downtrend that started at 12.00. With the candle still open it can fade. A hold on a pullback tells me more than the green bar itself. $AVAXUSDT$ETHUSDT #ByXIMPACT
ETH is roughly 23% off the 2,777 high and the daily is still printing lower highs. The early Nov squeeze toward 2,440 got sold hard right after, and that's the candle I keep coming back to. Today wicked down to 2,067 and got bought back to 2,126, sitting right on the lower Bollinger band around 2,118. KDJ is deep in oversold, volume is light so far, but the candle still has hours left, so I'm not calling a bottom off one wick. What changes my mind: a daily close back above 2,236-2,260, where MA7 and MA14 are stacked. Until then I treat every bounce as a bounce. Lose 2,067 on a close and there's no structure on this chart underneath to lean on. Not chasing either side here. Waiting for the close. $ETHUSDT$SOLUSDT #ByXIMPACT
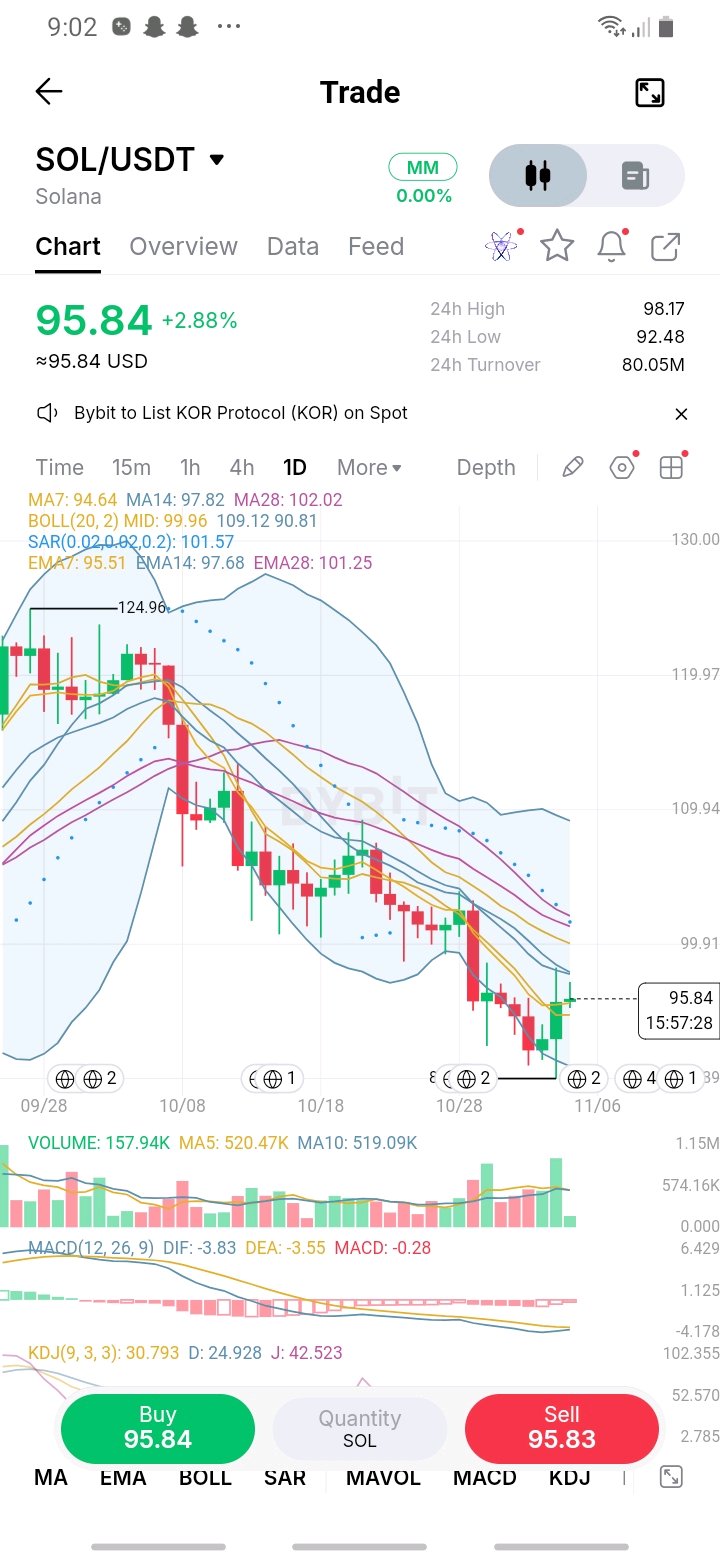
SOL is up 2.9% and trading at 95.75 on the USDC book, with the 24h range at 92.37 to 98.04. The bounce has pushed price back above MA7 (94.54) and EMA7 (95.41), and it's now testing the 14-day pair at 97.6 to 97.7 from below. That zone is where the rally has to prove itself. MA14 and EMA14 are almost on top of each other, and they sit just under the 24h high. MA28 (101.9) and EMA28 (101.2) are the next layer above, with SAR at 101.5 marking how far the trend still has to turn. MACD is still negative at -0.28, with DIF below DEA. The downtrend is paused, not finished. I'd want a daily close above 97.7 to call the test cleared. A close back under 94.5 would put the 92.37 low back in focus. $SOLUSDT $BTCUSDT #WSOT2026
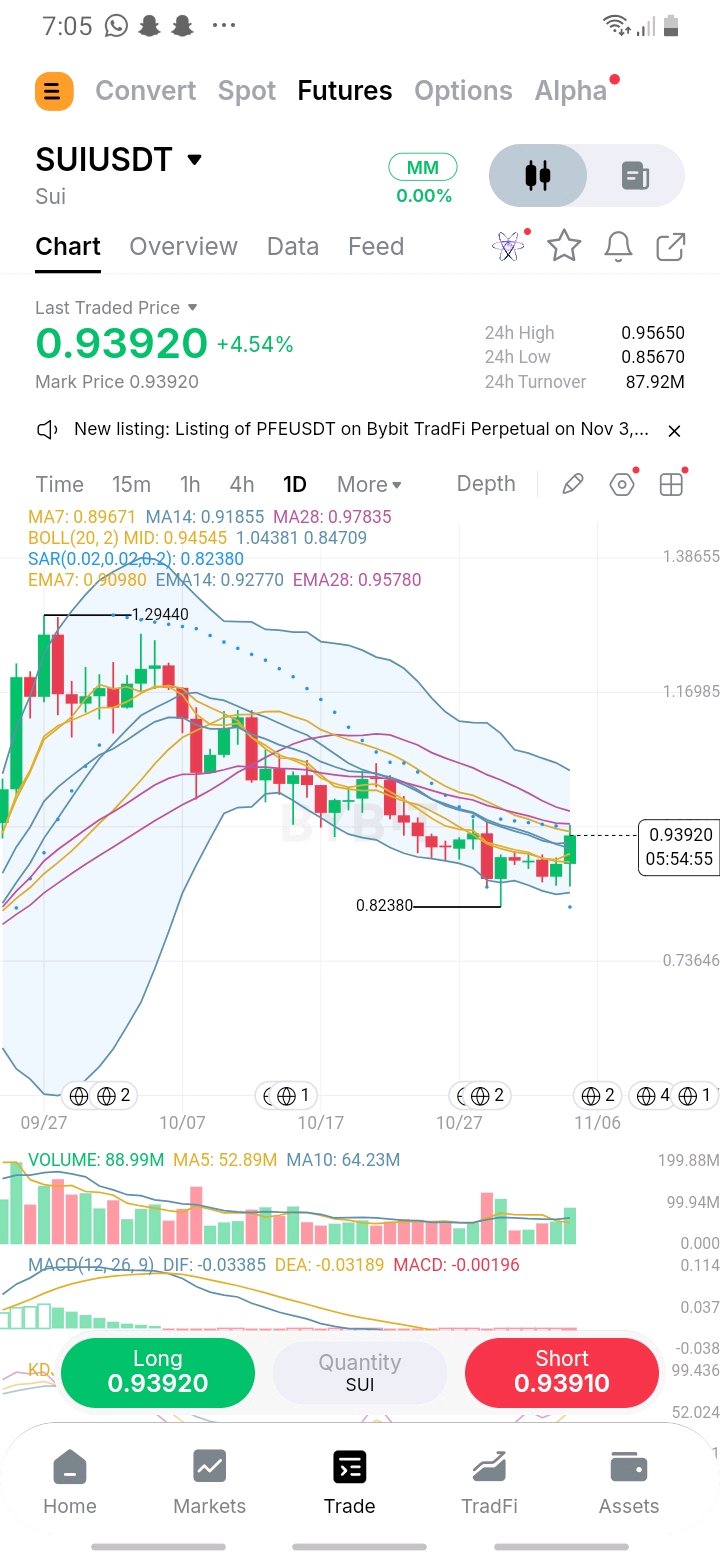
$SUI is up 4.5% and pressing the 0.9565 high of its 24h range. Price is at 0.9391, above MA7 (0.8967) and EMA7 (0.9098), and it has pushed through the MA14 and EMA14 pair around 0.919 to 0.928. That's a clear change in the short-term structure after the drop from 1.26. The next layer is the one that matters. EMA28 (0.958) and MA28 (0.978) sit right on top of the 24h high, so this is the ceiling the trend has to break. SAR has flipped below price at 0.824, which is the clearest trend signal on the chart. MACD is still slightly negative at -0.002, with DIF just under DEA. Momentum is recovering but hasn't turned yet. A daily close above 0.958 would be the first real break. A close back under 0.910 would bring the 0.857 low back into focus. $SUIUSDT$XRPUSDT #ByXIMPACT
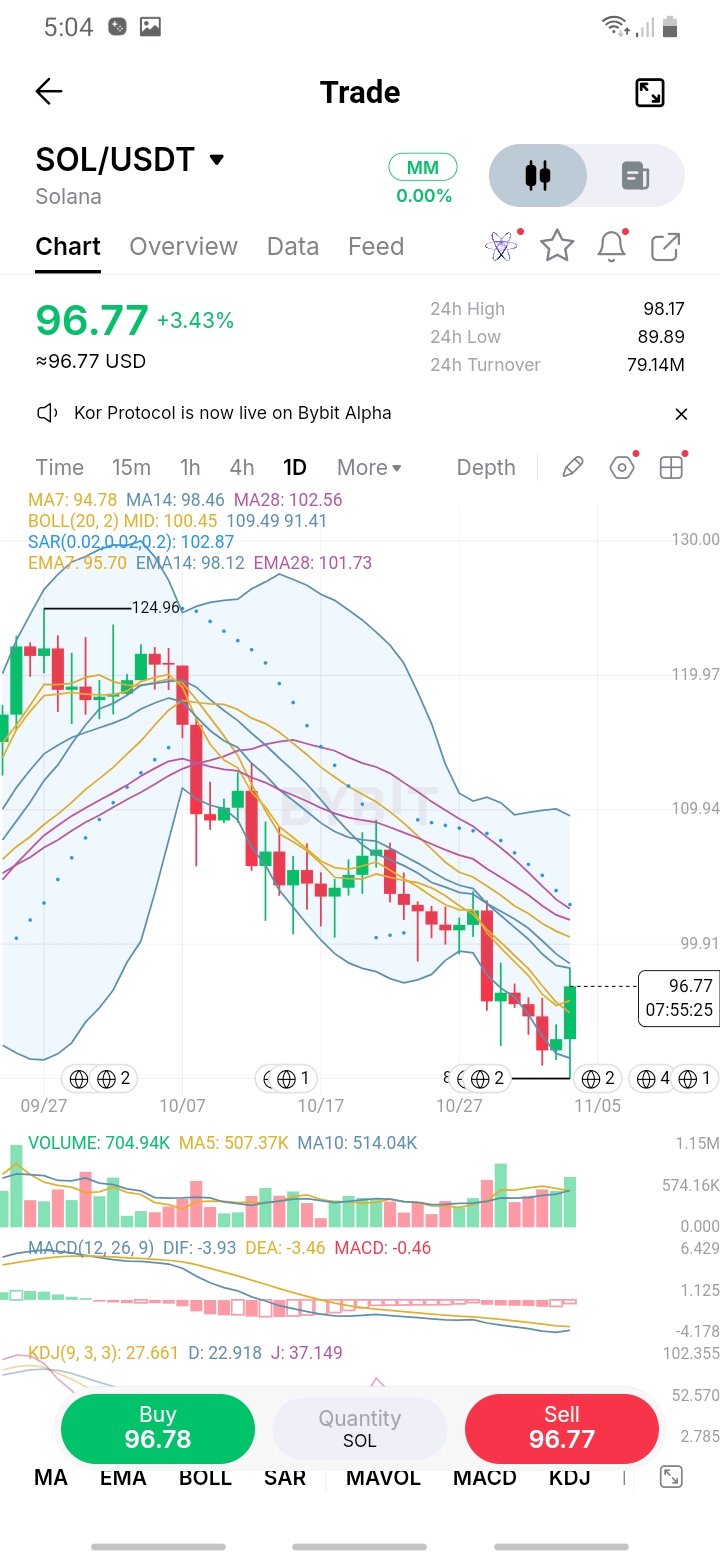
$SOL is pressing into a ceiling. Price is at 96.96 after bouncing off the 89.81 low, and the rally has run straight into the 98 zone where the 14-day averages sit (MA14 at 98.44, EMA14 at 98.11) and the 24h high at 98.13 is also sitting. That's the same level that has been rejecting price since the 123.79 peak. The short averages have been reclaimed. MA7 (94.78) and EMA7 (95.72) are underneath, so the short-term structure has turned up. MA28 (102.5) and EMA28 (101.7) make the next layer, with SAR well overhead at 102.8. The downtrend hasn't ended, it's just pausing at a known level. MACD is still below zero at -0.45, with DIF above DEA in the last few sessions, so the momentum is improving but not confirmed. A daily close above 98.4 is the first real break. A close back under 94.8 would bring the 89.8 low back into focus. $SOLUSDT $USDCUSDT #ByXIMPACT
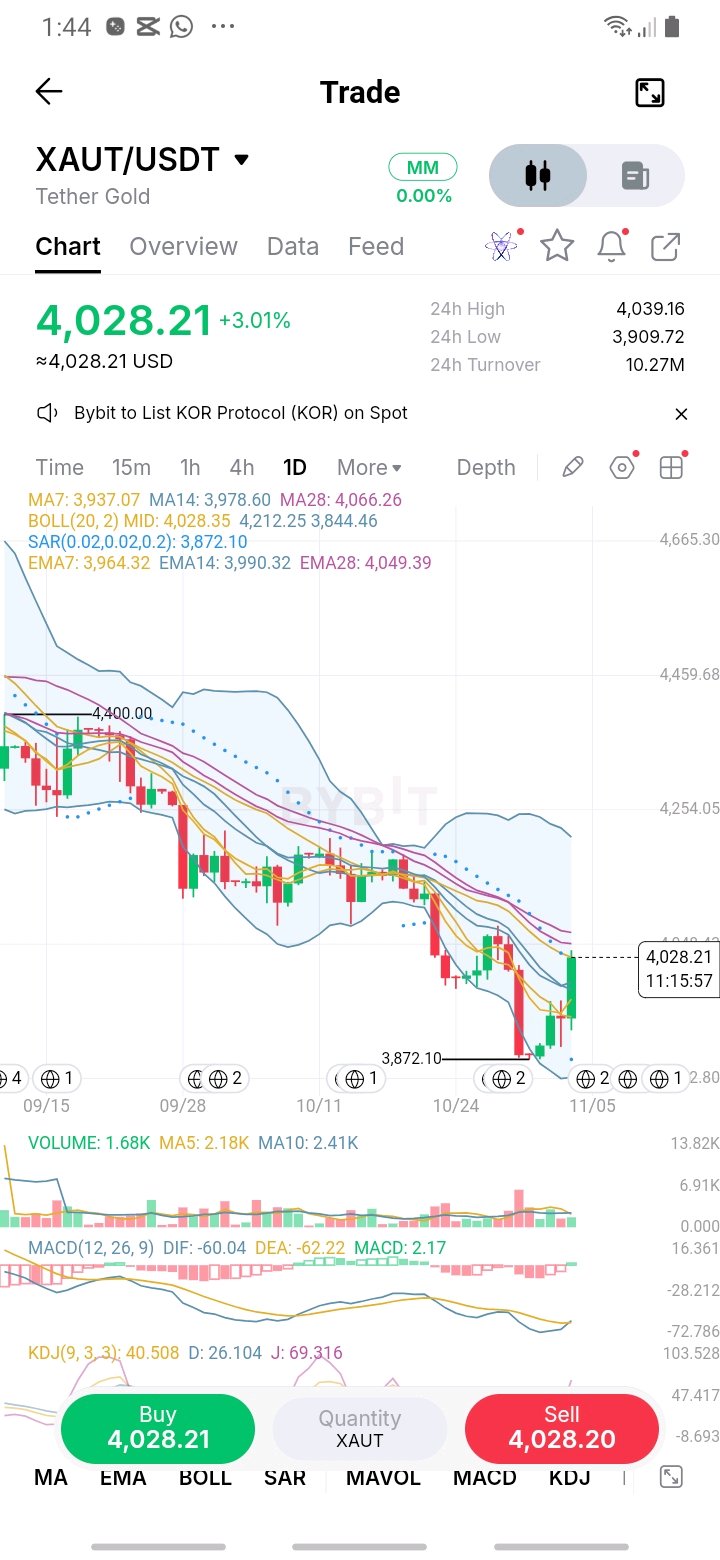
$XAUT is back above 4,000. Price is at 4,028, up 3% on the day, after a 24h range from 3,910 to 4,039. The move has cleared the MA14 and EMA14 cluster that had been sitting just under 4,000, and it has moved above MA7 (3,937) and EMA7 (3,964) too. That's the first time the short-term structure has pointed up since the late-October flush. The 3,872 low held as the floor, and the bounce from it has been steady rather than explosive. MACD has turned positive at 2.17, and DIF has crossed above DEA, which is the signal I'd want to see before calling a turn. The next test is MA28 (4,066) and EMA28 (4,049). Those are the averages that capped every rally since the 4,400 high. A close above them would change the daily trend. A close back under 3,990 would put the breakout back in question. $XAUTUSDT $BTCUSDT #ByXIMPACT
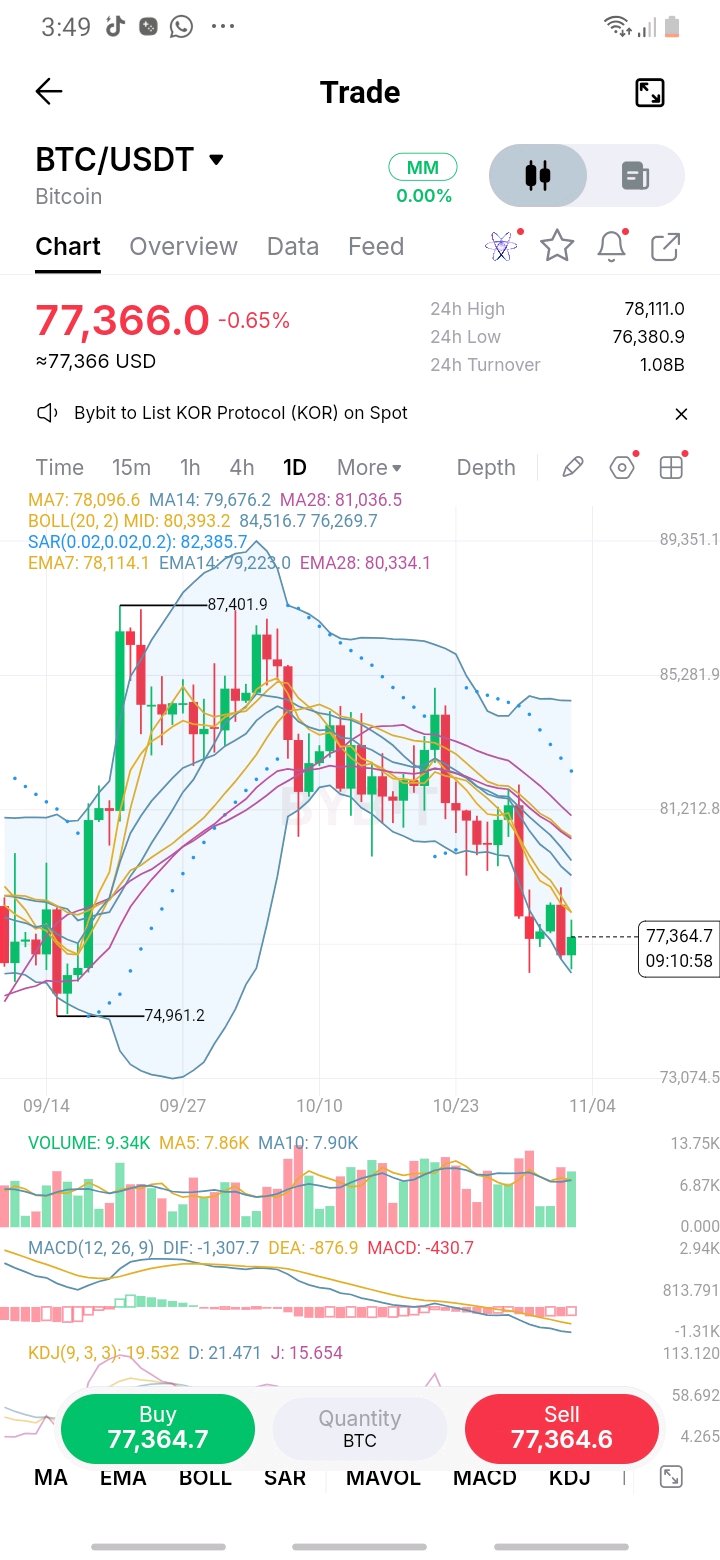
$BTC bounced off the 76.4k floor and is back at 77,366, but the recovery is running into the same wall. Price is pressing up against EMA7 (78,114) and MA7 (78,097), and the 24h high at 78,111 sits right on top of them. That's where buyers have to prove they can hold. Above that, the averages stack quickly. MA14 at 79.7k and EMA14 at 79.2k are the next layer, MA28 at 81.0k and EMA28 at 80.3k above that, and SAR far overhead at 82.4k. The trend is still pointing down. MACD is deep below zero at -431, but the bars have stopped widening. Oversold readings from KDJ (J around 16) point to a bounce, and the volume on this move (9.3K against a 7.9K average) is picking up. The 78.1k level is my trigger. A close above it opens the 79.2k to 79.7k zone. A close back under 76.4k undoes the bounce. $BTCUSDT #WSOT2026
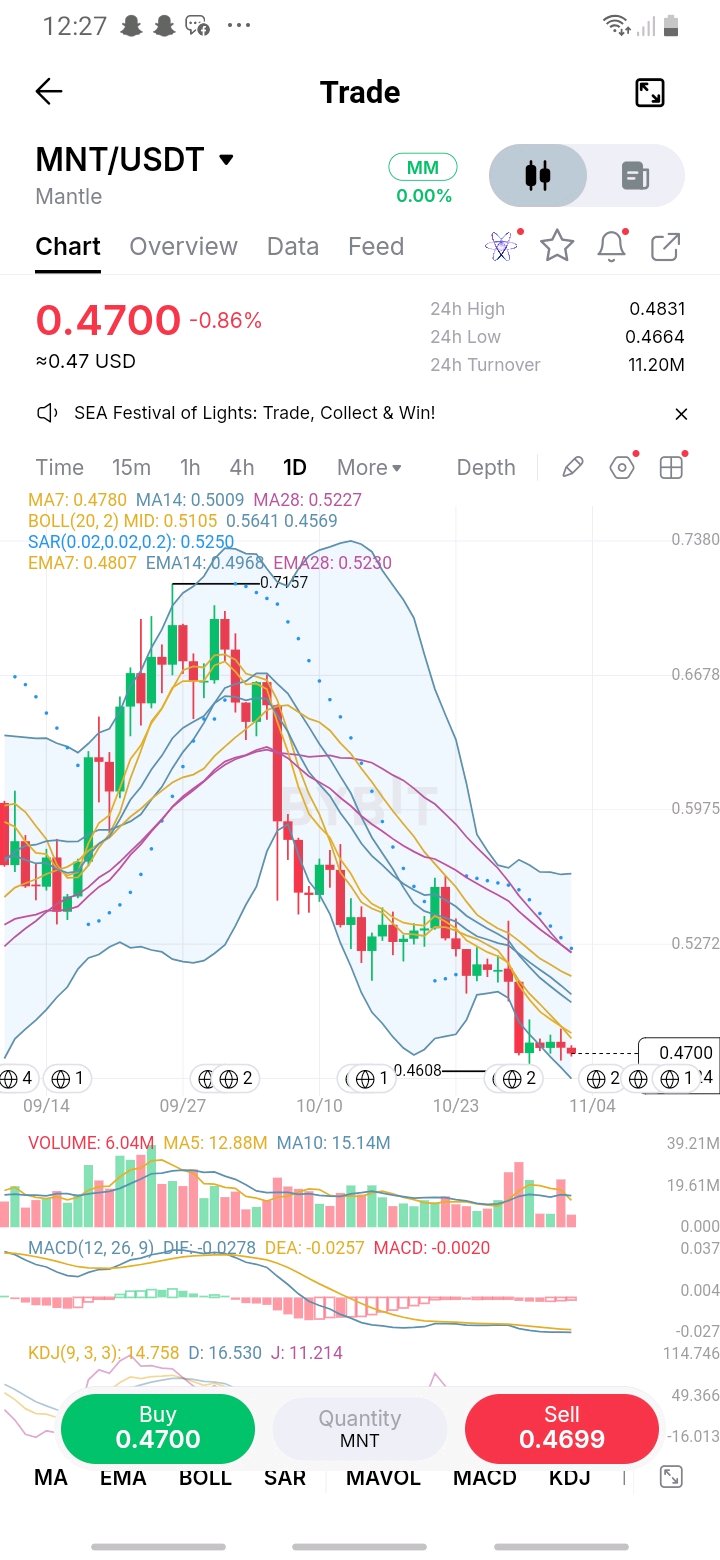
$MNT is sitting just above the 0.4608 swing low at 0.4700, and the daily structure is still heavy. Price is about 34% under the 0.7157 peak, and every average is stacked overhead, from EMA7 (0.4807) up to EMA28 (0.5230) with SAR at 0.5250. What's different is the volume. Today's bar is 6.04M against a 5-day average of 12.88M, so the sellers pushing it down have thinned out. The last few sessions have been small-bodied candles near the low instead of the big red candles that drove the drop. MACD is still negative, but the histogram is shrinking. That's selling slowing, not buyers returning. I'd treat 0.4608 as the line that decides the next leg. A close under it opens new lows. A reclaim of 0.4807 is the first sign of a bounce that could develop into something. $MNTUSDT $MEGAUSDT #IMPACTbyTrade
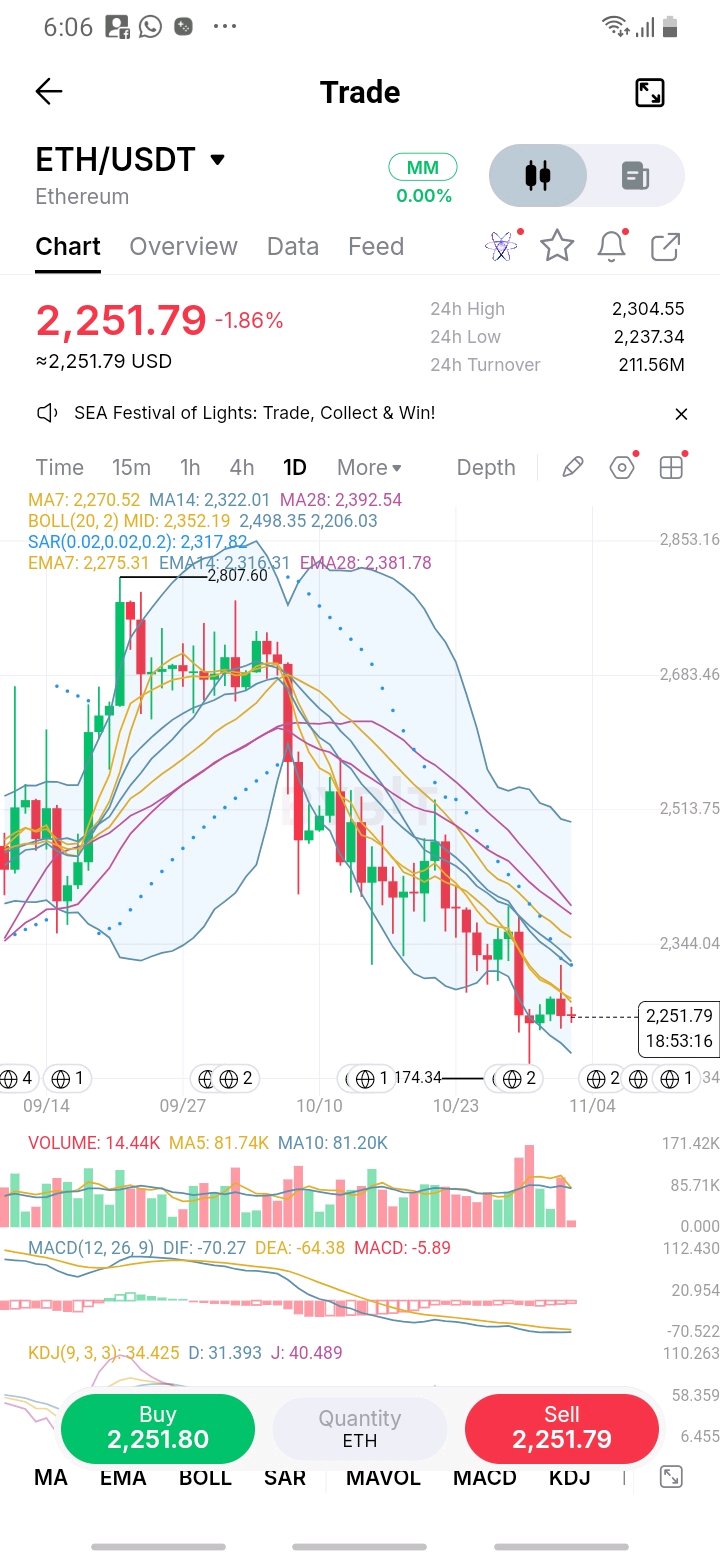
$ETH is pressing on the floor. Price is at 2,251.79 after touching 2,237.34 in the last 24 hours, which is the lowest level since the 2,172 swing. The bounce into 2,305 has faded, and every average is still above price. MA7 (2,271) and EMA7 (2,275) are the first hurdle, about 1% up. MA14 and EMA14 (2,316 to 2,322) and SAR at 2,318 make a wall 3% above. MA28 and EMA28 near 2,382 to 2,393 sit above that. It's a stack of downtrend resistance with no gap in it. MACD is still deep below zero at -5.89, and the histogram is shrinking, so selling is slowing. That doesn't mean buyers are back. A daily close under 2,237 puts the 2,172 low on the table. Holding it and reclaiming 2,276 is the first real sign of a bounce. $ETHUSDT $SOLUSDT #IMPACTbyTrade #BybitStocks
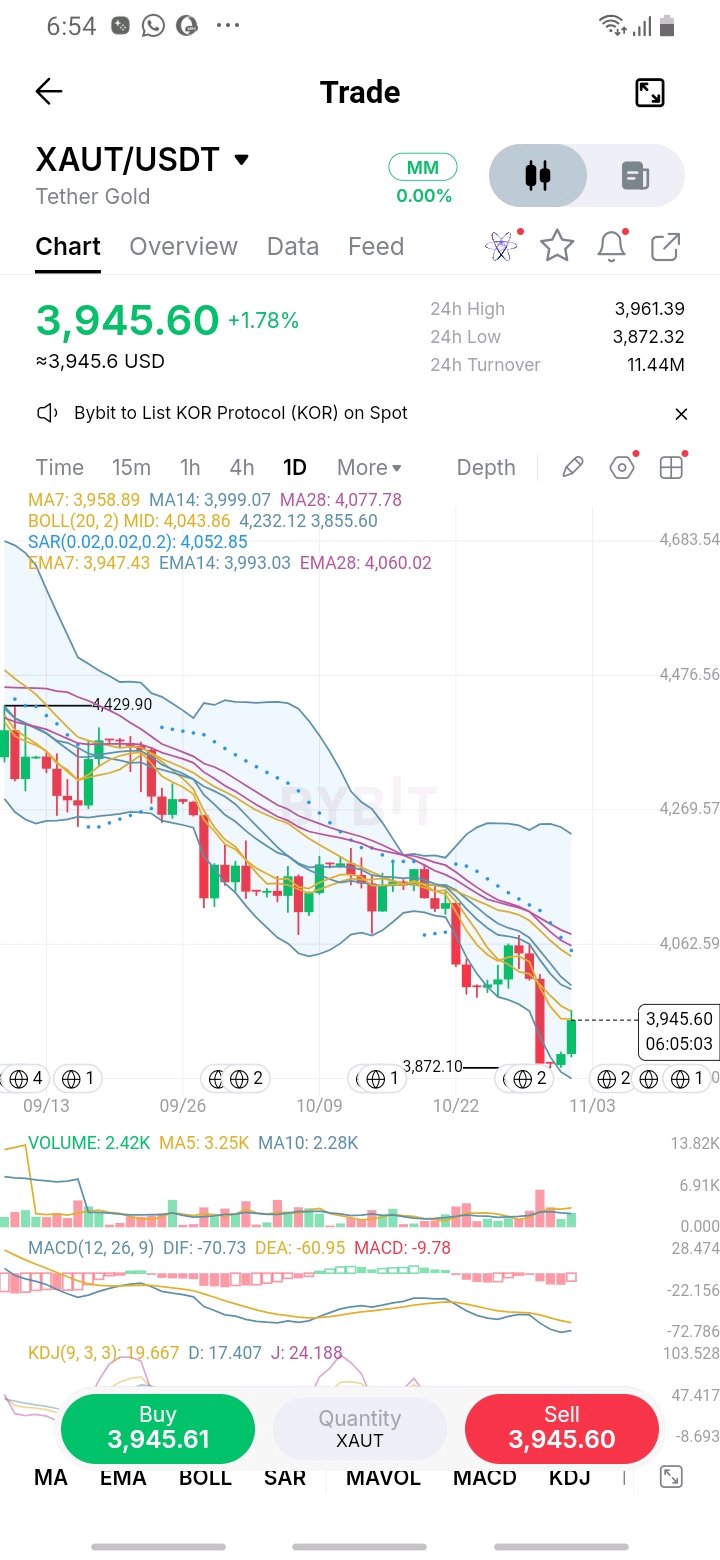
$XAUT has reclaimed the short averages. Price is at 3,945.60, above EMA7 (3,947) and just under MA7 (3,959), after the flush to 3,872 held as the 24h low. Two sessions ago this was a bounce with nothing behind it. Now it's clawing back into the zone that was rejecting it. The ceiling is still there. EMA14 (3,993) and MA14 (3,999) sit about 1.2% above, with the 4,000 round number on top of them. Then MA28 (4,078) and EMA28 (4,060), with SAR at 4,053 overhead. Price is still well under the 4,429 high, so the trend hasn't changed. Volume is the weak link. Today's bar is 2.42K against a 5-day average of 3.25K, so the recovery isn't being chased. A daily close above 3,999 would be the first real break in this downtrend. A close back under 3,872 undoes the whole bounce. $XAUTUSDT$HAEDALUSDT #IMPACTbyTrade
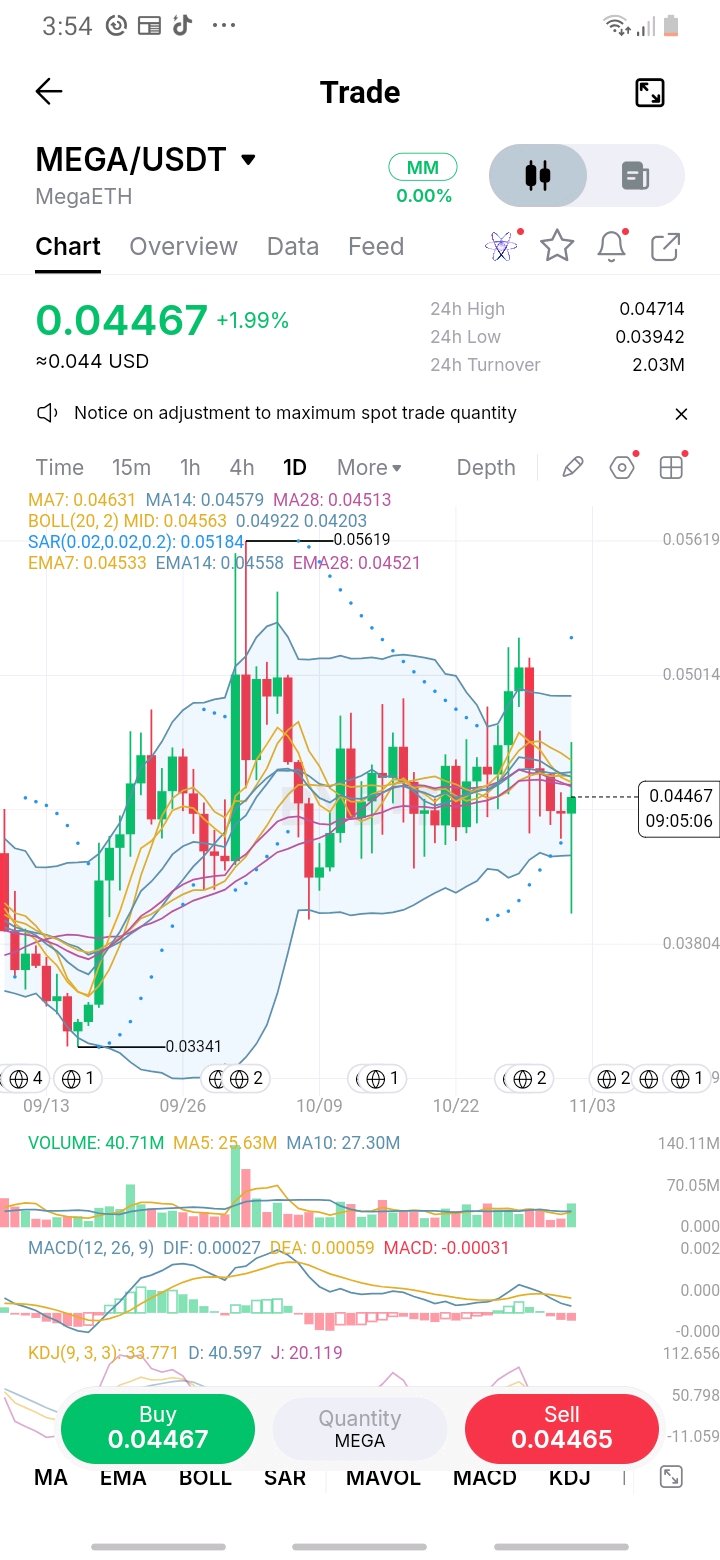
$MEGA has spent most of October stuck in the same box. Price is at 0.04467 with every short average packed between 0.0452 and 0.0463, so the chart is compressing rather than trending. The interesting part is the volume. The 5-day average is 25.6M, well below the 40.7M on today's bar, and the candle printed a long lower wick down to around 0.0394. Buyers pushed back in quickly, which is the sort of reaction that matters when price is sitting inside a range. The box is roughly 0.0394 to 0.0471 on the 24h, and the 0.0562 high from earlier is far above. For a breakout I want two things together: a daily close above 0.0472 and volume that holds up. A close back under 0.0394 would mean the wick was a failed test, and the lower Bollinger band near 0.0380 becomes the next stop. $MEGAUSDT $SPXUSDT #IMPACTbyTrade
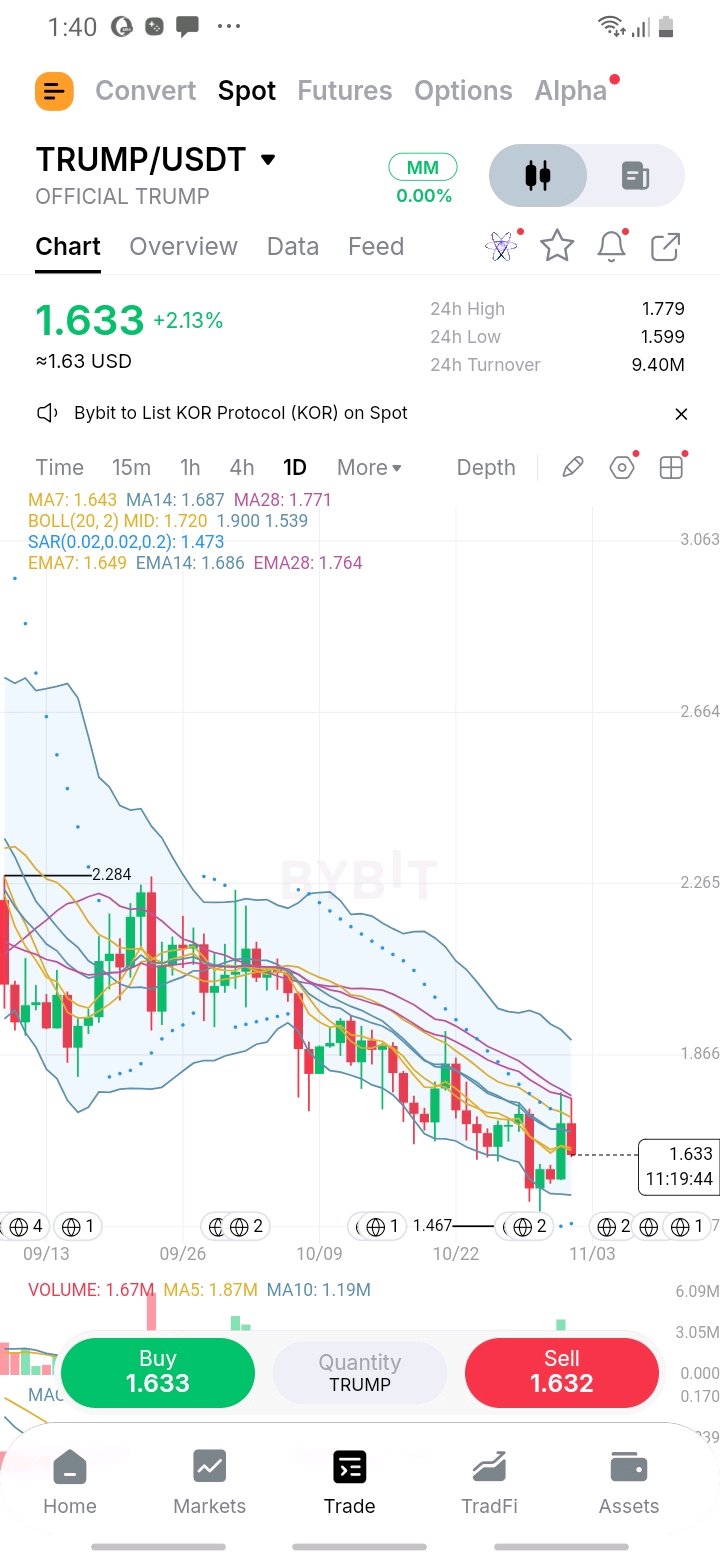
$TRUMP lost the bounce. The recovery that got price back into the 1.71 area has given back most of its gains, and today it's at 1.633, sitting under MA7 (1.643) and EMA7 (1.649). Both short averages turned from support into a ceiling again. The bigger problem is that the 1.77 zone is still overhead. MA28 (1.771) and EMA28 (1.764) are stacked right there, and the last two rejections happened on that same cluster. Until price closes back above it, every move up is just a bounce inside a downtrend. SAR at 1.473 is a long way below, which tells you the trend hasn't flipped. The 1.599 low is the level I'm watching now. A daily close under it opens the 1.467 swing low again. Lower Bollinger band on TRUMP's daily is at 1.539 and the midline at 1.720, with price at 1.633 right in the middle of that channel. The bands have been narrowing since the high, which usually means volatility is compressing ahead of a bigger move. The averages agree that the structure is still defensive. MA7 and EMA7 are at 1.643 and 1.649, MA14 and EMA14 are both at 1.687, and everything above that is tied to the 1.77 cluster. Price has to climb through three layers before the trend can change. Volume is fading too: 1.67M today against a 5-day average of 1.87M. The next real move will probably come with volume, so I'd rather wait for the break than predict which way it goes. $TRUMPUSDT$INITUSDT #IMPACTbyTrade
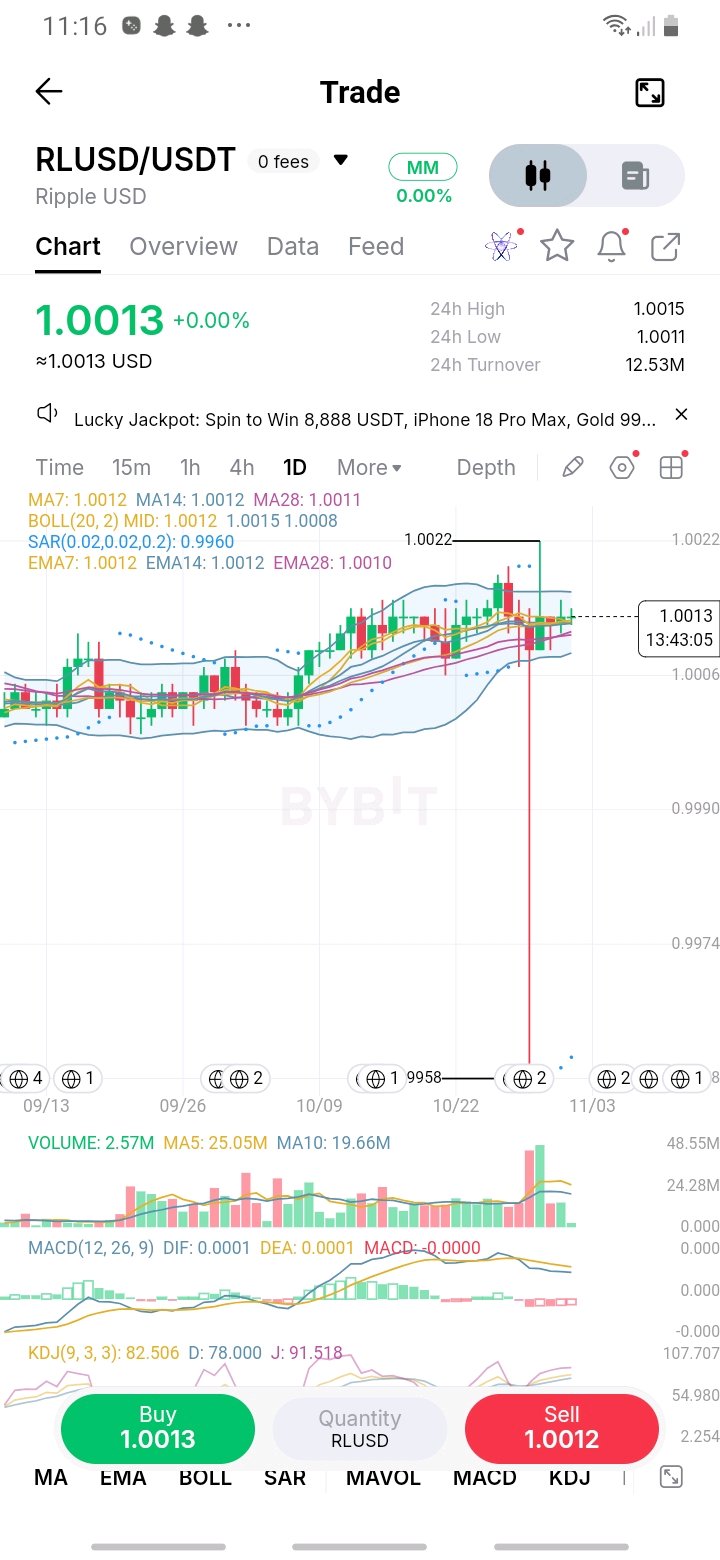
Stablecoin pairs don't get attention until they move, so here's RLUSD/USDT on the daily. It's a flat line with one scar: a single wick down to about 0.9958 last week, during the broader market flush, roughly half a percent below where it trades now. It was back near 1.00 within the same session. That's what a healthy peg under stress looks like: a brief dislocation, then it gets pulled back. Volume tells the same story, spiking to around 48M that day and now sitting at a couple of million. Today's 24h range is 1.0011 to 1.0015, about 0.04% wide. What would worry me isn't one wick. It's repeated closes under 0.999, or wicks that take longer to heal each time. Until then, this is a pair I'd watch for liquidity, not trade for direction. $RLUSDUSDT$AVLUSDT #BybitStocks #IMPACTbyTrade
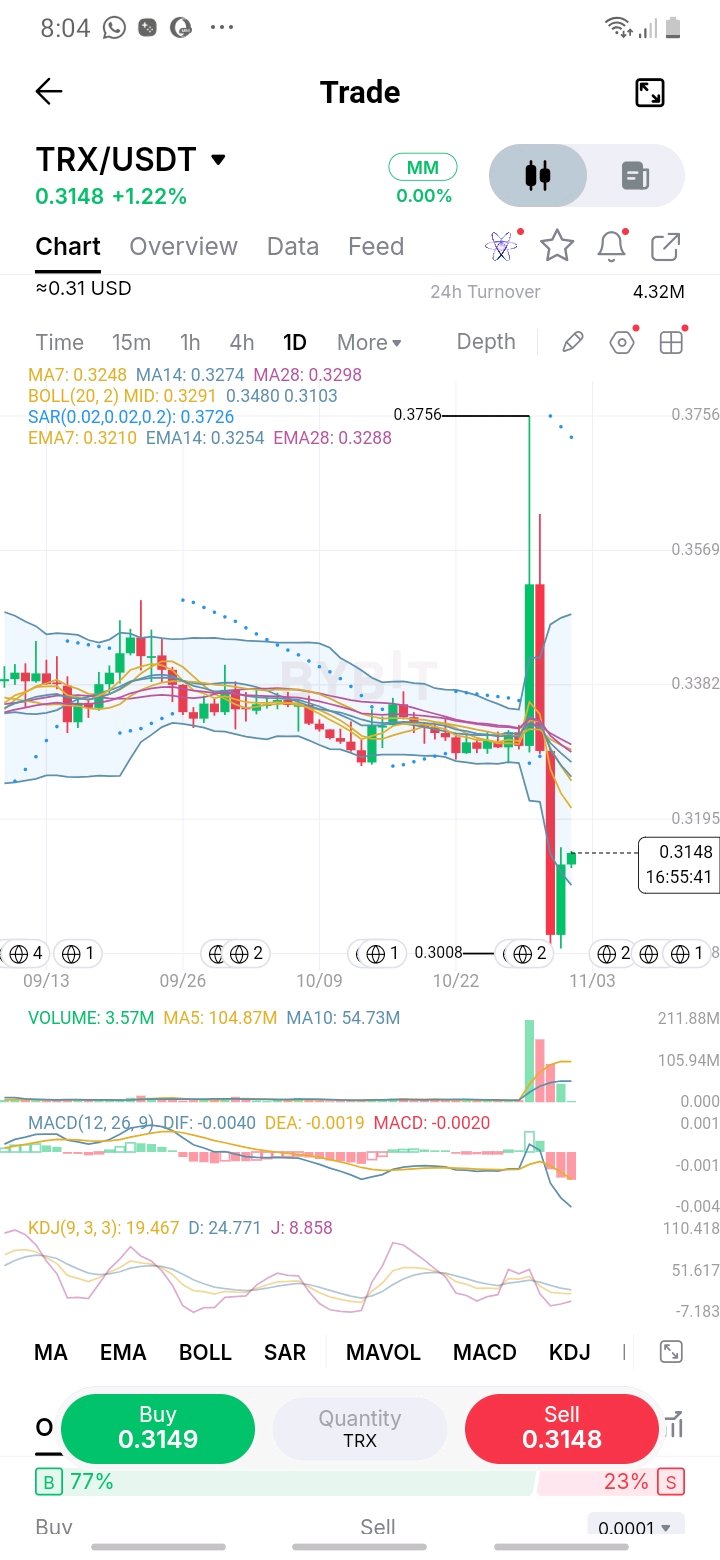
The most interesting thing on the daily chart isn't the spike, it's what volume did around it. Two sessions did the bulk of the recent trading (the 5-day average is 105M), and today's bar is only 3.57M with the day still young. The crowd that showed up for the move to 0.3756 and the dump to 0.3008 has gone home. That matters because climactic volume usually marks the extreme of emotion, not the start of a trend. When it dries up this fast after a flush, it suggests the forced selling is finished. It doesn't tell me buyers are interested, though. Price at 0.3148 is still 16% under the high with every average sitting above it, from EMA7 at 0.3210 up to MA28 at 0.3298. So I'm treating this as a market that has cooled off, not one that has turned. Interest has to come back before the structure changes, and volume is where I'd see it first. $TRXUSDT $AAVEUSDT #BybitStocks
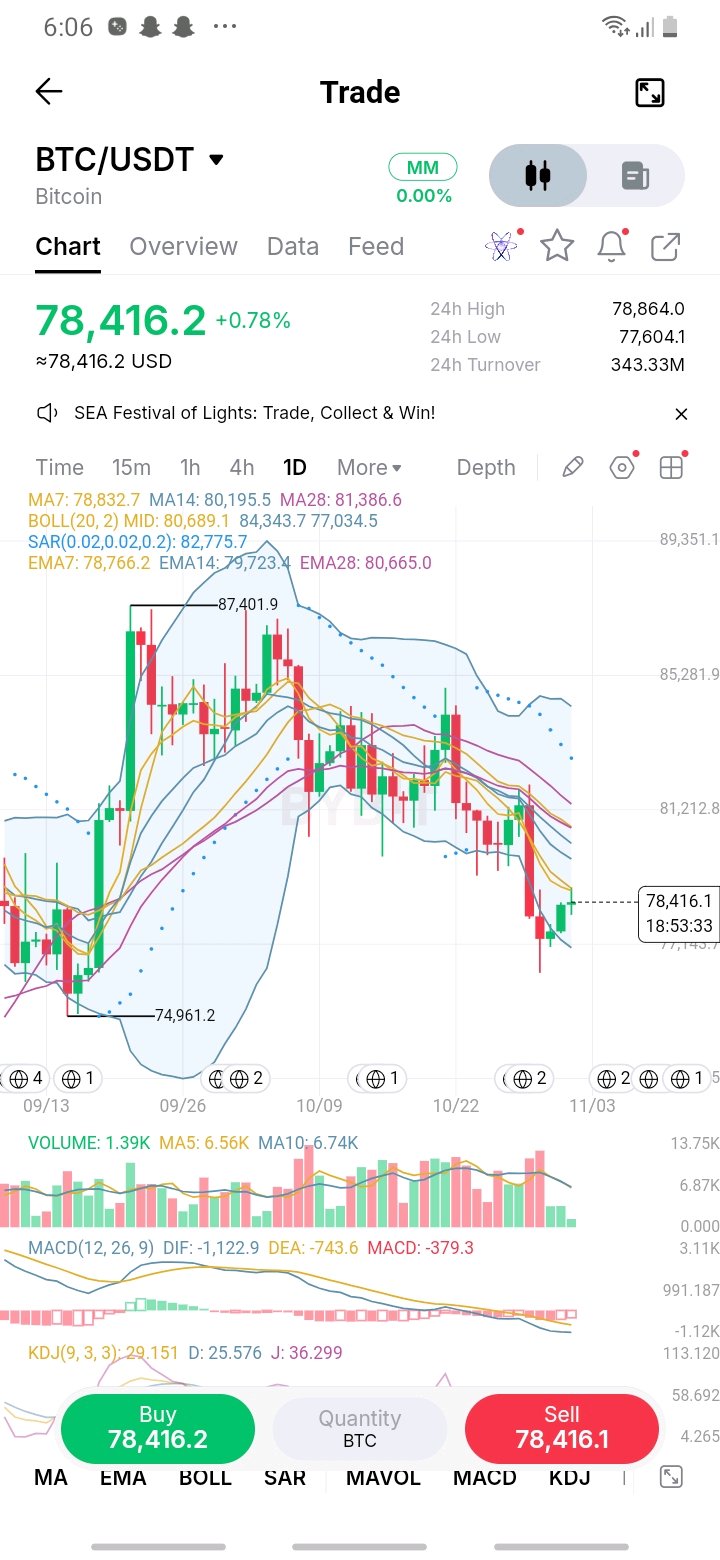
New week, new daily candle on $BTCUSDT, and it's only a few hours old. Volume so far is tiny next to the recent average, which is normal this early, so I'm not reading anything into today's bar yet. What I do see: KDJ has turned up from the low 20s with K crossing above D, and the red MACD bars are getting shorter. That's selling pressure fading. Useful information, but not a signal to act on. Price is 78.4k, just under MA7 and EMA7 around 78.8k, and those two decide whether the week starts with a reclaim or a rejection. I'd rather wait for the daily close than trade a candle that hasn't earned its volume. Reclaim 78.8k on a close and the week starts on the front foot. Get rejected and the lower band near 77k is back in play. Zoom out on and the daily picture is simpler than the indicators make it look. Since September the market has traded between 74,961 and 87,402, and at 78.4k price sits in the bottom 28% of that range. Cheap on paper, but a low in the range only matters if buyers defend it, and so far they've done it with small candles. The midpoint of the range is about 81.2k, which also happens to be where MA28 (81.4k) and EMA28 (80.7k) sit. That's the real prize for any recovery, and there's plenty to chew through before it: MA7 and EMA7 around 78.8k, then EMA14 at 79.7k, then MA14 at 80.2k. Below, 77.0k (the lower Bollinger band) is the first line, and the September low at 74,961 is the one that matters structurally. I'm not interested in the middle of this range. I want a reaction at the edges. $BTCUSDT $ETHUSDT #IMPACTbyTrade
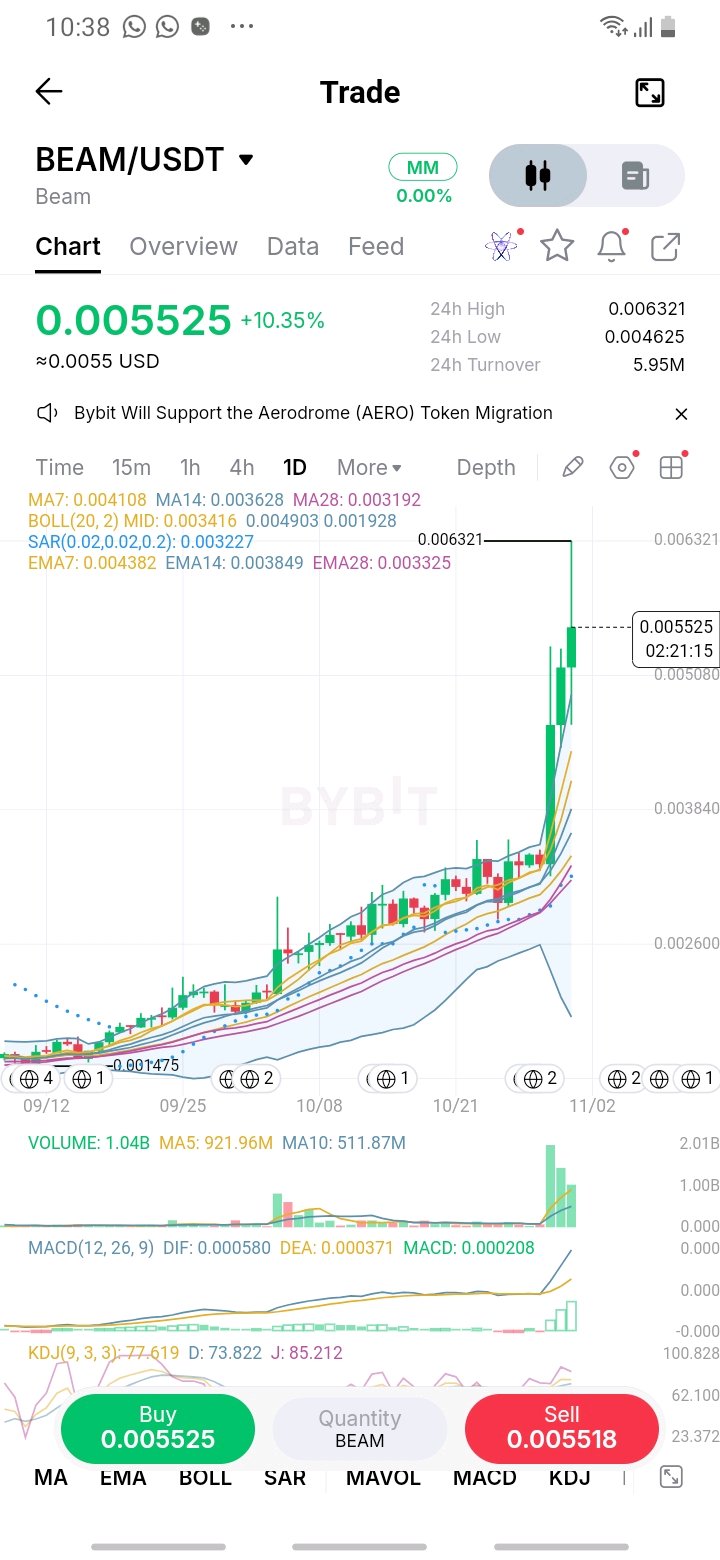
$BEAMUSDT went from a slow grind to a vertical wall of green, and the numbers show how stretched it is. Price at 0.005525 sits about 26% above the daily EMA7 and roughly 12% above the upper Bollinger band at 0.004903. Against the 28-day EMA it's up around two-thirds. That doesn't mean it has to fall. The momentum is real: MACD is widening and today's volume (1.04B so far) is already above the 5-day average. But stretched moves usually give back some of the extension before the next leg, and the question is where. The zone I'd watch is 0.0044 to 0.0049, where EMA7 and the upper band sit. A pullback into it that holds keeps the trend intact. Chasing at 0.0055 means taking all the risk back to those averages if things cool off. $BEAMUSDT $TRUMPUSDT #IMPACTbyTrade
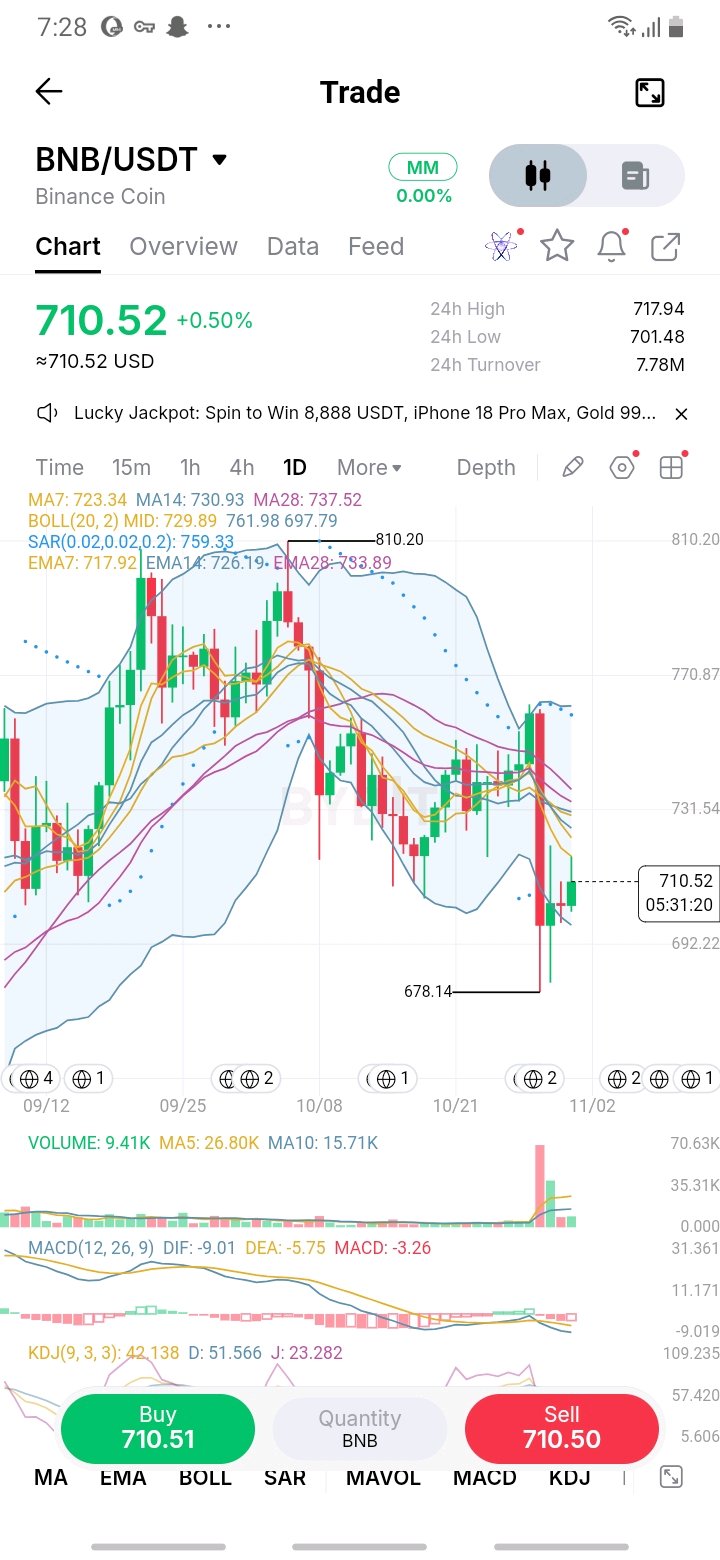
One daily candle on wiped out the whole push from the day before and then some. That's the kind of candle that shakes weak hands, and the 676.40 wick says plenty of them got shaken. What happened after matters more than the drop itself. Price has climbed back to 711 through a run of green candles instead of dumping again, so the washout wasn't sold into. This daily close is the first real data point. A close above 717.76 would be the first time buyers hold ground at the short-term average. A close back under 701 says this was just a pause. I'm not calling a bottom off one wick. I'm watching whether the next few closes stack higher. $BNBUSDT$XAUTUSDT
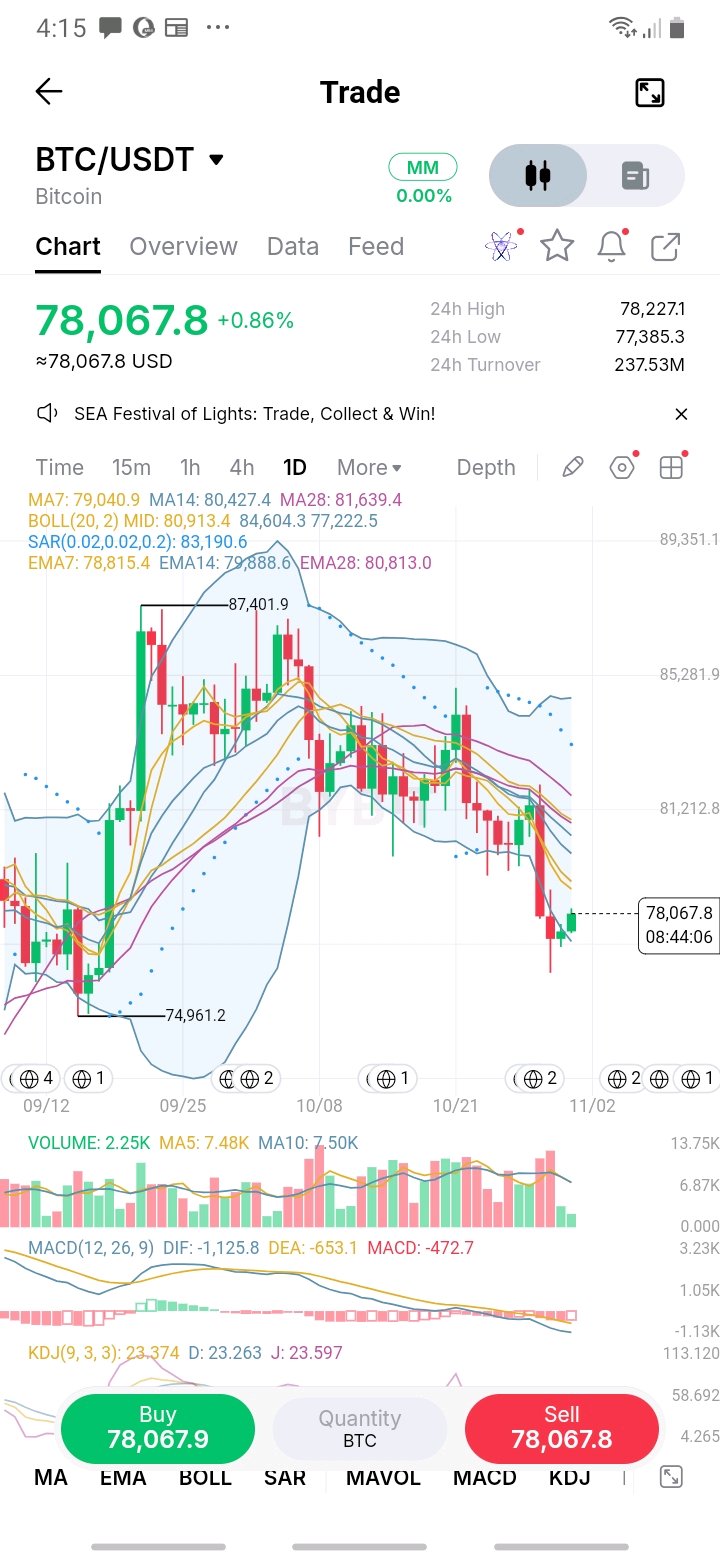
$BTC daily is sending two different messages, and the honest move is to hold both. Trend: MACD is still sliding (DIF at -1,126 under DEA at -653), price is below every average, and SAR sits overhead at 83.2k. Stretch: KDJ is pinned in the low 20s and price is tucked right against the lower band. Trend says don't fight it. Stretch says don't chase the downside either. That's usually a range trader's market, not a conviction one, and 77.2k to 79k is the pocket I'd work in, small size, quick to cut. Break either side with real volume and I follow it rather than predict it. $BTCUSDT$MNTUSDT #ByXIMPACT
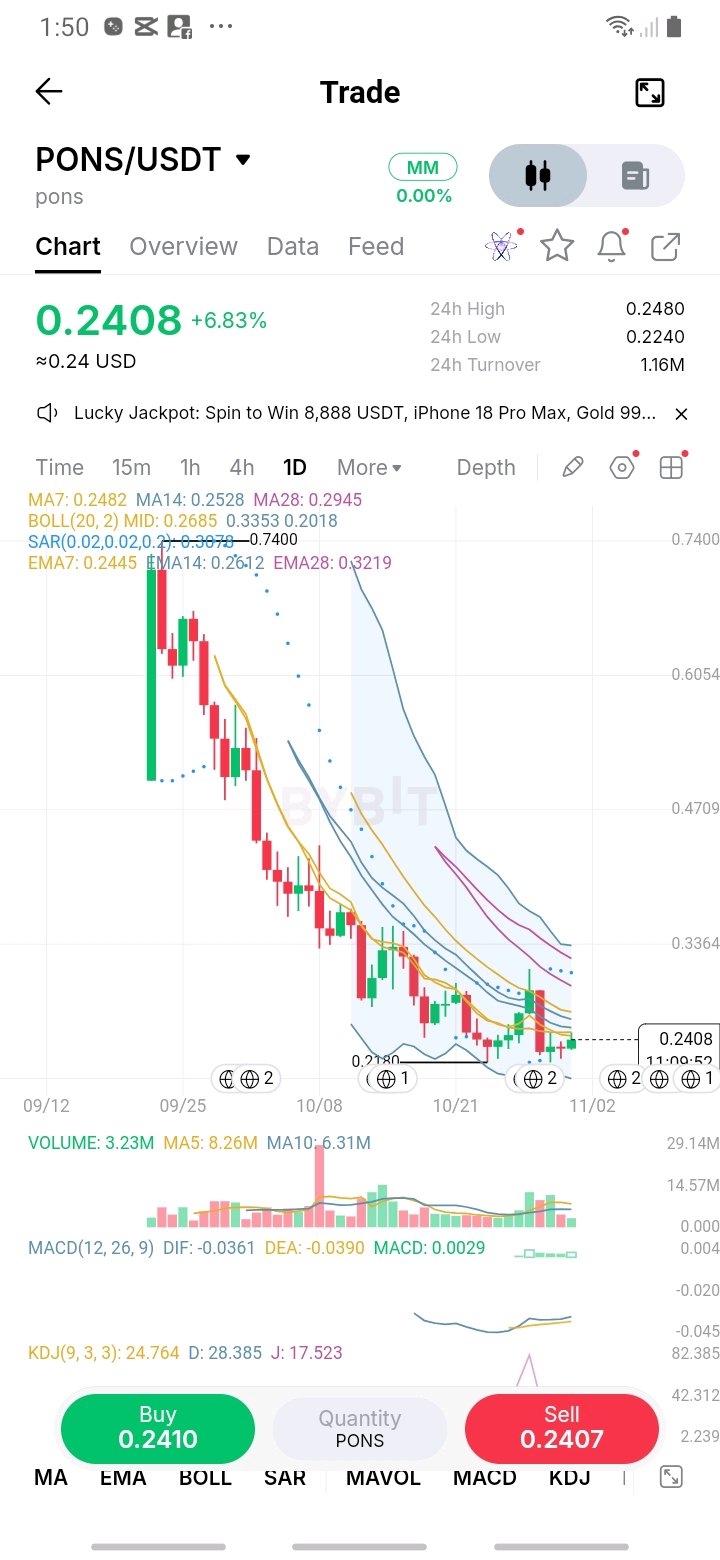
$PONS is roughly two-thirds off its 0.74 high and finally printing something other than red. Today's +6.8% is the best candle in a while, but check the volume: 3.2M against a 5-day average of 8.3M. Nobody is chasing this yet. MACD just crossed up, but it did it deep below zero, and KDJ is still sitting in the low 20s. That's a bounce setup, not a trend reversal. 0.218 is the floor that has held so far. 0.248 to 0.253 is the wall, with MA7 and MA14 stacked right there. I need a daily close above it on real volume before I take this seriously. Without that, it's a relief bounce getting a little attention. $PLUMEUSDT $PONSUSDT#ByXIMPACT