BitcoinSlidesBelow$80K
Bitcoin’s fall below $80,000 has turned a major psychological level into near-term resistance and raised the risk of further deleveraging. Markets are balancing Federal Reserve policy, inflation, Treasury yields, dollar strength and growing uncertainty ahead of the United States midterm elections. Election expectations may affect fiscal policy, cryptocurrency regulation and overall risk appetite. A quick recovery above $80,000 supported by spot demand could indicate a false breakdown; failure to reclaim it may leave Bitcoin vulnerable to further downside.

CARDANO (ADA) LATEST MARKET ANALYSIS
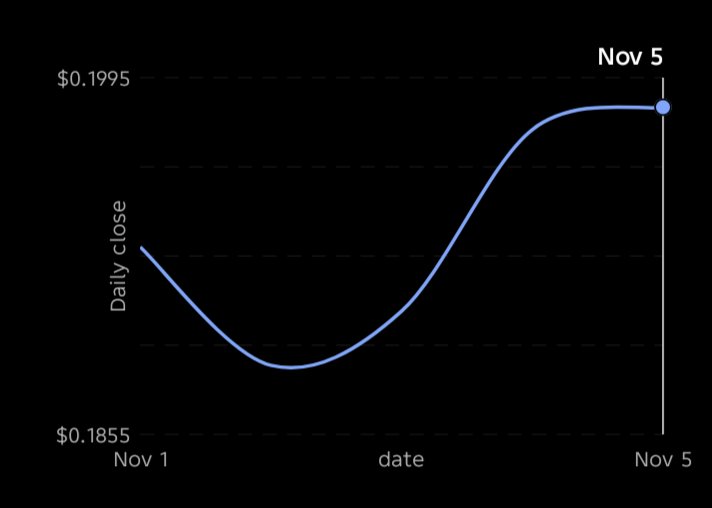
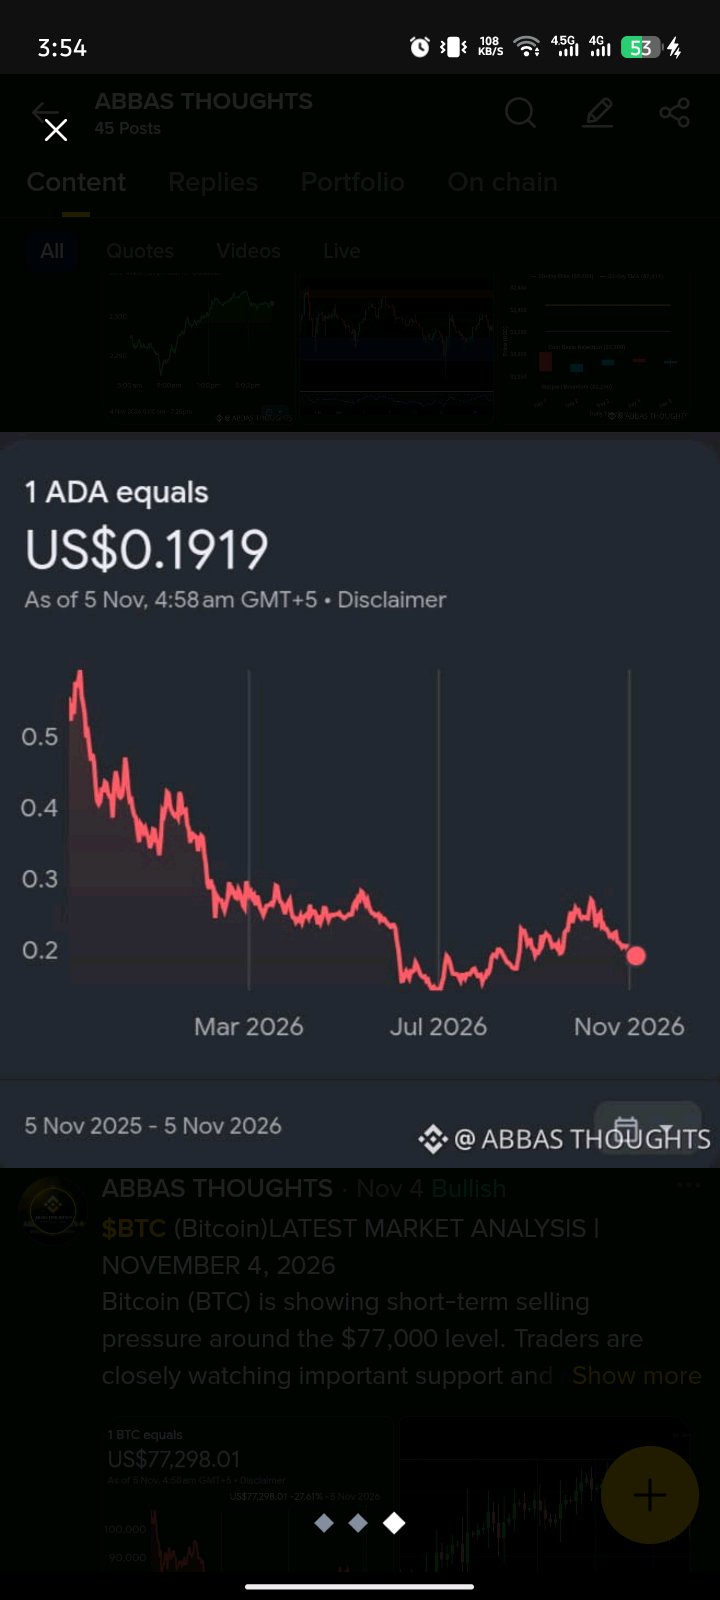
$ADAUSDT CARDANO (ADA) LATEST MARKET ANALYSIS – 5 NOVEMBER 2026 💰 Current Price: Approximately $0.198–$0.199 📊 Market Overview: Cardano (ADA) is showing a short-term recovery, gaining around 3–4% over the last 24 hours. Buyers are attempting to push the price towards the $0.20 resistance zone. However, the broader trend still needs confirmation. 🔍 Key Support Levels: - $0.1950 - $0.1888 - $0.1813 🎯 Key Resistance Levels: - $0.2014 - $0.2079 - $0.2153 📈 Bullish Scenario: If ADA breaks above $0.2014 with strong buying volume, the next potential targets are $0.2079 and $0.2153. 📉 Bearish Scenario: If ADA fails to hold $0.1950, selling pressure could push the price towards $0.1888. 🔥 My Trading View: ADA is showing signs of a short-term recovery, but confirmation above resistance is important. Traders should watch volume and candle-closing prices before entering a position. ⚠️ Risk Management: Avoid entering trades without confirmation. Always use proper stop-loss protection. What is your prediction for ADA? 🚀 Bullish or 🔻 Bearish? #BitcoinSlidesBelow$80K #WSOTPicktoEarn10U #MidtermsMarketWatch #USPayrollsAndRateDecisionsDriveMacroWeek #ADA #Cardano #CryptoAnalysis #BinanceSquare #Altcoins #TradingSignals #CryptoMarket


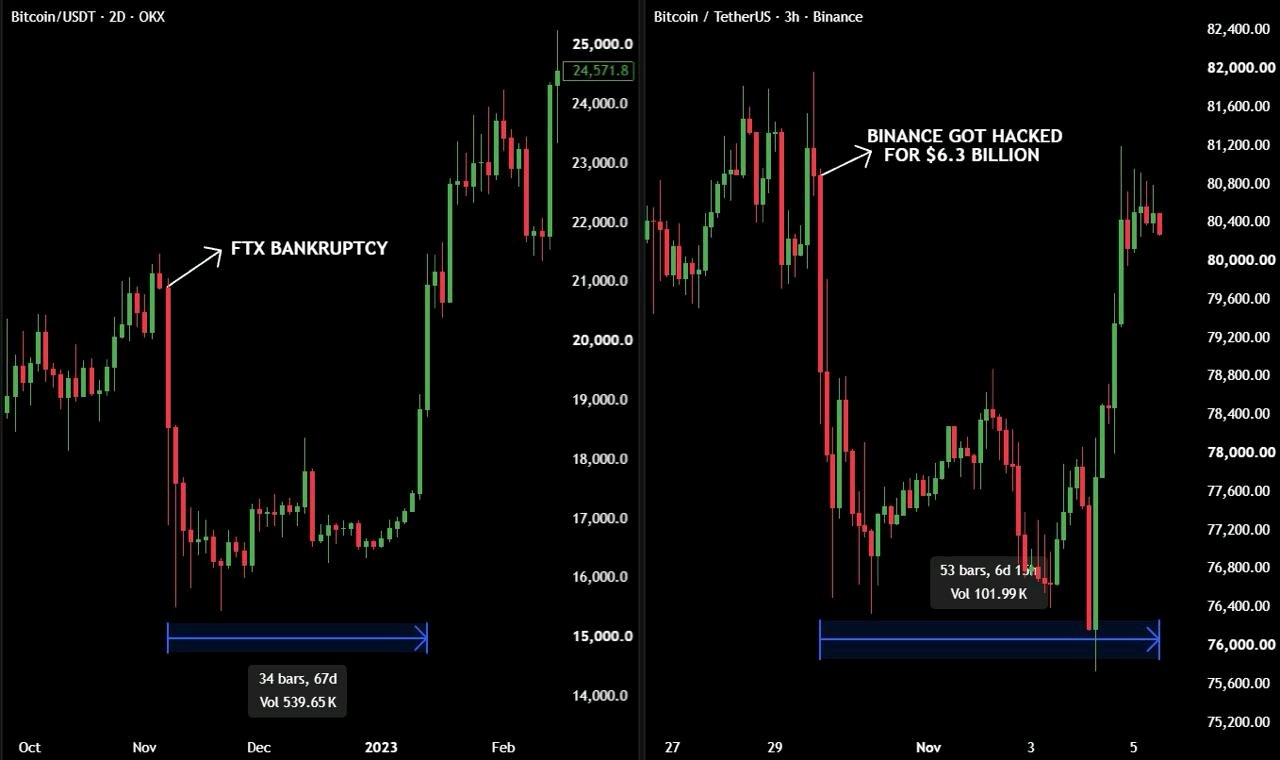
It took 67 days for $BTCUSDT to recover to its pre-FTX bankruptcy level. But after the Binance hack, it took just 6 days to reach the same level. That's a massive difference in market recovery speed. Bitcoin is showing incredible resilience, and buyers are stepping in much faster than before. Could this be a strong signal that the cycle bottom is already in? The market may be stronger than many expect. #BitcoinSlidesBelow$80K

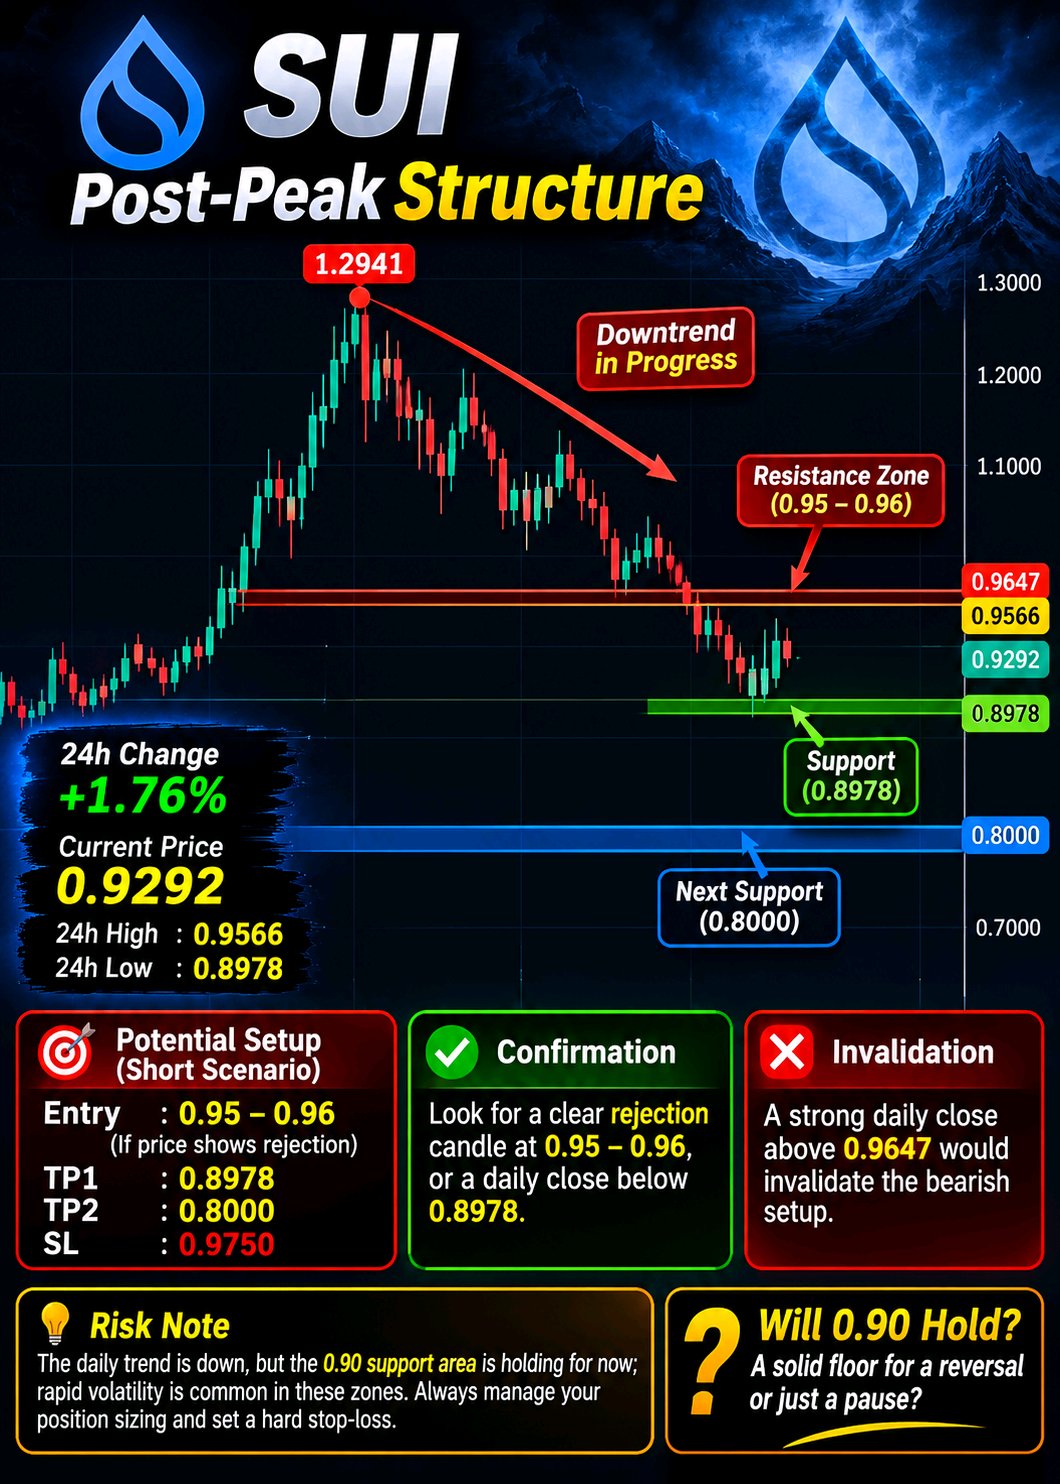
🔥 SUI: Post-Peak Structure
$SUIUSDT SUI is currently trading at 0.9292 on the daily timeframe, showing a slight intraday bounce of +1.76%. However, zooming out on the visible chart reveals a larger structural context that traders should be mindful of. 📊 Market Structure: The chart shows a massive parabolic run that topped out at 1.2941. Since that peak, the market structure has shifted bearish, characterized by a series of lower highs and lower lows on the daily chart. The price is currently in a consolidation phase, attempting to find a base around the 0.90 region after dropping from recent highs. The 24h low sits at 0.8978, acting as immediate local support, while immediate overhead resistance is seen near the 24h high of 0.9566 and the visible horizontal level around 0.9647. 🎯 Potential Setup (Short Scenario on Rejection): Given the broader visible downtrend from 1.2941, the current bounce could be viewed as a retracement before further downside. Entry: 0.95 - 0.96 (If price rallies into local resistance and shows rejection). TP1: 0.8978 (Recent 24h low). TP2: 0.8000 (Visible previous consolidation zone on the chart). SL / Invalidation: 0.9750 (Just above local resistance structure). ⚠️ Confirmation: For the short scenario to gain momentum, look for a clear rejection candle at the 0.95-0.96 resistance zone, or a daily close below the 0.8978 support level, confirming the continuation of the bearish structure. ❌ Invalidation: A strong daily close above the 0.9647 level would invalidate the short-term bearish continuation thesis, potentially indicating a shift in momentum back toward the upside. 🧠 Risk Note: Always manage your position sizing and set a hard stop-loss. The daily trend is down, but the 0.90 support area is holding for now; rapid volatility is common in these zones. This is a technical observation, not financial advice. Do you think this 0.90 area will act as a solid floor for a reversal, or is it just a pause before the next leg down? #ByXIMPACT $BTCUSDT #BlockchainSecurity #BitcoinSlidesBelow$80K

BEAM latest rally has an unusual catalyst: 984.25 million tokens connected to the October 29 Binance security incident were burned directly from the attacker's wallet. That created an unexpected supply shock and helped push BEAM sharply higher. But the rally has already cooled from its $0.0063 peak. The important question now is whether the permanent supply reduction can support another move higher, or whether the market has already priced in the event. BEAM is trading near $0.0047, up approximately 18% over 24 hours, with a market capitalization around $236M and daily trading volume near $72M. The reported 24-hour range is $0.00386–$0.00486, while the seven-day performance is approximately +41%. The immediate resistance sits at $0.00485–$0.00490, while $0.00386 is the first important support. The previous spike toward $0.0063 remains a major reference point. The token burn deserves closer attention. During the Binance incident, approximately 984.25M BEAM was transferred to the burn address through a privileged token operation. This prevented the attacker from selling those tokens and permanently removed them from circulation. However, this was an exceptional security-related intervention, not recurring market buybacks or proof of increased organic demand. The distinction matters because a one-time supply shock cannot guarantee sustained price appreciation. Beyond the immediate event, Beam is expanding its ecosystem across gaming, AI, compute and DeFi. Its official ecosystem dashboard reports more than 1.5 million ecosystem users and 250+ collaborations. Projects such as TrialXtreme, Aethir and Dreamcash demonstrate that Beam's ambitions extend beyond gaming infrastructure. Dreamcash, for example, is building a consumer trading application on Hyperliquid, while Aethir operates decentralized GPU infrastructure. These developments create broader ecosystem exposure, but their commercial growth should not automatically be treated as direct BEAM token demand. The treasury report adds another dimension. Beam's Q3 2026 treasury value increased to approximately $160.04M, up 7.72% from the previous quarter. The Foundation also disclosed holdings of approximately 12.43B BEAM, valued at $24.56M as of September 30. These holdings are spread across multiple networks. Importantly, Foundation treasury assets are not directly controlled by BEAM tokenholders, making treasury concentration and future allocation decisions relevant to supply analysis. Tokenomics is becoming particularly important after the recent burn. Approximately 50.32B BEAM is circulating against reported total supply of 57.49B. The official treasury dashboard reports more than 40.3B BEAM burned over time. There are no upcoming dated unlocks in the current unlock tracker, although treasury distributions and ecosystem allocations still deserve monitoring. BEAM is used for network transaction fees, governance, validation and in-game payments. The long-term value question is whether actual gaming and application activity creates recurring demand for these functions. Derivatives show that speculative participation is also increasing. DeFiLlama reports approximately $8.81M in open interest across tracked perpetual markets. A separate Bybit snapshot from November 4 showed $2.42M in open interest and positive funding near +0.0100% per eight hours. These figures cover different scopes, but both indicate active leveraged trading. Positive funding means longs are paying shorts, making a crowded bullish position vulnerable if price loses support. Key figures $0.0047 — Current price area $0.00485–$0.00490 — Immediate resistance $0.00386 — 24H low and immediate support $0.0063 — Recent post-burn rally peak $236M — Market capitalization $72M — 24H trading volume 984.25M BEAM — Tokens burned from the attacker's wallet 50.32B — Circulating supply 57.49B — Reported total supply 40.3B — Cumulative tokens burned, according to treasury dashboard $160.04M — Q3 treasury value 12.43B BEAM — Foundation treasury holdings $8.81M — Aggregate tracked perpetual open interest Bullish confirmation: BEAM reclaims $0.00490 and holds above it with stronger spot buying. That would put $0.0055 in focus, followed by the previous $0.0063 rally peak. Bearish confirmation: Rejection below $0.00490 followed by a clean break under $0.00386. That would expose the $0.0035 area and suggest the supply-shock rally is losing momentum. BEAM has benefited from a genuinely unusual supply event, while its broader ecosystem continues developing across gaming, AI and decentralized compute. But I would separate the permanent token burn from sustainable demand. The decisive signal is whether gaming activity, network transactions and actual spot buying can support the price after the one-time security-related catalyst fades. The supply has changed; now the market needs to prove that demand has changed too. $BEAMUSDT #BitcoinSlidesBelow$80K

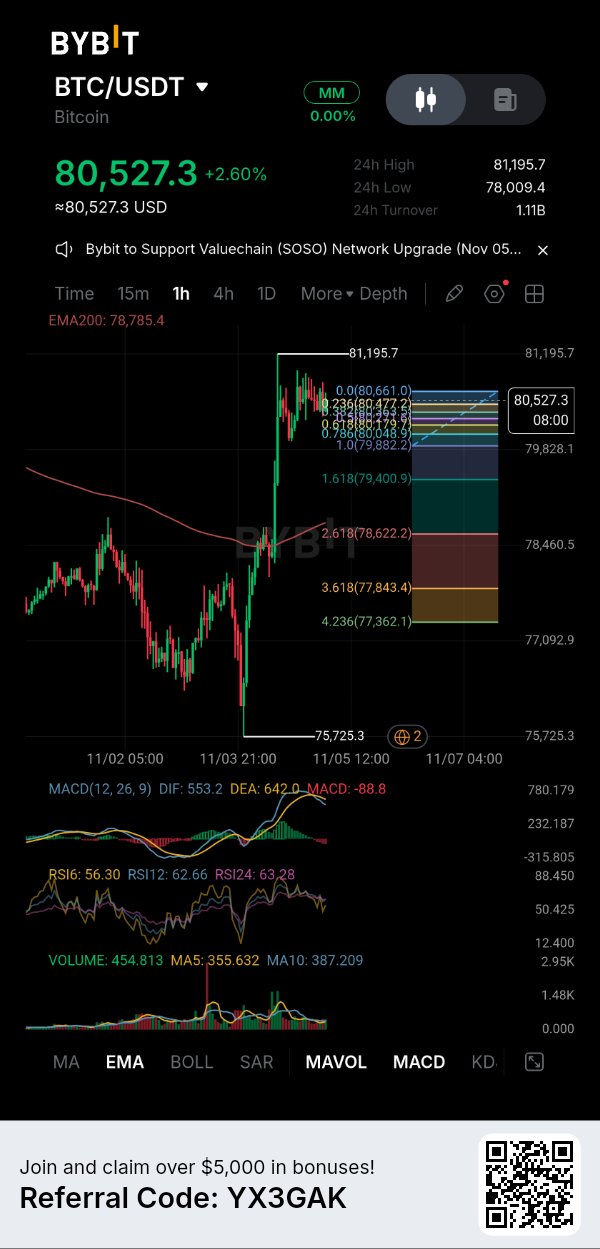
$BTCUSDT has just pushed into a high-level consolidation range, but the chart is showing a detail I would not ignore: price is retracing from its local high while 1H MACD is printing a bearish crossover That creates a very different setup from a clean continuation backed by expanding momentum On 60min chart, BTC is trading around 80,527.3, up 2.60%, with a visible 24H high of 81,195.7 and low of 78,009.4 structure has vastly improved from the recent capitulation. Price moved from the absolute bottom near 75,725.3 into a massive vertical expansion, and it is now sitting comfortably above the EMA200 at 78,785.4 MACD is showing a warning sign, with DIF at 553.2, DEA at 642.0, and a negative histogram near -88.8. Momentum has therefore started to roll over on the immediate timeframe, even as the macro structure remains bullish. So technically, the short-term trend is catching its breath after a massive impulse. But participation tells a more complicated story. latest 1H candle shows volume around 454.813, which is actually higher than the MA5 of 355.632 and MA10 of 387.209. However, the price action is currently bearish, indicating that profit-taking is meeting the buyers RSI readings confirm this cooling off: RSI6 is at 56.30, while RSI12 is at 62.66 and RSI24 is at 63.28. In other words, BTC has produced a massive relief rally, but the immediate momentum is fading as it tests the Fibonacci retracement levels price is currently hovering right around the 0.382 level at 80,472.2. That is the first contradiction I see: the price chart looks incredibly strong above the EMA200, but the immediate momentum oscillators suggest buyers are taking a breather and locking in profits. The fundamental side makes BTC particularly interesting because this isn't just another altcoin narrativ bitcoin is the apex digital asset, the ultimate store of value, and the undisputed benchmark for the entire crypto market. That matters because the underlying asset is increasingly integrated into traditional finance through ETFs and institutional adoption. It is connected to global liquidity cycles and macroeconomic shifts rather than relying on a specific DeFi protocol or venture capital funding. It is the hardest monetary asset ever created There has also been a meaningful structural shift in the broader market, with institutional balance sheets absorbing supply But there is another layer that traders need to watch closely: liquidity and leverage. Bitcoin's market depth is massive, but during highly volatile periods, liquidity can still fragment across exchanges, especially in the derivatives markets That creates the second contradiction: Bitcoin's underlying network is the most secure and decentralized in the world, while its price on high-leverage derivatives platforms is highly prone to violent wicks and liquidation cascades driven by thin order books. For me, that makes the 79,882.2 level extremely important. If BTC can reclaim and hold 81,195 with a clear expansion in 1H volume, the current move would have stronger confirmation in that scenario, I would watch approximately 82,500 first and then the 84,000 region. My preferred pullback area is around 79,882.2 to 80,472.2, aligning with the 1.0 and 0.382 Fibonacci levels, provided the structure remains intact loss of roughly 78,785 (the EMA200) would weaken the current higher-low formation, while a deeper move under 77,843.4 would put the recent breakout structure under much more pressure. So my setup is conditional rather than blindly bullish: Breakout trigger: 81,195 with expanding volume Pullback zone: 79,882.2 to 80,472.2 Invalidation: below 78,787 TP1: 81,195 TP2: 82,500 TP3: 84,000 The bigger question for BTC isn't whether it remains the king of crypto; that thesis is undeniably strong The harder question is whether short-term demand can absorb the overhead resistance and leverage that continues to build in the market. Right now, the chart says a powerful rally has arrive next move needs to show real spot participation and a reclaim of the highs, otherwise the cooling RSI will give way to a deeper retracement into the lower Fibonacci levels #ByXIMPACT #BitcoinSlidesBelow$80K $ETHUSDT


comprehensive technical analysis of the HYPEUSDT
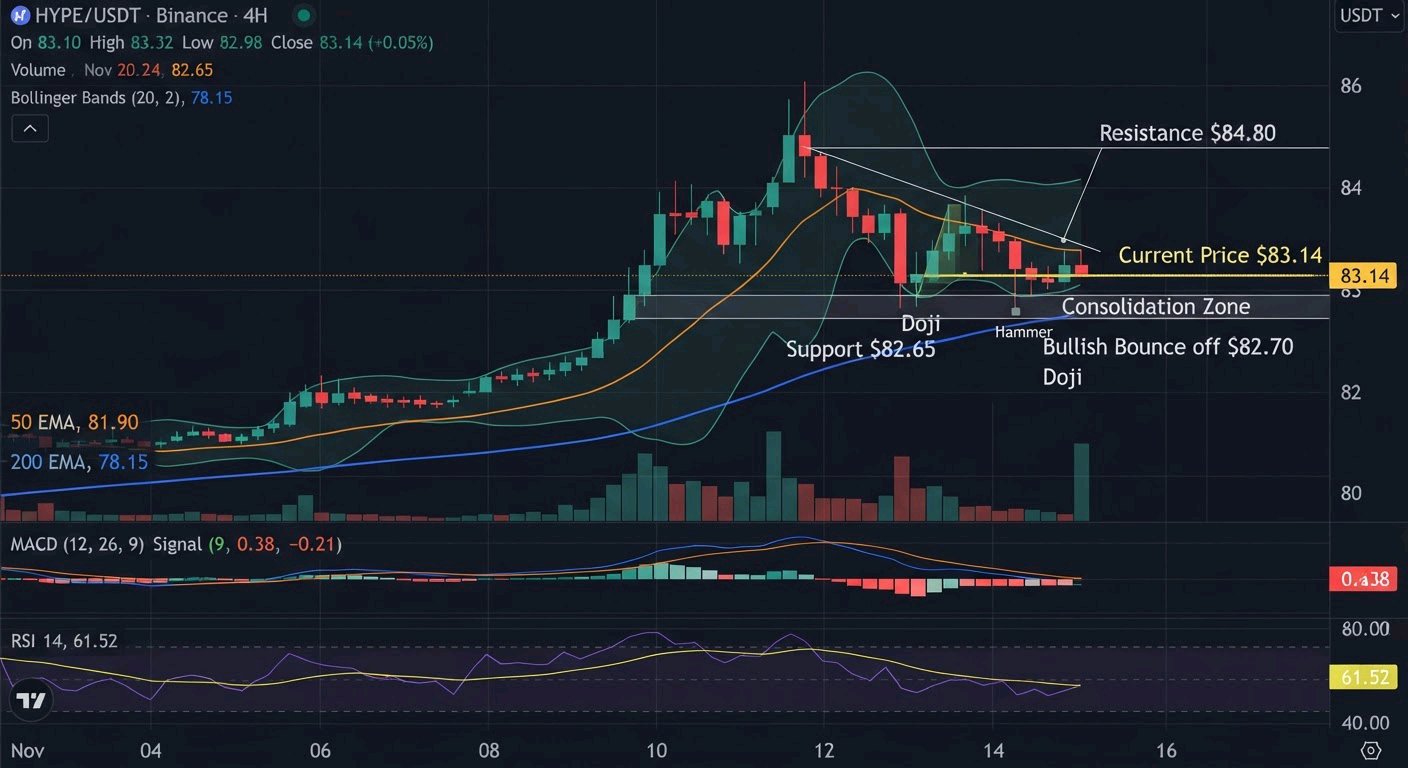
$HYPEUSDT Price Action & Trend Overview Current Price: $83.45 USDT 24-Hour Performance: Down -1.45%, showing mild bearish pressure after testing higher levels. 24-Hour Range: High: $88.90 Low: $82.76 Recent Structure: After a sharp rejection near the $88.50–$88.90 zone, price has pulled back into a consolidation range around $83–$85. The structure remains range-bound with a slight bearish bias on the 4H, following the failure to sustain the recent highs. Moving Averages (EMA 7, 14, 28) EMA 7: $84.12 EMA 14: $84.68 EMA 28: $85.05 Analysis: Price is currently trading below all three short-term EMAs, which are flattening after a prior upward slope. This alignment (price < EMA 7 < EMA 14 < EMA 28) reflects short-term bearish pressure and a loss of immediate upward momentum. Momentum Indicators MACD (12, 26, 9): DIF: -0.42 DEA: -0.28 MACD Histogram: -0.14 Analysis: The MACD remains below the zero line with a negative histogram, indicating fading bullish momentum. Histogram bars are mildly contracting, suggesting the selling pressure is not accelerating aggressively yet. Volume: 24h Turnover: ~$1.1B USDT Volume has moderated after the earlier spike that accompanied the move toward $88.90. Current volume is below the recent average, consistent with consolidation rather than strong directional conviction. Order Book Sentiment Buy vs. Sell Pressure: 48% Buyers vs. 52% Sellers Analysis: Slightly skewed toward sellers, reflecting mild bearish bias in immediate order book depth. Key Levels to Watch Immediate Resistance: $84.80 – $85.20 (EMA cluster and prior pivot). A decisive break and hold above this zone would improve the short-term outlook. Immediate Support: $82.80 – $83.20 (24h low area and recent demand zone). Major Support: $80.50 – $81.50 (deeper structural level). Summary & Outlook HYPE/USDT is consolidating after a rejection from the $88.90 region. Short-term structure on the 4H leans mildly bearish while price sits below the EMA stack, but the broader daily picture remains more neutral. As long as price holds above $82.80, the range can continue; a clean break either side will likely set the next directional move. Disclaimer: Cryptocurrency trading carries a high level of risk. This technical breakdown is for informational purposes only and does not constitute financial advice. To determine the next directional move on this HYPE/USDT 4-hour chart, you can look for specific technical triggers that confirm either a continuation of the upside or a deeper correction. Bullish Confirmation Signals For the bulls to regain control: Breakout Above $85.20: A strong 4H close above the EMA cluster with expanding volume would signal renewed buying interest. EMA Reclaim + Bounce: Price reclaiming and holding above EMA 7/14 while forming higher lows. MACD Histogram Turning Positive: A shift from negative to expanding positive bars would confirm improving momentum. Bearish Confirmation Signals For bears to push lower: Breakdown Below $82.80: A 4H close under the recent low with increased volume would open the path toward $80.50. MACD Bearish Expansion: Further widening of the negative histogram and DIF staying below DEA. Lower High Formation: Failure to reclaim $85 followed by a break of the range low. What specific timeframe or indicator setup are you tracking alongside this chart to gauge your entry? #ByXIMPACT $HYPEUSDT#ByXIMPACT #USPayrollsAndRateDecisionsDriveMacroWeek #BitcoinSlidesBelow$80K #BlockchainSecurity #WSOT2026
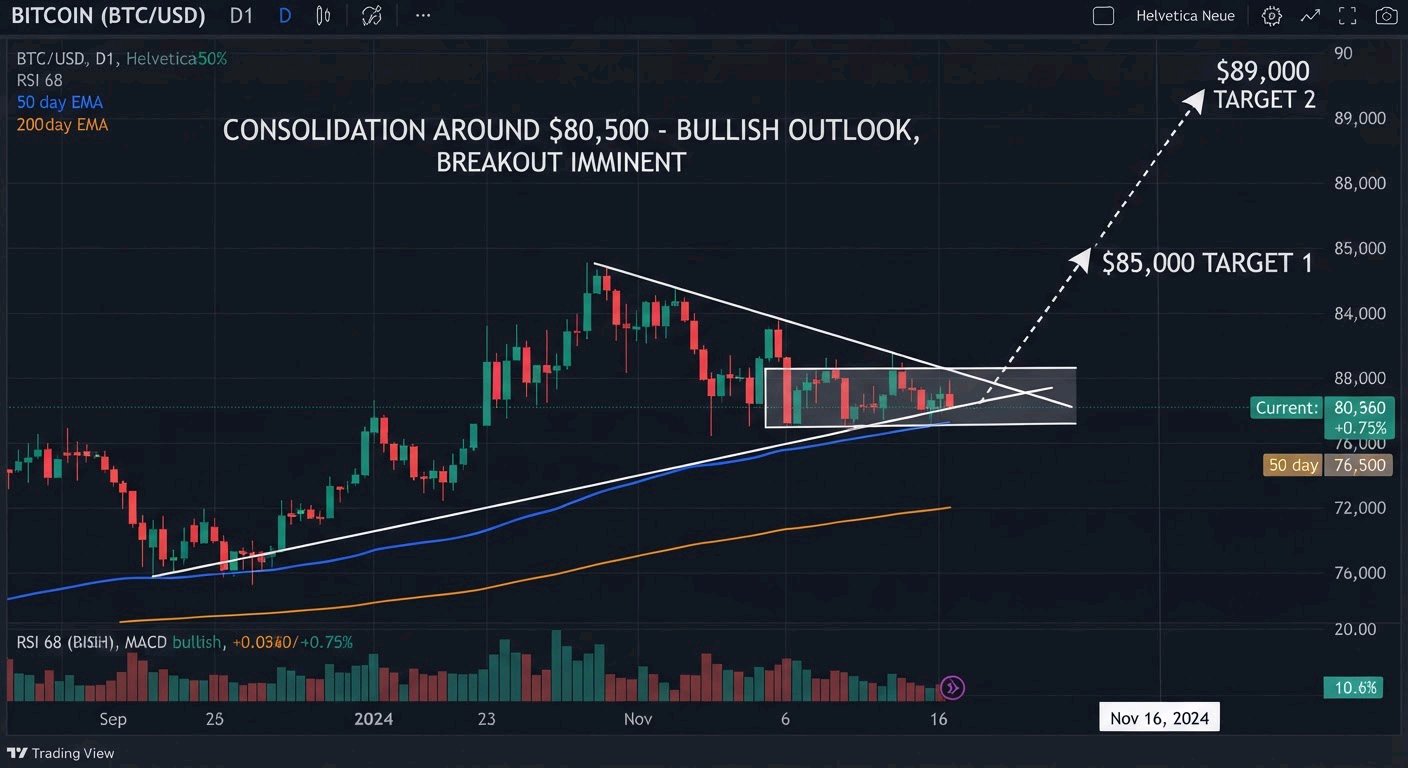
$BTCUSDT Holding the range, still targeting higher. BTC is trading around $80,500 after reclaiming the short-term structure. The move from the $75.7k–$76.2k lows has been clean, and price is now consolidating above the 200-day MA near $78.5k. This looks like a healthy pause, not a rejection of the bullish case. Here’s what I’m watching: $81,200 – $82,000 needs to be reclaimed and held. That’s the near-term bull/bear line. Clear acceptance above $82k opens the path toward $85k, then the previous local highs around $89k–$90k. I’m still constructive on the bigger picture. Strong rallies often dig in and retest before the next leg higher. Risk Management The first area buyers need to defend is $79,700 – $78,500 (recent structure + 200-day MA). A sustained daily close below $78,500 would force a reassess of the short-term bias and put $75k–$73.5k back in play. No blind averaging. Any new position needs a defined invalidation and proper size. Without an actual entry and stop, risk-to-reward stays theoretical. Higher targets remain on the table. Now I want the chart to earn them. #ByXIMPACT#ByXIMPACT #USPayrollsAndRateDecisionsDriveMacroWeek #BitcoinSlidesBelow$80K #BlockchainSecurity #PiecesOf8
Injective is making a serious push into institutional finance, but there is an important question behind the latest rally: will growing institutional infrastructure translate into sustained demand for INJ, or will token supply dynamics dilute the bullish narrative? INJ is trading near $7.69, up approximately 5.7% over 24 hours, with a market capitalization around $768.7M and daily trading volume near $79.8M. The reported 24-hour range is $7.01–$7.78, while the seven-day range stands at $6.83–$8.19. Buyers have recovered from the $7.01 area, but $7.78 is the immediate resistance. A sustained break above it could improve the short-term structure. The most important development is Injective Institutional Rail, announced on November 2. It provides banks, trading firms and enterprise applications with a dedicated connection to Injective's block-production infrastructure. The system is designed for predictable next-block transaction inclusion and pre-commitment acknowledgements, while final settlement remains controlled by the full validator network. Google Cloud, Deutsche Telekom, Kraken and BitGo are among the infrastructure participants mentioned by Injective. This is a meaningful institutional infrastructure development, although it does not disclose how much new capital or transaction volume these institutions will bring. Injective is also expanding its financial products. On October 27, the network introduced on-chain options covering real-world indices and commodities, with positions backed by native Injective USDC. Its Super Intelligence Compute Index also brings the rental costs of five NVIDIA GPUs on-chain as a tradable benchmark. These developments broaden Injective beyond conventional DeFi trading into tokenized financial products and AI-related markets. The next test is whether these products attract recurring users and meaningful liquidity. Token economics provide another important angle. Injective's latest reported community buyback burned approximately 24,007 INJ, reinforcing its revenue-funded supply reduction mechanism. The Stockdrop initiative also connects Community BuyBack participation with tokenized stock rewards. However, there is a supply-data discrepancy worth highlighting: public market trackers still show 100M INJ as the maximum supply, while a September 2026 SEC filing states total supply was approximately 122.9M INJ, reflecting staking issuance exceeding cumulative burns. The 100M figure represents initial genesis allocation, not necessarily a permanent supply cap. This distinction matters when evaluating long-term scarcity. There is also a measurable ecosystem adoption signal. Cosmos Hub approved the migration of approximately 566,067 USDC from Noble-issued USDC to Injective-native USDC. The move supports Injective's role as a stablecoin settlement hub across the Cosmos ecosystem. It is a positive infrastructure development, but the amount alone is not large enough to establish major new demand for INJ. Derivatives show increasing speculative activity. Aggregate perpetual open interest is reported near $345.3M, with funding around +0.0106% per eight hours. Futures volume is approximately 12.2 times spot volume in the latest market snapshot. Positive funding means longs are paying shorts, while the futures-heavy activity suggests leverage is playing a significant role in the rally. If INJ fails to hold resistance, that positioning could amplify a reversal. Key figures $7.69 — Current price area $7.78 — Immediate resistance $7.01 — 24H low and immediate support $6.83 — Seven-day low $8.19 — Seven-day high $768.7M — Market capitalization $79.8M — 24H trading volume 24,007 INJ — Latest reported buyback burn 122.9M INJ — Total supply reported in SEC filing $345.3M — Aggregate perpetual open interest +0.0106% — Funding per eight hours Bullish confirmation: INJ breaks above $7.78 and holds with stronger spot volume. That would put $8.00–$8.19 in focus, followed by the possibility of a move toward $8.50. Bearish confirmation: Rejection near $7.78 followed by a clean break below $7.01. That would expose $6.83, with further weakness possible if leveraged longs begin unwinding. Injective has a credible institutional expansion strategy, new financial products and a functioning buyback mechanism. But the market needs to see these developments translate into recurring network revenue and stronger token demand. The supply discrepancy also deserves attention because the scarcity argument depends on actual issuance and burn activity, not simply the original 100M allocation. The decisive signal is whether real spot demand can sustain the breakout while the network's institutional ambitions begin producing measurable economic activity. $INJUSDT #BitcoinSlidesBelow$80K


Democrats Take Congress. Crypto Reacts.
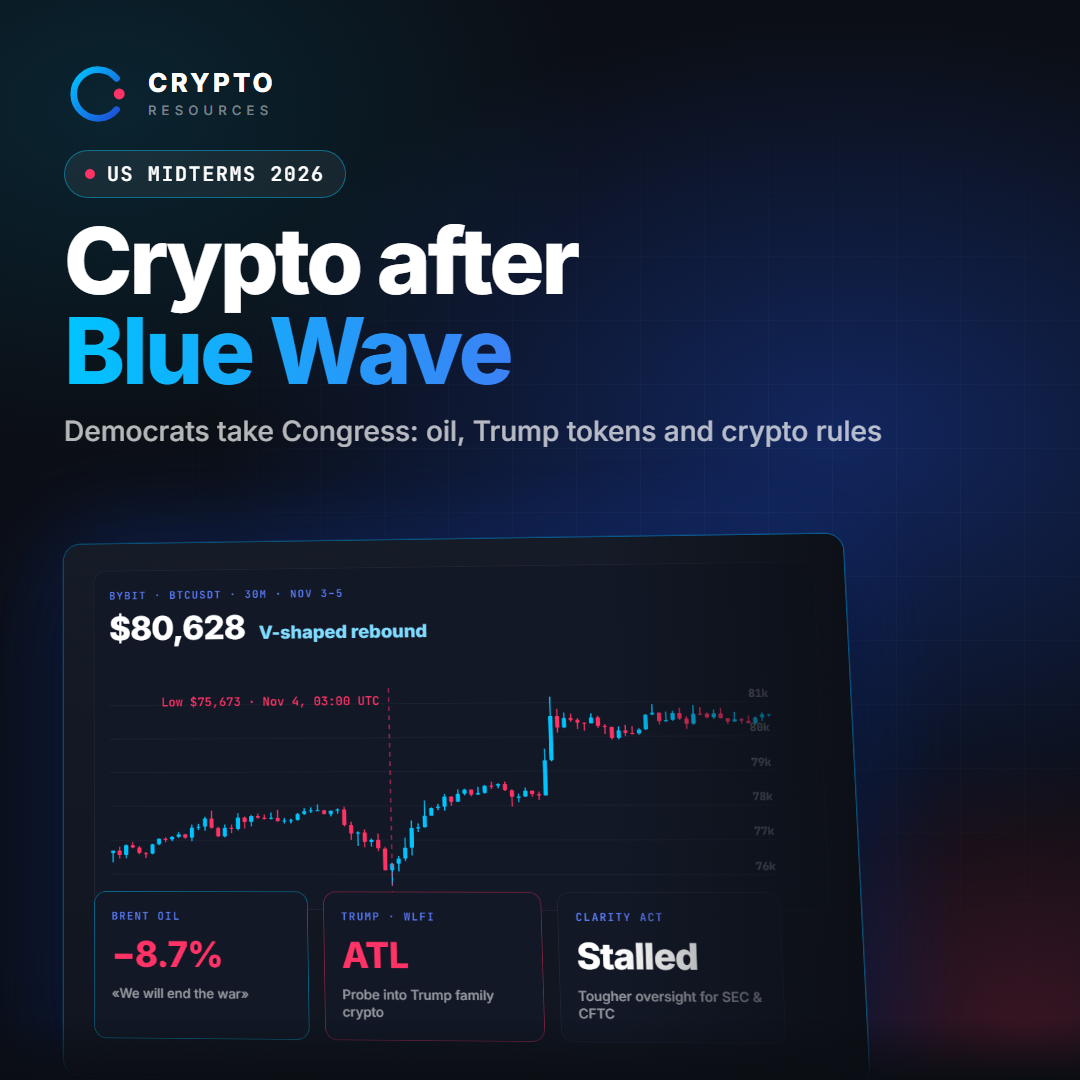
Republicans lost both chambers of Congress. Trump still controls the White House, but his crypto-friendly agenda just hit a serious obstacle. Bitcoin's reaction? A drop toward $75,600, followed by a rebound above $80,000. The interesting part is what happened beneath the surface. 🛢 Oil Is Driving the Recovery The Democratic victory increased pressure to end the Iran war. Oil prices plunged as traders began pricing in possible de-escalation. Lower energy costs could ease inflation pressure, improve rate expectations and bring buyers back into risk assets. BTC benefited. But that doesn't automatically make this a new bull market. 🔻 Trump-Linked Crypto Faces a Different Market While Bitcoin recovered, TRUMP and WLFI remained under pressure. The incoming Democratic majority is preparing investigations into Trump's business interests, including World Liberty Financial and its USD1 stablecoin. Political connections that once attracted speculative capital could now become a liability. ⚖️ The CLARITY Act Is in Trouble The crypto industry spent heavily on political influence, yet the market structure bill failed to advance even under Republican control. With Democrats taking Congress, the current version faces an even tougher path. Expect more scrutiny of the SEC, CFTC, DeFi and politically connected crypto projects. Stablecoins and institutional tokenization have a better chance of continuing under existing legislation. 📊 My Trading Read This isn't a market where every token reacts to the same headline. BTC can rally on improving macro expectations while politically exposed altcoins continue selling off. I'm watching three things: • Open interest — are traders opening fresh positions or closing existing ones? • Liquidations — is the recovery driven by forced buying? • Market breadth — is capital spreading across altcoins or staying concentrated in BTC? A price rebound without broader participation deserves caution. The new Congress takes office January 3, 2027. Until then, the regulatory framework remains largely unchanged. Washington creates volatility. Liquidity decides who gets liquidated. I track all three on Crypto Resources: Market Median for breadth, heatmaps for OI and liquidations #MidtermMarketWatch #USPayrollsAndRateDecisionsDriveMacroWeek #BitcoinSlidesBelow$80K $BTCUSDT$ETHUSDT

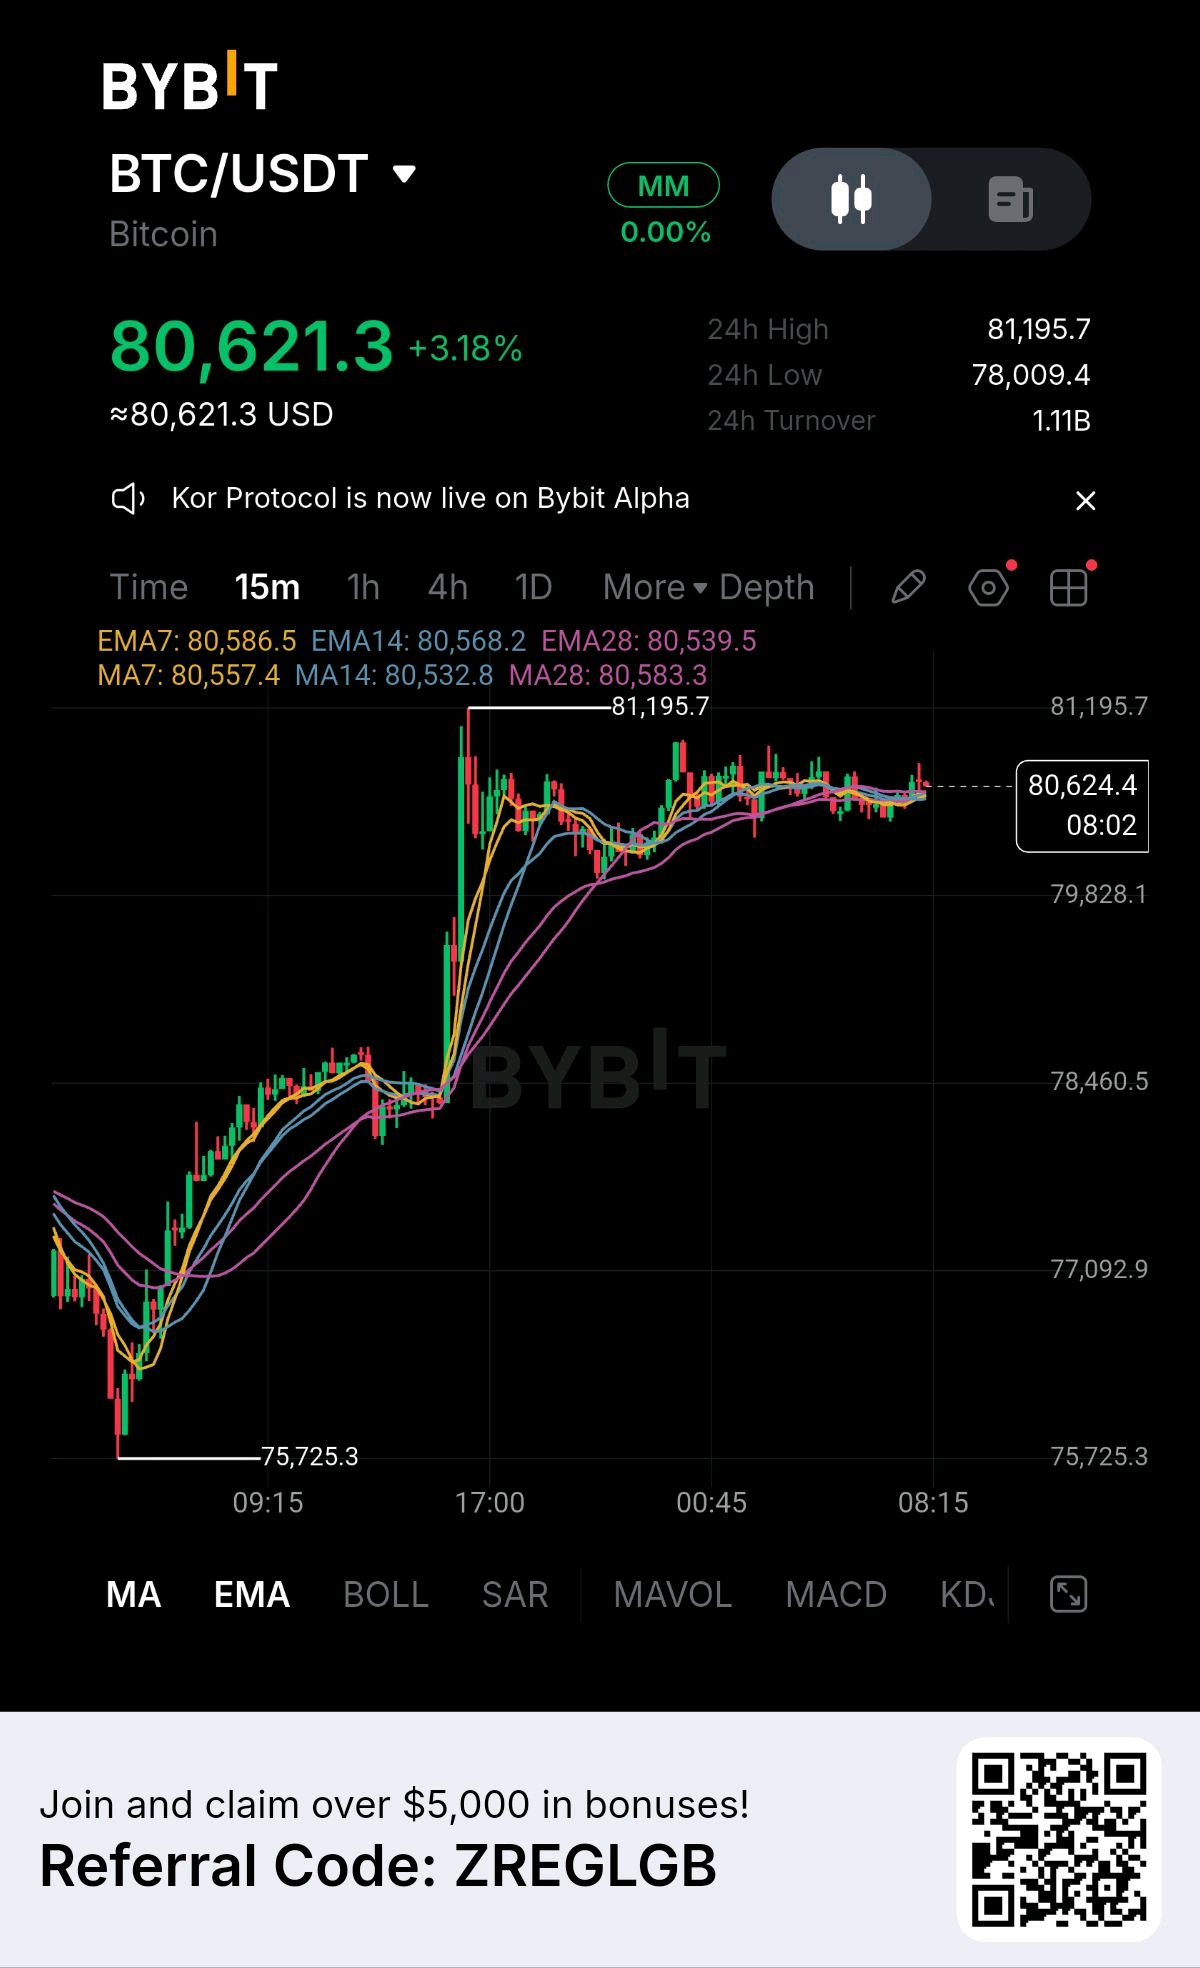
### BTC/USDT – 15-Minute Market Analysis Bullish biasConsolidation ### $80,621.3 +3.18% (24h) ### 1\. Market structure BTC has experienced a strong bullish rally from approximately $75,725 to $81,195. Currently, price is consolidating around $80,600 after the sharp upward move. * Price remains above EMA 7, EMA 14 and EMA 28. * Moving averages are tightly clustered. * Buyers still have a short-term advantage. * Momentum is cooling as the market moves sideways. Interpretation: Bullish consolidation rather than confirmed bearish reversal. ### 2\. Important price levels | Level | Price | Significance | | ---------------- | ------- | ------------------ | | Major resistance | $81,195 | Previous high | | Resistance | $80,900 | Breakout trigger | | Current price | $80,621 | Consolidation | | Support 1 | $80,500 | EMA support zone | | Support 2 | $79,828 | Key downside level | | Support 3 | $78,460 | Major support | ### 3\. Trading scenarios Bullish scenario Preferred If BTC holds $80,500 and breaks above $80,900 with strong volume: * Target 1: $81,195 * Target 2: $81,500 * Target 3: $82,000 Bearish scenario Alternative If BTC loses $80,500 convincingly: * Target 1: $80,000 * Target 2: $79,828 * Target 3: $78,460 ### 4\. Trading strategy * Long: Wait for a confirmed breakout above $80,900 or a successful retest of $80,500. * Short: Consider only after a confirmed breakdown below $80,500. * Avoid: Chasing trades in the current sideways consolidation. * Risk management: Use a stop-loss and avoid excessive leverage. ### 5\. My market prediction ### Bullish continuation – cautiously optimistic BTC buyers remain in control of the short-term structure, but the market needs a decisive breakout above $81,195 to confirm another upward leg. My key level to watch: $81,195. A rejection there could trigger another pullback before the next attempt. Analysis is based on your uploaded 15-minute chart, not live market data. These are scenarios, not guaranteed price targets. #BitcoinSlidesBelow$80K #WSOTPicktoEarn10U #WSOT2026 #MidtermsMarketWatch #USPayrollsAndRateDecisionsDriveMacroWeek $BTCUSDT
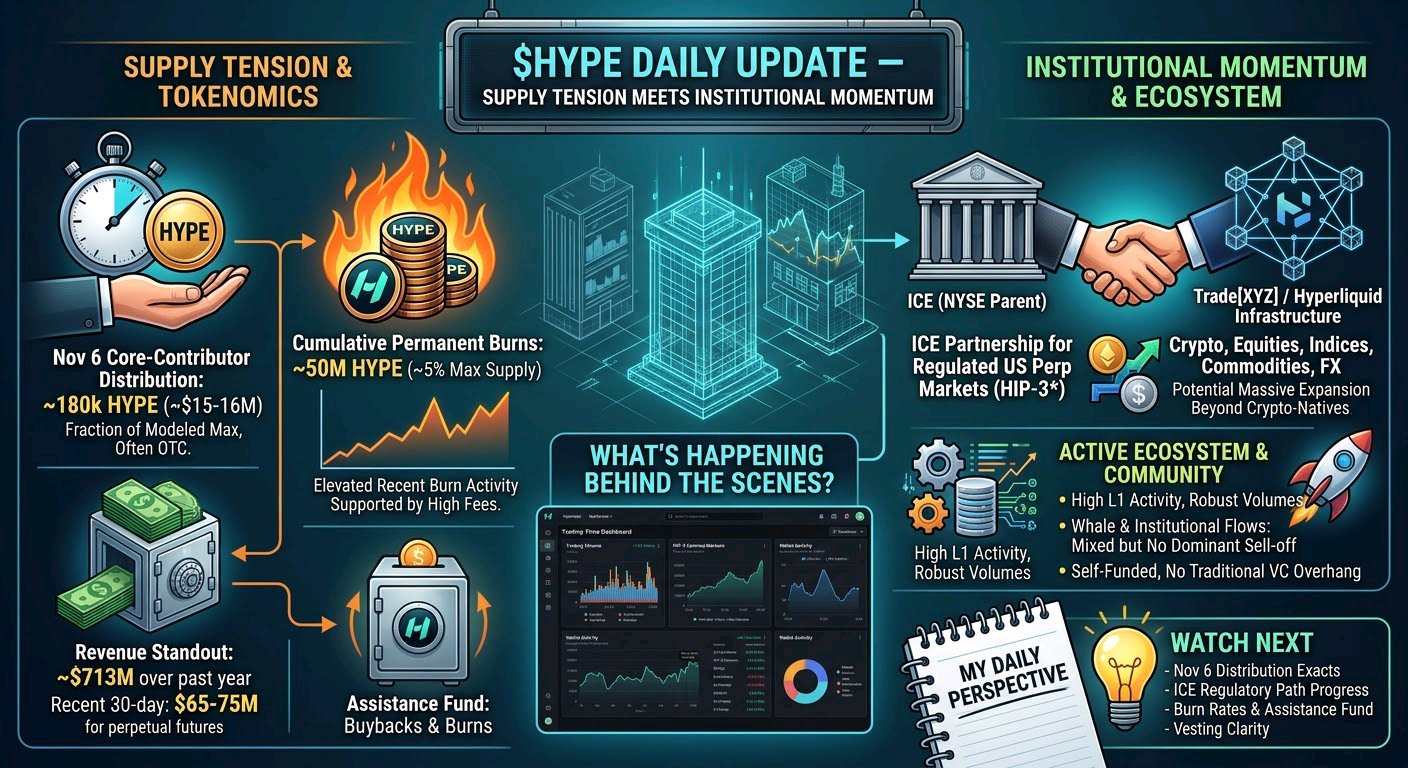
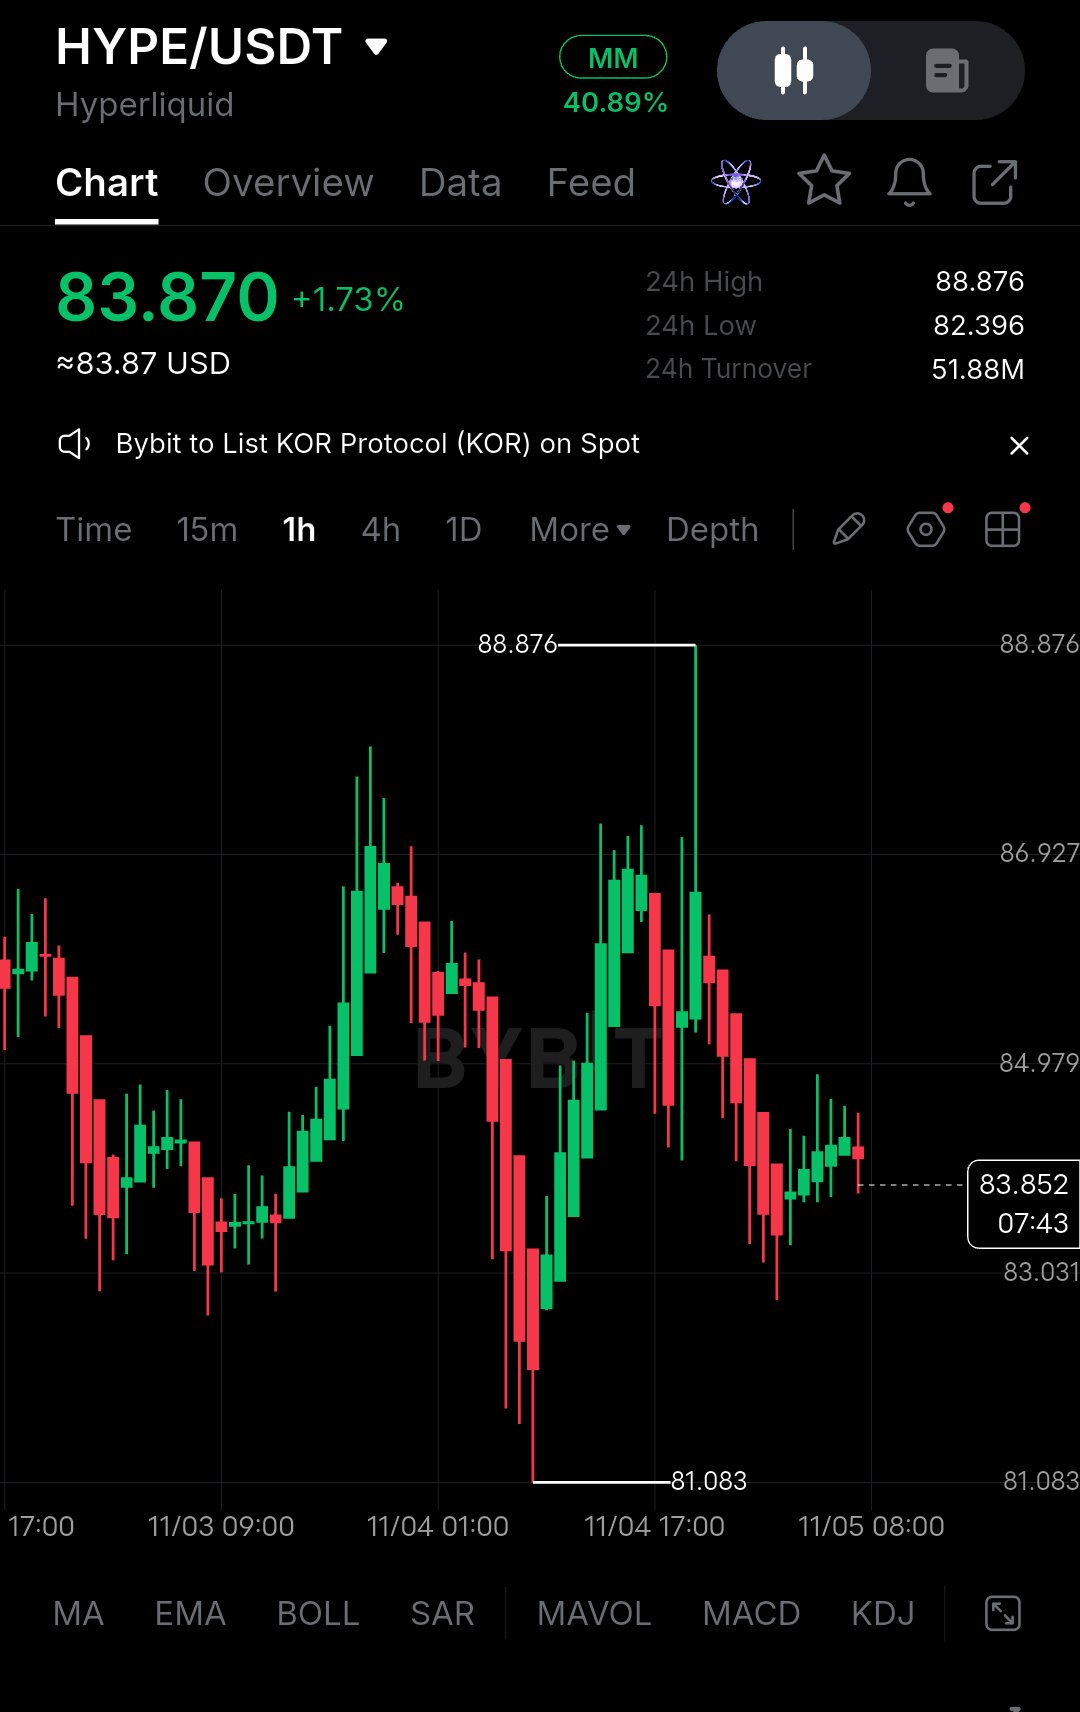
HYPE DAILY UPDATE — SUPPLY TENSION MEETS INSTITUTIONAL MOMENTUM** Hyperliquid’s HYPE is trading near $83.41 on Bybit, down roughly 1.73% over the past day after testing higher levels earlier in the week. The chart shows a market still digesting recent institutional headlines while eyeing a small but watched team distribution tomorrow.# Latest Developments The most immediate item on the calendar is the November 6 core-contributor distribution. Hyperliquid Labs has indicated a release of 180,000 HYPE for team members, valued around $15–16 million at recent prices. This is a fraction of the larger theoretical monthly vesting figures some trackers list (often modeled near 9–10 million tokens), and previous months have shown actual distributions well below the maximum modeled amounts, frequently handled via OTC rather than open-market sales. At the same time, the protocol continues to remove supply through burns. Cumulative permanent burns have reached approximately 49.87–50 million HYPE, or about 5% of the maximum 1 billion supply. Recent daily and weekly burn activity has remained elevated, supported by strong fee generation. Revenue remains a standout metric. Hyperliquid generated roughly $713 million over the past year and has posted recent 30-day figures in the $65–75 million range, driven primarily by perpetual futures trading fees. Much of that flow is directed toward the Assistance Fund for HYPE buybacks and burns. The bigger narrative from late October continues to shape sentiment: Intercontinental Exchange (ICE), parent of the New York Stock Exchange, announced plans with Trade[XYZ] to develop regulated U.S. perpetual futures markets using Hyperliquid’s infrastructure under the HIP-3* framework. The deal, subject to regulatory approvals, covers crypto, equities, indices, commodities, and FX, and drew public interest from Stanley Druckenmiller. HYPE surged sharply on the news before consolidating. # Why This Update Matters The contrast between ongoing burns and the November 6 distribution highlights Hyperliquid’s supply dynamics. Even a modest team release can create short-term overhang if recipients sell, yet the protocol’s consistent fee-driven buybacks have historically absorbed pressure. The ICE partnership, if it advances, would represent a significant step toward bringing Hyperliquid’s high-performance order book and matching technology into regulated U.S. markets—potentially expanding the addressable user base far beyond current crypto-native participants. Strong revenue and burn rates reinforce the token’s utility narrative: HYPE is not just a governance or staking asset but is actively supported by the platform’s core economics. ## What’s Happening Behind the Scenes? On-chain and market data show continued high activity on the Hyperliquid L1, with perpetual volumes remaining robust and HIP-3 external markets contributing meaningfully. Whale and institutional flows have been mixed in recent days, including some exchange deposits linked to larger holders, but no single dominant sell-off has emerged. The platform’s self-funded nature and lack of traditional VC overhang continue to differentiate it in the broader crypto landscape. ## What Should the Community Watch Next? - **November 6 distribution**: Confirm the exact amount that moves and whether any of it reaches exchanges versus OTC or remaining locked. - Progress on the ICE / Trade[XYZ] regulatory path and any additional HIP-3* deployer announcements (Payward/Kraken-related plans remain in focus). - Ongoing burn rates and Assistance Fund activity as fee generation evolves. - Any further clarity on vesting schedules versus actual monthly claims, as the gap between modeled and realized numbers has been material. ## My Daily Perspective Hyperliquid continues to operate like a real business first and a token second. The combination of genuine fee revenue, aggressive supply reduction, and high-profile infrastructure partnerships keeps it in a different category from most high-valuation L1s or DEXs. The near-term unlock is small enough that it should not dominate the narrative unless actual selling materializes, while the longer-term institutional pathway remains the more interesting story. Markets are currently treating HYPE as a consolidation story after the ICE spike—watch how the protocol’s fundamentals hold up through the next few distribution windows. The real test is whether fee generation and burns keep outpacing any new supply.#BitcoinSlidesBelow$80K $HYPEUSDT

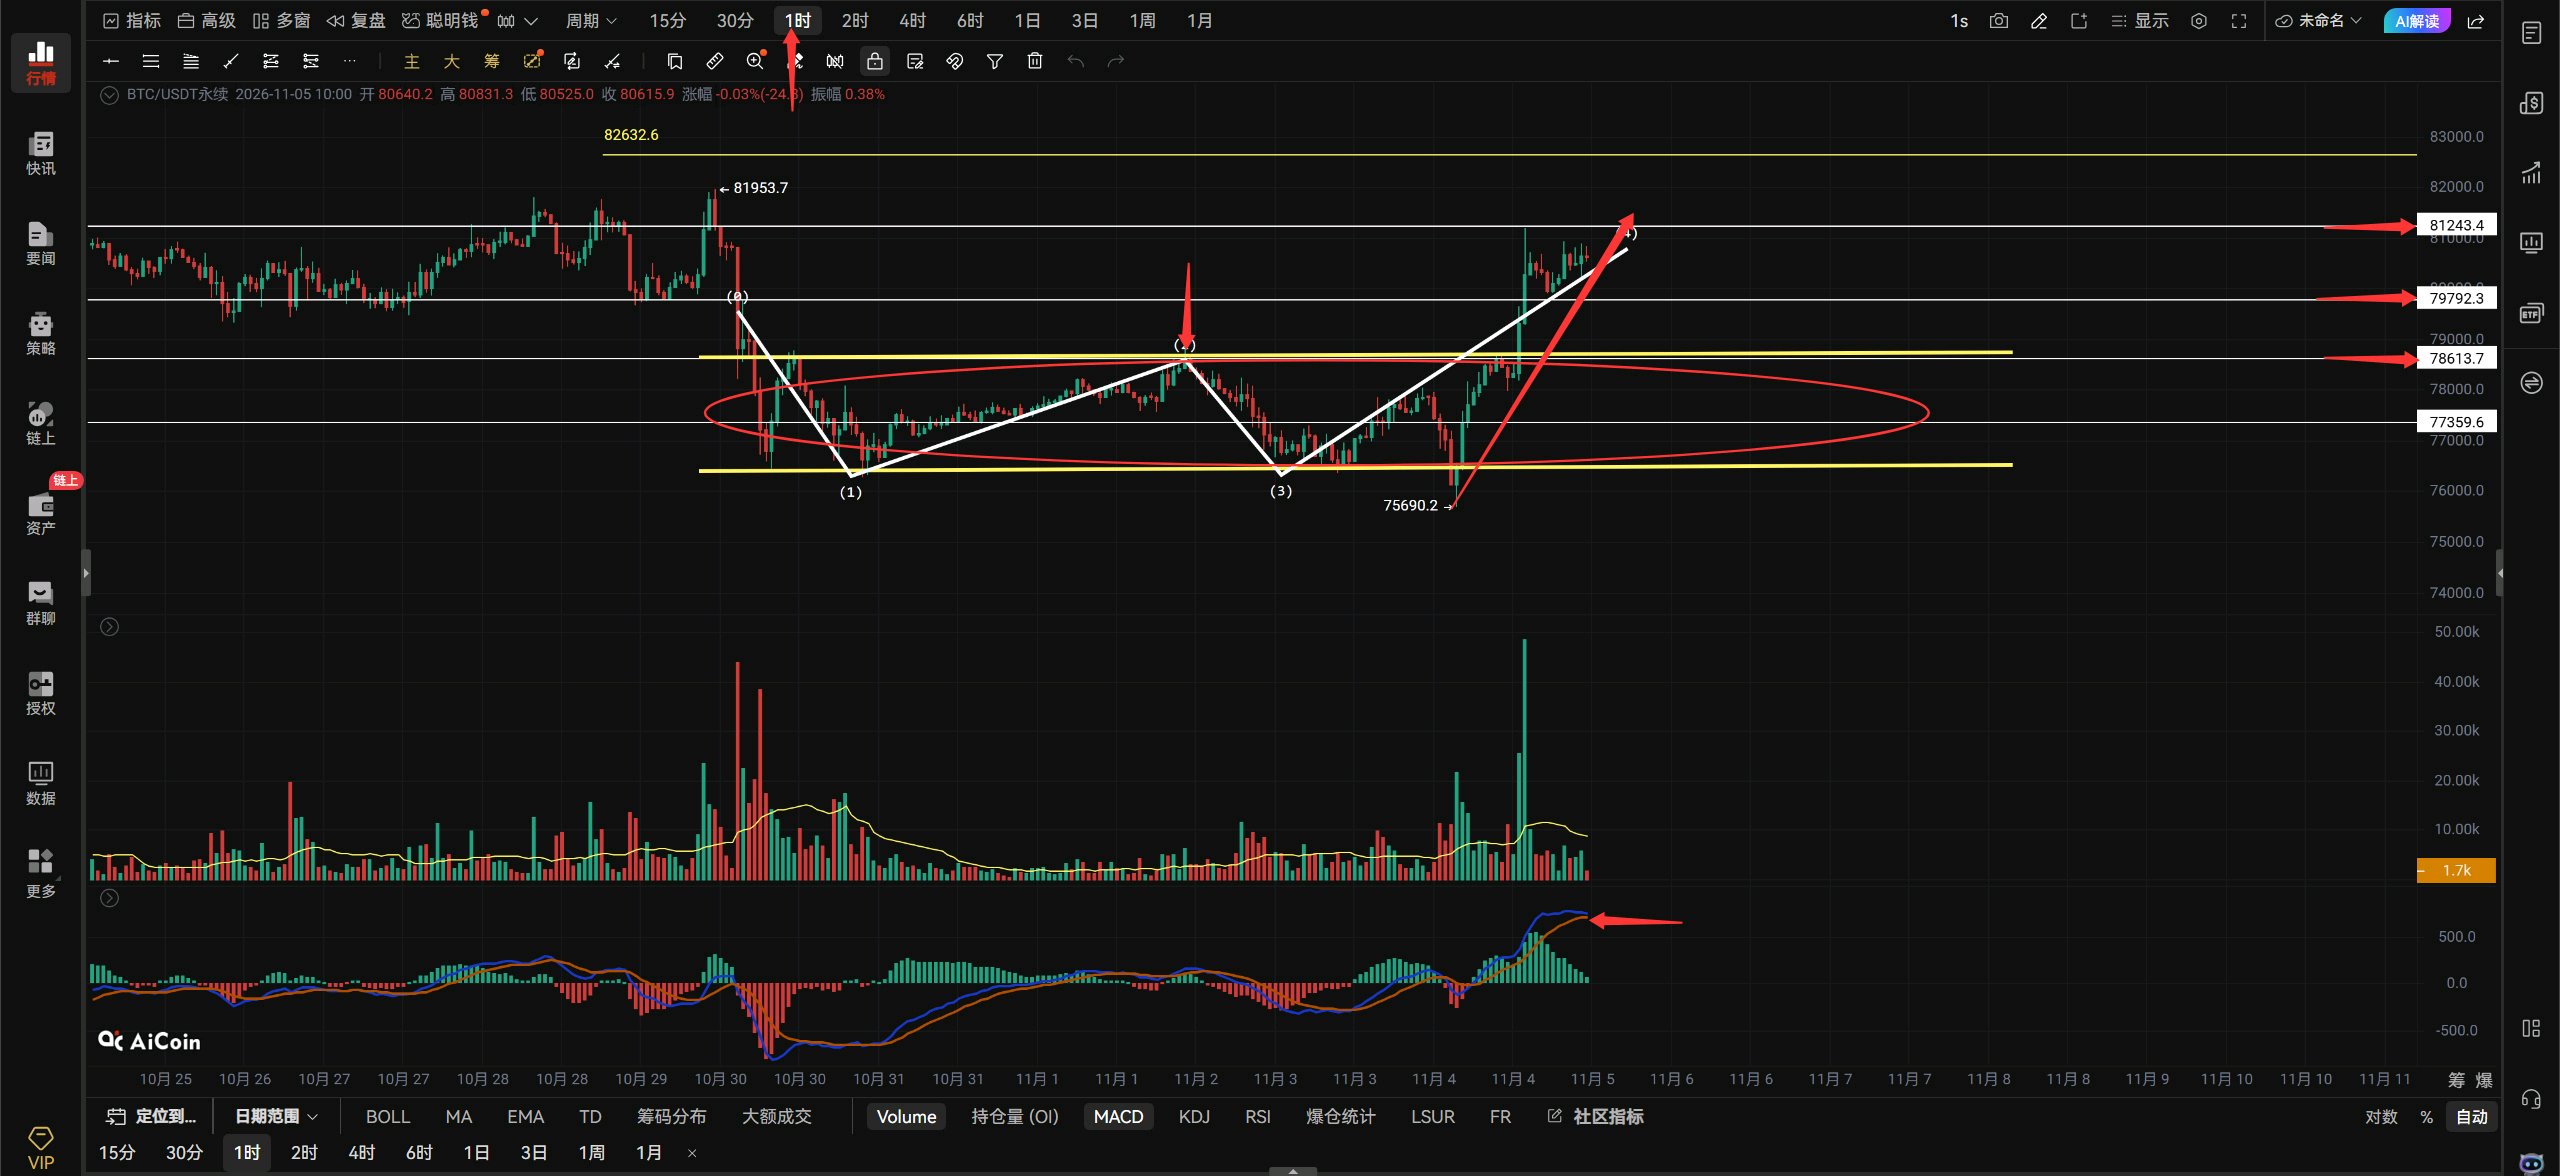
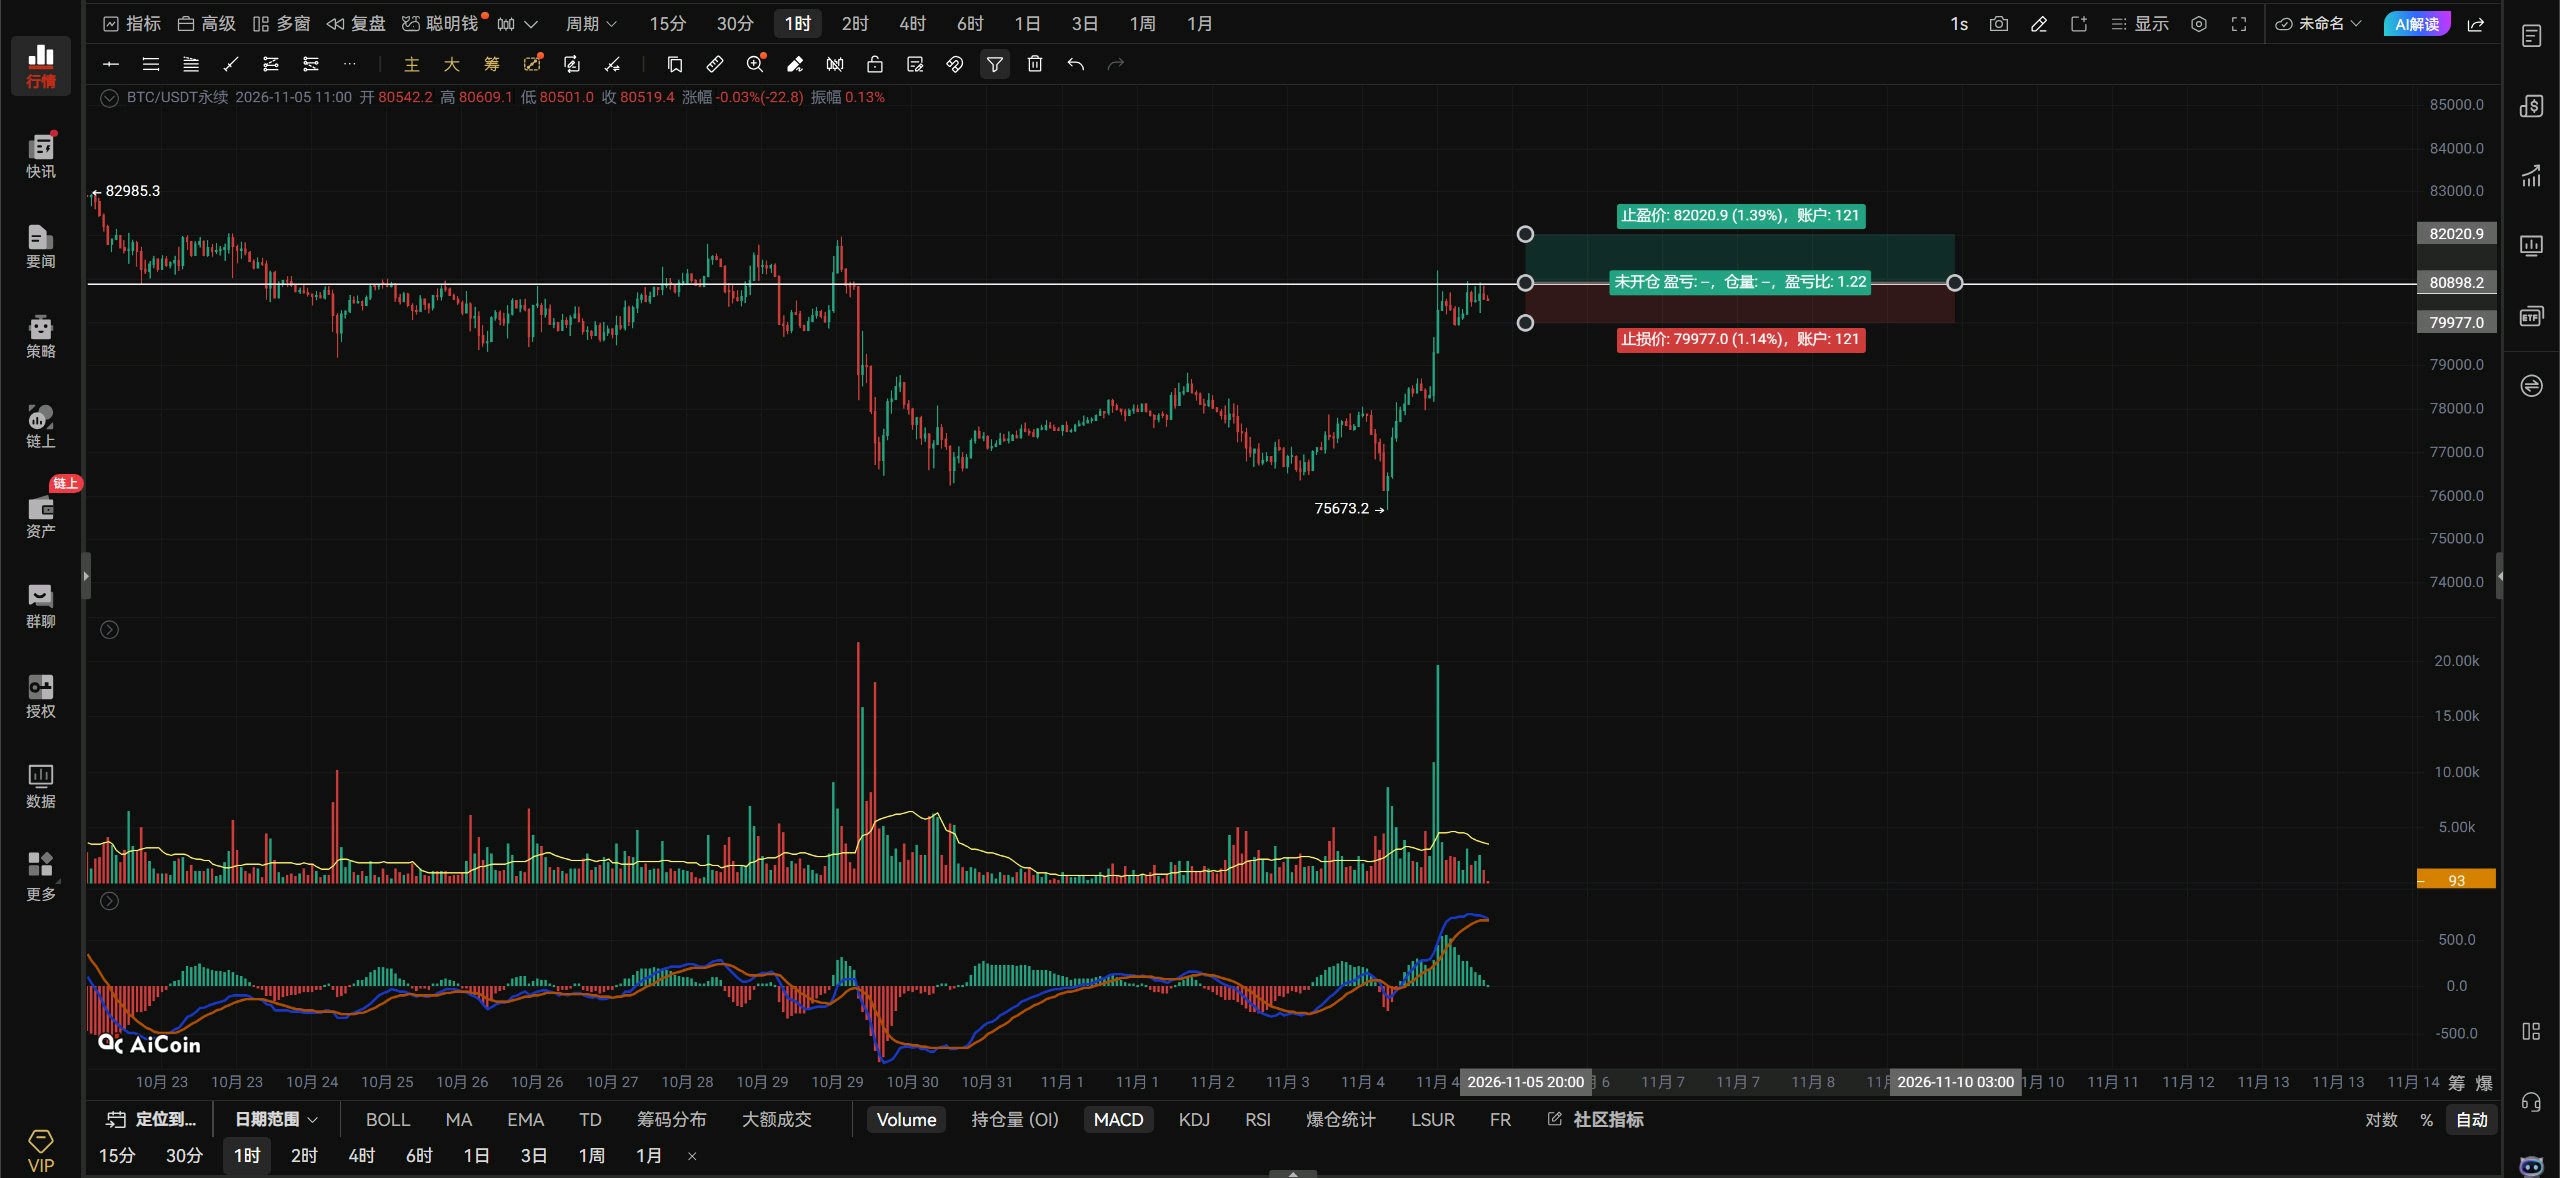
$BTCUSDT November 5 midday market outlook.👍🏻 outlook: Has this Bitcoin rally run its course? It doesn’t look like it yet, because there’s no MACD divergence below. So for now, avoid trying to call the top and short. Bitcoin is currently consolidating after its rise, with a range of 81243–79792. The hourly W bottom has formed. The consolidation area marked by the red box saw a structural break, which led to the subsequent rise to 81000. Don’t get distracted by the news—just focus on the chart, and it will give you the answers you’re looking for. Bitcoin’s breakout from the consolidation area marked by the red box ended the hourly downtrend. As long as Bitcoin holds above 79792, the hourly chart will have reversed from a bearish move into a bullish trend. Follow the rally marked by the large red arrow and look to go long on a pullback, rather than assuming it has risen too far and trying to call the top with a short. A new uptrend is already underway, so trying to short the top could mean getting in halfway up the mountain. For Bitcoin longs, watch the 79792–78613 support zone and wait for a bottoming signal there before going long. A deep pullback is nothing to worry about as long as Bitcoin stays above 78613. If it falls below 78613 on a pullback, it will most likely reverse from the highs. I also tried opening a small short position overnight, but the price wouldn’t move down and swept my protective stop, so I got out. Now I’ll wait for a pullback to go long. If Bitcoin breaks above 80856 with volume, aggressive traders can enter long on confirmation. If it breaks below 80000 with volume and a rebound fails to reclaim it, enter short on confirmation. Use a stop-loss. A confirmed hourly break above 80856 puts Bitcoin on track for 82000–82600. If it can’t get above 80856, that outlook is invalid. A break below 80000 on the 4-hour chart puts the downside targets at 78613–77359. Resistance above: 80856–82000–82600 Support below: 80000–78613–77359#ByXIMPACT #MidtermsMarketWatch #Oracle20BFundingPlanTestsTheAITrade #WSOTPicktoEarn10U #BitcoinSlidesBelow$80K

$TRUMP | Political hype can attract buyers, but sustaining demand is a different challenge. TRUMP remains under pressure following the US midterm results, struggling to recover even as parts of the broader crypto market show strength. This weakness deserves attention. Here's what I'm watching 👇 • $1.30–$1.40 as a potential support zone. • Spot volume for signs of genuine buying pressure. • Political developments that could shift market sentiment. Key takeaway: Narrative drives attention, but liquidity and sustained demand determine whether a recovery can last. #TRUMP #CryptoMarket #Bybit #BitcoinSlidesBelow$80K

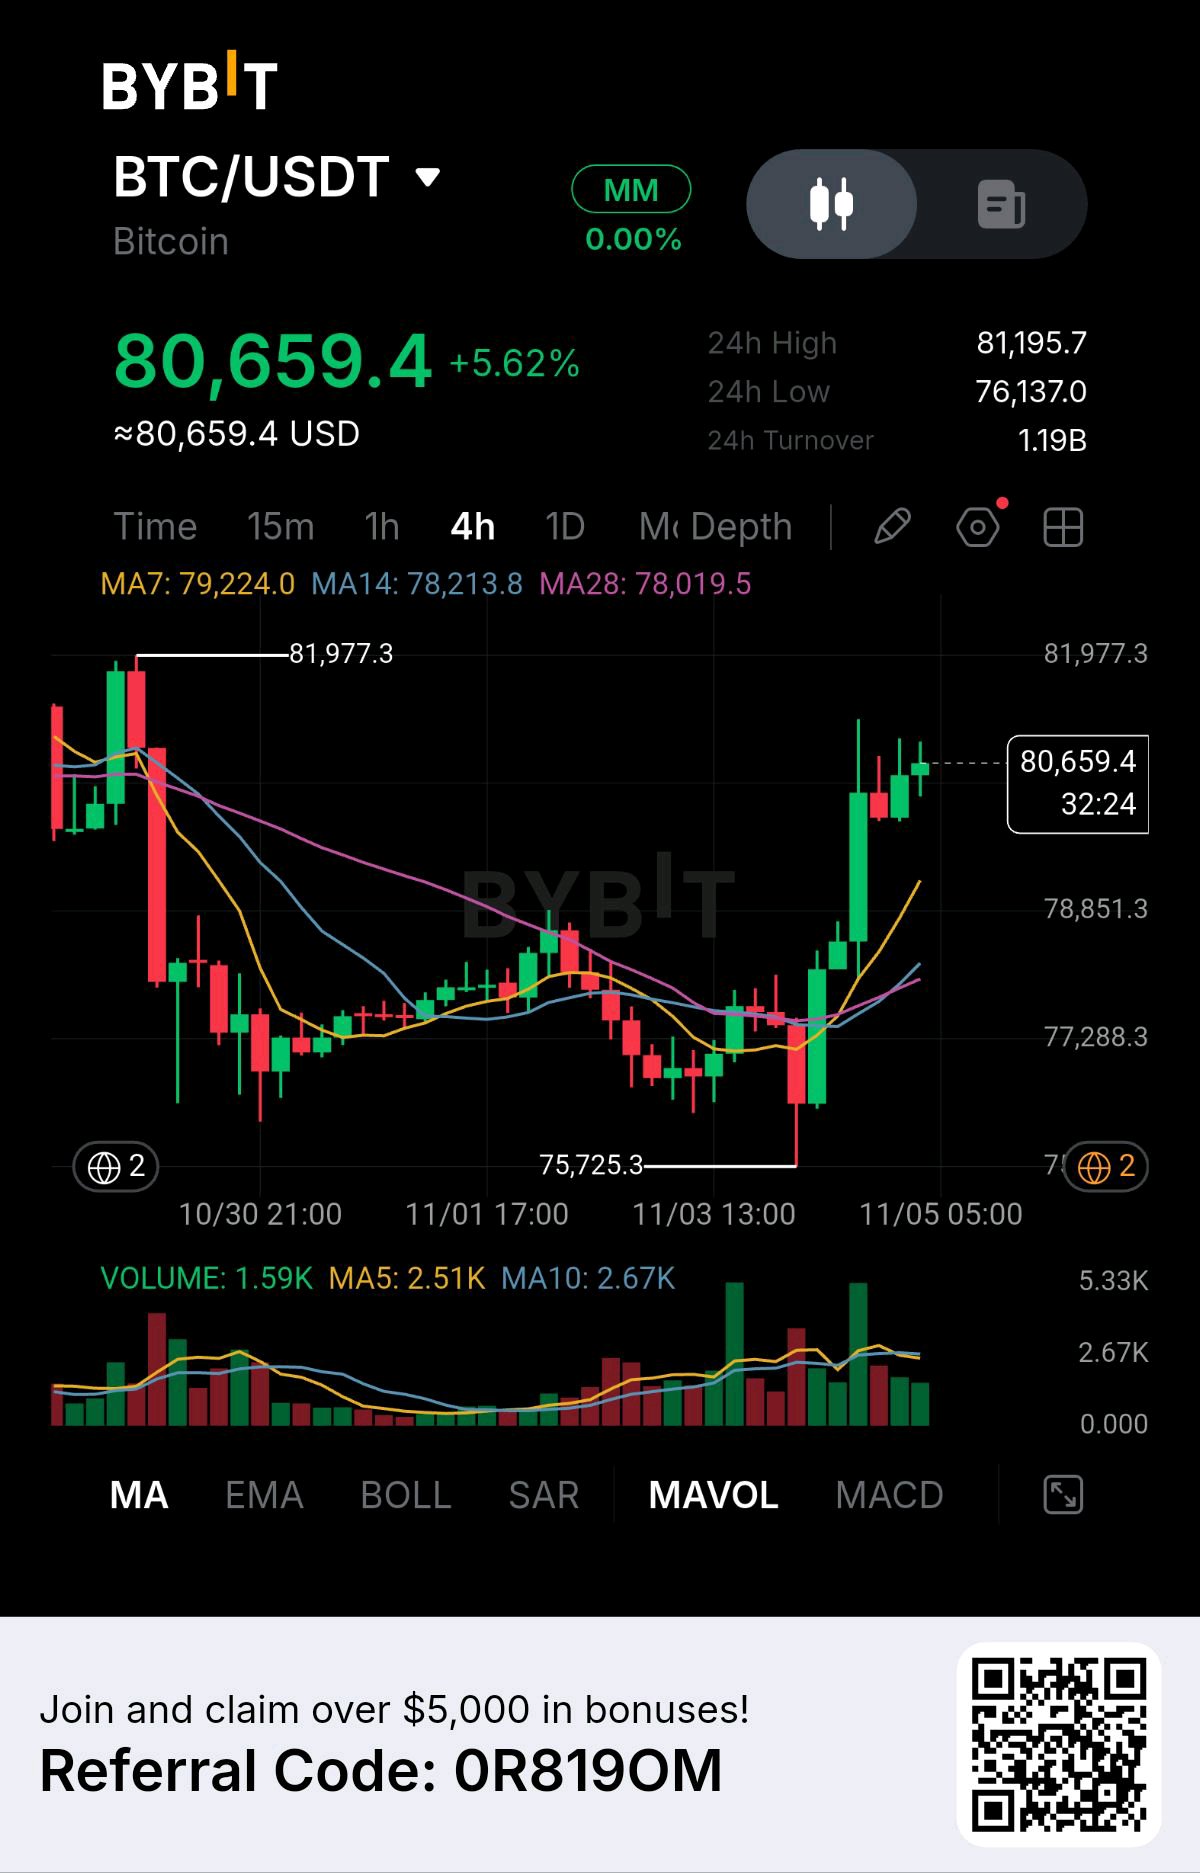
$BTCUSDT Technical Analysis Exchange: Bybit Timeframe: 4 Hours (4H) Current price: $80,558.2 24H change: +4.32% 1. Market Structure BTC is showing strong bullish momentum. From your chart: Price bounced strongly from approximately $75,725. Buyers pushed the market above $78,000. BTC has broken above the three moving averages. Price is currently consolidating around $80,558. Market bias: BULLISH 🟢 2. Moving Averages Indicator Price MA7 $79,788 MA14 $78,473 MA28 $78,122 All three moving averages are below the current price. This indicates that buyers currently have control. 3. Important Support & Resistance Resistance levels 🔴 R1: $81,000 R2: $81,977 R3: $83,000 Support levels 🟢 S1: $80,000 S2: $79,788 S3: $78,473 S4: $77,288 4. Possible Trading Scenarios Scenario A: Bullish continuation 🟢 If BTC breaks above $81,000 and confirms with a strong 4H candle: Target 1: $81,977 Target 2: $83,000 Scenario B: Bearish correction 🔴 If BTC fails to break $81,000 and loses $80,000: Target 1: $79,788 Target 2: $78,473 5. My Trading Opinion BTC is currently bullish, but buying immediately around $80,558 carries risk because price is approaching resistance. I would watch for: A confirmed breakout above $81,000. A pullback towards $80,000 with bullish confirmation. Volume confirmation before entering. ⚠️ Avoid chasing a green candle. Always use a stop-loss. ⭐ Final Verdict 4H TREND: BULLISH 🟢 Resistance to watch: $81,977 Support to watch: $79,788 One important question: Would you like me to analyse BTC for a SHORT-TERM ENTRY (15M/1H) to identify possible entry, Stop Loss (SL), and Take Profit (TP)?#ShowMyRWATrades @BybitX #BitcoinSlidesBelow$80K

HYPE title
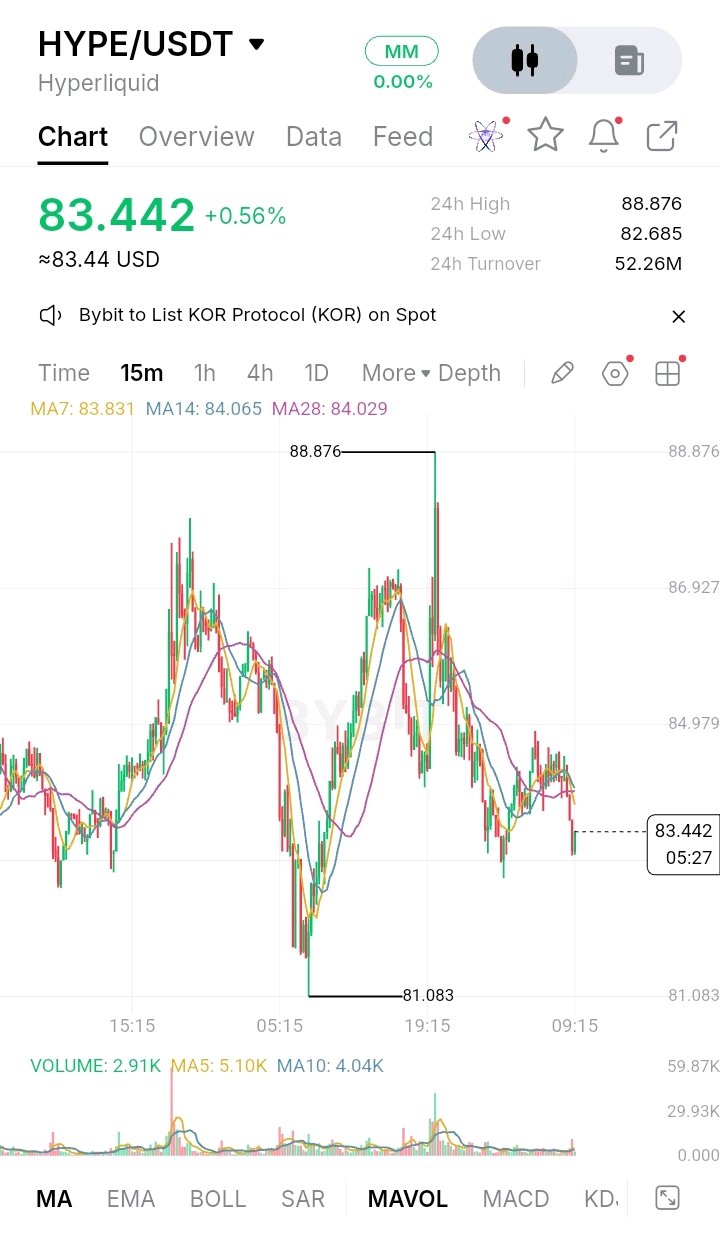
🔥 HYPE – Short-Term Bearish Setup | Trade Opportunity I'm watching HYPE closely because the 15-minute chart is showing signs of short-term weakness. Current Price: 83.442 Technical Analysis: - Price is trading below MA7 (83.831). - MA14 is at 84.065. - MA28 is at 84.029. - All three moving averages are above the current price, indicating selling pressure. - The 84.00–84.20 zone is acting as an important resistance area. - Immediate support is around 82.68, while the major visible support is near 81.08. 📉 Trade Plan – SHORT Entry: 83.30 – 83.50 (after bearish confirmation) Target Points: - TP1: 82.70 - TP2: 82.00 - TP3: 81.20 Stop Loss: 84.25 Why This Setup Works: I'm looking at the moving average structure and recent price action. HYPE is trading below MA7, MA14, and MA28, showing that sellers currently have short-term control. The 84.00–84.20 region is an important resistance zone. If the price attempts to recover but fails to break above this area, another downward move toward 82.70 and potentially 81.20 becomes possible. Trade Confirmation: Wait for a bearish rejection or a confirmed breakdown before entering. Avoid chasing the price. Risk Management: Keep position size controlled, risk only a small portion of your capital, and move your stop to breakeven after a confirmed favorable move. Stay patient, follow the levels, and trade with discipline. 🚀 $HYPEUSDT $BNBUSDT #BitcoinSlidesBelow$80K #BlockchainSecurity

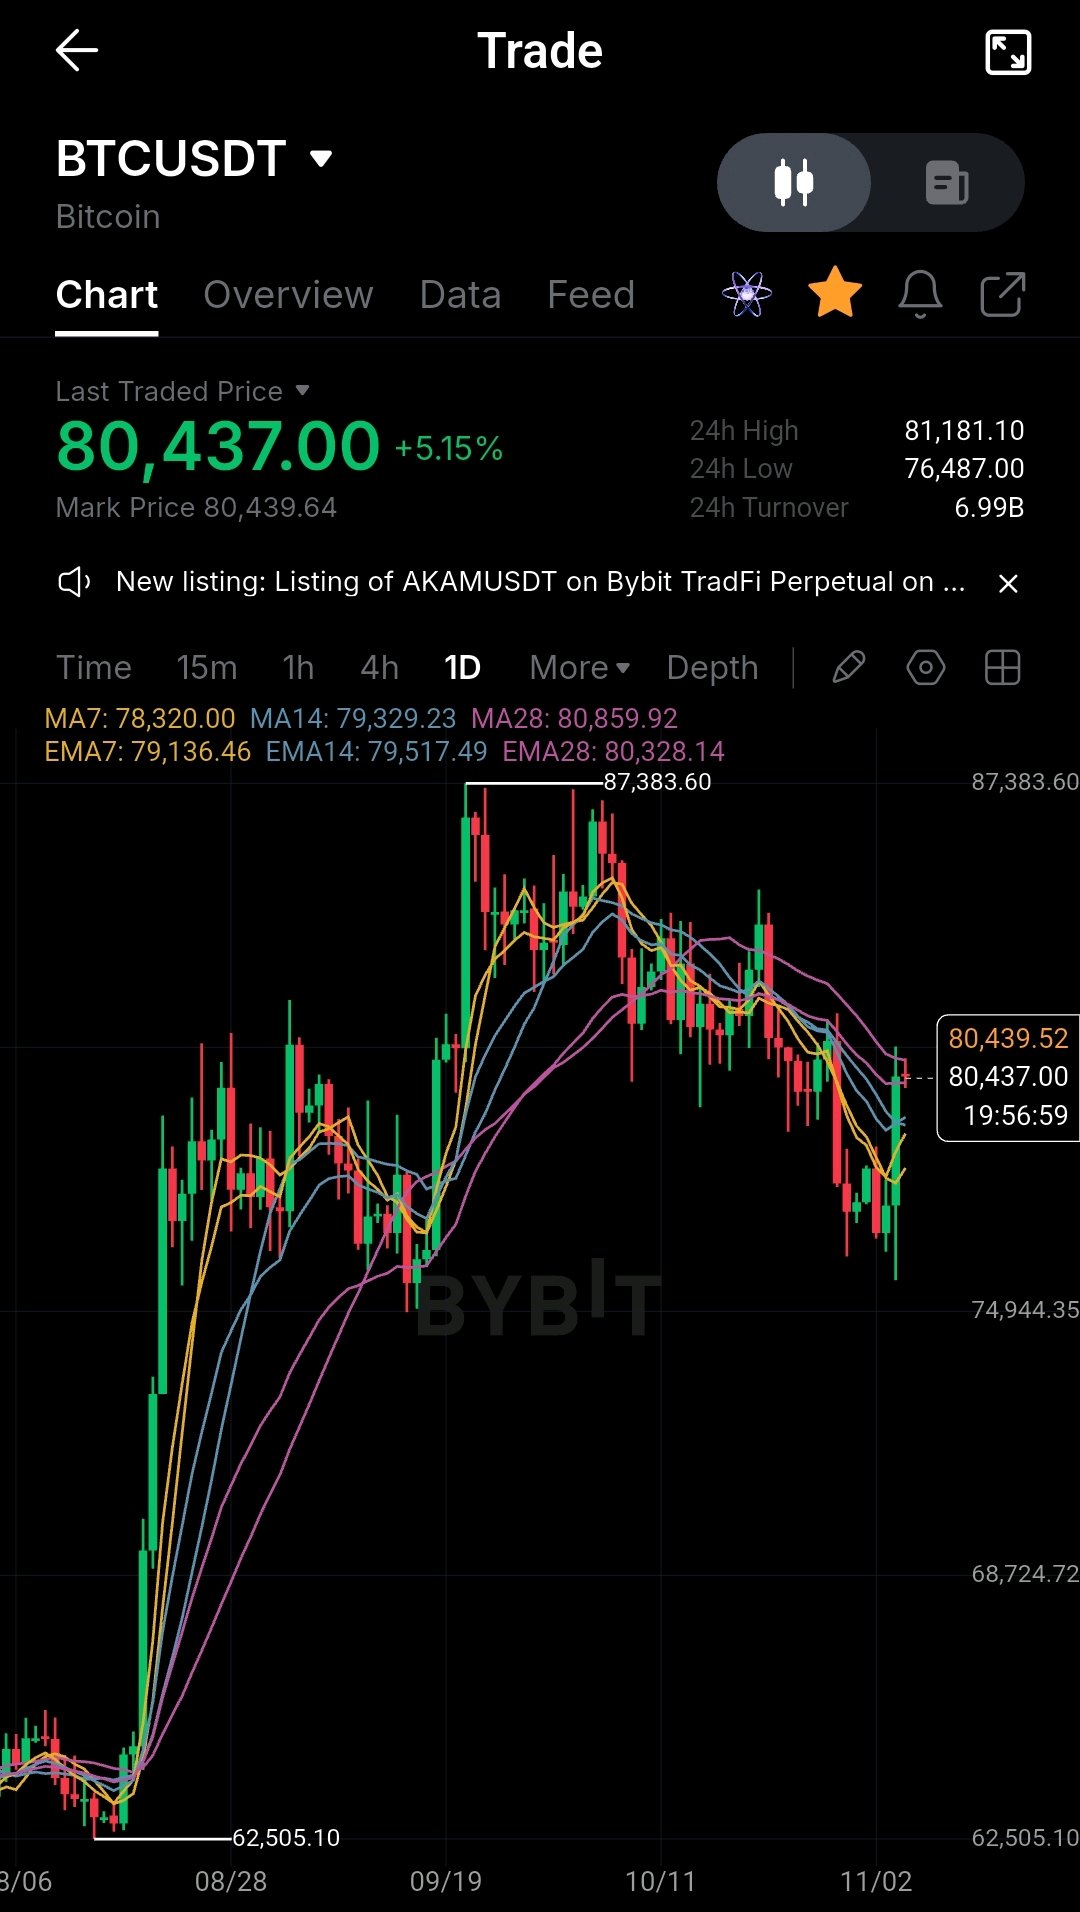
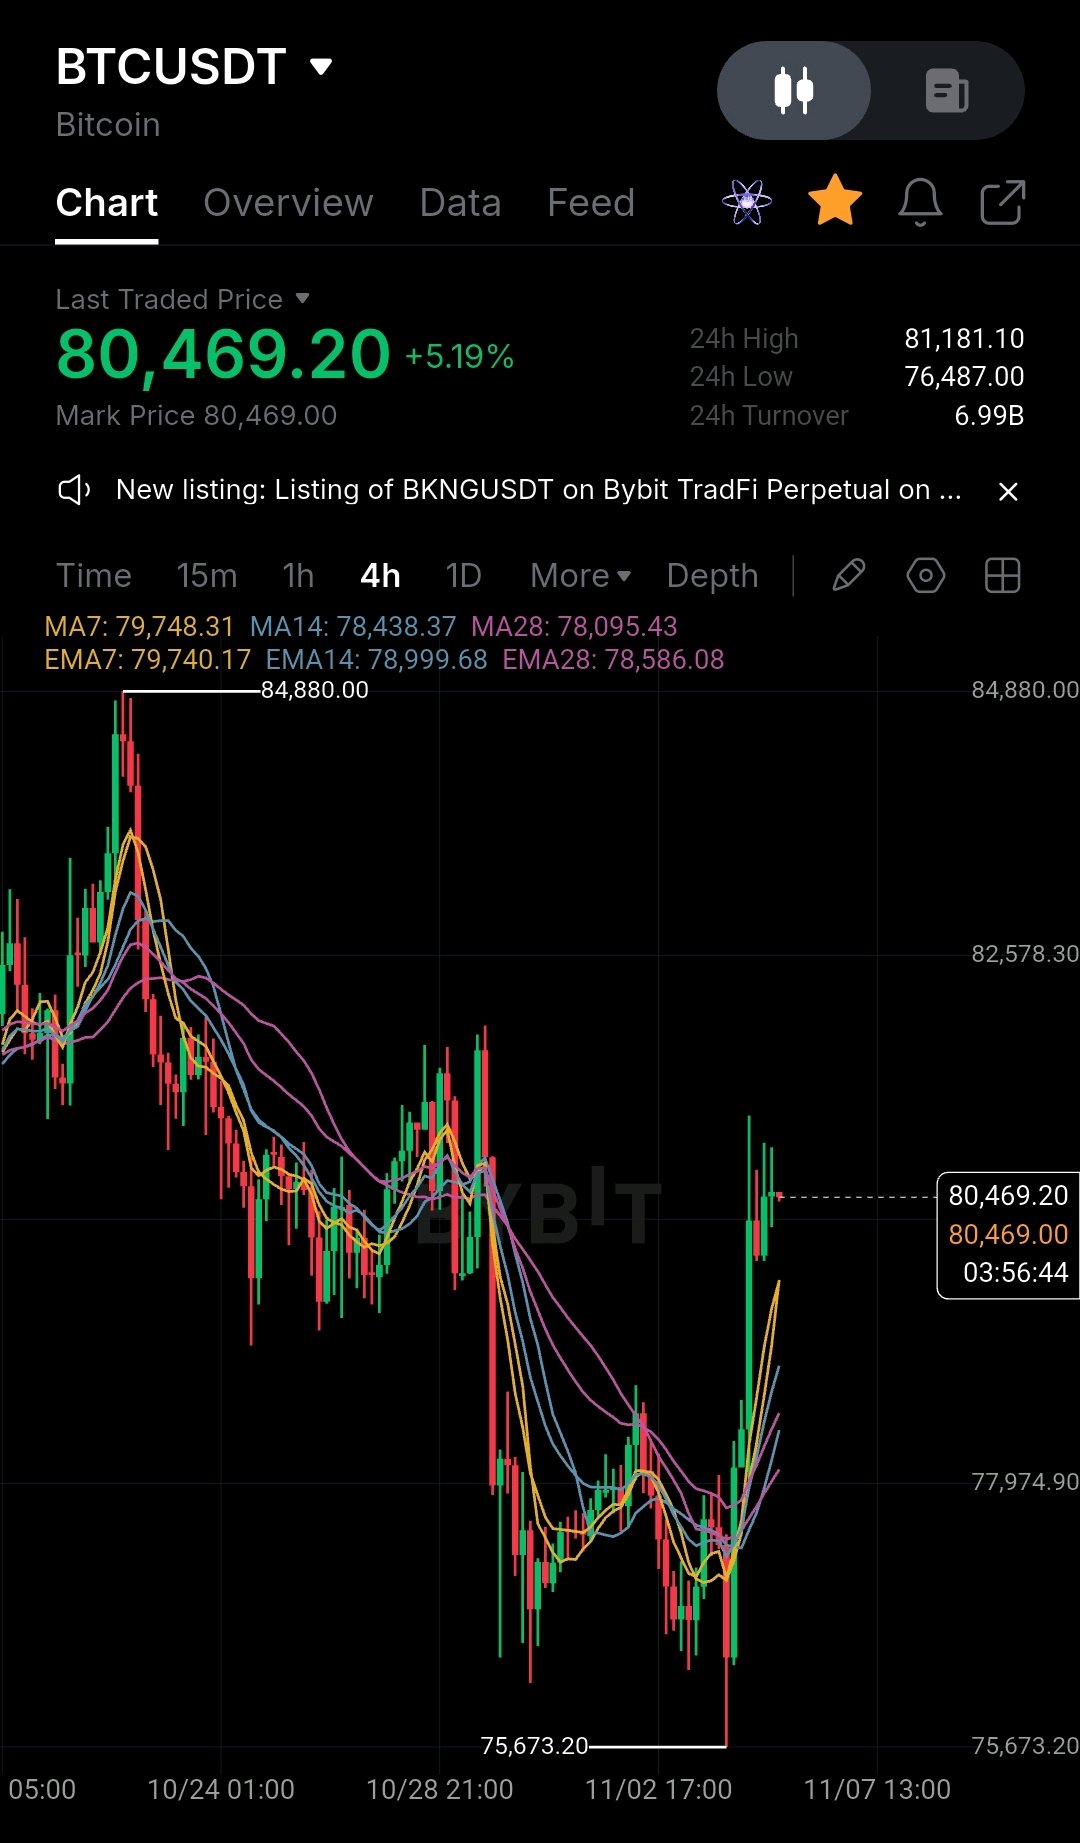
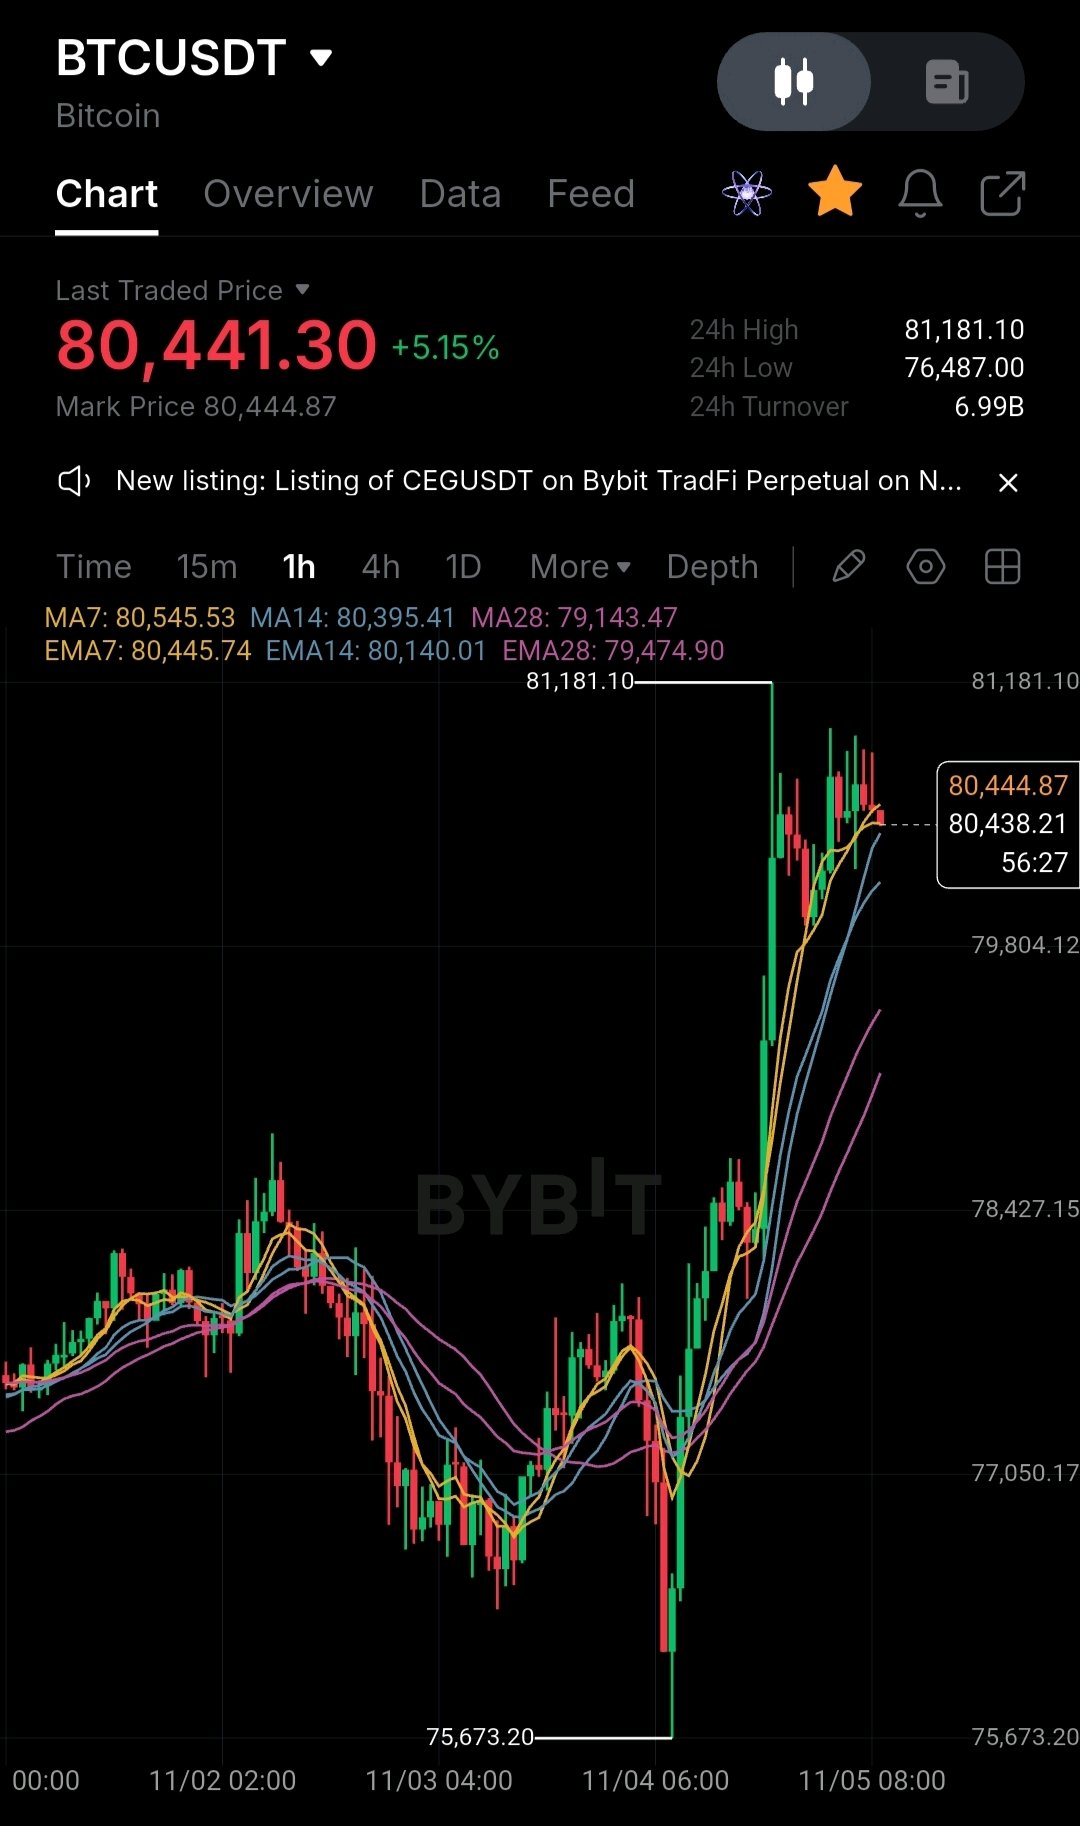
🚀 BTC/USDT Multi-Timeframe Masterclass: Bulls Defend the $80K Milestone! 📈 The crypto market is showing fierce momentum as Bitcoin (BTC) makes a decisive push, currently trading around $80,440 (+5.15% 24h) after testing a 24-hour high of $81,181 and a solid swing low of $76,487 with a robust 24-hour turnover of 6.99B. Let’s dive into a comprehensive multi-timeframe technical breakdown to map out the next major execution zones. 📊 Multi-Timeframe Technical Analysis 1. 1-Hour Chart (Short-Term Momentum & Re-accumulation) Price Action: Following a sharp impulsive recovery from recent local dips, price is consolidating right near the $80,440 level. Moving Average Confluence: The MA7 ($80,545) and EMA7 ($80,445) are acting as immediate dynamic resistance/support pivot zones. Support Cluster: Holding firmly above the MA28 ($79,143) and EMA28 ($79,474) confirms that short-term buyers maintain absolute control of the intraday trend. 2. 4-Hour Chart (Mid-Term Trend Expansion) Price Action: A textbook V-shaped recovery off the $75,673 structural low has propelled BTC back above key moving average bands. Trend Structure: Short-term MAs (MA7 at $79,748, MA14 at $78,438) have completed a bullish upward cross over longer-term bands, signaling continuation strength. Outlook: Sustaining candles above the $80,000 psychological threshold opens up a clean pathway to retest and break the upper daily resistance boundaries. 3. Daily (1D) Chart (Macro Structure & Trend Reclaim) Price Action: The macro trend is stabilizing strongly after bouncing off the major support shelf near the $62.5K–$75K region, now compressing tightly against the MA28 ($80,859) resistance band. Indicator Confluence: MA7 ($78,320) and EMA7 ($79,136) are curving upward, providing a rising structural floor for the broader macro advance. Key Level to Watch: A daily close confirmation above $80,850 – $81,200 will invalidate local overhead resistance and clear the runway for a swift march toward higher price discovery zones. 🎯 Actionable Trading Strategy & Execution Zones Bullish Continuation Entry: Look for a clean retest and hold above $80,200 – $80,450 with volume expansion on the 1H timeframe for a scalp/swing continuation toward $81,800 and $83,000. Pullback / Support Zone: If a minor liquidity sweep occurs, watch the $79,100 – $79,500 region (confluence of daily and 4H moving averages) as a high-probability bounce and re-accumulation zone. Risk Management: Maintain strict invalidation stops below $77,800 to protect capital against sudden volatility spikes. 🔥 What is your target for BTC this week? Are we locking in a new all-time high soon, or expecting a retest of lower liquidity first? Drop your thoughts below! b #WSOT2026 #BitcoinSlidesBelow$80K $BTCUSDT
bybit new events
#WSOT2026 #USPayrollsAndRateDecisionsDriveMacroWeek #BitcoinSlidesBelow$80K
Apple latest earnings delivered record revenue, but the market found something it didn't like: rising memory costs are putting pressure on the next quarter's margins. That creates an interesting setup for AAPLX, because the underlying company is performing well while investors are questioning how much profitability it can protect. AAPLX is trading near $333.08, up approximately 2.21% over 24 hours, with reported market capitalization around $12.16M and daily trading volume near $14.19M. Its 24-hour range is $323.93–$333.68, while the recent all-time high stands near $352.77, recorded on October 30. The immediate resistance is $333.68, while $323.93 is the first important support. The token remains approximately 5.6% below its recent high. The biggest fundamental development is Apple's fiscal Q4 2026 earnings. Revenue reached $114.48B, up approximately 12% year-over-year, while earnings per share came in at $2.10. iPhone revenue reached $57.58B, exceeding analyst expectations. However, Apple's December-quarter gross-margin guidance of 45%–46% came in below the previous 47.9% level, with higher memory costs creating pressure. Greater China revenue also missed expectations at $17.54B. This is the central tension: strong product demand is supporting revenue, but rising component costs could limit profitability. Apple's AI expansion adds another potential growth driver. Its China Apple Intelligence developer testing began on November 4, with selected features involving translation, writing assistance and image tools. The rollout creates another opportunity to strengthen the Apple ecosystem, but the commercial impact will depend on actual user adoption and device upgrades, not simply the announcement. There is an important distinction for AAPLX holders. AAPLX is a tokenized tracker certificate issued by Backed Assets, designed to follow Apple shares. It is not a separate AI or utility-token investment. Its fundamental direction comes from Apple's stock, while its crypto-market liquidity, trading premiums and discounts can behave differently. Issuer data also shows physical backing, with 39,656 shares reported against approximately 39,385 tokens in the September snapshot. Liquidity deserves attention. Although reported 24-hour volume is substantial relative to the displayed market capitalization, AAPLX trades across multiple venues with fragmented liquidity. Market trackers also report different circulating and total-supply figures, so market capitalization and fully diluted valuation should not be treated as interchangeable. Key figures $333.08 — Current price area $333.68 — Immediate resistance $323.93 — 24H low and immediate support $352.77 — Recent all-time high $12.16M — Reported market capitalization $14.19M — 24H trading volume $114.48B — Apple's Q4 revenue $2.10 — Quarterly earnings per share 45%–46% — December-quarter gross-margin guidance 39,656 — Reported underlying shares held as backing Bullish confirmation: AAPLX breaks above $333.68 and holds with healthy trading liquidity. That would put $340–$345 in focus, followed by a potential retest of $352.77. Bearish confirmation: Rejection below $333.68 followed by a clean break under $323.93. That would expose the $321 area and indicate that the recovery is losing momentum. For me, the decisive factor is Apple's ability to maintain strong iPhone demand while protecting margins against rising memory costs. AAPLX provides tokenized exposure to that underlying business, but its own liquidity and pricing efficiency matter too. Strong earnings establish the fundamental support; reclaiming resistance with healthy token-market liquidity would provide the technical confirmation. $AAPLXUSDT #BitcoinSlidesBelow$80K
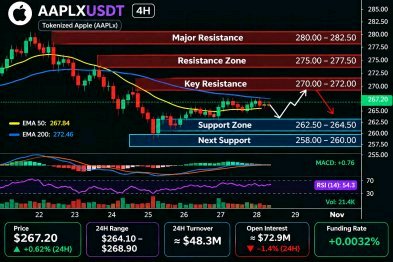
WLFI's latest sell-off is being driven by a problem beyond the chart: legal scrutiny is now colliding with confidence in the project. Justin Sun is seeking approximately $263,821 in sanctions against World Liberty Financial, alleging that the company failed to disclose its UAE ownership connections during their legal dispute over his frozen tokens. These are allegations, not a court finding, but the headlines are adding pressure to an already weak market. WLFI is trading near $0.0499, with a market capitalization around $1.58B and 24-hour volume near $69.6M on the latest market snapshot. Price recently touched $0.04605 before recovering toward $0.05177. The immediate challenge is reclaiming $0.0518 after a sharp rejection from the recent trading range. The dispute matters because Sun was once one of WLFI's largest external investors, committing approximately $45M. He alleges that his tokens were frozen and that governance rights were restricted. World Liberty has previously defended its actions and countersued Sun, accusing him of misconduct. The competing claims remain unresolved, leaving investors with legal and governance uncertainty rather than a confirmed outcome. There is a separate fundamental story beneath the controversy. World Liberty's USD1 stablecoin and lending-related activities have generated measurable protocol revenue. DeFiLlama reports approximately $34.24M in gross protocol revenue for Q3 2026. However, its reported token-holder net income remains zero. That distinction matters: protocol revenue does not automatically flow to WLFI holders. Supply is another concern. Approximately 31.78B WLFI is circulating against a maximum supply of 100B. The remaining locked allocations create substantial long-term dilution potential, although the tracked vesting schedule currently shows no dated releases over the next 12 months. Derivatives show significant leverage. Binance perpetual open interest is approximately $155.4M, up 5.7% in 24 hours while price has fallen 4.4%. Funding remains positive near 0.0074% per period. Around 60% of tracked accounts are short, although top traders by position size are slightly net long. This disagreement suggests positioning is becoming increasingly divided. Key figures $0.0499 — Current price area $1.58B — Market capitalization $69.6M — 24H spot trading volume $0.04605–$0.05177 — 24H range $4.98B — Fully diluted valuation 31.78B — Circulating WLFI 100B — Maximum supply $34.24M — Q3 protocol revenue $155.4M — Binance perpetual open interest +0.0074% — Funding per period Bullish confirmation: WLFI reclaims $0.0518 and holds above it with stronger spot volume. That could bring $0.0528–$0.0550 into focus and signal that buyers are absorbing the legal uncertainty. Bearish confirmation: Another rejection below $0.0518 followed by a clean break under $0.0460 would weaken the recovery and expose the $0.0440 area. I'm watching the legal dispute and the gap between protocol revenue and token-holder value capture. USD1 adoption may strengthen the business, but WLFI still needs clearer governance confidence and a stronger connection between ecosystem growth and token demand. Until then, the market is pricing in uncertainty, not simply the project's revenue potential. $WLFIUSDT #BitcoinSlidesBelow$80K

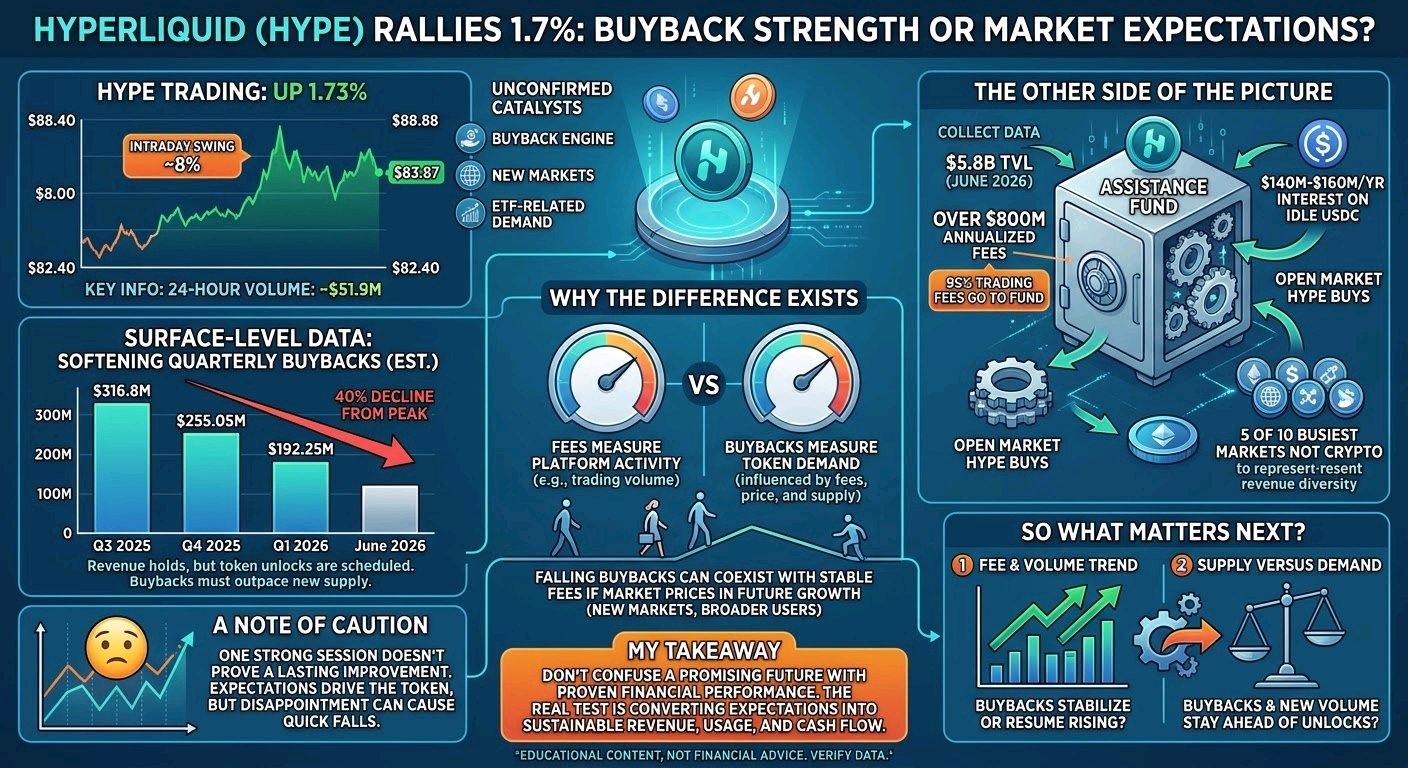
Hyperliquid (HYPE) Rallies 1.7%: Buyback Strength or Market Expectations? Let's discuss something traders often miss: a coin can rally even when its quarterly buyback numbers are falling. The key is understanding what investors expect in the future, not just what the protocol delivered last quarter. HYPE is trading near $83.87, up 1.73% on the day. The 24-hour range runs from $82.40 to $88.88, so the intraday swing was closer to 8%, on about $51.9M in turnover. The move has no single confirmed catalyst. The narratives circulating are the buyback engine, new market launches, and ETF-related demand. How much each contributes is speculation, not fact. The surface-level data looks softer. Buybacks fell from $255.05M in Q4 2025 to $192.25M in Q1 2026. That is roughly a 40% decline from the $316.8M peak in Q3 2025. Founder token unlocks arrive on a schedule, so buybacks only outpace new supply while revenue holds. The other side of the picture. As of June 2026, the protocol held $5.8B in TVL and generated over $800M in annualized fees. About 99% of trading fees go to the Assistance Fund, which buys HYPE on the open market. Half of Hyperliquid's ten busiest markets are not crypto, which may reduce its dependence on crypto-native volume. Interest on idle USDC adds a further $140M–160M a year to the buyback. Why the difference exists. Fees measure what the platform earns from activity. Buybacks measure how much of that gets converted into actual demand for the token. The second number moves with the first, and it also moves with the HYPE price and with new supply entering the market. A falling quarterly buyback figure can coexist with a stable fee base if the market is pricing in future growth, such as new markets and broader users. A note of caution. One strong session doesn't prove a lasting improvement. Buybacks depend on trading appetite, and they slow if volumes fall. A token that rises on expectations can also fall quickly if those expectations aren't met. So what matters next? 1. Fee and volume trend. Does the quarterly buyback figure stabilize or resume rising, rather than extending the decline from the Q3 2025 peak? 2. **Supply versus demand.** Do buybacks and new market volume stay ahead of scheduled unlocks? My takeaway: don't confuse a promising future with proven financial performance. The real test is whether Hyperliquid can convert today's expectations into tomorrow's sustainable revenue, usage, and cash flow. This is educational content, not financial advice. Figures come from the chart you shared and from public reports, so verify them against live data before relying on them. $HYPEUSDT $BNBUSDT #BitcoinSlidesBelow$80K #ByXIMPACT

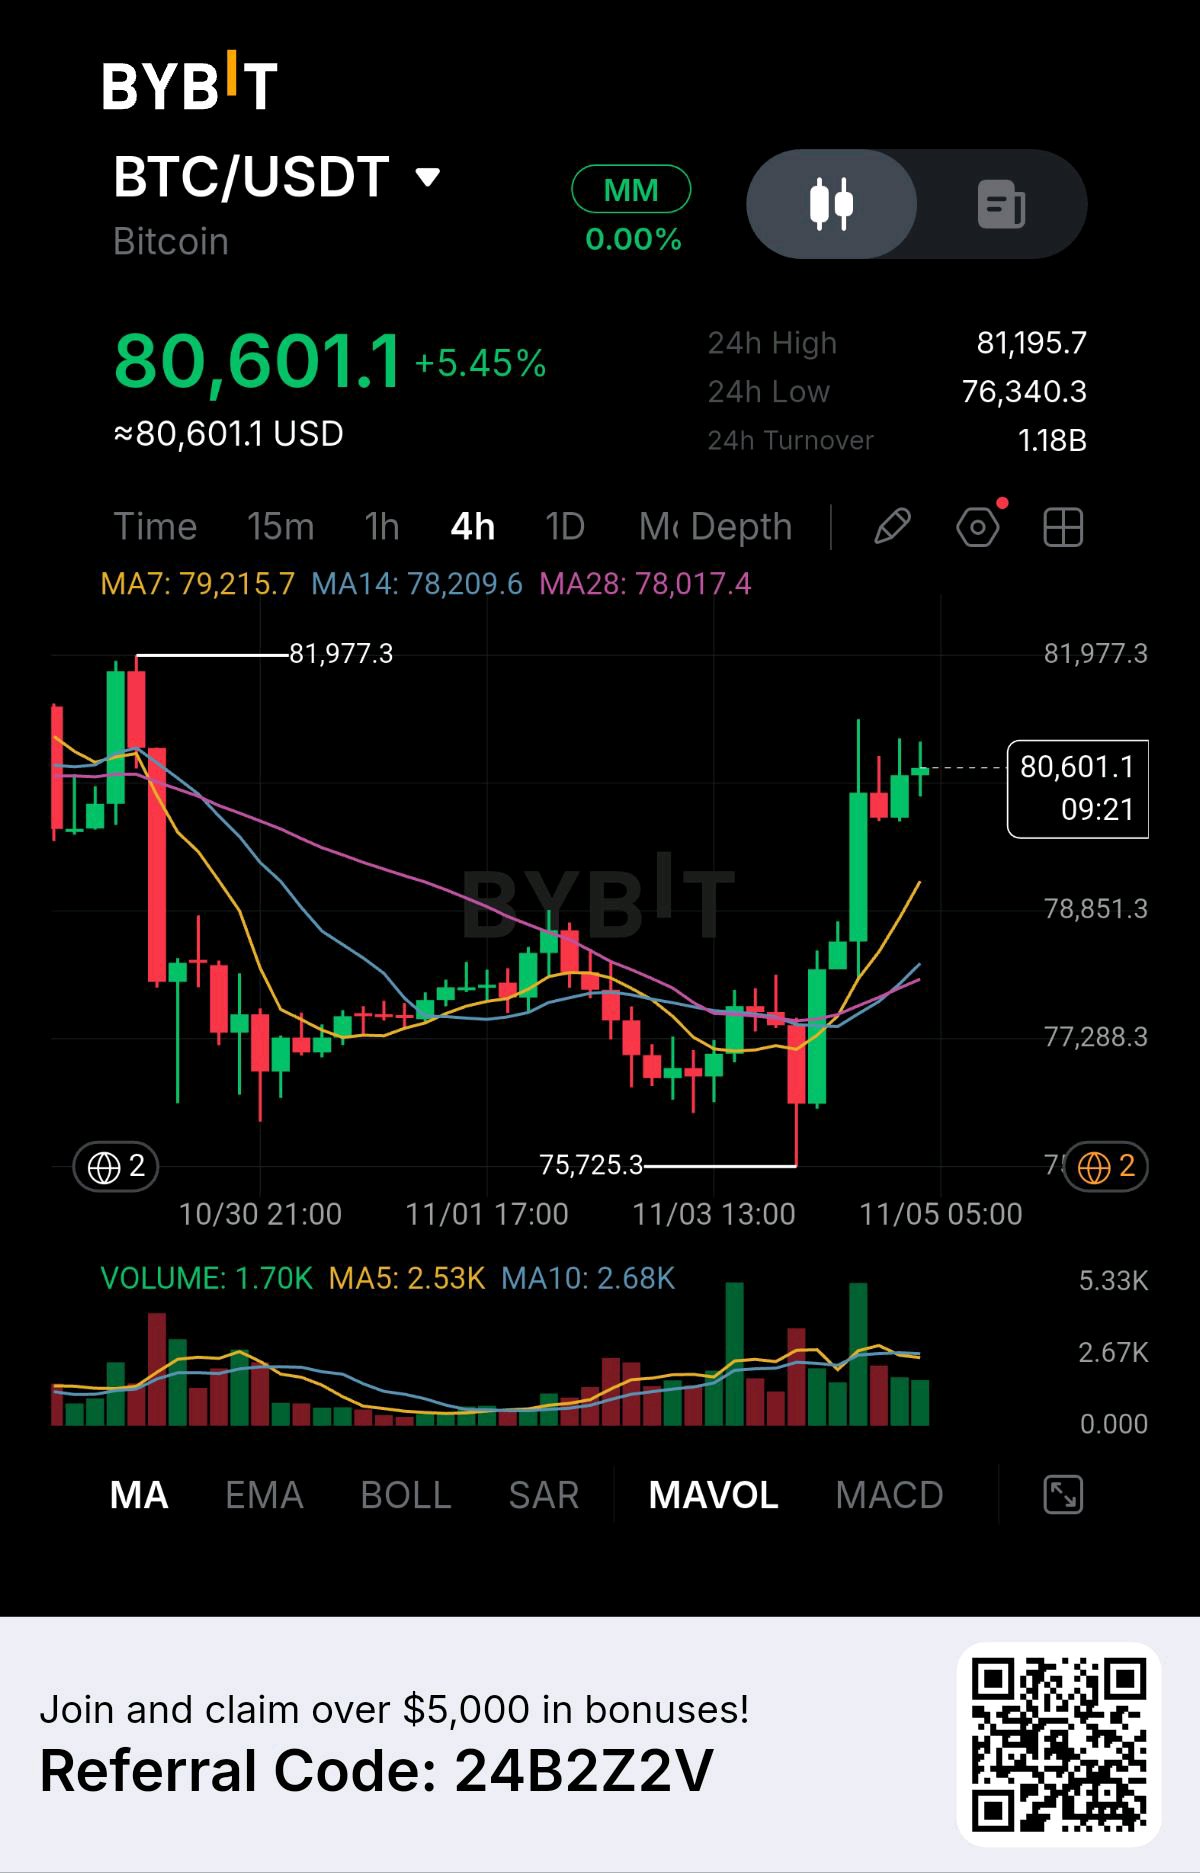
Bitcoin has reclaimed the $80,000 level after a sharp sell-off toward $75,725, and the speed of this recovery is changing the short-term market structure. What makes this move important is that BTC has not only bounced from support but has also moved back above all three visible moving averages. I am watching one thing closely: whether buyers can turn this recovery into a confirmed breakout above $81,000–$82,000. According to the supplied Bybit 4-hour chart, BTC is trading at $80,601.1, up 5.45%, with a 24-hour high of $81,195.7, a low of $76,340.3, and turnover of approximately $1.18 billion. These are screenshot figures, not independently verified live market data. The unusual observation is the strength of the rebound after the downside move. Bitcoin previously struggled around the $77,000–$78,000 region before another aggressive sell-off pushed price toward the chart-marked low of $75,725.3. However, sellers failed to maintain control at those levels. Buyers stepped in, produced several strong green candles, and pushed BTC back above $80,000. For me, this is an important shift in short-term sentiment. The market has moved from defending support to challenging overhead resistance. The moving averages are supporting the recovery. * MA(7): $79,215.7 * MA(14): $78,209.6 * MA(28): $78,017.4 BTC is currently trading above all three averages. More importantly, the seven-period average is now above the fourteen-period and twenty-eight-period averages. This alignment suggests improving short-term momentum. However, I would not confuse a recovery with a confirmed breakout. The $81,195.7 area is the immediate resistance visible in the 24-hour statistics, while $81,977.3 represents the previous chart-marked high. These are the levels where I expect the next important battle between buyers and sellers. Volume tells another part of the story. The screenshot displays current volume of 1.70K, compared with MA(5) volume of 2.53K and MA(10) volume of 2.68K. The recent bullish candles show strong buying participation, but the latest volume reading is below both averages. This is something I would monitor carefully. If BTC approaches $81,200–$82,000 without expanding volume, the market could struggle to break resistance. A stronger volume expansion during a breakout would provide better confirmation that buyers are ready to continue. I also want to separate Bitcoin's technical recovery from its broader fundamentals. This chart alone does not establish whether institutional demand, ETF flows, or derivatives positioning caused the move. Those would need independent verification. My conditional trading setup: Bullish trigger: Four-hour candle closes above $81,195.7, followed by a successful retest. Entry: $81,250–$81,500 after confirmation. SL/invalidation: $80,200. TP1: $81,977. TP2: $83,200. TP3: $84,500. TP2 and TP3 are projected extension targets, not confirmed chart resistance levels. Bearish trigger: Four-hour close below $78,851 with increasing selling volume. Bearish invalidation: A sustained recovery above $80,600. If the bullish recovery fails, I would monitor $78,209, $77,288, and ultimately $75,725 as downside reference levels. I would avoid chasing BTC directly into resistance. Waiting for a breakout and retest offers a more structured opportunity than entering simply because price has already gained 5.45%. My final thesis: Bitcoin is showing an encouraging recovery, with price reclaiming $80,000 and moving above its three visible moving averages. The short-term structure has improved considerably, but the next confirmation must come from buyers defending the reclaimed levels and overcoming the $81,195–$81,977 resistance zone. A convincing breakout could open the door toward $83,200 and $84,500. On the other hand, rejection followed by a loss of $78,851 would suggest that sellers are not finished. I believe the $82,000 region is the next major decision point. Bitcoin needs more than a recovery candle now; it needs sustained buying pressure to prove that this move has the strength to continue. $BTCUSDT #ByXIMPACT #BitcoinSlidesBelow$80K #MidtermsMarketWatch

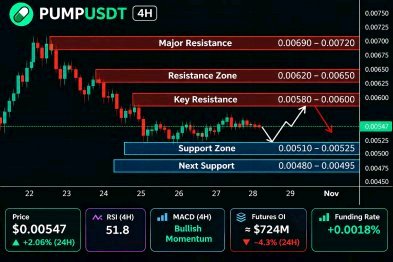
Pump.fun has now crossed $500M in cumulative PUMP buybacks and burns, permanently removing more than 175B tokens from circulation. That is approximately 17.5% of the original supply. But there is another side to this story: November brings a fresh 6.77B-token unlock worth approximately $27.67M. The central question is whether recurring revenue-funded buying can continue absorbing new supply while market demand remains strong. PUMP recently traded near $0.004216, with a market capitalization around $1.94B and 24-hour trading volume near $131.4M. Its latest reported 24-hour range is $0.003878–$0.004287, while the seven-day range stands at $0.003787–$0.004638. The $0.003878–$0.003900 area is the immediate support zone, while $0.004287 is the first recovery resistance. A sustained reclaim of $0.00430 would improve the short-term structure, but buyers still need to overcome $0.00464 to establish stronger momentum. The fundamental picture is unusually measurable. Pump.fun's official dashboard reports approximately $500.95M in cumulative buybacks, with 175.31B PUMP permanently burned. Its mechanism allocates 50% of protocol revenue toward open-market purchases and burns. The platform's annualized revenue is approximately $643.22M based on its 90-day average, while the latest reported daily buyback reached $688K. This creates a direct connection between launchpad activity and token supply reduction. However, the token does not provide holders with a contractual right to protocol revenue, and future purchases may be modified or discontinued under the project's disclosed terms. Platform adoption provides another important catalyst. Pump.fun generated approximately $62M in October revenue, reinforcing its position as one of Solana's largest consumer-facing crypto applications. Its ecosystem now extends beyond token launches into PumpSwap, Terminal, mobile trading and custom trading pairs. The October 19 integration with Collector Crypt also introduced tokenized trading-card packs and a marketplace. These developments expand the platform's revenue opportunities, but the important metric remains recurring trading activity rather than the number of products launched. Tokenomics creates the biggest near-term challenge. Approximately 459.65B PUMP are circulating against a maximum supply of 1T. The November unlock releases approximately 6.77B tokens through linear vesting, worth around $27.67M. This represents approximately 1.47% of circulating supply and 0.67% of maximum supply. The release adds potential selling pressure, although unlocked tokens do not automatically enter the market. The important comparison is whether the platform's daily buybacks can absorb new supply without depending on speculative demand. Derivatives reveal another concern. Aggregate perpetual open interest stands near $320.98M, with futures activity approximately 18.6 times reported spot volume. Weighted funding is positive around +0.0144% per eight hours, meaning leveraged longs are paying shorts. This suggests bullish positioning remains active, but the futures-to-spot imbalance creates vulnerability if momentum fades. A recovery supported mainly by leverage would be less convincing than one accompanied by sustained spot accumulation. Key figures $0.004216 — Current price area $0.004287 Immediate resistance $0.003878–$0.003900 Immediate support $0.004638 — Seven-day high $1.94B — Market capitalization $131.4M — 24H trading volume $643.22M — Annualized protocol revenue $500.95M — Cumulative buybacks 175.31B PUMP — Permanently burned supply 17.53% Original supply removed 6.77B PUMP — November token unlock $27.67M — Estimated unlock value $320.98M . Aggregate perpetual open interest +0.0144% .Funding per eight hours Bullish confirmation: Reclaim $0.004287 and hold above $0.00430 with stronger spot volume and continued buyback activity. That would put $0.00445–$0.00464 in focus, followed by the possibility of a broader recovery. Bearish confirmation: Lose $0.003878 and fail to recover it. That would expose $0.003787, followed by the $0.00360 area if unlock-related selling increases and leveraged longs unwind. Pump.fun has something many meme-related projects lack: substantial measurable revenue and a verifiable history of open-market buybacks and permanent token burns. But the November unlock and elevated futures activity create a genuine supply-demand test. The decisive signal is whether recurring platform revenue and spot demand can absorb new supply while PUMP reclaims $0.00430.or whether leverage and distribution overpower the buyback mechanism $PUMPUSDT $PUMPUSDC #BitcoinSlidesBelow$80K
Solana institutional tokenization story just reached another level. Schroders, an asset manager overseeing approximately $1.1 trillion, has brought an emerging-markets bond strategy onto Solana through Centrifuge. This is significant because institutional adoption is moving beyond tokenized cash and Treasury products into actively managed debt. But the important question is whether this growth will eventually translate into stronger demand for SOL. SOL is trading near $96.69, with a market capitalization around $57.08B and 24-hour trading volume near $3.63B. The latest reported 24-hour range is $90.10–$97.86, while the seven-day range extends to $103.65. Buyers have recovered from the $90 area, but $97.86–$100 remains the immediate resistance zone. A sustained breakout above $100 would provide stronger evidence of a trend recovery. The Schroders development is particularly important. Its Emerging Market Bond strategy is now available through a tokenized feeder fund on Solana. Investors receive blockchain-based shares tracking the underlying fund's net asset value. This marks Schroders' first deployment on Solana and expands the network's institutional use case into emerging-market sovereign and corporate debt. However, the fund's assets under management should not be confused with capital deposited directly into Solana or demand for SOL. There is a second institutional development worth watching. Bullish and Equiniti selected Solana among their initial blockchain partners for issuer-sponsored equity tokenization. Their October 27 demonstration transferred 61 million tokenized reserved shares in seconds. On November 3, Bullish confirmed plans to extend its services to Aptos and Ethereum as well. This validates Solana's infrastructure, but also means institutional tokenization will become a multi-chain competition. Network activity provides additional evidence. Solana's November 3 ecosystem update reported approximately $17.51B in stablecoin supply, $684M in tokenized equity supply, and 3.18 billion non-vote transactions. Samsung Wallet's USDC cross-border transfer integration across 82 million U.S. Galaxy devices also expands potential payment distribution. These developments strengthen the network's utility, although transaction growth and stablecoin circulation do not automatically create proportional SOL buying pressure. Derivatives show that leverage remains significant. Aggregate perpetual open interest is approximately $8.75B, with 24-hour futures volume around $3.38B in a separate derivatives snapshot. Weighted funding is positive near +0.0114% per eight hours. Positive funding means longs are paying shorts, while elevated open interest shows substantial speculative exposure. If SOL fails to hold its recovery, leveraged long positions could amplify the downside. Key figures $96.69 — Current price area $97.86 — Immediate resistance $90.10 — 24H low and immediate support $100 — Psychological recovery threshold $103.65 — Seven-day high $57.08B — Market capitalization $3.63B — 24H spot trading volume $17.51B — Solana stablecoin supply $684M — Tokenized equity supply 3.18B — Non-vote transactions reported November 3 $8.75B — Aggregate perpetual open interest +0.0114% — Weighted funding per eight hours Bullish confirmation: SOL reclaims $97.86 and establishes acceptance above $100 with stronger spot demand. That would put $103.65 in focus, followed by the $108–$110 region if momentum continues. Bearish confirmation: Rejection below $97.86 followed by a clean break under $90.10. That would expose the $88–$89 area and weaken the recovery structure. Solana is attracting institutional activity across emerging-market debt, tokenized equities and payments. That is a meaningful expansion of its financial infrastructure. But the decisive question remains whether these developments generate sustained network usage, fee activity and actual demand for SOL. Institutional headlines establish the opportunity; stronger spot buying and price acceptance will determine whether the market is ready to reprice the token. $SOLUSDT #BitcoinSlidesBelow$80K


Bitcoin is showing a recovery that deserves serious attention, but I don't think the most important question is how quickly BTC can reach $82K. What matters is whether buyers can turn this sudden breakout into a sustainable market structure. After spending several sessions struggling below $79K, Bitcoin has pushed aggressively higher. I'm watching this move closely because it could mark an important shift in short-term momentum. Looking at the Bybit 4H chart, BTC is trading around $80,659.4, up 5.62%, with a 24-hour high of $81,195.7 and a low of $76,137. One detail stands out to me: buyers didn't just produce a small bounce. They pushed price above the entire moving-average cluster and reclaimed the $78K–$79K region. That changes my short-term outlook. THE TECHNICAL SHIFT The moving averages are now positioned constructively: * MA7: $79,224 * MA14: $78,213.8 * MA28: $78,019.5 BTC is trading above all three averages, and the MA7 has moved above the MA14 and MA28. This is an encouraging sign of improving bullish momentum. However, I don't want to confuse a strong impulse candle with a confirmed continuation. The recent rally has already brought BTC close to the $81,200 resistance area, and the previous major high around $81,977 remains an important obstacle. THE DETAIL I'M WATCHING Volume supported the initial breakout, but the latest displayed volume is 1.59K, below its MA5 of 2.51K and MA10 of 2.67K. This tells me that participation has cooled after the initial buying surge. I want to see whether fresh buyers return during the next resistance test. If BTC consolidates above $79K instead of immediately giving back the rally, that would be a constructive development. MY TRADING PLAN These are the levels I'm monitoring: * $81,195 — Immediate resistance. * $81,977 — Previous major swing high. * $79,224 — MA7 support. * $78,214 — MA14 support. * $78,019 — MA28 support. * $77,288 — Previous consolidation region. * $76,137 — Recent 24-hour low. * $75,725 — Major chart support. BULLISH SCENARIO I'm interested in a healthy pullback toward $79,200–$79,800, followed by a convincing 4H bullish reaction. My conditional trading setup: * Entry: $79,300–$79,800 after confirmation. * Stop Loss: $78,000. * TP1: $81,195. * TP2: $81,977. * TP3: $83,500. The third target is a projected extension, not a previously established chart resistance. A convincing 4H breakout above $81,977 with increasing volume would strengthen my bullish thesis. BEARISH SCENARIO If BTC loses $79,200 and fails to reclaim it, I would become more cautious. A deeper correction could bring the MA14 and MA28 cluster into play. My conditional bearish setup: * Entry: Below $78,000 after a failed retest. * Stop Loss: $79,300. * TP1: $77,288. * TP2: $76,137. * TP3: $75,725. I would not consider the bearish continuation confirmed unless support breaks with convincing selling pressure. MY PERSPECTIVE What interests me most about this Bitcoin move is the change in market structure. For several sessions, buyers struggled to establish control. Now BTC has reclaimed its moving averages and pushed above the previous consolidation zone. That's encouraging, but I still want confirmation. I would rather enter after a healthy retest than chase an extended green candle. If Bitcoin holds above $79K and eventually clears $82K, I believe the next upside expansion could become interesting. For now, my focus is simple: protect capital, watch the retest, and let price confirm the next move. Are you expecting BTC to break $82K next, or do you think a deeper pullback is necessary before another rally? Educational market analysis based on the supplied Bybit 4H chart. All trading levels are conditional, and projected targets are not guaranteed. $BTCUSDT #ByXIMPACT #BitcoinSlidesBelow$80K


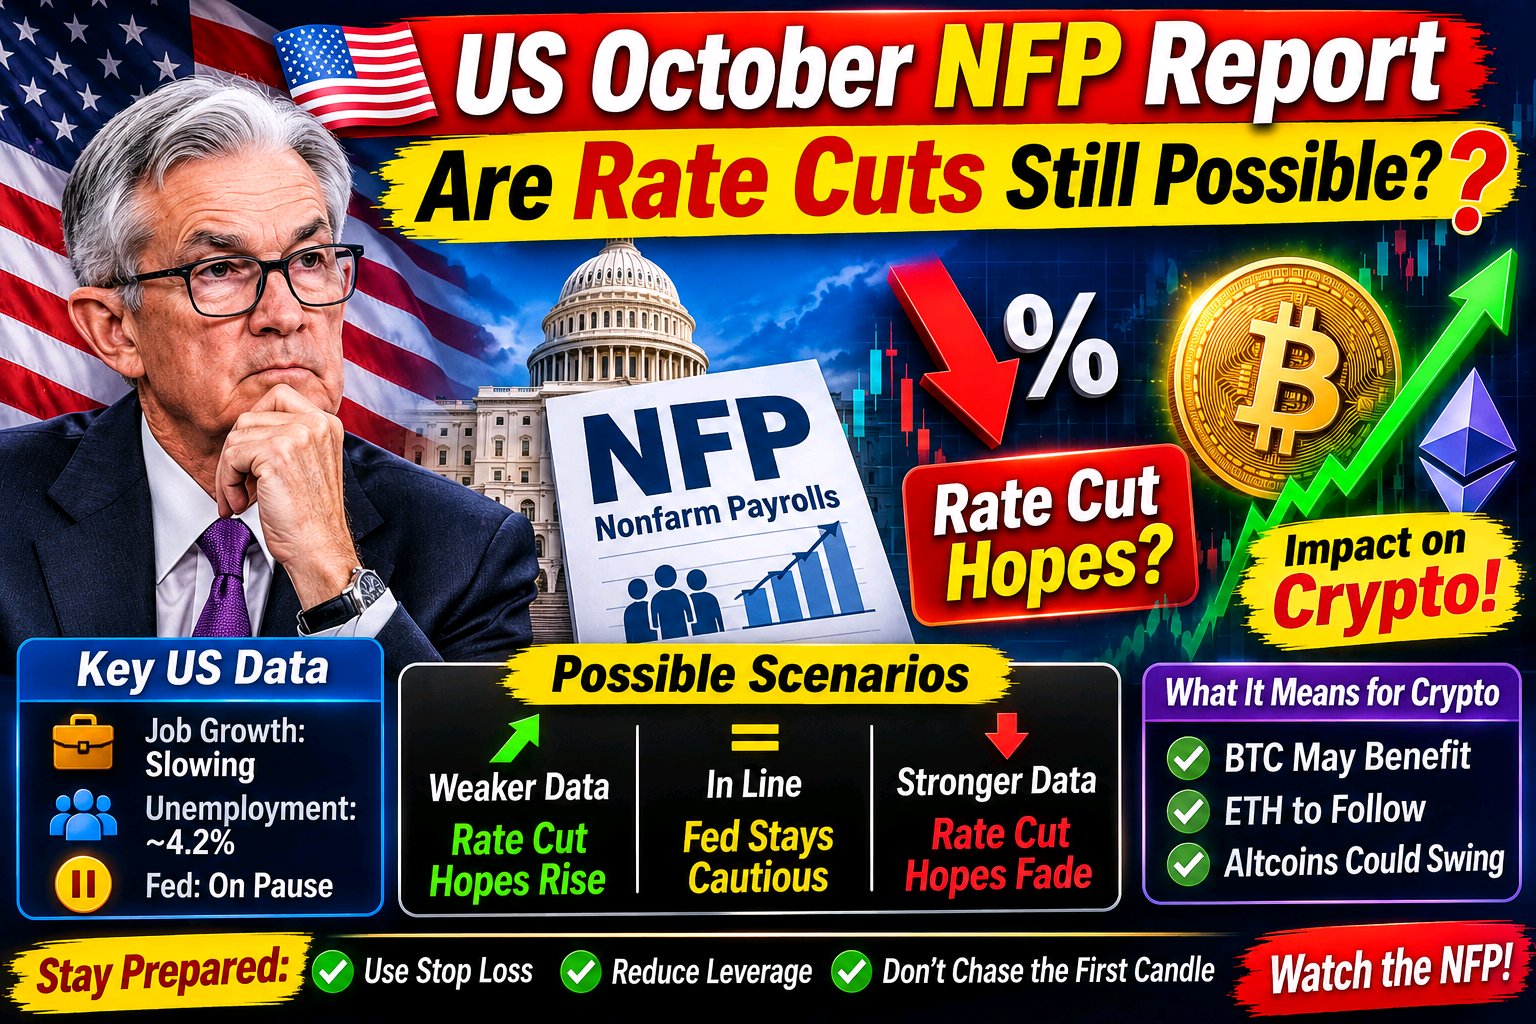
# 📊 US October NFP Report:
Are Rate Cuts Still Possible? 🏦 The US October nonfarm payrolls (NFP) report is coming up, and markets are watching closely. 👀 The big question: **can the Federal Reserve still cut interest rates if the job market keeps cooling?** 🤔 # 📋 Why This Report Matters The NFP report is one of the most important economic releases each month. 🗓️ It shows how many jobs the US economy added and gives a read on the health of the labor market. - 💼 It helps the Fed judge whether the economy is **overheating or slowing**. - 📉 It can shift expectations for **future interest rate decisions**. - ⚡ It often triggers sharp moves in stocks, bonds, the dollar, and **crypto**. ## 🔍 The Current Picture Here is where things stand heading into the release: - 🐌 **Job growth has slowed** recently. - 📈 The **unemployment rate sits near 4.2%**. - ⏸️ The **Federal Reserve recently paused** rate changes. This combination is why the data matters so much. A cooling job market is a signal that the economy may be losing momentum. 🌡️ ## 🏛️ What the Fed Might Do The Fed has two main goals: **maximum employment** and **stable prices**. ⚖️ With the central bank on pause, the next move depends on incoming data. - 📉 **Weaker hiring numbers** could push officials to consider **lowering borrowing costs later on**. - 💪 **Stronger-than-expected data** could keep the Fed on hold for longer. - 🔥 **Sticky inflation** could complicate any decision to cut. If the job market cools down **more than expected**, the case for rate cuts gets stronger. ✂️ ## 🎭 Possible Scenarios | 🎬 Scenario | 📰 NFP Result | 🏦 Likely Reaction | |---|---|---| | 🟢 **Weaker data** | Hiring slows more than expected | Rate cut hopes rise 📈 | | 🟡 **In line** | Matches forecasts | Fed stays cautious, market waits ⏳ | | 🔴 **Stronger data** | Hiring beats expectations | Rate cut hopes fade 📉 | Markets can react in surprising ways. Sometimes weak data is read as **bullish** (more cuts) and sometimes as **bearish** (economic trouble). 🎢 ## 🪙 What It Means for Crypto Crypto is sensitive to interest rate expectations. 💡 Lower rates generally mean cheaper money and more appetite for risk assets. - 🟠 **$BTC** often benefits when rate cut hopes rise. - 🔷 **$ETH** tends to follow the broader risk-on or risk-off mood. - 🌐 **Altcoins** can swing even more, since they react strongly to liquidity shifts. If the data supports easier policy, **risk assets may catch a bid**. If it points to a stubborn Fed, **volatility could return**. ⚡ ## 🛡️ Tips for Traders NFP releases are known for sudden spikes and reversals. 🌪️ Keep these points in mind: - 🛑 **Always use a stop loss.** - ⚖️ **Reduce leverage** around major data releases. - ⏱️ **Don't chase the first candle.** Initial reactions can reverse fast. - 📅 **Know the release time** and plan ahead. - 🧘 **Stay patient.** Waiting for confirmation is often better than guessing. ## 🧾 Final Thoughts The October NFP report could shape the **rate cut narrative** for the months ahead. 🎯 With job growth slowing, unemployment near **4.2%**, and the Fed on pause, the data will help show whether the labor market is cooling enough to bring cuts back on the table. ✂️ For crypto traders, this is a key event to watch, because it can influence **$BTC, $ETH**, and the wider market. 🌍 ## 💬 What Do You Think? Are **rate cuts still possible**, or will the Fed stay on hold? 🤔 Drop your prediction in the comments! 👇 --- ⚠️ **Disclaimer:** This article is for informational purposes only and is not financial advice. Always **DYOR** (Do Your Own Research). 🙏 👍 **Like & Follow for Daily Crypto News & Market Updates!** 🔔 --- ### 🏷️ #NFP #FederalReserve #RateCuts #Bitcoin #Ethereum --- #USPayrollsAndRateDecisionsDriveMacroWeek #BitcoinSlidesBelow$80K #BlockchainSecurity #Oracle20BFundingPlanTestsTheAITrade #WSOTPicktoEarn10U $ETHUSDT @jalekhakhatun
⚡ What Happened
# 💥 $600M in Leveraged Crypto Positions Wiped Out After US Midterms, Then the Market Bounced Back 🚀 The crypto market just delivered a lesson in volatility. 🎢 Within 12 hours of the US midterm results, **$600 million in leveraged crypto positions were liquidated**. Then the market turned around quickly. 🔄 ## ⚡ What Happened Reports say the liquidations came within **12 hours after Democrats won control of Congress**. 🏛️ - 😰 Many traders were caught **on the wrong side** of the move. - 💣 Leveraged positions were forced to close as prices swung. - 🔥 The shakeout was fast and brutal. When too many traders lean the same way with leverage, even a modest move can trigger a chain reaction of forced liquidations. ⛓️ ## 📈 The Recovery Was Even Louder The market did not stay down. 💪 Since the shakeout: | 🪙 Asset | 📊 Move | |---|---| | 🟠 **$BTC** | Gained **$4,600** | | 🔷 **$ETH** | Climbed **$210** | | 🌍 **Total Crypto Market Cap** | Added over **$150 billion** | The recovery was sharp enough to wipe out much of the fear that followed the liquidations. 🚀 ## 🧠 Why Leverage Gets Punished A liquidation wave happens when traders borrow to amplify their positions and price moves against them. 📉 1. 📍 Price moves against leveraged positions. 2. 🚨 Exchanges **automatically close** positions that fall below margin requirements. 3. 💥 Forced selling (or buying) pushes price further. 4. ⛓️ More positions get liquidated, creating a **cascade**. Once the forced selling is done, the market is often **cleaner and healthier**, because the weakest, most overleveraged positions have been flushed out. 🧹 ## 🏛️ Politics Meets Crypto Elections and policy shifts can move markets quickly because traders try to guess how new political conditions may affect regulation, liquidity, and risk appetite. 🗳️ - 📰 Headlines can trigger **fast, emotional reactions**. - 🤔 Early reactions are often **wrong-footed** once the market digests the details. - ⏳ The longer-term impact usually depends on **actual policy**, not first impressions. Crypto trades 24/7, so it is often one of the first markets to react to big news. 🌐 ## 🔮 Two Possible Readings **🐂 The bullish view:** - 🧹 The leverage flush cleared out weak hands. - 💰 Over $150 billion in new market cap shows strong buying interest. - 📈 The quick rebound suggests dip buyers are active. **🐻 The cautious view:** - 🎭 A sharp bounce after a liquidation event can sometimes be short-lived. - 🌪️ Political and macro uncertainty can bring fresh volatility. - ⚠️ Leverage can build up again quickly if traders get overconfident. Neither view is certain, and the next moves will depend on how the market digests the news. 👀 ## 🛡️ Lessons for Traders This episode is a useful reminder. 📚 - 🛑 **Always use a stop loss.** Never trade without one. - ⚖️ **Be careful with leverage.** High leverage leaves very little room for error. - 📉 **Don't trade headlines blindly.** The first reaction is not always the lasting one. - 💼 **Manage position size.** Survive the volatility so you can trade the recovery. - 🧘 **Stay calm.** Panic decisions often lock in losses just before a reversal. ## 🧾 Final Thoughts In about 12 hours, the market wiped out **$600 million in leveraged positions**, then rebounded with **BTC up $4,600, ETH up $210, and over $150 billion added to total market cap**. 🎯 The shakeout was painful for overleveraged traders, but the recovery shows how fast sentiment can flip in crypto. ⚡ The big question is whether this was a **leverage reset before the next leg higher** or the **start of a bigger rally**. 🤔 ## 💬 What Do You Think? Did the market just **punish overleveraged traders before making its next move**, or is this rally **only getting started**? 👇 Share your view in the comments! 🗣️ --- ⚠️ **Disclaimer:** This article is for informational purposes only and is not financial advice. Crypto trading involves high risk. Always **DYOR** (Do Your Own Research). 🙏 👍 **Like & Follow for Daily Crypto News & Market Updates!** 🔔 --- ### 🏷️ #CryptoNews #Bitcoin #Ethereum #Liquidations #USMidterms --- #PiecesOf8 #BitcoinSlidesBelow$80K #BlockchainSecurity #Oracle20BFundingPlanTestsTheAITrade #WSOTPicktoEarn10U $ETHUSDT @jalekhakhatun


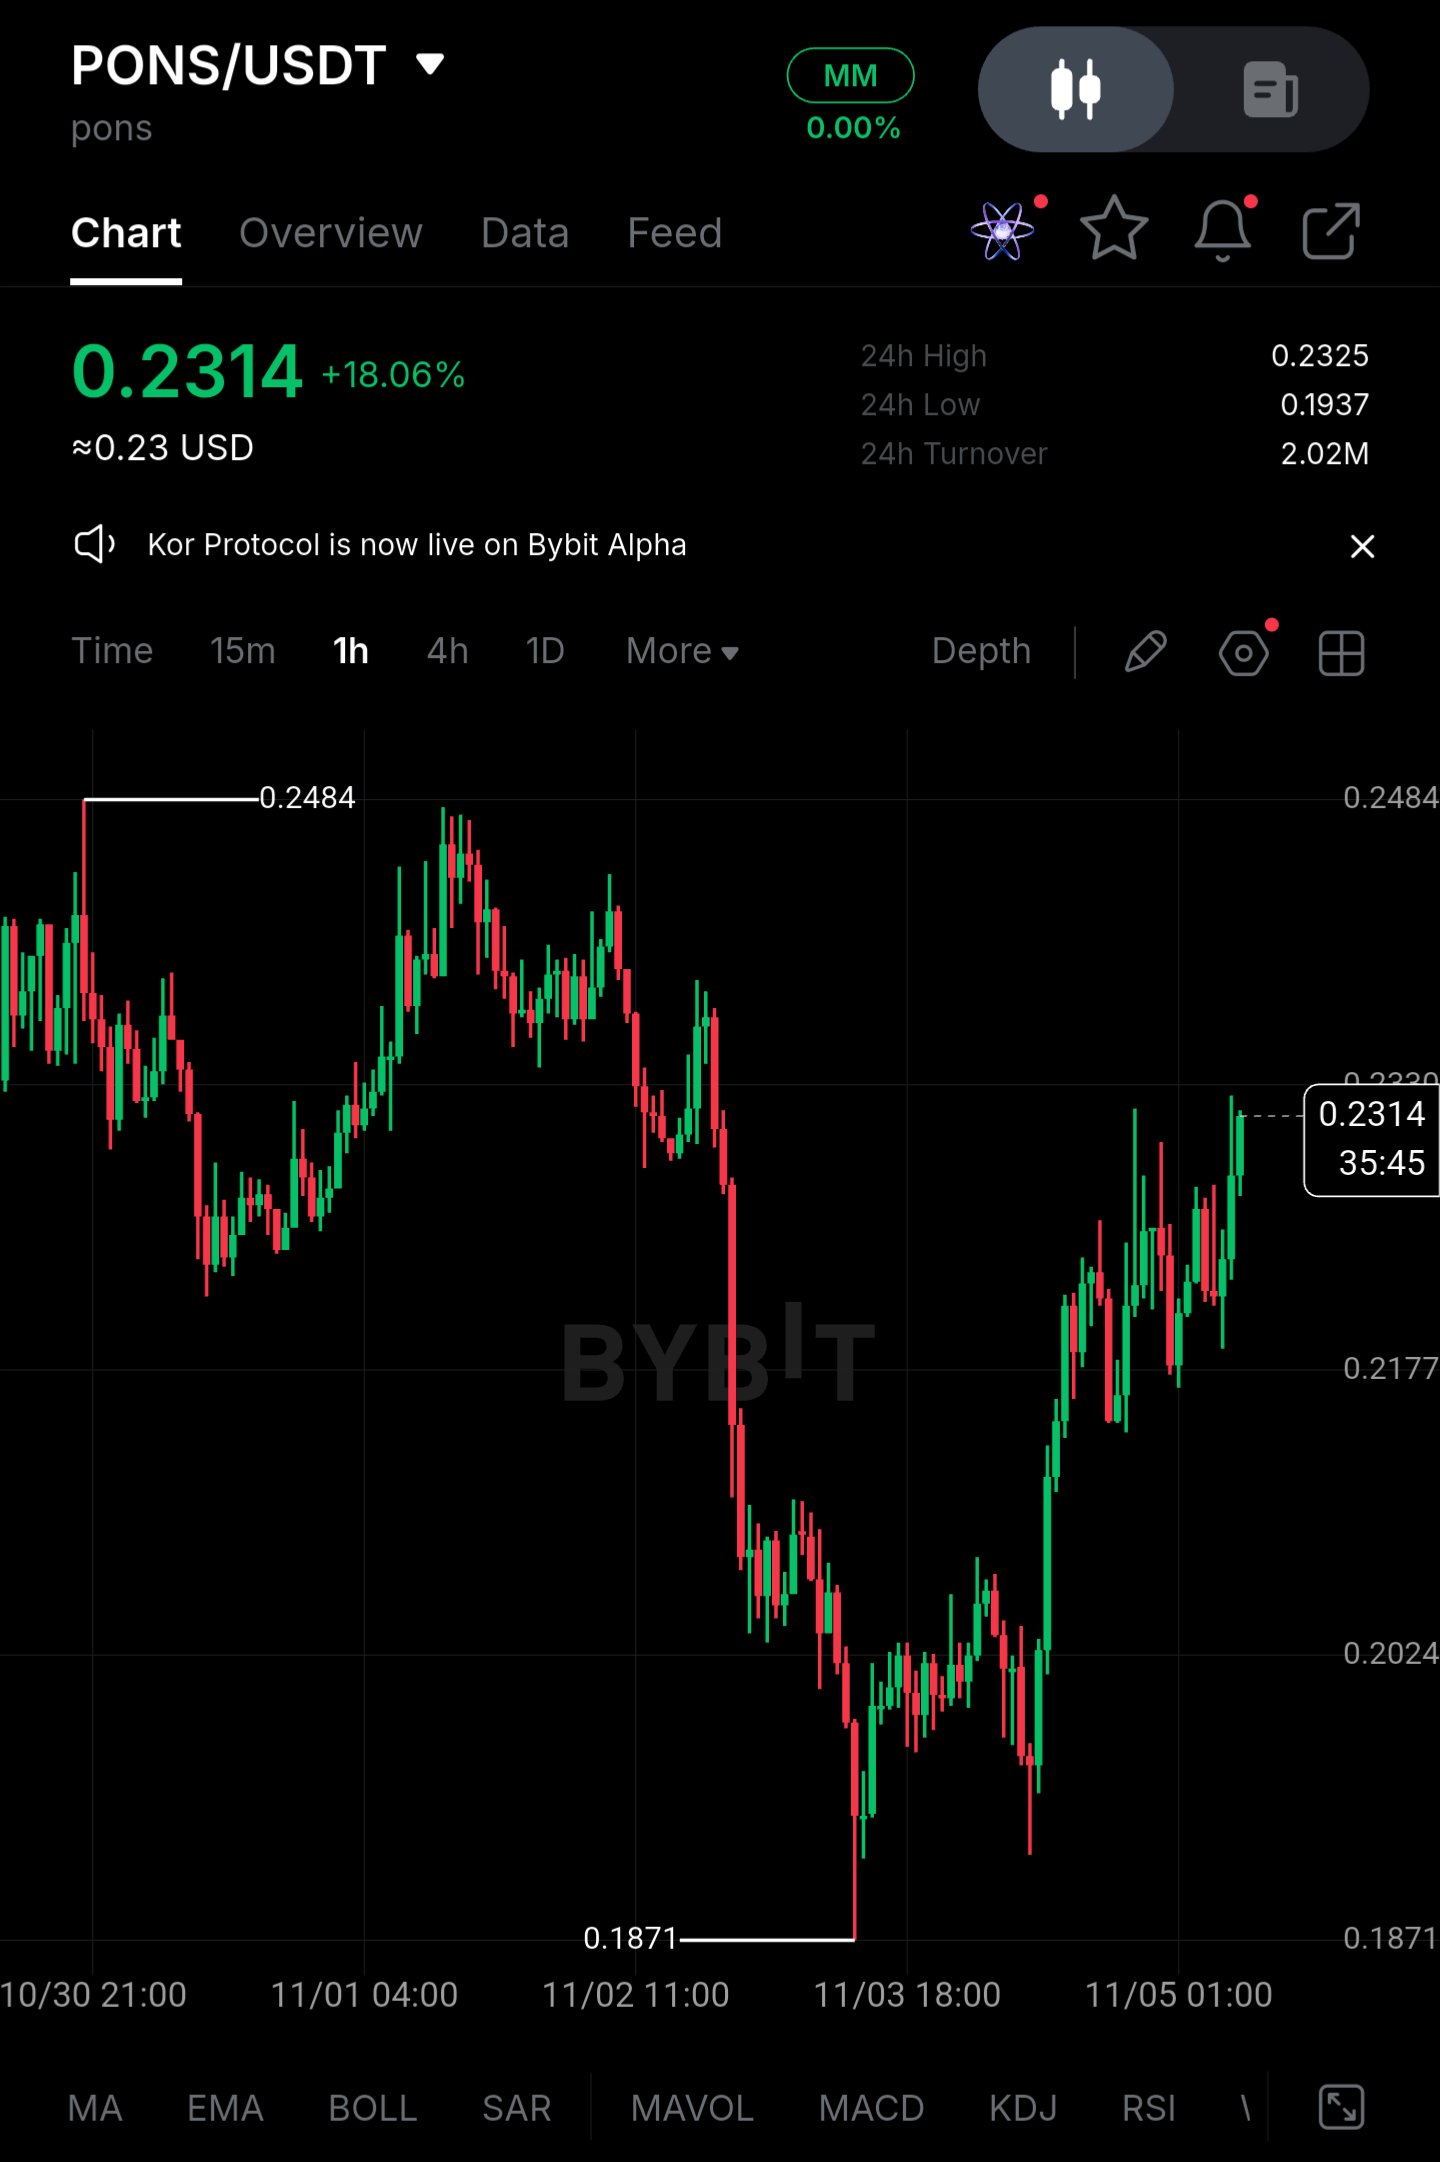
$PONSUSDT PONS/USDT: Stabilizing Near 0.23 After a Sharp Drop, But This Is Not a Recovery Yet** PONS is trading around 0.2314 after printing a low at 0.1871 on Nov 3. I am not treating the current bounce as a recovery. The bigger concern is that selling pressure from larger holders and a heavily long-tilted derivatives book can still drive another leg lower if spot demand fails to follow through. **Price Action** - Current price: ~0.2314 (≈$0.23), +18.06% on the day - Recent low: 0.1871 (Nov 3), roughly 23.7% below current price - 24h range: 0.1937 to 0.2325, with price pressing the top of that range - Immediate resistance: 0.2325 (24h high), then 0.2484 (range high from Oct 30) - First support: 0.2177, then 0.2024 The rebound from 0.1871 came in a near-vertical run with large green candles, which looks more like short covering and momentum buying than steady accumulation. Reclaiming 0.2484 would mark the first real structural improvement, though the broader trend remains under pressure. Price is still below the 0.2484 peak and well below the early-November breakdown zone. **Large Capital Picture** There is no ETF channel for this asset, so large-wallet behavior and exchange flows are the relevant read. The chart shows the sharp drop from the 0.23 area down to 0.1871 as an impulsive, high-volume decline, which is consistent with large holders distributing into weak bids. Demand has been inconsistent: the first bounce failed near 0.2177, and only the latest push has reclaimed that level. A fresh listing announcement (Kor Protocol on Bybit Alpha) is circulating, which adds attention but does not by itself prove sustained buying. **Liquidity and Range Conditions** Candles have shrunk and overlapped between 0.2177 and 0.2325 over the last 12 to 16 hours. A narrow range after a sharp advance or decline is not evidence of accumulation. Reported 24h turnover of 2.02M is modest for a +18% move, which suggests the rally is running on thin liquidity. Stronger, sustained spot participation is still needed before this can be called durable. **Derivatives Positioning** Exact figures are not visible on the chart, so these are reasonable estimates based on the price structure: - Open interest: elevated relative to spot volume, likely rebuilding after the liquidation flush at 0.1871 - Funding rate: positive, meaning longs are paying shorts - Long share of accounts: roughly 58% to 62% This bullish positioning is a vulnerability. If 0.2177 gives way, crowded longs entered during the bounce become forced sellers, which can accelerate a move toward 0.2024 and potentially a retest of 0.1871. **Key Figures** - Current price: ~0.2314 - Immediate resistance: 0.2325, then 0.2484 - Support zone: 0.2177 / 0.2024 - Recent low: 0.1871 - 24h turnover: 2.02M - Open interest: elevated (estimate) - Funding: positive (estimate) - Long share: ~58% to 62% (estimate) **Confirmation Levels** - Bullish: A hourly close above 0.2484 with rising spot volume and flat or falling funding would open the way to a retest of the prior range highs and signal that the 0.1871 low is likely in. - Bearish: A hourly close below 0.2177 would expose 0.2024 first, with 0.1871 as the next liquidity pool where a sweep becomes likely. **Closing** The market has stabilized for now, but stability is not strength. Selling from larger holders and crowded long positioning are still competing with the recovery attempt. The decisive signal is whether spot buyers return while leverage stays controlled, or whether another support breakdown triggers a fresh round of long liquidations. *Figures marked as estimates are inferred from chart structure, not live derivatives data. Not financial advice.* #BlockchainSecurity #WSOTPicktoEarn10U #BitcoinSlidesBelow$80K #ByXIMPACT

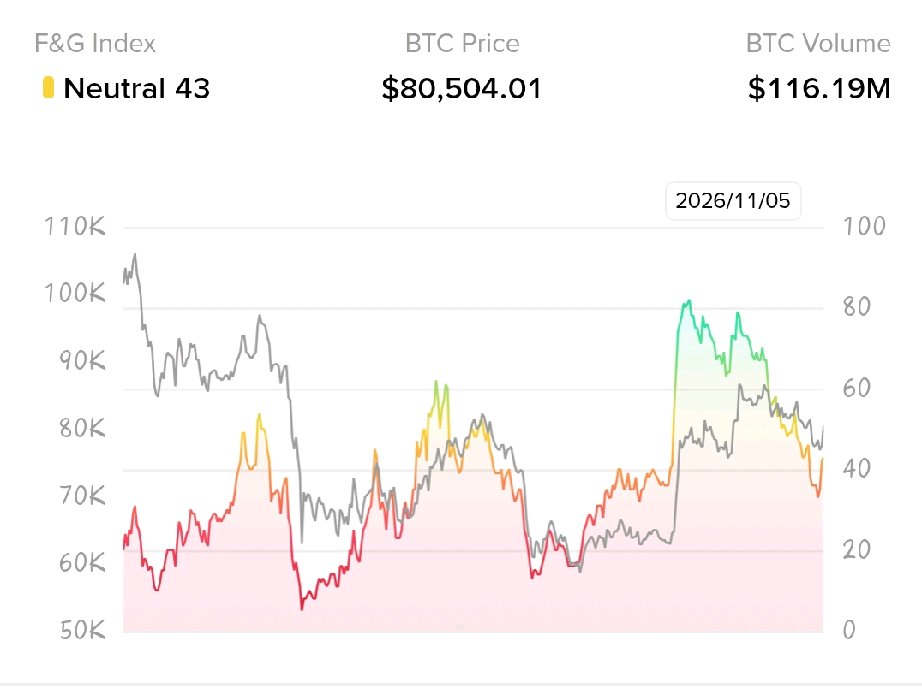
#FearAndGreed Crypto Market Greed Is Cooling Down
I’m looking at the Fear & Greed Index and the market sentiment has shifted from Greed to Neutral, with a brief dip into Fear. What caught my attention: • Fear & Greed Index: 43 (Neutral) • Bitcoin around $80,500 • Total crypto market cap: $2.69T up 4.30% • 24H trading volume: $94.82B up 56.23% The market is showing signs of recovery but sentiment is still cautious. higher trading volume is worth watching and though it does not confirm a sustained rally. I’m not rushing to call this a bull run. i want to see $BTC hold key support levels and maintain buying strength before getting more confident. patience and risk management matter more than chasing green candles. #BitcoinSlidesBelow$80K $BTCUSDT

hacker
🚨 The Mercado Bitcoin hacker converted USD 10.5 million in stolen funds into Ether and reportedly moved them from 27,160 customer deposit addresses. The exchange promises to cover the losses, but tracking efforts cast doubt on whether the attack is contained. #BlockchainSecurity #BitcoinSlidesBelow$80K


Confluence Support Retest on 1H: It's NIGHT
Confluence Support Retest on 1H: Is NIGHT Coiling for an Explosive Surge Toward the 0.050 USD Milestone? #BitcoinSlidesBelow$80K Traders hunting for high-probability, trend-following Long setups with disciplined risk parameters definitely need to review NIGHT on the 1H timeframe right now! Looking past short-term market noise, price action is respecting structural levels with textbook precision. $NIGHTUSDT Trace the underlying market dynamics: Ever since printing an aggressive liquidity sweep near 0.0355 USD in late October, NIGHT has methodically carved out higher swing lows. The impulsive expansion clearing 0.045 USD backed by notable volume verified active institutional demand stepping in. Following that rapid expansion, price staged an orderly pullback to 0.0435 USD, landing squarely on the ascending white trendline and the upward-sloping dynamic MA100 baseline! What makes this retest so compelling? It forms a textbook confluence zone where diagonal support meets dynamic moving average backing. Examining the volume tape below, distribution pressure across this recent pullback has completely evaporated. The 1H candle bodies are tightening into a quiet consolidation range. In professional execution, dried-up volume at dynamic trendline support indicates seller exhaustion and complete supply absorption. It only takes a minor influx of responsive buying volume to ignite the next impulsive expansion wave higher! Actionable trade execution setup: Position: Trend-continuation Long entry around 0.0432 – 0.0436 USD. Take-Profit Target (TP): Psychological round-number barrier at 0.05000 USD (nearly 15% upside potential). Protective Stop-Loss (SL): 0.04155 USD (safely below the retest base and MA100). Risk-to-Reward Ratio: Highly asymmetric, risking roughly 0.0019 points to capture nearly 0.0065 points of upside expansion! What is your take on this confluence baseline? Will NIGHT bounce cleanly off this shelf toward 0.050 USD as technicals suggest, or do you anticipate further consolidation first? Share your perspective in the comments below! DYOR
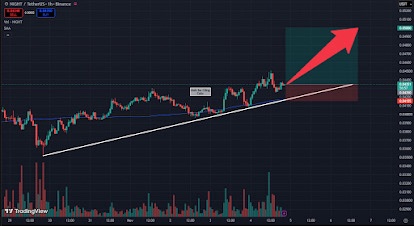
GOLD IS BACK ON THE SPOTLIGHT
$XAUTUSDT GOLD IS MAKING MOVES! 👀🔥 Gold is attracting attention again as XAUUSDT records a strong recovery, putting the precious metal back in focus across the financial markets. 📊 MARKET BREAKDOWN Asset: Gold (XAUUSDT) Market: Gold Perpetual 24H Change: +3.40% Reference Price: $4,071 24H Trading Volume: $242.89M Open Interest: $76.66M 🔍 WHAT'S HAPPENING? Gold's recent strength highlights renewed market activity. Traders are watching whether the bullish momentum can continue or whether the market will experience a temporary pullback. 👀 WHAT SHOULD WE WATCH NEXT? 🟢 Sustained strength could keep bullish sentiment alive. 🔴 A loss of momentum could bring consolidation. ⚡ Trading volume and open interest wil No chasing moves. Stay patient, stay informed, and respect market risk. 🔥 WHAT'S YOUR VIEW ON GOLD? Are you watching XAUUSDT for more upside or expecting a pullback? Drop your thoughts below! 👇#ByXIMPACT #BitcoinSlidesBelow$80K #BlockchainSecurity #PiecesOf8 #Oracle20BFundingPlanTestsTheAITrade $ETHUSDT

AVAXUSDT
$AVAXUSDT : IS AVALANCHE PREPARING FOR ITS NEXT BIG MOVE? The crypto market is full of opportunities, but some projects deserve more attention than others. One name that keeps coming up is $AVAX. Built around the Avalanche network, AVAX is more than just another Layer 1 token. Its focus on custom blockchains and real-world asset tokenization makes it an interesting project to watch as the market evolves. 🔥 WHY I'M KEEPING AN EYE ON AVAX 🔹 Strong Ecosystem: Avalanche lets projects launch their own custom L1 chains, which has attracted gaming, finance and enterprise builders. 🔹 Real-World Assets: Tokenization keeps growing on Avalanche, with institutions and big brands testing the network. 🔹 Institutional Interest: Partnerships and treasury activity show AVAX is still on the radar of larger players. 🔹 Long-Term Potential: Network upgrades, developer growth and on-chain activity could all play a role in its future performance. 📊 WHAT SHOULD TRADERS WATCH? Rather than chasing every green candle, watch how AVAX behaves around important support and resistance levels on the daily chart. A strong breakout backed by rising volume could signal renewed bullish momentum, while a rejection at resistance may set up a pullback. After a big drawdown, patience matters more than speed. ⚠️ Remember: No token moves upward forever. Risk management is just as important as finding opportunities. 💬 LET'S TALK! Do you believe $AVAX has what it takes to lead the next wave of tokenization and L1 growth? Are you: 🚀 BULLISH on AVAX 🐻 BEARISH on AVAX 👀 WAITING for a better entry? Drop your thoughts below. Let's discuss! 👇#ByXIMPACT #BitcoinSlidesBelow$80K #BlockchainSecurity #Oracle20BFundingPlanTestsTheAITrade #WSOTPicktoEarn10U
$ENAUSDT is trading around 0.0925, sitting in a tight range just above the 0.0900 round number. Price is coiling between support in the 0.0855-0.0900 area and resistance near 0.0950-0.1000, and until one side breaks on a daily close, it's a range, not a trend. Buyers keep defending the 0.09 zone, but every push toward 0.095 has met selling, so the bounce still looks unconfirmed. Volume is the tell: a break needs a clear step-up above the recent average, and without it moves tend to fade back into the range. Levels to watch: Support: 0.0900, 0.0855, 0.0838, then roughly 0.0770. Resistance: 0.0950, 0.1000, 0.1100, then roughly 0.1220. Plan, on daily closes: Support-hold long: a pullback into 0.0900-0.0910 that holds on the daily close. Entry 0.0905, stop under 0.0850, which is 0.0055 of risk. 0.0950 is about 0.8R, 0.1000 about 1.7R and 0.1100 about 3.5R. Breakout long: a daily close above 0.0950 on rising volume, then a retest that holds. Entry 0.0965, stop under 0.0925, which is 0.0040 of risk. 0.1000 is about 0.9R, 0.1100 about 3.4R and 0.1220 about 6.4R. Breakdown (short or exit): a daily close under 0.0900, then a failed retest. Entry 0.0895, stop above 0.0935, which is 0.0040 of risk. 0.0855 is about 1R and 0.0770 about 3.1R. Invalidation: a daily close under 0.0838 kills the bounce idea, and a daily close above 0.1000 says the downtrend has turned. Risk note: range breaks can be fast and fake out both ways, so use limit orders and keep size small. That's my read of the chart, not advice #ByXIMPACT $ENAUSDT#ByXIMPACT #PiecesOf8 #BitcoinSlidesBelow$80K #BlockchainSecurity
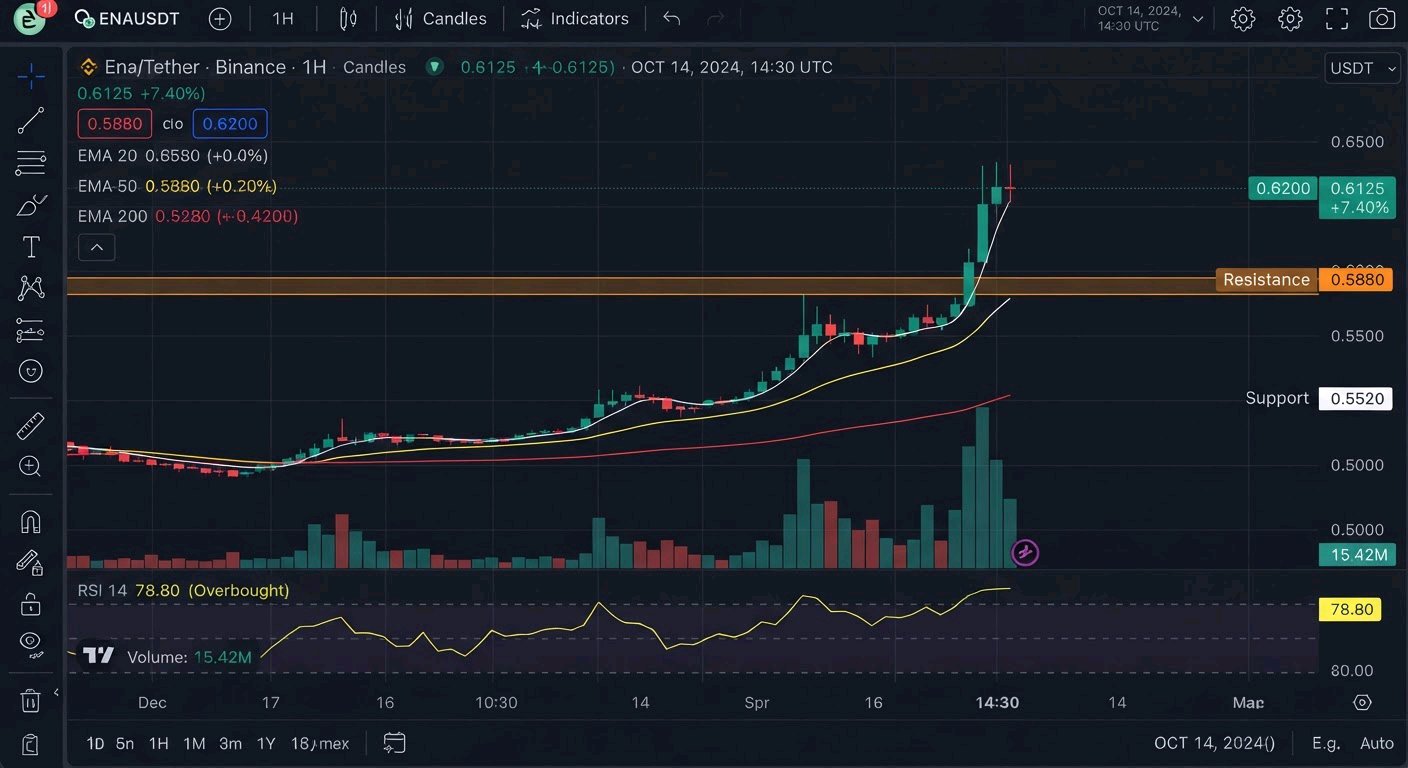
$MNTUSDT is testing a key technical structure, and the next few 4h candles will determine its next major directional move. Where we are: MNTUSDT has been consolidating within a defined channel, currently pressing near a pivotal midline resistance. Key Levels: Support: Lower channel boundary and immediate reaction zone. Resistance: Channel midline and upper boundary targets. Potential Scenarios: Breakout: A sustained 4h close above resistance opens the path toward higher upper-rail targets. Rejection: A stall at the midline could prompt a pullback toward the lower support rail for a better entry. Breakdown: A loss of key support invalidates the bullish structure and exposes deeper downside levels. Trading Plan: Entry: Look for disciplined entries on dips toward support rather than chasing mid-range prices. Risk Management: Maintain clear stop-losses below invalidation levels and keep position sizes controlled.#ByXIMPACT #WSOTPicktoEarn10U #PiecesOf8 #BitcoinSlidesBelow$80K #BlockchainSecurity
$AAVEUSDT is currently trading around 130.25 USDT, with a positive 24-hour performance. Current price: $130.25 24H change: +2.17% 24H high: $137.03 24H low: $123.28 The recovery indicates improving short-term sentiment, although the broader monthly trend remains under pressure. 📈 2. Technical Structure AAVE has experienced significant volatility recently, but buyers are attempting to establish a stronger base. Key levels to monitor: Support zone: 123–126 USDT Immediate resistance: 137–139 USDT Major resistance: 146 USDT sustained move above resistance could strengthen the recovery narrative. However, rejection around these levels could lead to another consolidation phase. 🐂 3. Bullish Scenario If buyers maintain control and AAVE successfully breaks above the 137–139 USDT resistance area, bullish momentum could strengthen. A sustained breakout, supported by increasing trading volume, would provide stronger evidence of a potential trend reversal. 🐻 4. Bearish Scenario If AAVE fails to maintain its recovery and loses the 123–126 USDT support region, sellers could regain control. This would weaken the bullish structure and potentially expose the market to further downside pressure. 🔍 5. What I'm Watching Three important things deserve attention: Whether buyers can defend the 123–126 support region. Whether trading volume increases during upward movements. Whether AAVE can establish acceptance above 137–139 resistance. 🎯 Final Thoughts AAVEUSDT is showing encouraging recovery signals, but confirmation is still needed. The coming sessions could be important in determining whether this is the beginning of a stronger bullish reversal or simply a temporary relief rally. Patience, confirmation, and proper risk awareness remain essential in volatile markets. What's your outlook on AAVE? 🐂 Bullish recovery or 🐻 another bearish move? #BitcoinSlidesBelow$80K #BlockchainSecurity #ByXIMPACT

$INJUSDT has climbed 9.87% in 24 hours and is now trading at 7.934, just below its 7.944 local high. The rally has been impressive, but the next move could be more important than the entire advance that brought price here. The 15-minute structure remains constructive. Higher highs and higher lows, supported by an upward-moving average alignment, show that buyers have maintained control. MA7: 7.898 MA14: 7.875 MA28: 7.814 Price is above all three averages, with the short-term structure still favoring buyers. However, 7.944 is the immediate barrier. A confirmed 15-minute close above it would strengthen the breakout case and bring the psychological 8.00 level into focus. There is also a risk worth respecting. After such a strong advance, rejection at the local high could trigger profit-taking. A move below 7.898 would be an early sign of weakening momentum, while 7.814 is the more important support reference. The temptation is to chase a rally that looks unstoppable. But strong momentum does not remove the need for confirmation. The market still has to prove that 7.944 can become support rather than another rejection point. INJ is close to 8.00, but will buyers break the ceiling or pause to build a stronger base first?#ByXIMPACT #BitcoinSlidesBelow$80K
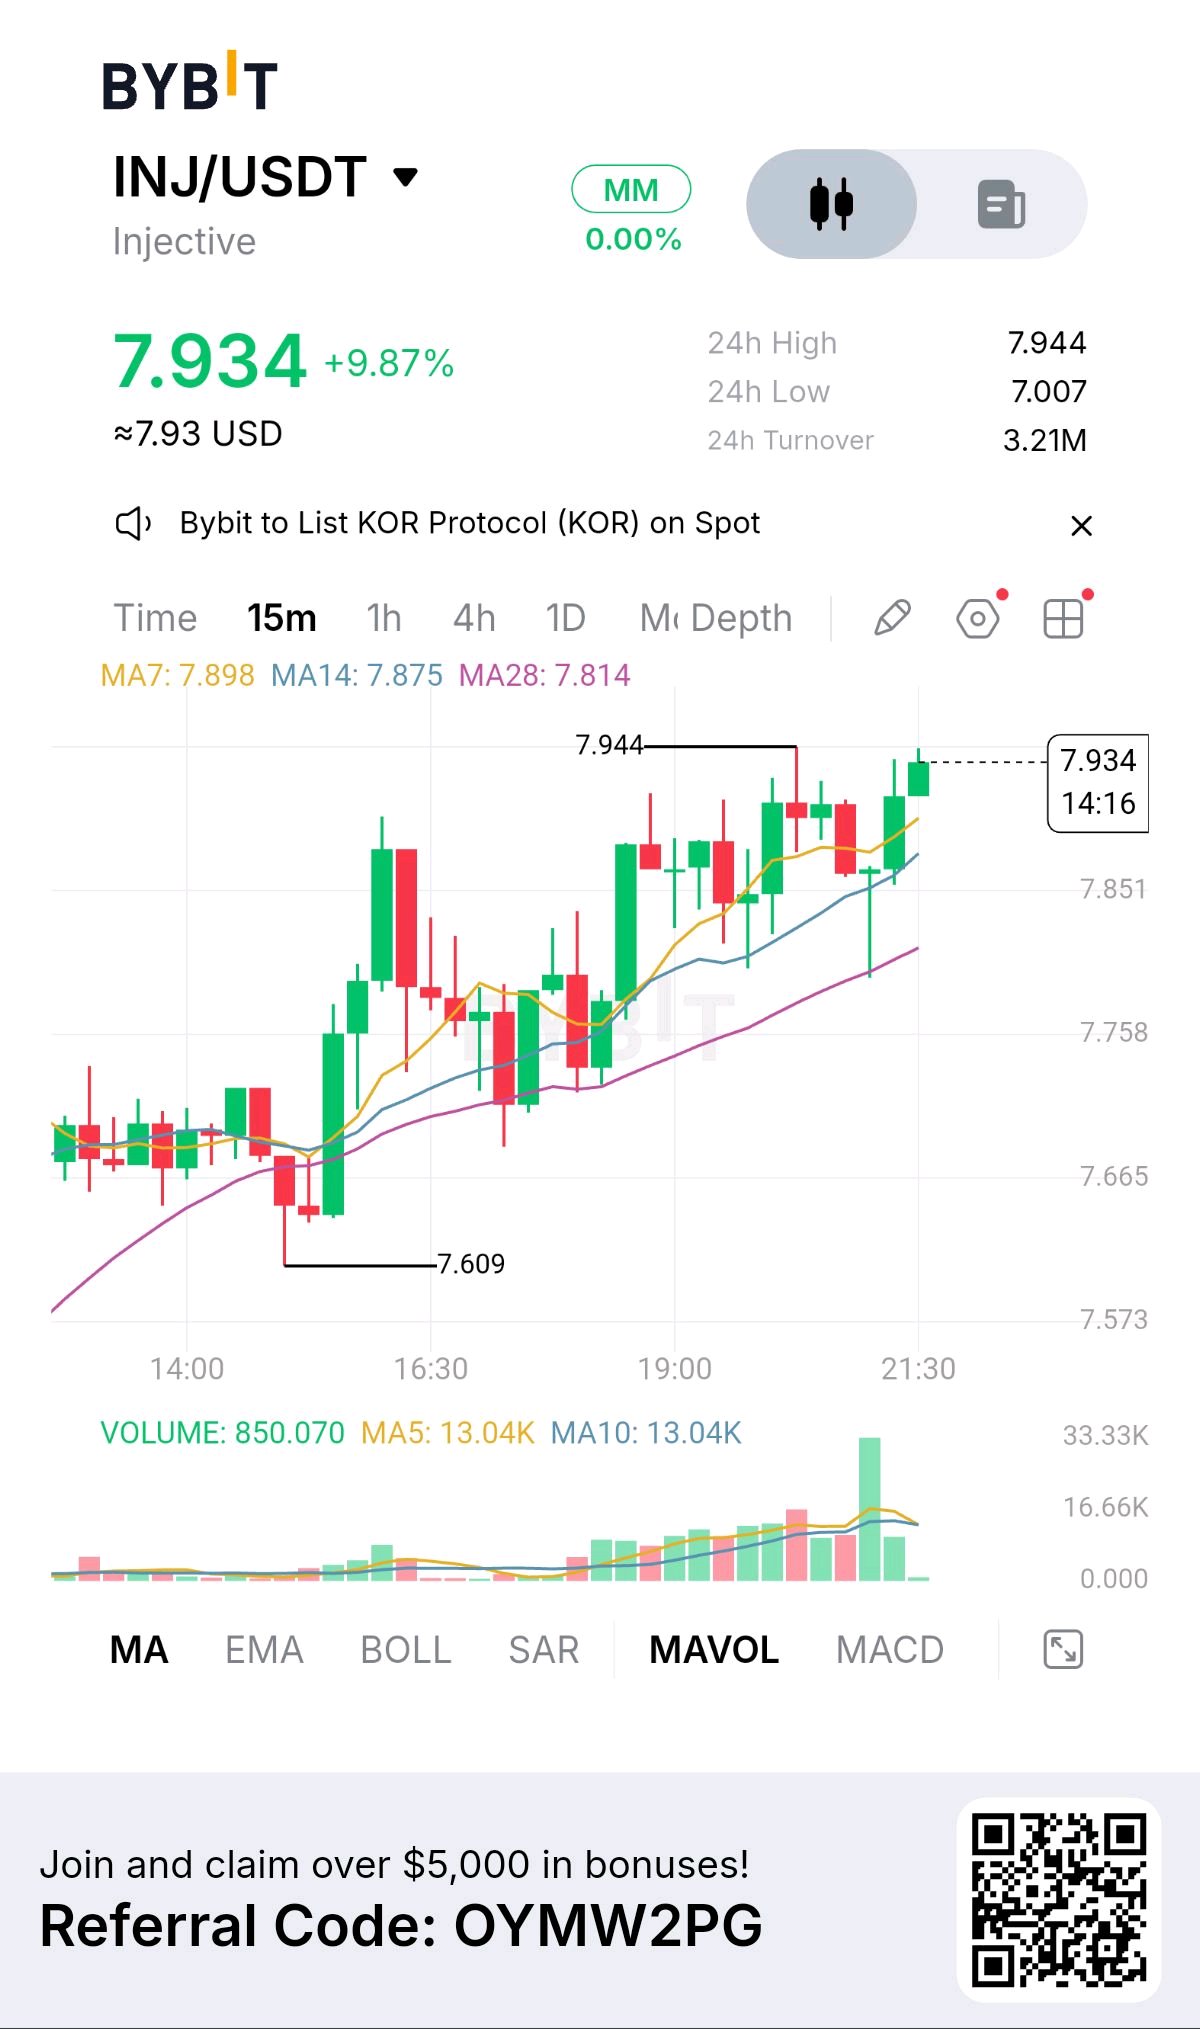
$HYPEUSDT — Buyers Are Defending Support, But the Recovery Needs Confirmation $HYPEUSDT — Hyperliquid is showing signs of a potential recovery after a recent pullback. Price has moved into an important demand area around $81–$84, where buyers have started showing interest. The reaction is worth watching, but one bounce does not automatically mean the bearish structure is over. The first level I'm watching is $81–$84. This zone represents an important support area following the recent decline. If buyers continue defending it and price establishes higher lows, it could signal that selling pressure is beginning to weaken. However, a sustained move below $81 would put the recovery narrative under pressure and could expose lower levels. There's also a major obstacle overhead. The $87–$89 region is the first resistance area to monitor. A convincing recovery above this zone could open the door toward $90–$94, where sellers may become active again. A stronger reclaim of $94 would provide more evidence that bullish momentum is returning. for r now, I'm watching two possible developments: Bullish scenario: HYPE holds $81–$84, forms a higher low, and reclaims $87–$89. This would strengthen the recovery structure. Bearish scenario: Price loses $81 and fails to recover it. That would weaken the demand-zone thesis and increase the possibility of another downside test. A sustained breakdown below $81 would invalidate the current support-defense idea. The bigger picture remains interesting, but confirmation matters more than anticipation. Until HYPE reclaims resistance, this is a developing recovery attempt rather than a confirmed trend reversal.#ByXIMPACT #BitcoinSlidesBelow$80K #BlockchainSecurity #Oracle20BFundingPlanTestsTheAITrade
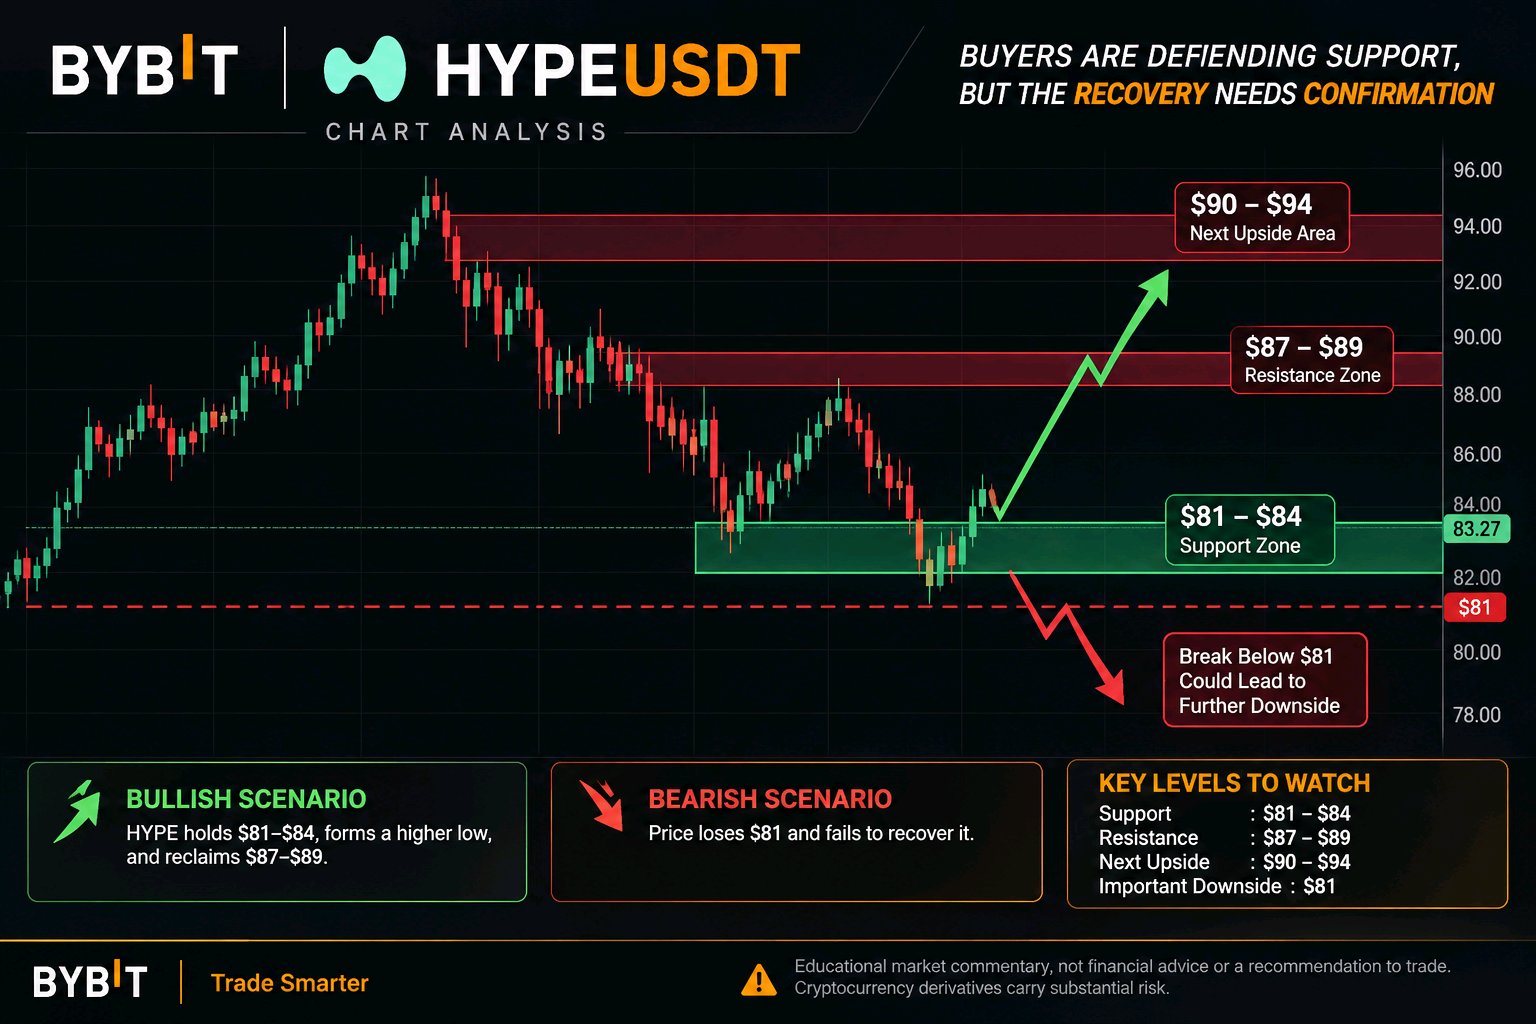

$OP/USDT — Potential Long Setup
A structured trade idea for traders watching $OP. Trade Plan: - Current Price: $0.11185 - Direction: LONG - Order Type: Limit - Entry: $0.10960 - Stop Loss: $0.09800 - TP1: $0.13000 - TP2: $0.15000 - TP3: $0.18000 - Leverage: 3x - Risk: 1% of account The key is patience. Let price reach your planned entry instead of chasing the market. Risk management comes first. Leverage amplifies both gains and losses, and stop-loss orders may not execute at the exact expected price during volatile conditions. Not financial advice. Always do your own research and manage risk responsibly. Are you watching $OP for a potential setup? #ByXIMPACT #BitcoinSlidesBelow$80K $OPUSDT $BTCUSDT

The violent rejection from the $0.95650 high on this 15m SUI chart is exactly what caught my attention. After that massive green impulse, we are now seeing a sharp pullback, and the price action is testing the short-term moving averages. My read is that we are in a post-breakout consolidation phase. The market structure is currently caught between the recent local high and the support base built around the $0.9270 area. I wouldn't chase a long right here in the middle of this red retracement; the momentum has clearly shifted short-term, and the MAs are starting to flatten. The structure looks heavy until we see a clear reclaim of the $0.9340 level (MA7) or a sweep of local liquidity. Trade Plan Bias: WAIT (Leaning Short on breakdown / Long on reclaim) Entry: · Short: On a confirmed break and close below $0.9270 (MA28). · Long: Only on a strong reclaim and hold above $0.9340. Confirmation: For a short, I need to see a 15m candle close definitively below the $0.9270 support, turning it into resistance. For a long, I need a higher low above $0.9300. Stop / Invalidation: · Short: $0.9350 (Above the local MA cluster). · Long: $0.9270. TP1: $0.9150 TP2: $0.9060 (Previous major swing support) R:R: Approximately 1:2.5 for the short if it triggers. The biggest risk right now is getting chopped up in this current no-man's land. The volume is also thinning out compared to that massive pump, which makes me cautious about a sudden fakeout. If price just chops sideways here above $0.9270, my short thesis is invalidated, and I’d rather sit on my hands. I’d stay patient until this 15m compression resolves. Are you watching this $0.9270 support level hold, or are you expecting a deeper liquidity sweep back toward the $0.90s? $SUIUSDT $TSLAXUSDT #MidtermsMarketWatch #BitcoinSlidesBelow$80K
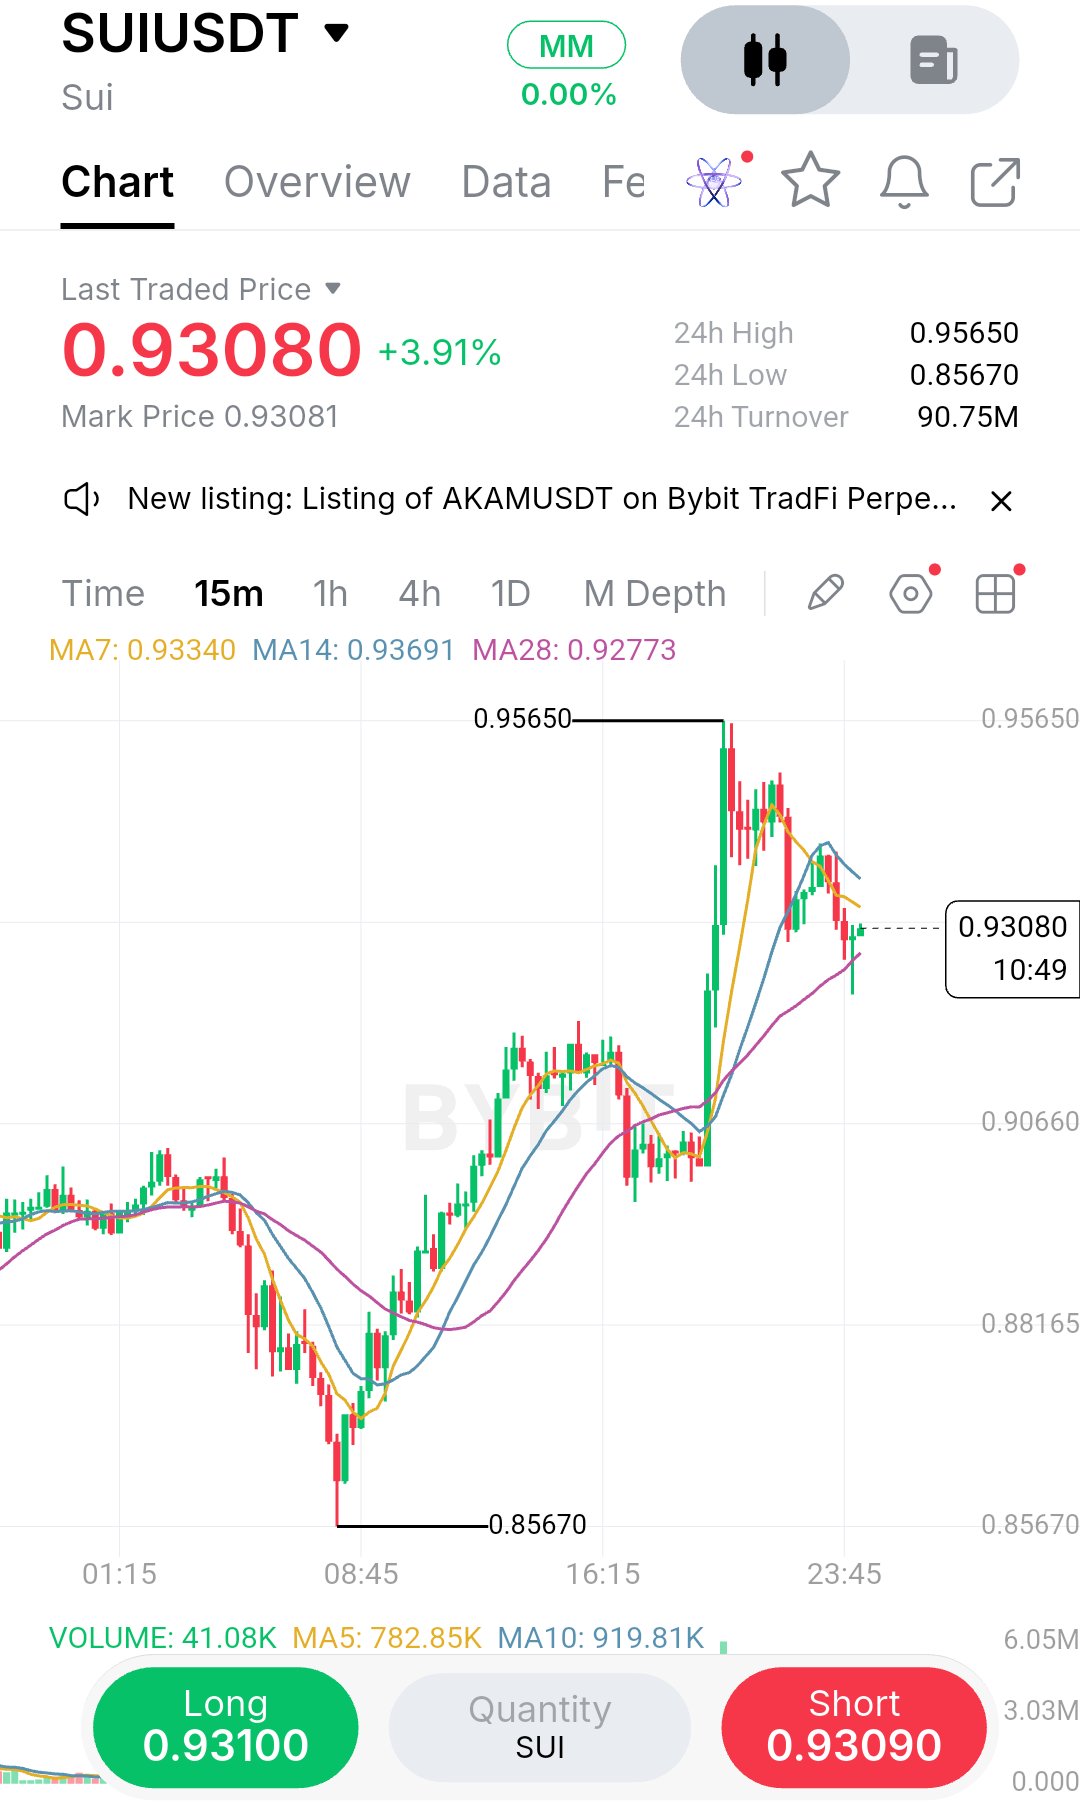
What caught my attention on this ETH 15m chart is the violent vertical expansion off the $2,225 low. Price didn't just drift up.it aggressively swept liquidity and rallied straight into the $2,451 resistance, leaving a massive gap in structure. Right now, we are seeing consolidation at the highs, but I wouldn't chase this green candle. My read is that the market is pausing to digest that massive impulse, and the real opportunity lies in how it reacts to the immediate support levels below. The structure is clearly bullish, but buying the exact top here offers terrible risk/reward. I'm watching the $2,394–$2,400 zone (near the MA14 and prior minor resistance now acting as support) for a higher low. If we get a rejection candle there, that's my trigger. What I like most about this setup is the moving average alignment. The MA7 and MA14 are curling up sharply, and the MA28 is trailing well below at $2,381, confirming the broader intraday trend. The volume profile also shows a strong cluster near the breakout origin, which tells me buyers are still defending that area. I'd rather wait for a controlled retracement than enter at the current price. If price simply consolidates sideways above $2,420 without giving a pullback, I'll accept missing the trade chasing a 5.5% intraday move is a fast way to get trapped. Trade Plan: Bias: LONG (on pullback) Entry Zone: $2,395 – $2,405 Confirmation: Bullish rejection wick or strong volume recovery within the zone. Stop / Invalidation: $2,380 (Below the MA28 and local demand) TP1: $2,451 (Recent swing high) TP2: $2,480 (Psychological extension) TP3:$2,520 (Higher structural target) R:R: Approx 1:2.5 to TP1 The biggest risk is a failed breakout. If price loses the MA28 with volume, this is just a fakeout and I'm out. I'm staying patient until the pullback. Are you waiting for a retest of the $2,400 area, or are you looking for a short scalp if this top rejects? $ETHUSDT $SOLUSDT #MidtermsMarketWatch #BitcoinSlidesBelow$80K