AlphaSaylor
Alpha Traderz | Daily BTC, Gold XAUUSD & Crypto Signals. Technical + On-chain analysis. Learn, trade, grow together. Not financial advice.
Some lead teams. Others build legacies. As Captain of TEAM ALPHA, I am officially entering the Bybit WSOT - Squad Showdown, the most prestigious trading competition in the world. This is where discipline meets opportunity. Where strategy meets execution. Where 12 traders move as one unit, with one objective. Prize Pool: $3.2 Million USDT We are not here for hype. We are here for results. Team Alpha is now open for traders who don't just watch the market — they dominate it. Scan the QR. Join the squad. Make history with us. — Captain, Team Alpha #ByXIMPACT #WSOT2026 #WSOTPicktoEarn10U

The World Trades Here - WSOT 2026 is BACK! 🌍🏆
Bybit's flagship World Series of Trading returns with its biggest evolution yet. Under the theme "The World Trades Here", WSOT 2026 has transformed from a crypto-only competition into a full multi-asset championship. Event Details: 📅 Period: Oct 29 - Dec 2, 2026 💰 Prize Pool: Up to 10,000,000 USDT 🔥 Theme: Crypto, Stocks, Gold, Oil, Indices & AI - All in One Account WSOT 2026 has 5 massive tracks: - Squad Showdown: Up to 3.2M USDT - Global Assets (NEW): Up to 3M USDT (Spot & TradFi Perps) - Individual Showdown: Up to 2M USDT - AI Showdown (NEW): Up to 1M USDT - Preheat Quest: Up to 800K USDT This year is special because for the first time we can trade Stocks, Gold and TradFi Perps inside WSOT. This is true global trading! And in this historic edition, I'm proudly backing my squad: SQUAD NAME: Team Alpha CAPTAIN NAME: Alpha Saylor WHY TEAM ALPHA WILL WIN? 1. What does the squad trade best? Team Alpha trades best where volatility meets opportunity. Our mastery is in BTC & ETH derivatives and Spot, with a new powerful edge in Global Assets like Gold (XAU) and Stock Perps (mStocks). We don't trade noise, we trade high-probability momentum setups during London & NY sessions. 2. What makes the captain stand out? Captain Alpha Saylor is not a signal provider, he is a leader. Like his name, he brings Saylor-like conviction with Alpha-level execution. He trades live with the squad, shares full transparency on risk, and his first rule is: Protect Capital First, Grow Second. 3. What defines their trading DNA? Our DNA is simple: Discipline. Data. Domination.We follow a strict system - No emotional trading, no revenge trades. Every entry is data-backed, every exit has a fixed stop-loss. 4. Why do I believe they can win? The 3.2M USDT Squad Showdown is not won by one star trader, it's won by the most united squad. While others will struggle to adapt to the new Global Assets and AI tracks, Team Alpha was built for this multi-asset era. This is not just participation. Team Alpha is here to take the WSOT 2026 trophy. #WSOTPicktoEarn10U #WSOT2026

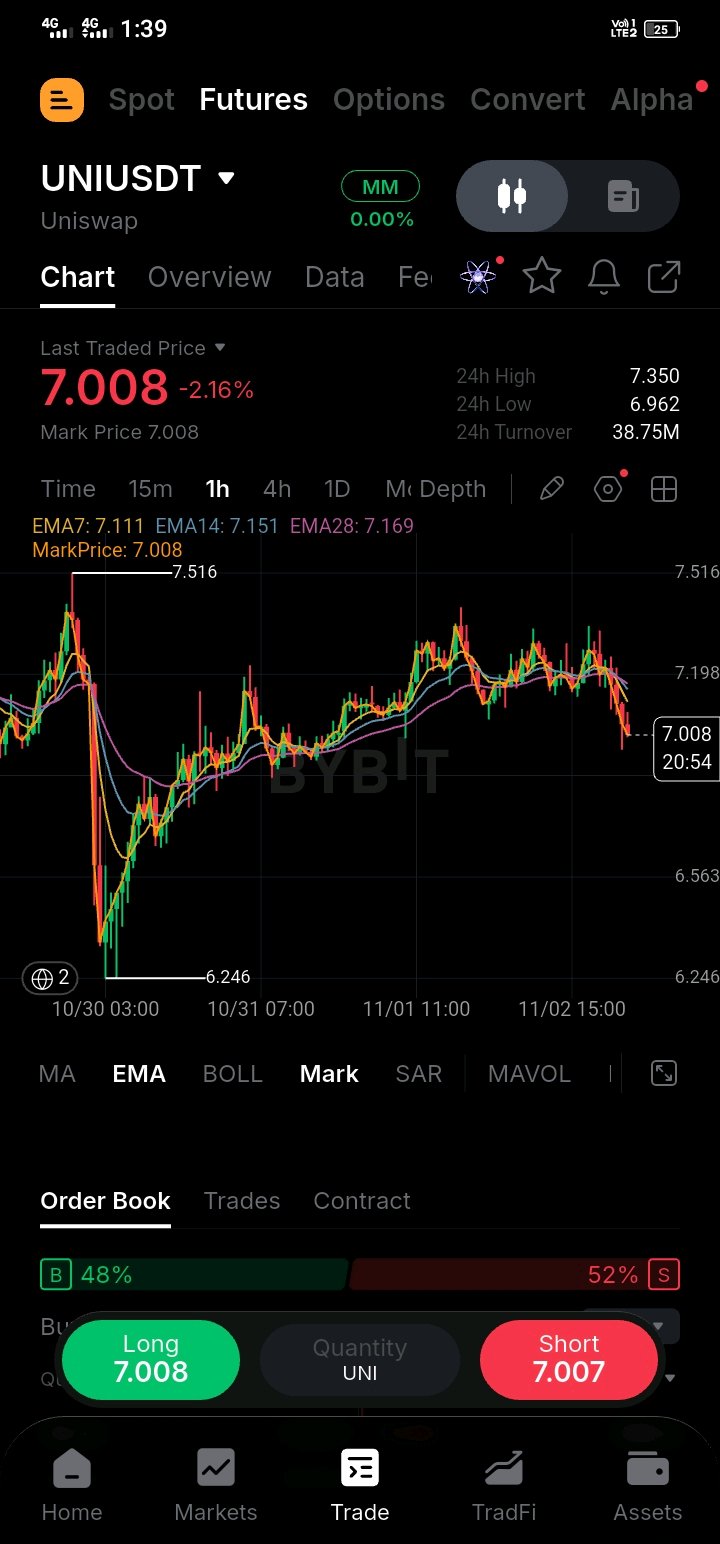
Uniswap is facing a clean localized pullback today as price trades down toward the psychological $7.00 threshold, retreating over 2.15% after failing to maintain its recovery rally. When an altcoin retests key psychological handle support under descending moving averages, market structure shifts into a sensitive equilibrium phase where buyers must defend local demand to avoid a deeper retrace. Fundamental tailwinds surrounding Uniswap remain solid, driven by dominant DEX volume share and ongoing protocol fee distribution updates across layer-2 ecosystems. While long-term decentralized liquidity metrics remain healthy, short-term market corrections often force temporary leverage flushes before structural accumulation resumes. Reviewing the 1-hour chart, $UNIUSDT is trading at $7.008 (-2.16%), holding below its 7 EMA ($7.111), 14 EMA ($7.151), and 28 EMA ($7.169). 24-hour turnover has reached $38.75M, with order book depth reflecting 48% buy bids against 52% sell asks as price floats just above the $6.962 daily low. Key Levels to Watch: 1. 24h Low Support ($6.962) 2. Local Swing Low Support ($6.246) 3. Hourly 7 EMA Resistance ($7.111) 4. Hourly 28 EMA Resistance ($7.169) My Trade Plan: • Bias: Pullback Support Rebound (Long) • Risk-to-Reward Ratio: 1 : 3.3 • Entry Zone: $6.950 – $7.020 • Take Profit 1: $7.350 (Lock in 50% profits + shift stop-loss to breakeven) • Take Profit 2: $7.650 • Extended Target: $8.100 • Invalidation / Stop Loss: $6.820 (Clean hourly close below the $6.962 low) Position exposure is tightly controlled under a 1% account risk ceiling with conservative leverage, holding off any scale-in orders until the first target triggers and risk is neutralized. I am eyeing this long opportunity because UNIUSDT is compressing near a key round-number demand zone with $38.75M turnover, offering an attractive risk-defined bounce setup back toward the $7.350 high. Are you buying Uniswap at this $7.00 support zone or waiting for a confirmed reclaim of the $7.11 EMA first? Share your strategy below 👇$UNIUSDT $XPLUSDT #ByXIMPACT #IMPACTbyTrade
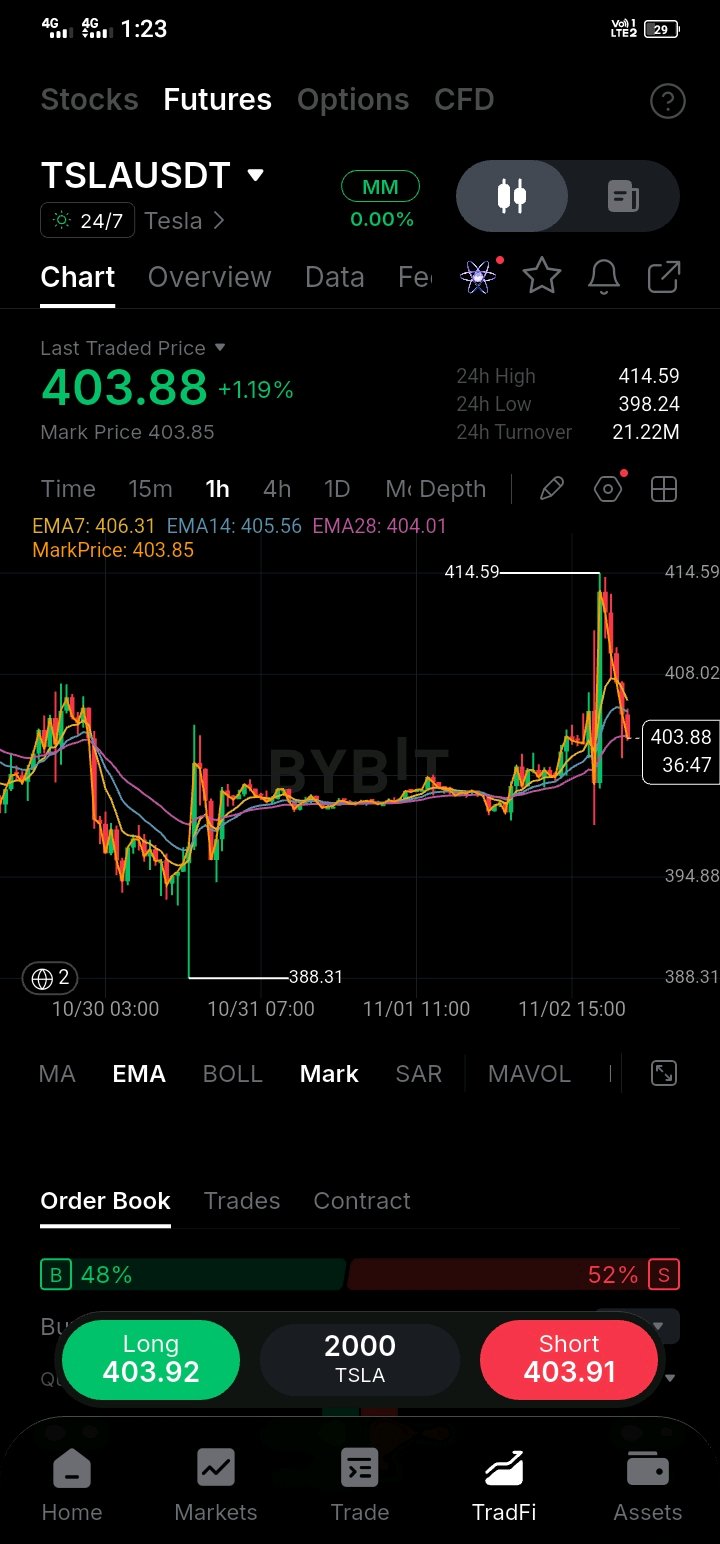
TSLAUSDT just got sharply rejected off the 414.59 high, with a steep red candle driving price straight back through its short-term moving average cluster on the 1-hour chart. After an explosive rally up to 414.59, momentum suddenly dried up as profit-taking triggered a quick drop down to current levels near 403.88. Price action has already sliced below the 1-hour EMA7 (406.31) and EMA14 (405.56), and is now testing the EMA28 line (404.01) from above. The sharp upper tail combined with back-to-back red candles shows that sellers have taken short-term control of the order flow. WHERE LIQUIDITY LIES Primary overhead resistance rests between 406.50 and the 414.59 peak, marking the immediate supply zone where heavy selling stepped in. Beneath current price, the 398.00 to 401.00 area acts as a crucial retest zone, backed by today's low of 398.24. Further down, key macro support sits at the 388.31 swing low, which represents the major demand floor where buyers previously stepped in to turn the market around. Slipping beneath short-term moving averages after a violent rejection indicates that going long mid-range carries excessive risk. A clearer execution plan involves looking for a corrective relief bounce toward the 406.00–408.50 supply pocket. If sellers defend those re-claimed EMAs, it validates a lower high structure for a downside continuation toward lower support levels. TRADE EXECUTION MAP PAIR: TSLAUSDT Bias: Short Sell Zone: 406.00 – 408.50 Stop Loss: 412.50 Targets: 400.00 → 395.00 → 388.50 R:R Ratio: 1:2.4 TRADE RATIONALE The swift breakdown through the 1-hour EMA stack following an overextended rally confirms that buyers are exhausted, leaving room for a deeper retracement to test main structural support. THE STOP LEVEL & CAPITAL PROTECTION A 1-hour close back above 412.50 invalidates the short bias and signals a potential recovery attempt toward the high—step aside immediately if that level is reclaimed. Maintain conservative position sizing, enforce tight leverage control on stock futures contracts, and avoid shorting into support without a pullback. Do you expect TSLAUSDT sellers to defend the 406 EMA area for another drop, or will buyers reclaim 408 to push back toward 414?$TSLAXUSDT $GOOGLXUSDT #ByXIMPACT #IMPACTbyTrade

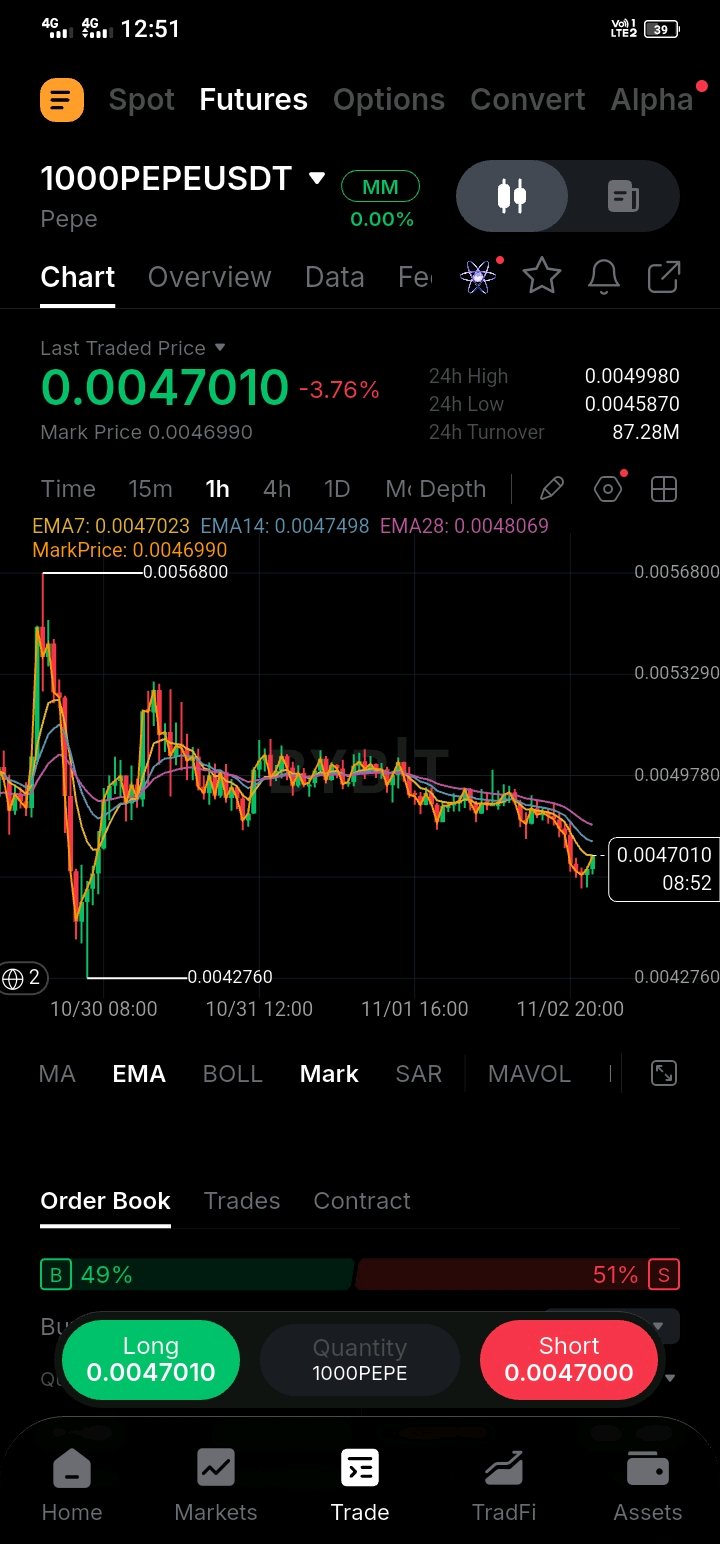
1000PEPE was bleeding lower throughout the session, but seeing a sharp absorption bounce off the $0.00458 low caught my attention. On the 1-hour timeframe, 1000PEPEUSDT printed a bottom wick down to $0.0045870 before rebounding to $0.0047010 (-3.76%). Price is currently testing immediate resistance at the 1-hour EMA 7 ($0.0047023), while the EMA 14 ($0.0047498) and EMA 28 ($0.0048069) sit just above. A solid 1-hour candle close above $0.0047500 completes a local market structure shift (MSS), clearing the way for a recovery expansion toward intermediate supply at $0.0049780 and the macro high at $0.0056800. Order flow metrics reflect a balanced order book with 51% sell-side against 49% buy-side, while 24-hour turnover has reached $87.28 million USDT. Passive limit orders actively absorbed sell volume below $0.0046000, keeping price well above the major $0.0042760 swing low. Holding the $0.0046000 - $0.0046800 support zone on lower timeframe pullbacks maintains a favorable base for trend reversal. Pepe continues to command top-tier liquidity and volume leadership across the memecoin market sector. Strong speculative interest and ongoing DEX/CEX trading activity provide rapid momentum shifts whenever price sweeps key intraday liquidity levels. Here's my plan • Bias: Long (On EMA dynamic breakout / support hold) • Entry Zone: $0.0046200 - $0.0047000 (Wait for 15m/1H bullish hold near recent low absorption) • Take Profit 1: $0.0049800 • Take Profit 2: $0.0053200 • Take Profit 3: $0.0056800 • Stop Loss: $0.0044800 (Hard invalidation below 24h low at $0.0045870) • Leverage & Risk: Max 2x–3x Leverage | Risk 1% of portfolio • Risk-to-Reward (R:R): 1 : 2.8 A key lesson I've learned when trading high-beta assets after a protracted intraday slide is to wait for the immediate EMA 7 reclaim before positioning. Entering on verified lower-timeframe absorption protects against catching falling knives while maintaining a tight risk boundary. Are you bidding 1000PEPE around this $0.00465 retest zone, or waiting for a confirmed 1-hour close above $0.00475 first?$PEPEUSDT $DOGEUSDT #ByXIMPACT #IMPACTbyTrade
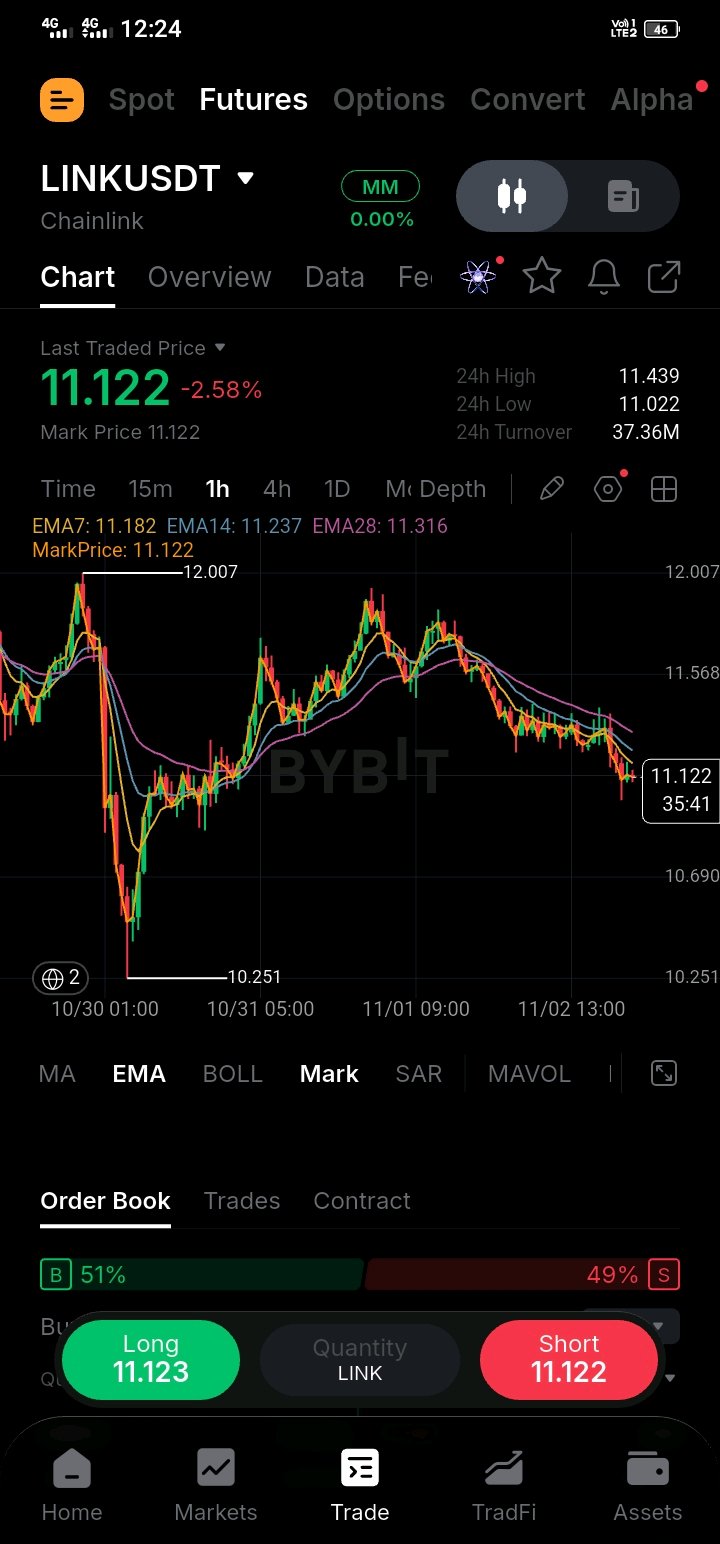
LINKUSDT is trending downward on the 1H timeframe after getting repeatedly rejected below the EMA cluster, and I’m monitoring this chart to see if sellers force another leg lower. Price is trading near 11.122 (-2.58% today), sitting close to the 24h low of 11.022 after pulling back from a 24h high of 11.439. 24h turnover stands at 37.36M with orderbook buy-side volume closely balanced at 51%. The 1H chart shows price holding below the short-term indicator stack, with EMAs fanning out overhead to maintain steady downside pressure. EMA7 11.182, EMA14 11.237, EMA28 11.316 The 11.200-11.320 zone is currently acting as active overhead resistance. As long as price remains capped beneath these moving averages, seller momentum dominates the market structure. Levels to watch: Upside: Reclaiming 11.439 is required to shift short-term structure back toward a bullish retest of 11.568. Downside: A clean loss of 11.022 opens the path toward deeper support zones at 10.690 and 10.251. Execution Setup: Pair: LINKUSDT Bias: SHORT Entry Zone: 11.200-11.300 Stop Loss: 11.450 TP1: 11.020 TP2: 10.700 TP3: 10.300 Risk-Reward: Approximately 1:1.2 to TP1, 1:2.8 to TP2, and 1:4.8 to TP3 Risk & Invalidation: This setup invalidates if LINKUSDT closes above 11.450 on the 1H timeframe. Avoid chasing short positions around current lows at 11.122. Waiting for a relief bounce into the 11.200-11.300 supply region offers much tighter risk management. Keep position sizing controlled. Do you see LINK pushing below 11.00 to test 10.69 next, or will buyers step in for a recovery toward 11.40 first? $LINKUSDT $TIAUSDT #ByXIMPACT #IMPACTbyTrade
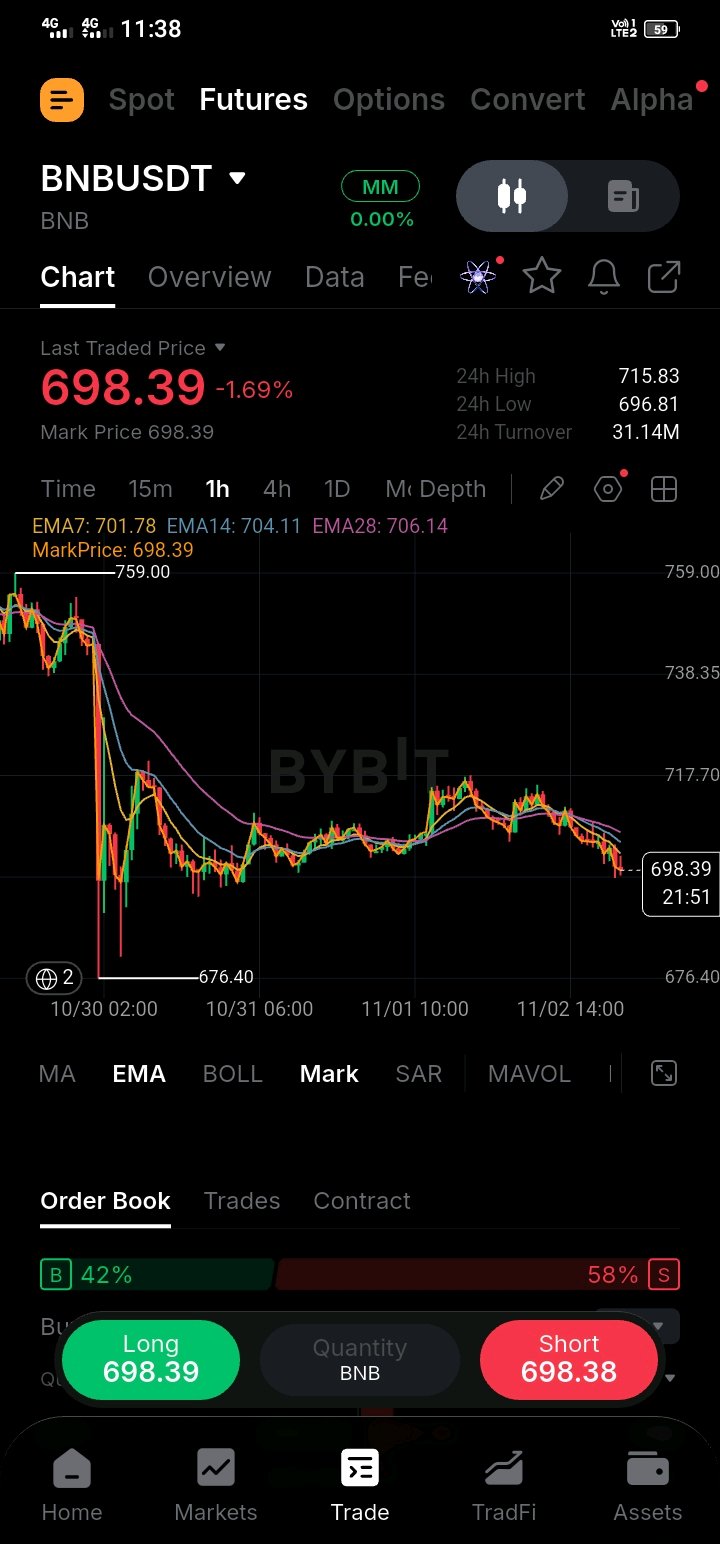
Most traders are sleeping on BNB (BNBUSDT) right now as price consolidates around $698.39 after absorbing a minor 1.69% intraday dip, but the underlying structure is building firm support following the completion of BNB Smart Chain's 37th quarterly Auto-Burn, which wiped out 1.64 million BNB worth nearly $1.2 billion from active circulation. That massive multi-billion dollar supply contraction, coupled with continuous real-time protocol burns via BEP-95 and expanded EVM processing capabilities under the 2026 technical roadmap, underpins a strong structural floor for the asset. Examining the 1-hour chart, BNB is forming a base beneath its moving average cluster, with the 7-period EMA at 701.78, 14-period EMA at 704.11, and 28-period EMA at 706.14 serving as immediate dynamic hurdles buyers are aiming to breach. Regarding key structural levels, price recently swept lower liquidity near the $676.40 swing low before rebounding toward the $715.83 daily high and settling into range consolidation around $698.39. Despite the order book displaying a 58% sell-side tilt from short-term scalpers, buyer defense above $690.00 remains constant. Provided price holds above the $676.40 structural pivot, market dynamics remain primed for a recovery drive toward upper liquidity pools. Execution Plan: BNBUSDT (Perp) • Bias: Bullish Reversal (Quarterly token burn catalyst & 1-hour demand defense) • Entry Zone: $685.00 - $695.00 (Scaling in on local dips near lower timeframe support) • Target 1: $715.80 (24-hour high / Immediate resistance) • Target 2: $738.30 (Horizontal supply zone) • Target 3: $759.00 (High timeframe swing high sweep target) • Invalidation (SL): $675.00 (Technical stop exit below 24-hour low pivot) As BNB stabilizes following its recent sweep of the local lows, I am strictly enforcing a 1% maximum portfolio risk limit on this setup. Setting invalidation right below the $675.00 structural pivot secures a clean 1:3.1 Risk-to-Reward ratio while protecting capital against further market-wide liquidations. I am utilizing low leverage between 2x and 4x on isolated margin to navigate short-term order book volatility safely. Are you looking to scale into BNB longs around this $698 level following the billion-dollar supply burn, or waiting for a cleaner retest of $685 first? Drop your trade plan below! $BNBUSDT $BTCUSDT #ByXIMPACT #IMPACTbyTrade
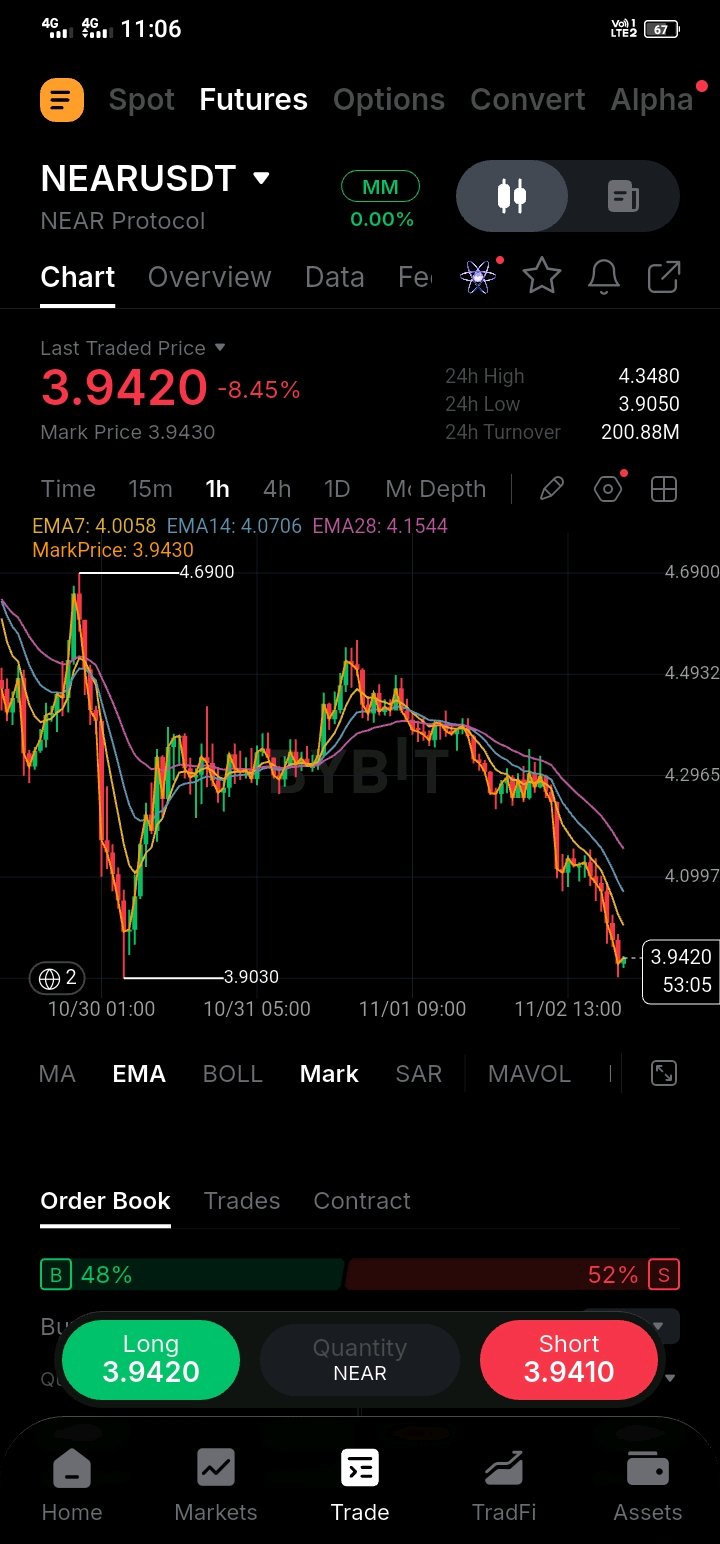
NEAR Protocol is navigating heavy selling pressure today as price breaks down toward $3.94 after failing to hold above the $4.34 peak. When an asset suffers an aggressive impulse down to test a major historic base like $3.9030, the market typically searches for a decisive reaction to confirm whether buyers will step in for a relief bounce or permit a further structural breakdown. From a fundamental standpoint, NEAR continues to build out its user-owned AI stack and cross-chain abstraction layer, attracting steady developer engagement and network activity. However, broader market risk-off sentiment and leverage resets often force temporary, sharp price corrections across Layer 1 assets regardless of underlying ecosystem growth. Examining the 1-hour chart, $NEARUSDT is trading at $3.9420 (-8.45%), sitting well below its 7 EMA ($4.0058), 14 EMA ($4.0706), and 28 EMA ($4.1544). 24-hour turnover has surged to $200.88M, while order book depth shows a close balance of 48% buy bids versus 52% sell asks as price hovers directly above the $3.9050 daily low. Key Levels to Watch: 1. Local Double-Bottom Support ($3.9030) 2. 24h Low Support ($3.9050) 3. Hourly 7 EMA Resistance ($4.0058) 4. 24h High Resistance ($4.3480) My Trade Plan: • Bias: Support Bounce / Rebound Long • Risk-to-Reward Ratio: 1 : 3.2 • Entry Zone: $3.9000 – $3.9500 • Take Profit 1: $4.1800 (Lock in 50% profits + shift stop-loss to breakeven) • Take Profit 2: $4.3800 • Extended Target: $4.6500 • Invalidation / Stop Loss: $3.8300 (Clean hourly close below $3.9030 support) Capital preservation remains the top priority, keeping overall risk strictly below 1% of equity with modest leverage, and holding all scale-in orders until the first profit target triggers. I am eyeing this rebound trade because NEAR is testing a major historical double-bottom floor near $3.9030 with high $200.88M turnover, offering a favorable risk-to-reward window for a tactical move back toward overhead EMA resistance. Are you bidding NEAR on this $3.90 support retest or waiting for a recovery back above $4.00 first? Drop your thoughts below 👇$NEARUSDT $QNTUSDT #ByXIMPACT #IMPACTbyTrade
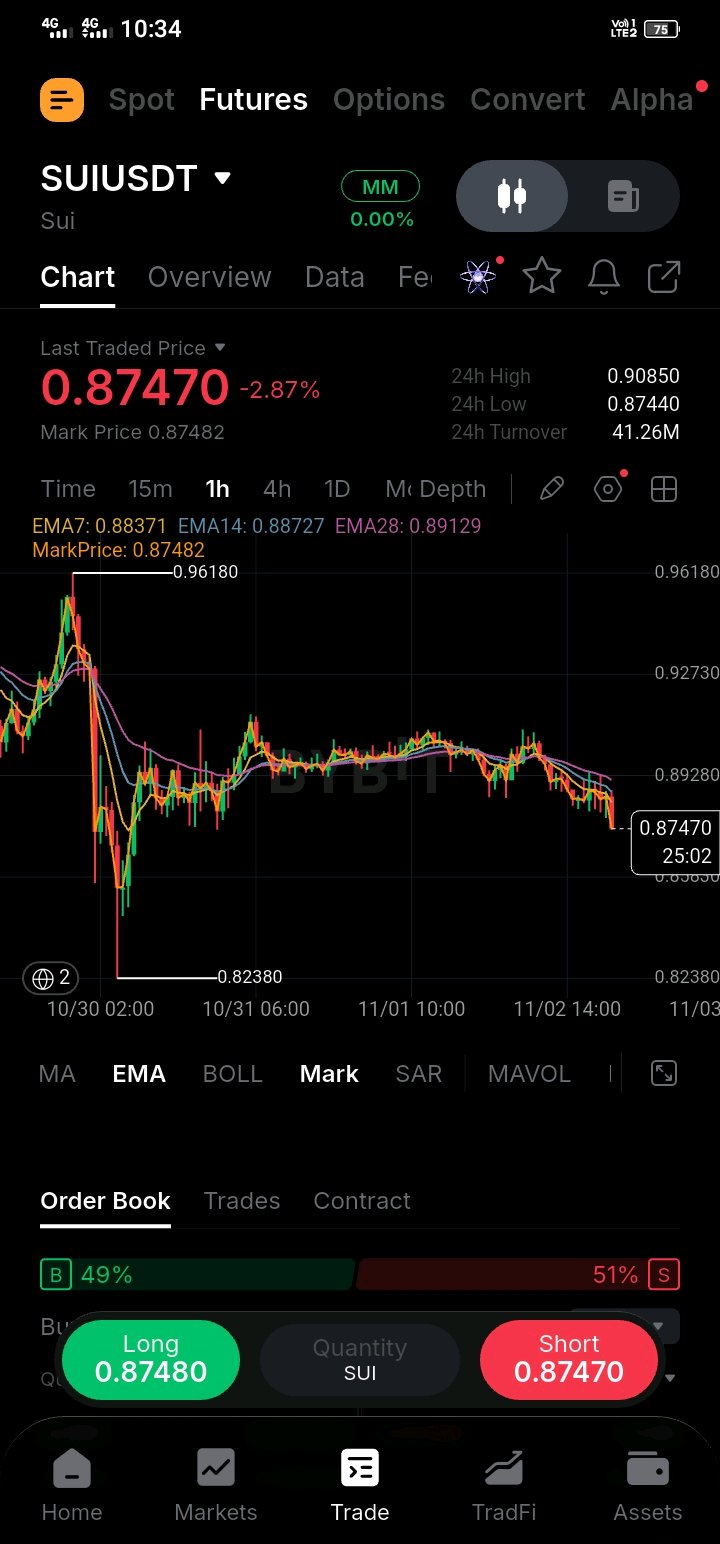
SUIUSDT is exhibiting clear short-term weakness on the 1-hour chart, dropping -2.87% to trade near $0.87470, right around its 24-hour low of $0.87440. Trading volume stands moderate with 24-hour turnover at $41.26M following rejection from the intraday high of $0.90850. Order book sentiment leans slightly bearish with 51% sell-side dominance versus 49% buyers. Opening aggressive long positions while price continues to leak lower against active distribution offers poor entry quality. From a structural viewpoint, price action has broken below local consolidation floors and remains capped beneath key moving averages. The 1-hour exponential moving averages reflect a solid bearish stack, with the 7 EMA ($0.88371), 14 EMA ($0.88727), and 28 EMA ($0.89129) acting as dynamic resistance overhead. Rather than catching a falling knife near local lows, waiting for price to retest overhead dynamic resistance provides a much cleaner risk-defined entry. Key Levels • Resistance: $0.89130 • Dynamic Support: $0.87440 • Re-entry Zone: $0.88700 – $0.89200 • Breakdown Trigger: $0.87000 My Trade Plan • Bias: SHORT (on pull-back retest) • Entry Zone: $0.88700 – $0.89200 • Confirmation: 1H bearish rejection candle or price failing to hold above $0.88800 on declining buy volume • Invalidation: $0.90200 (an hourly candle close above this level reclaims the local structural pivot and clears the 28 EMA) • Target 1 (TP1): $0.87440 • Target 2 (TP2): $0.85200 • Risk to Reward: ~1:2.4 from midpoint entry to TP2 Why This Trade? This framework capitalizes on SUI’s persistent hourly downtrend while avoiding short entries at the absolute bottom of the leg. Entering on a corrective rally into the $0.88700–$0.89200 zone aligns our risk directly against dynamic 28 EMA resistance ($0.89129), maintaining tight capital protection alongside upside-downside symmetry toward lower support targets. Are you shorting the relief bounce into $0.89000 or watching for a breakdown below $0.87000? Drop your trade plan below. $SUIUSDT $MNTUSDT #ByXIMPACT #IMPACTbyTrade
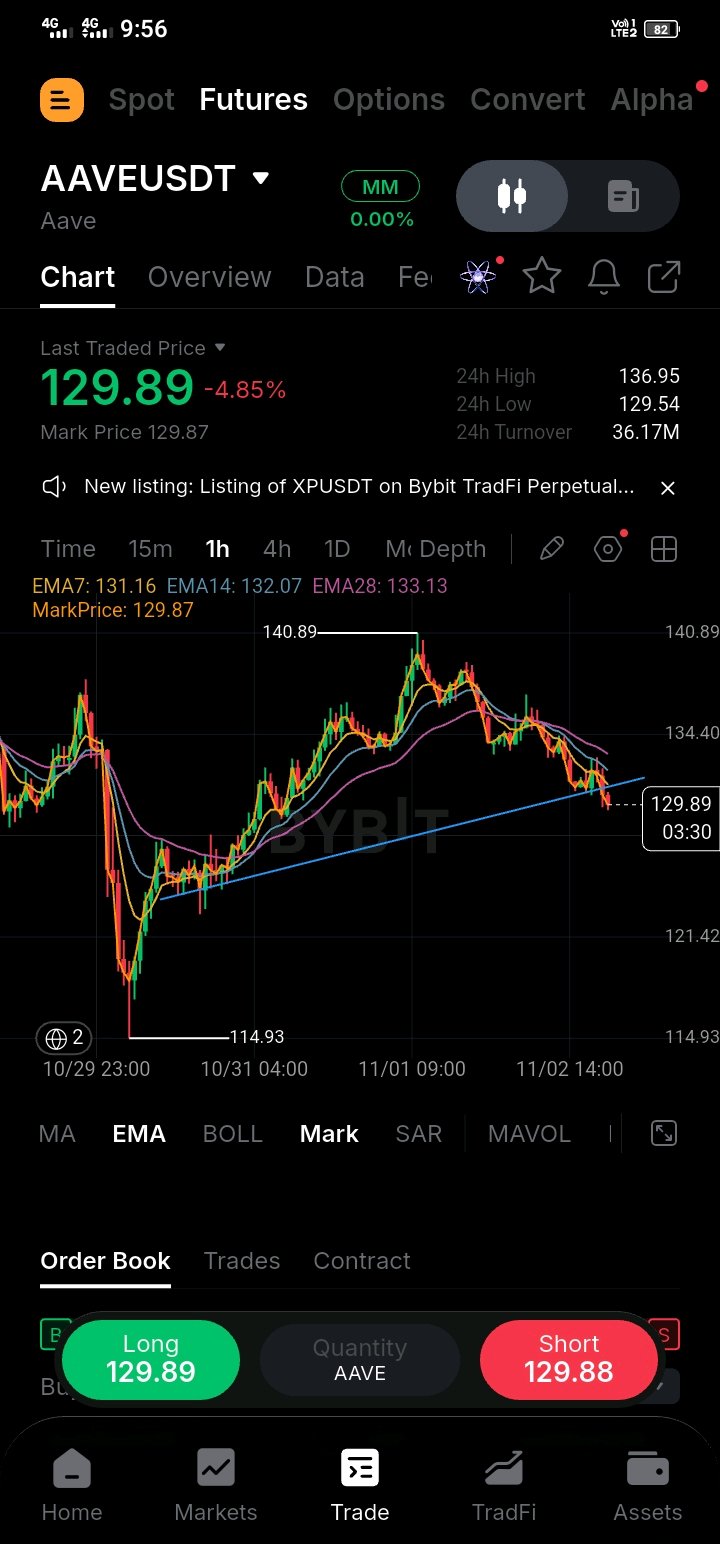
I was almost ready to short $AAVE at $129 following this 4.5% red wave, until I noticed price is slamming straight into key liquidity demand while sitting right above its major pullback floor. $AAVE is trading around $129.89 right now, down -4.59% after pulling back from its recent high of $140.89 to a 24-hour low of $129.55. 24-hour turnover is holding strong at $36.17M. On the 1-hour chart, price is pressing slightly below the EMA stack (EMA 7 at $131.16, EMA 14 at $132.07, and EMA 28 at $133.13), which is creating a classic retail panic flush. However, looking at the structural picture, this pullback comes right after an explosive run up from the $114.93 macro bottom. Selling aggressively at $129 puts late shorts directly into a high-demand zone, where buyers previously accumulated heavily before the surge to $140.89. For key chart levels, $132.00 – $133.50 is our immediate hurdle to reclaim the 1-hour EMAs, with $140.80 standing as the main upside target. On the lower side, $129.55 acts as local support, while the $126.00 – $129.50 area serves as the primary demand zone where serious buyers defend the structure. My plan here is focused on patience: I am not opening a short into dynamic demand after a multi-dollar slide. I am watching price stabilize around our $128 support zone, letting seller volume dry up, and taking a low-risk relief bounce. LEVELS & ENTRY • Coin: $AAVE • Bias: Oversold Demand Bounce • Entry Zone: $127.00 – $129.50 • Target 1: $133.50 • Target 2: $136.50 • Target 3: $140.80 • Stop Loss: $123.80 INVALIDATION: A 1-hour candle close below $123.80 ruins this setup completely. Closing under this level breaks our higher-low market structure from the $114.93 bottom, turns demand into resistance, and opens the door for a drop back toward $118.00. Are you shorting $AAVE after this red push to $129 or waiting to catch the bounce off $128 demand? Let me know below 👇 $AAVEUSDT $SOLUSDT #ByXIMPACT #IMPACTbyTrade
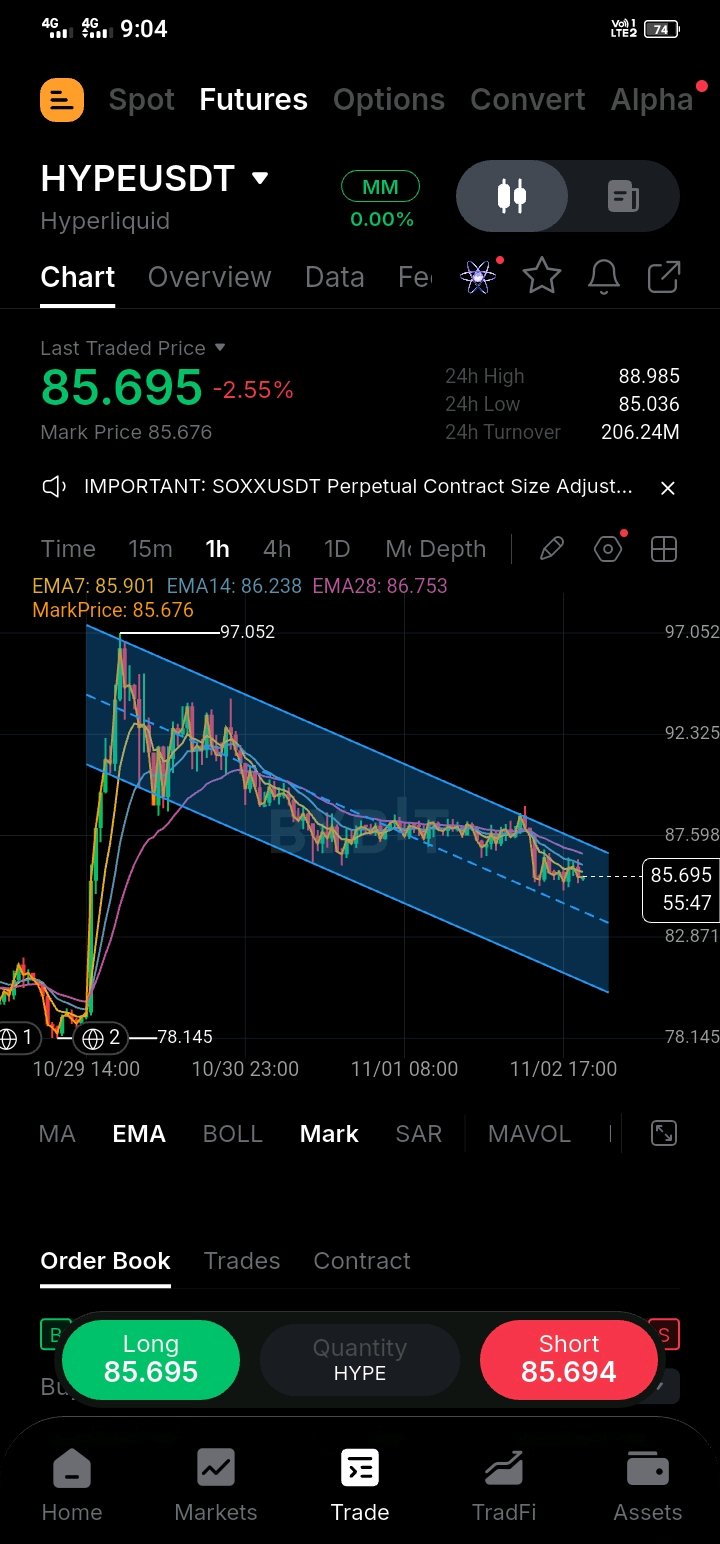
HYPE was showing steady weakness inside this downward channel, but seeing $206M in volume soak up every sell order at $85 completely caught my attention. On the 1-hour timeframe, HYPEUSDT hit a low of $85.036 after pulling back from its $88.985 24-hour high, currently trading at $85.695 (-2.55%) near the lower boundary of its parallel channel. Price is hovering just under the 1-hour EMA 7 ($85.901), EMA 14 ($86.238), and EMA 28 ($86.753) resistance cluster. A decisive 1-hour close above $86.800 would reclaim the EMA stack and confirm a valid market structure shift (MSS), breaking the channel's upper boundary and opening a path toward intermediate supply at $87.598 and higher targets at $92.325 and $97.052. Order flow metrics reflect sustained market interest, with 24-hour turnover reaching $206.24 million USDT. Passive limit orders are absorbing sell-side liquidity near the $85.00 channel floor, preventing a breakdown toward the major $78.145 macro swing low. As long as price holds above the $84.500 - $85.000 support zone on lower timeframes, the setup favors a bullish channel breakout attempt. Hyperliquid continues to capture market share through high-volume perpetual DEX activity and strong protocol yield distributions. Constant ecosystem trading volume and expanding platform metrics provide solid fundamental support whenever price dips into key channel support levels. Here's my plan • Bias: Long (On channel support hold / EMA breakout) • Entry Zone: $85.000 - $86.200 (Wait for 15m/1H bullish hold near lower channel boundary) • Take Profit 1: $87.600 • Take Profit 2: $92.300 • Take Profit 3: $97.000 • Stop Loss: $83.800 (Hard invalidation below 24h low at $85.036) • Leverage & Risk: Max 2x–3x Leverage | Risk 1% of portfolio • Risk-to-Reward (R:R): 1 : 2.9 A key lesson I've learned when trading descending channels like this is that you never sell into support when turnover remains high. Looking for lower-timeframe absorption at the lower channel line provides a tight-invalidation entry before the breakout occurs. Are you bidding HYPE around this $85.00 channel floor, or waiting for a confirmed breakout close past $86.80 first? $HYPEUSDT $RENDERUSDT #ByXIMPACT #IMPACTbyTrade
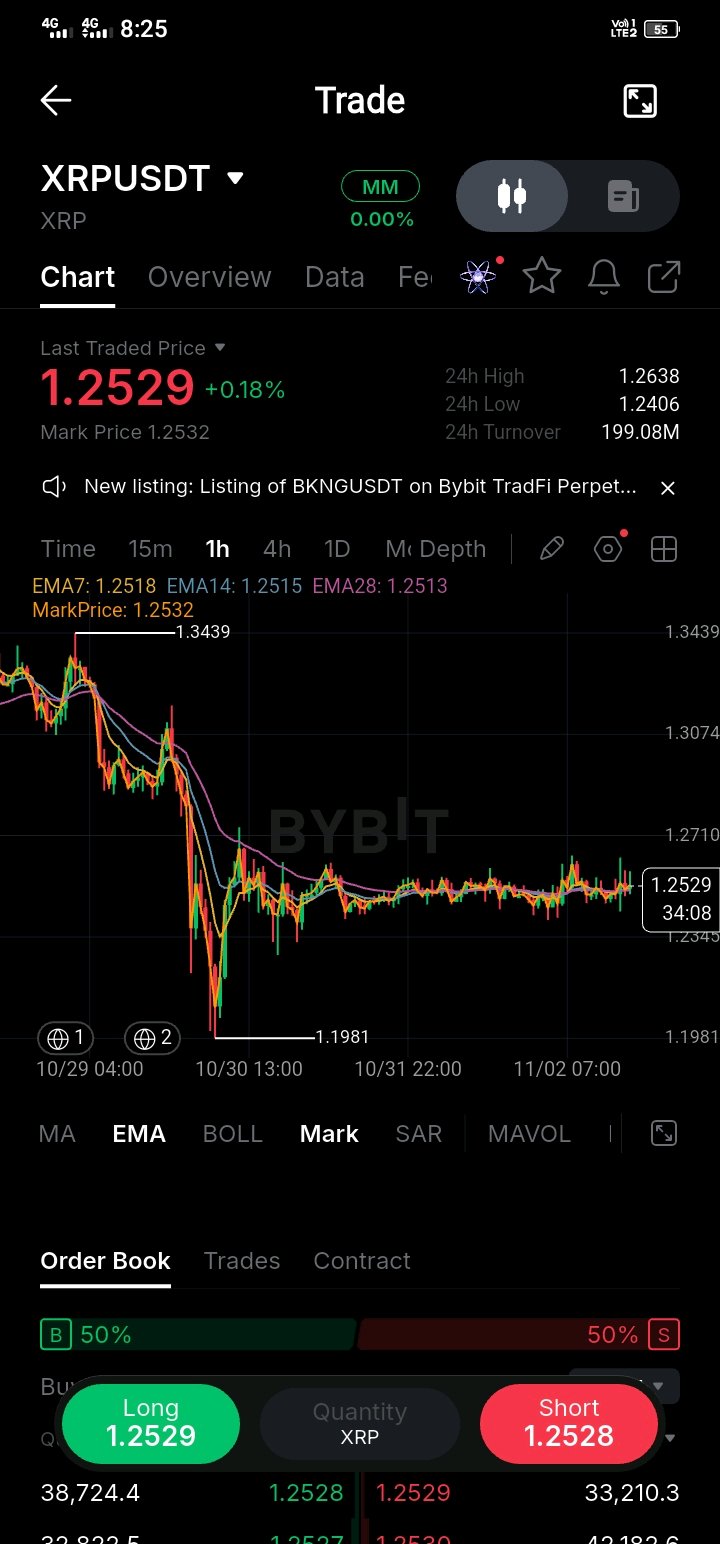
I am patiently lying in wait while emotional retail traders exhaust themselves in this tight consolidation coil on XRPUSDT around 1.2529, completely oblivious to how smart money is coiling price above local dynamic support for an explosive directional squeeze. When I dissect this 1-hour timeframe on XRPUSDT, price is tightly compressing right above its exponential moving average stack—hovering over EMA7 (1.2518), EMA14 (1.2515), and EMA28 (1.2513) backed by a massive 199.08M 24-hour turnover. The psychological flaws out here are glaring: retail participants are getting chopped to pieces over-trading this sideways drift between the 1.2406 low and 1.2638 high, frantically flipping positions out of boredom and frustration while market makers construct a dense liquidity vault. Amateurs keep trying to front-run a breakdown toward the 1.1981 key wick low or force early longs into overhead resistance, walking straight into the trap where volatility expansion will clean out late market orders on both sides. Looking at the order book depth, buy interest and sell pressure are deadlocked at 50% long and 50% short, highlighting total equilibrium and retail indecision before the main move. Institutional algorithms thrive on this exact multi-day equilibrium phase, quietly accumulating inventory while retail attention fades before triggering a sharp expansion that catches the entire market unprepared. Analyzing the structural landscape from the 1.3439 local high down to the 1.1981 flash-bottom, this tight price coil along the EMAs indicates that supply is being steadily absorbed by higher-timeframe buyers. I view this tight range as a pre-breakout launchpad where patience is vital, waiting for a clear directional push and retest before deploying capital. Trade Plan Pair: $XRPUSDT Bias: Long Entry: Retest and bounce off support ($1.2380 – $1.2500) SL: $1.2150 TP1: $1.2950 TP2: $1.3400 TP3: $1.4100 RRR: 1:3.0 Invalidation A confirmed 1-hour candle close below $1.2050 with heavy sell volume invalidates this bullish accumulation thesis. Risk Management Given the explosive energy building inside this XRP consolidation range, keep your leverage strictly capped at 5x and size your position so that a hit to your $1.2150 stop loss risks no more than 1% of your overall account capital. Capital preservation is non-negotiable—protecting your capital ensures you are always ready to execute when real expansion hits. Will XRPUSDT break out above 1.2638 to target 1.3439, or sweep down toward 1.1981 support first? $XRPUSDT $BEAMUSDT #ByXIMPACT #IMPACTbyTrade
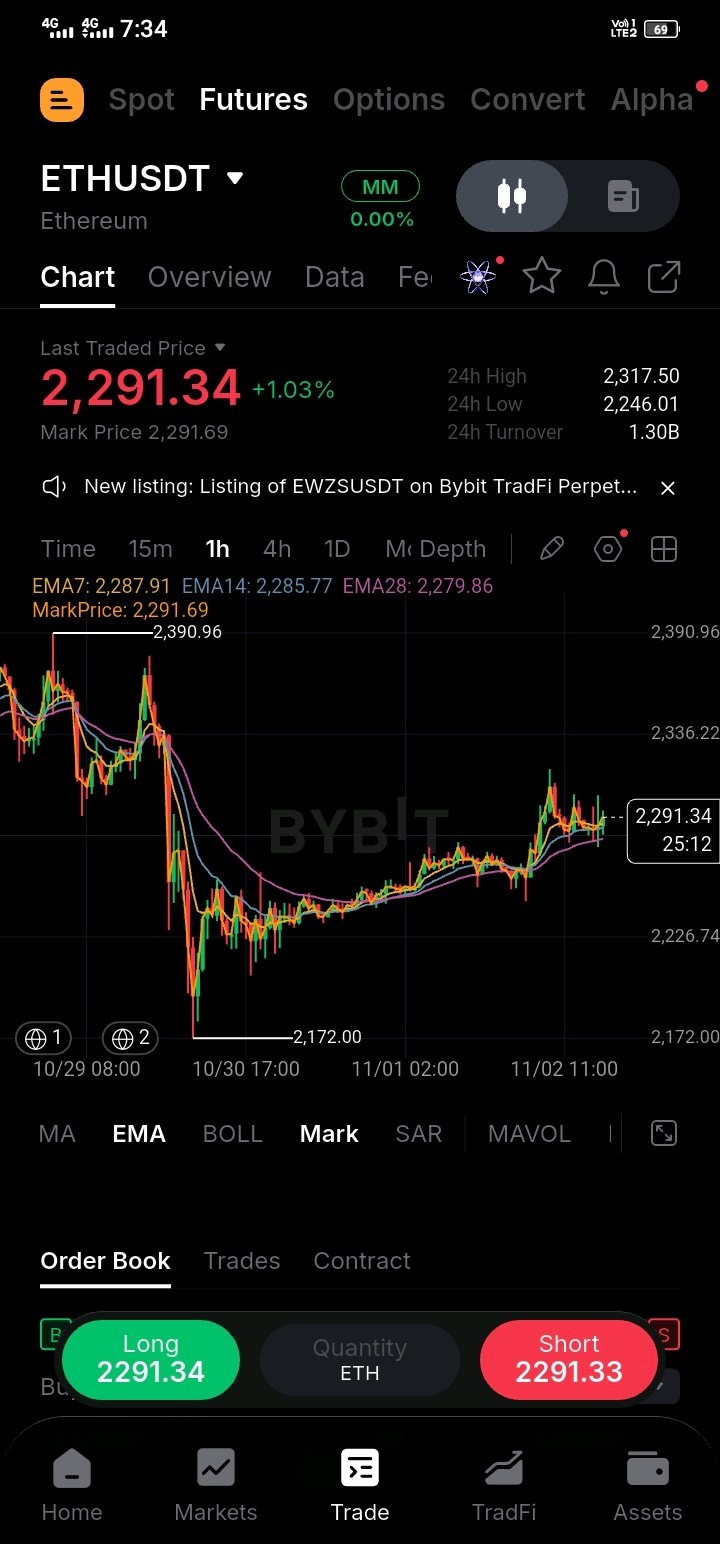
I'm watching Ethereum (ETH) trap early short-sellers on the 1H chart as price continues to build higher lows following the major bottom at 2,172.00. Price tapped a 24h high of 2,317.50 and is currently trading near 2,291.34 after recovering from a 24h low of 2,246.01. The hourly indicator setup remains bullishly aligned, with the EMA7 (2,287.91), EMA14 (2,285.77), and EMA28 (2,279.86) all stacked underneath current price action to provide dynamic support. Following the V-shaped recovery off the 2,172 key low, buyers are maintaining control and defending every minor intraday dip. In my view, the market structure favors continued upside expansion toward overhead resistance as long as price holds above the hourly EMA layer. The primary demand area I'm eyeing for a long entry sits between 2,270.00 and 2,285.00. This pocket aligns directly with the cluster of 1H EMA lines and recent consolidation support. If price gives us a brief retest into this zone and finds solid backing, it offers a clean risk-to-reward opportunity to target a move toward the 2,336.22 resistance level. Trade Plan: Pair: ETHUSDT Bias: Long Entry Zone: 2,270.00 - 2,285.00 Stop Loss: 2,240.00 TP1: 2,317.00 TP2: 2,336.00 TP3: 2,390.00 Risk-Reward: Approx. 1:2.3 (calculated from mid-entry to TP2) Confirmation: I'm avoiding chasing the entry here around 2,291. I want to see a controlled pullback into the 2,270.00 - 2,285.00 support zone that leaves lower rejection wicks on smaller timeframes, confirming buyers are stepping in to defend the level before entering the position. Invalidation & Risk: An hourly candle body close below 2,240.00 breaks the immediate bullish structure and invalidates this trade plan because price falls back under key structural support. If invalidation triggers, exit immediately without holding onto hope. Additionally, if ETH pushes straight through 2,336.00 to TP2 without giving an entry pullback first, cancel pending limit orders and wait for the next setup. Do you think ETH has enough strength to push past $2,317 toward $2,336, or will sellers force another retest of $2,270?$ETHUSDT $MPLXUSDT #ByXIMPACT #IMPACTbyTrade
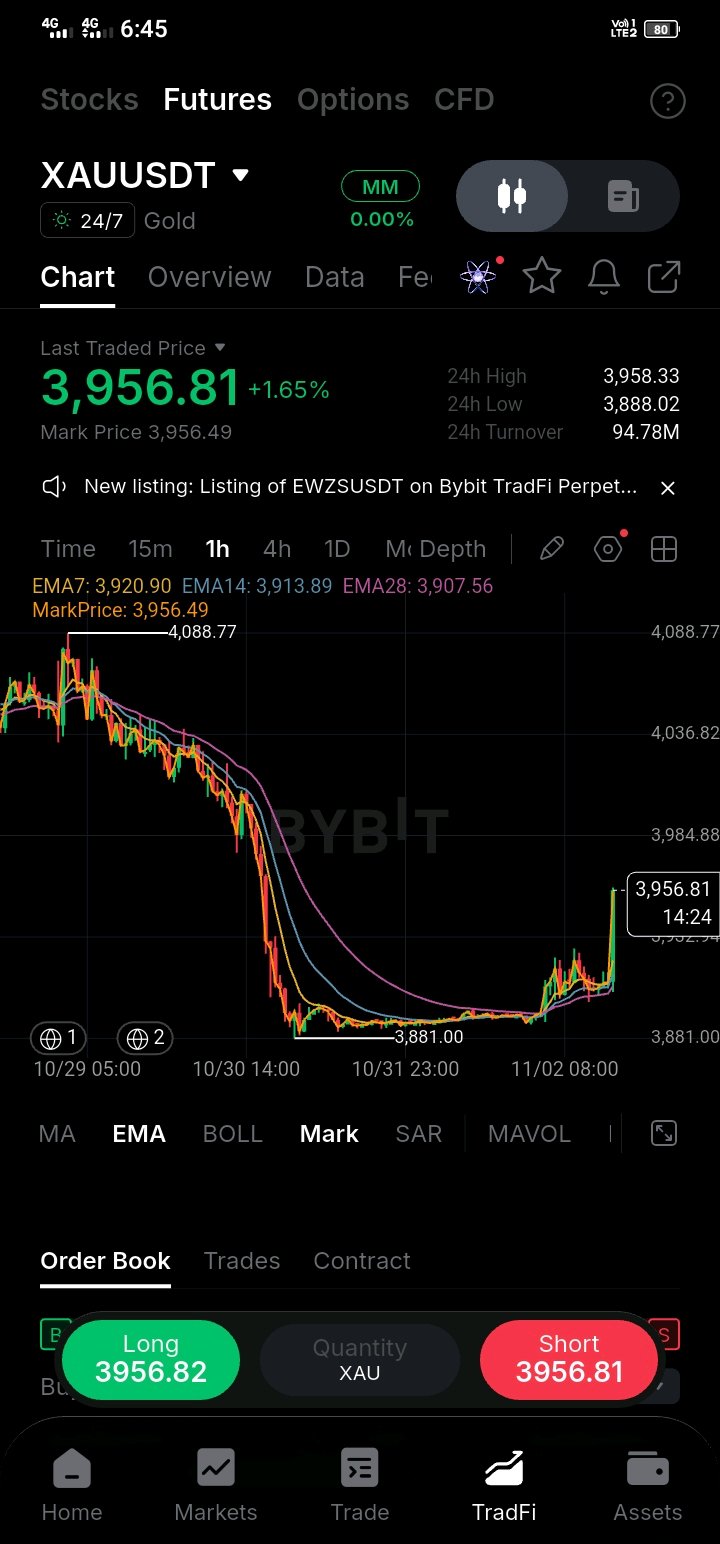
XAUUSDT is showing a aggressive bullish breakout on the 1H timeframe after holding baseline support near 3,881, and I’m keeping a close eye on this momentum shift. Price is currently trading around 3,956.81 (+1.65% today), moving close to its 24h high of 3,958.33 after pushing up from a 24h low of 3,888.02. 24h turnover is strong at 94.78M, reflecting heavy buyer involvement. The 1H chart highlights a clean trend reversal as price broke out forcefully above the entire EMA cluster with a massive green candle. EMA7 3,920.90, EMA14 3,913.89, EMA28 3,907.56 The 3,900.00-3,920.00 zone that previously capped price action has now flipped into dynamic support. As long as buyers keep price above this cluster, the path of least resistance remains to the upside. Levels to watch: 1. Upside: Clearing 3,958.33 paves the way toward major overhead resistance targets at 3,984.88 and 4,036.82. 2. Downside: A break back under 3,907.00 invalidates short-term strength and opens a retest toward 3,881.00. Execution Setup: Pair: XAUUSDT Bias: LONG Entry Zone: 3,920.00-3,935.00 Stop Loss: 3,895.00 TP1: 3,958.00 TP2: 3,984.00 TP3: 4,035.00 Risk-Reward: Approximately 1:1.5 to TP1, 1:2.5 to TP2, and 1:4.6 to TP3 Risk & Invalidation: This long setup invalidates if XAUUSDT closes below 3,895.00 on the 1H timeframe. Avoid FOMO chasing at local highs around 3,956. Waiting for a pullback into the 3,920.00-3,935.00 retest area provides much better risk control. Manage leverage responsibly on Gold commodity contracts. Do you see XAU pushing straight through 3,984 next, or will we get a brief pullback into the 3,920 support level first? $XAUTUSDT $BTCUSDT #ByXIMPACT #IMPACTbyTrade

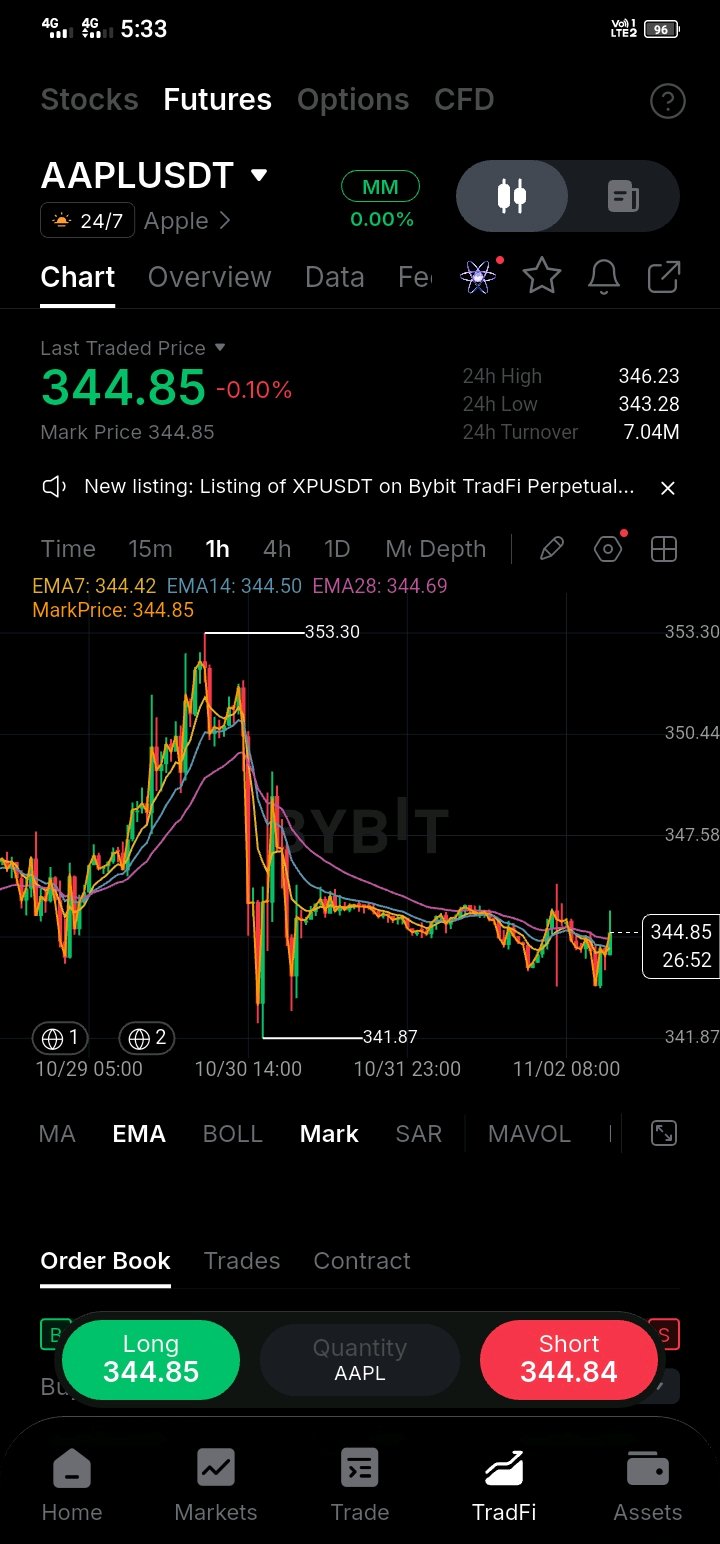
Most traders think AAPL is bleeding out after dropping to 341.87, but this price action is actually a deliberate liquidity sweep designed to flush weak hands before the next massive leg higher. The drop from the 353.30 peak down to the 341.87 swing low effectively trapped over-leveraged long positions and swept key stops. Since then, price has transitioned into a tight accumulation pattern near 344.85, backed by 7.04M in 24h turnover. The moving average ribbon is showing extreme compression—with EMA 7 at 344.42, EMA 14 at 344.50, and EMA 28 at 344.69—which typically precedes a violent directional expansion. Sellers are failing to push price back down toward the 343.28 low, signaling clear absorption by buyers before a reclaim of overhead levels. KEY TECHNICAL METRICS Dynamic Support: 7 EMA at 344.42 and 14 EMA at 344.50 Base Average: 28 EMA at 344.69 Overhead Targets: 24h high at 346.23 followed by 350.44 and 353.30 TRADE EXECUTION Entry Zone: 342.50 to 344.85 DCA Support: 339.50 Stop Loss: 337.80 Take Profit 1: 346.23 Take Profit 2: 350.44 Take Profit 3: 353.30 Risk to Reward Ratio: 1 to 3.2 RISK AND INVALIDATION A full 1H candle close below 337.80 breaks local market structure and invalidates this recovery thesis. Risk is capped strictly at 1% to 2% of total portfolio equity. This post is for personal trade journaling only and is not financial advice. Are you bidding this AAPL bounce near current support or waiting for a breakout above 346.23 first? Drop your plan below! $AAPLXUSDT $GOOGLXUSDT #ByXIMPACT #IMPACTbyTrade

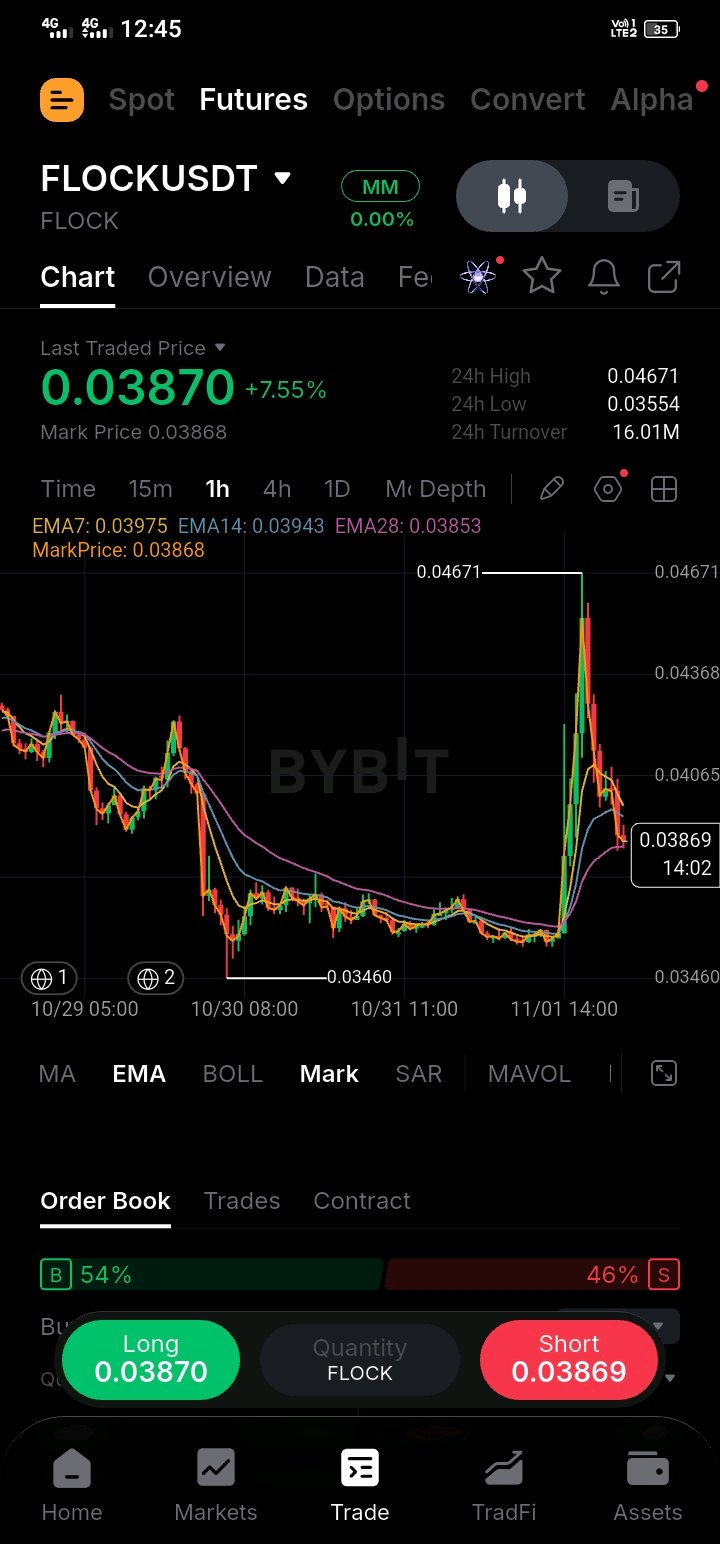
FLOCK is experiencing sharp intraday volatility today as price pulls back to $0.0387 after a violent rejection off the $0.04671 local peak. When a token flashes an aggressive vertical spike followed by an immediate retracement, market structure frequently shifts into a consolidation phase as early buyers lock in profits and order books rebalance. On the ecosystem front, FLOCK continues to capture speculative interest through decentralized AI data annotation initiatives and community-driven rewards programs. While high-beta altcoins frequently generate explosive volume spikes during sentiment rotations, sustaining these moves requires consistent protocol utility to establish durable demand floors above prior accumulation zones. Analyzing the 1-hour technical framework, $FLOCKUSDT is trading at $0.03870 (+7.55%), hovering just above its 28 EMA ($0.03853) while trading under the 7 EMA ($0.03975) and 14 EMA ($0.03943). 24-hour turnover has registered at $16.01M, with order book depth showing a 54% buy bid distribution versus 46% sell asks as participants contest the $0.03554 daily low support. Key Levels to Watch: 1. 24h Low Support ($0.03554) 2. Hourly 28 EMA Support ($0.03853) 3. 24h High Resistance ($0.04671) 4. Peak Spike Resistance ($0.04850) My Trade Plan: • Bias: Range Consolidation / Pullback Retest (Long) • Risk-to-Reward Ratio: 1 : 3.2 • Entry Zone: $0.03650 – $0.03860 • Take Profit 1: $0.04300 (Lock in 50% profits + shift stop-loss to breakeven) • Take Profit 2: $0.04650 • Extended Target: $0.05100 • Invalidation / Stop Loss: $0.03480 (Clean hourly close below the $0.03554 low) Position risk is tightly controlled under a strict 1% account threshold using conservative leverage, keeping all secondary position additions locked until TP1 is reached and exposure is fully secured. I am taking this long setup because FLOCK has held the crucial 28 EMA support level on $16.01M turnover following its explosive spike to $0.04671, setting up a high-probability mean-reversion bounce toward recent highs. Are you buying this FLOCK dip near $0.038 or waiting for a confirmed break above $0.042 first? Drop your game plan below 👇$FLOCKUSDT $BEAMUSDT #ByXIMPACT #IMPACTbyTrade
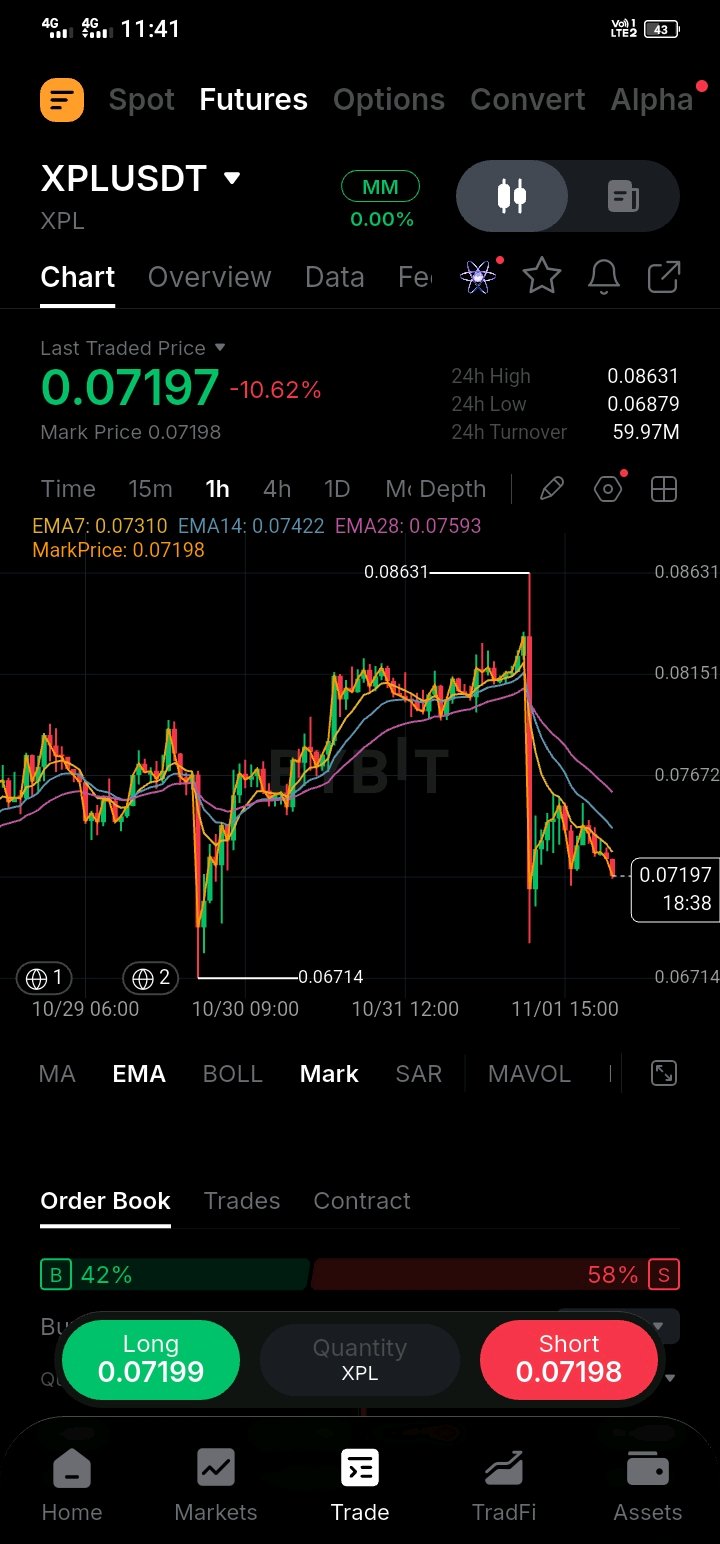
XPL experienced a violent downside volatility spike on the 1h timeframe, dropping over 10% from its local $0.08631 high straight down to retest demand around $0.06879. The sheer velocity of the red impulse candle wiped out days of grinding upside structure in a single stroke, leaving price pinned under overhead resistance. However, the long lower shadow near the $0.06879 low signals that buyers did step in aggressively to stop immediate panic selling from cascading lower. Following such a sharp drop, price action is currently in an absorption phase, attempting to stabilize around $0.07197. The 1h EMA stack is sloping downward sharply to act as overhead dynamic resistance, with EMA7 at $0.07310, EMA14 at $0.07422, and EMA28 at $0.07593. Rather than rushing into a position amidst ongoing volatility, the structural focus relies on seeing whether bulls can build a sustainable higher low above the panic-wick floor or if another retest of $0.06879 is required. From a trade execution perspective, bidding the initial flush is high risk until price reclaims short-term baseline support. Looking for price to consolidate and absorb supply around current levels before attempting a mean-reversion move toward the moving averages offers a much tighter risk definition. Entry parameters: Entry zone: $0.07050–$0.07220 on low-timeframe stabilization — Invalidation: a confirmed 1h candle close below $0.06800 — losing that key wick floor breaks the recovery attempt and opens a slide toward the macro $0.06714 demand level. Upside targets: $0.07590 at the EMA28 resistance, extending toward $0.08150 if relief volume builds. This trade is structured across a 1-to-2 day timeframe to let lower timeframe volatility cool down and allow price to rebuild local structure. Primary risk factor: if selling volume ramps up and pushes price beneath $0.06870 without any buyer response, it signals that the breakdown has further continuation legs. Can XPL defend the $0.07000 base to trigger a relief bounce toward $0.07500, or will bears force a breakdown beneath $0.06800? $XPLUSDT $BTCUSDT #ByXIMPACT #IMPACTbyTrade

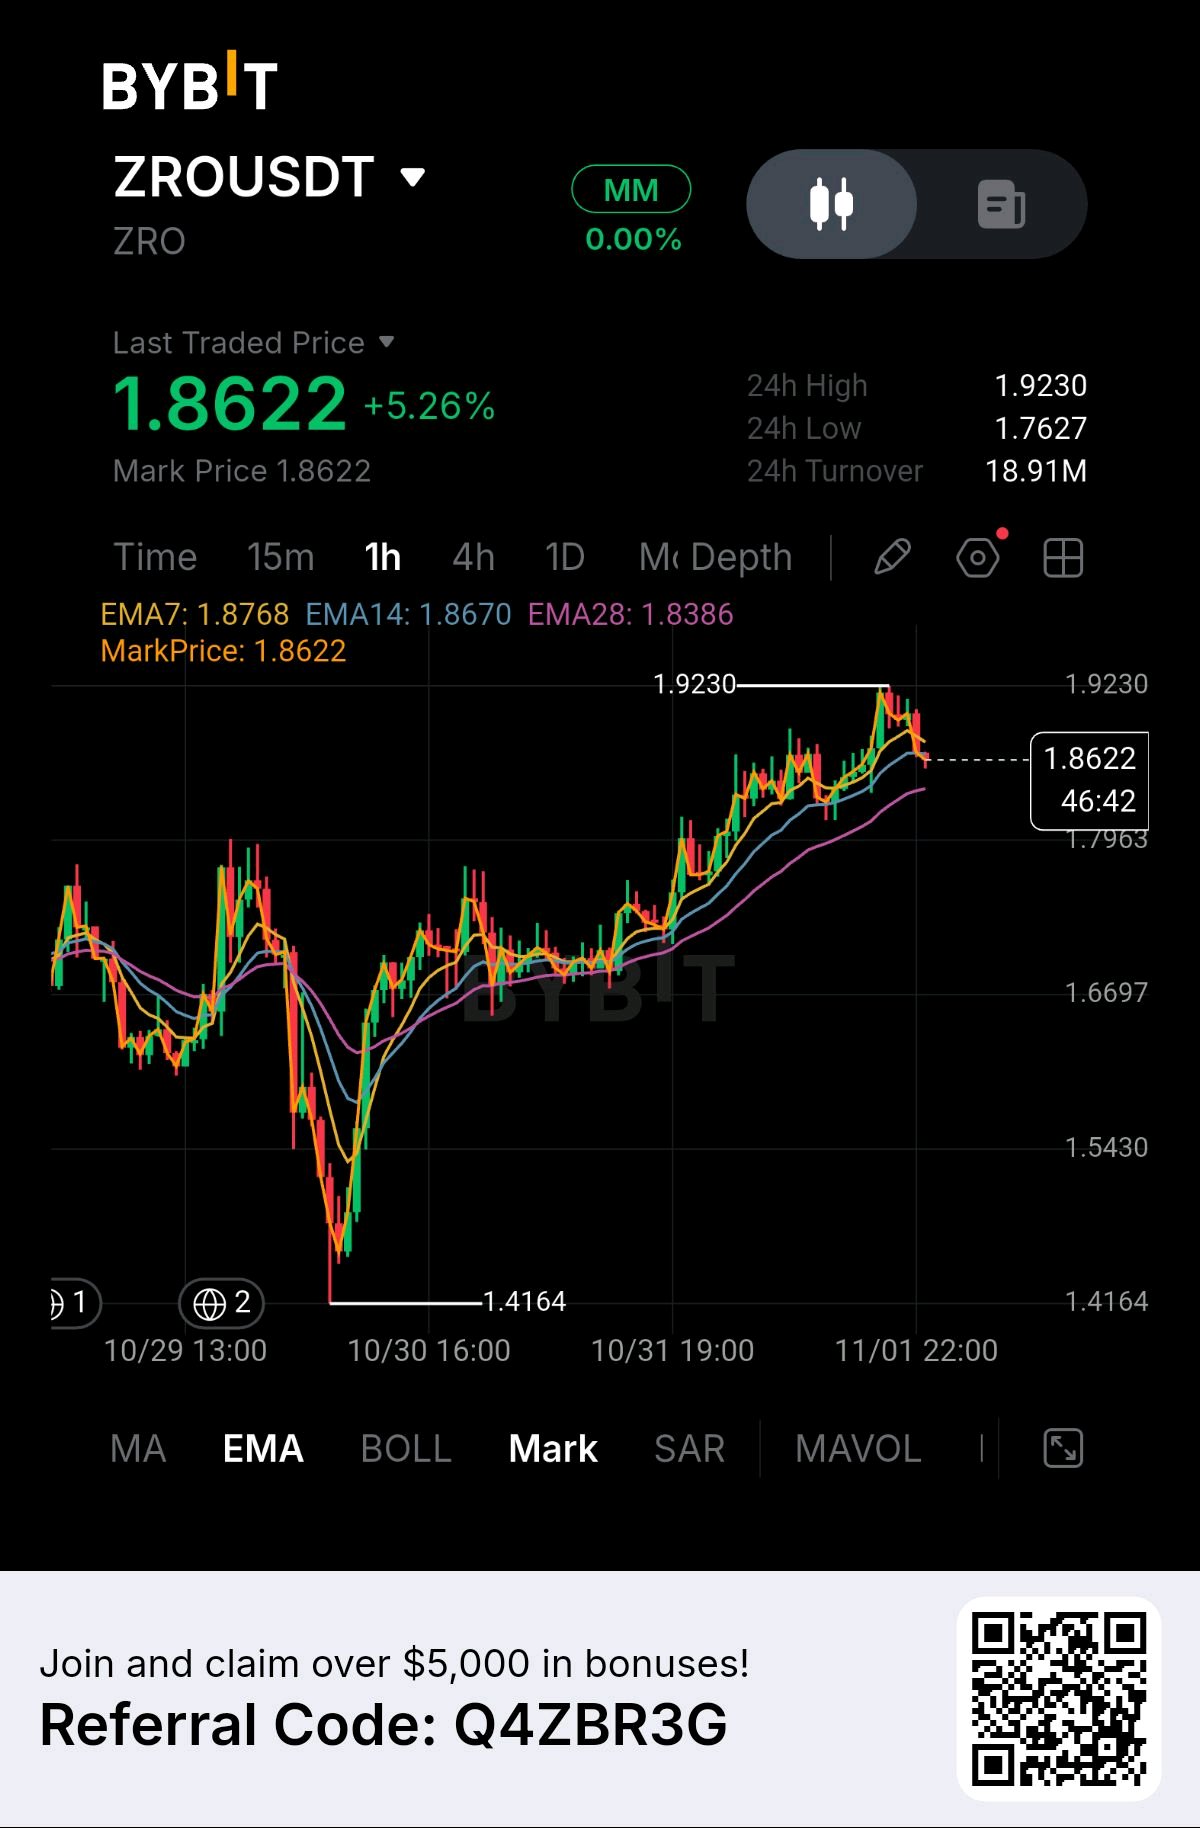
ZROUSDT just hit a temporary brick wall at the 1.9230 local peak, but price is pulling back straight into a dense moving average confluence on the 1-hour chart. Following a strong bullish recovery from the 1.4164 macro low, buyers pushed price through a clean higher-high structure before tapping resistance at 1.9230. A mild correction is currently underway, bringing price down to 1.8622. The 1-hour moving average stack remains tightly grouped right at current levels, with EMA7 (1.8768) and EMA14 (1.8670) exerting immediate pressure from above while EMA28 (1.8386) acts as a dynamic floor keeping the broader uptrend intact. THE PRICE MAP Overhead resistance remains firmly established around 1.9230, marking the local swing high where profit-taking stalled the last expansion leg. Below current price, the 1.8350 to 1.8650 zone functions as the immediate dynamic re-entry pocket, supported directly by the 1-hour EMA14 and EMA28 stack along with the minor 1.7963 pivot floor. Deeper structural defense sits at the 1.6697 level, which represents a critical higher-low platform where buyers heavily accumulated before the latest rally. Buying mid-range while price fluctuates between short-term EMAs offers poor entry value. A disciplined setup involves monitoring for stabilization within the 1.8300–1.8550 support pocket, allowing the exponential moving averages to absorb selling pressure before taking exposure. As long as price holds above 1.8300, the structural bias remains geared toward a retest of the local high. EXECUTION SETUP PAIR: ZROUSDT Direction: Long Buy Zone: 1.8300 – 1.8550 Stop Loss: 1.7850 Targets: 1.9230 → 1.9800 → 2.0500 R:R Ratio: 1:2.6 WHY THE LOGIC SUPPORTS THIS TRADE Holding an uptrend sequence above a rising moving average cluster confirms that sellers are losing momentum, allowing buyers to establish a higher low before challenging overhead resistance. WHEN THE SETUP BREAKS & EXPOSURE CONTROL A 1-hour close below 1.7850 invalidates the immediate bullish structure and signals a deeper correction down to lower demand levels—step aside immediately if that support snaps. Maintain strict position sizing, keep leverage conservative, and avoid market-buying if price surges toward 1.9200 without testing the entry zone. Are you bidding the retest around the 1.8400 EMA zone, or waiting for a clean breakout above 1.9230 before jumping in? $ZROUSDT $FORTUSDT #ByXIMPACT #IMPACTbyTrade

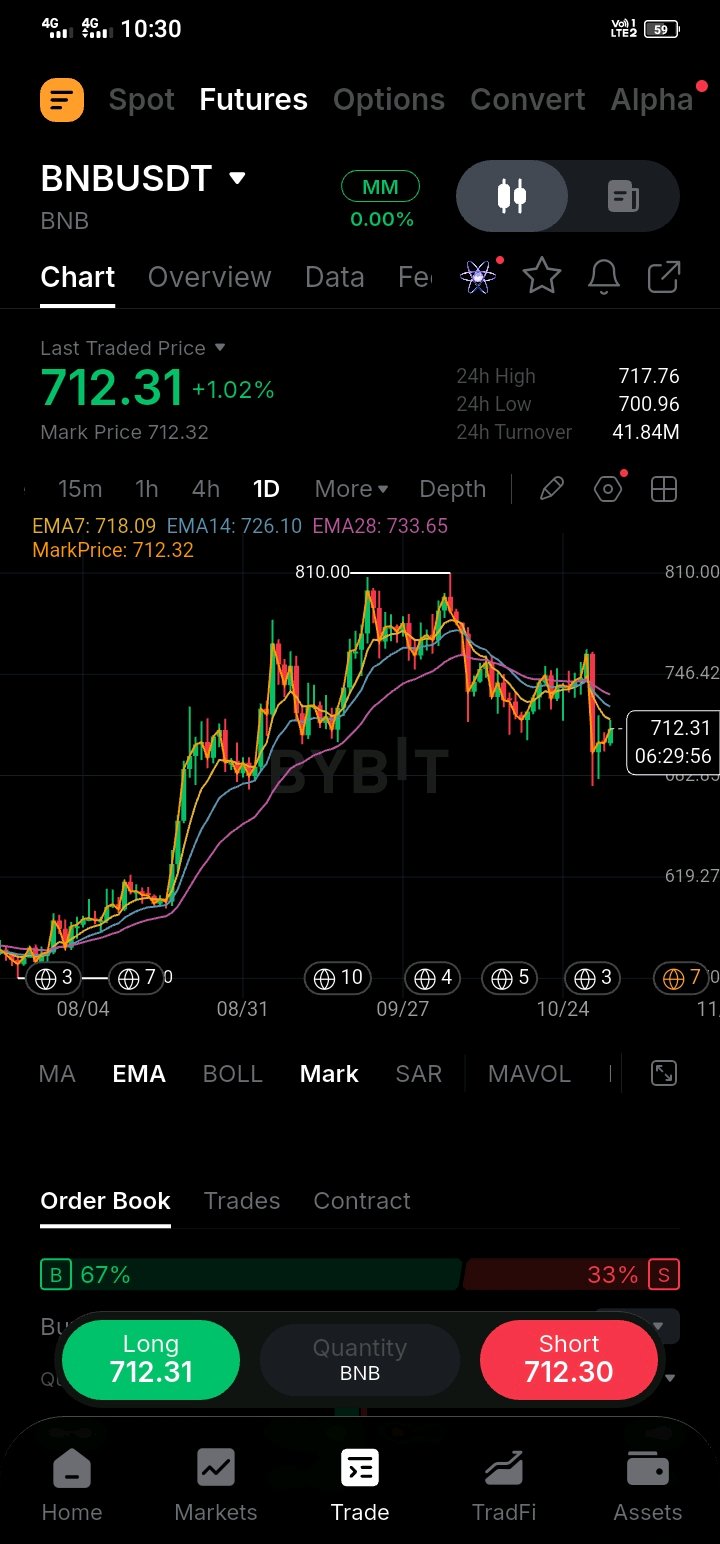
BNBUSDT is testing key daily support below the EMA stack, and I’m watching closely to see if buyers can defend this level after the sharp pullback from recent highs. Price is currently trading around 712.31 (+1.02% today), holding between the 24h range of 700.96 to 717.76, with 24h turnover reaching 41.84M and buy-side volume leading at 67% in the order book. The 1D chart shows price currently consolidating beneath the daily EMA stack, making the current bounce critical for bulls to hold structural higher lows. EMA7 718.09, EMA14 726.10, EMA28 733.65 The 700.00-705.00 level remains vital baseline support. As long as buyers absorb supply around this floor, a relief push back toward the overhead moving averages remains valid. Levels to watch: 1. Upside: Reclaiming 726.00 is required to flip short-term momentum back to bulls for a test of 746.42. 2. Downside: A clean loss of 700.00 opens the door for a deeper slide toward the 662.00 and 619.27 demand zones. Execution Setup: Pair: BNBUSDT Bias: LONG Entry Zone: 705.00-713.00 Stop Loss: 694.00 TP1: 726.00 TP2: 746.00 TP3: 775.00 Risk-Reward: Approximately 1:1.4 to TP1, 1:2.9 to TP2, and 1:4.8 to TP3 Risk & Invalidation: This long setup invalidates if BNBUSDT closes below 694.00 on the daily timeframe. Avoid chasing entries if price pushes directly into the 726 resistance zone without a healthy pullback. Entering within the 705.00-713.00 accumulation zone allows for tight risk control. Manage leverage strictly according to your position sizing rules. Do you think BNB holds 700 to push back toward 746, or are we going to see a deeper retrace to 660 first? $BNBUSDT $BTCUSDT #ByXIMPACT #IMPACTbyTrade

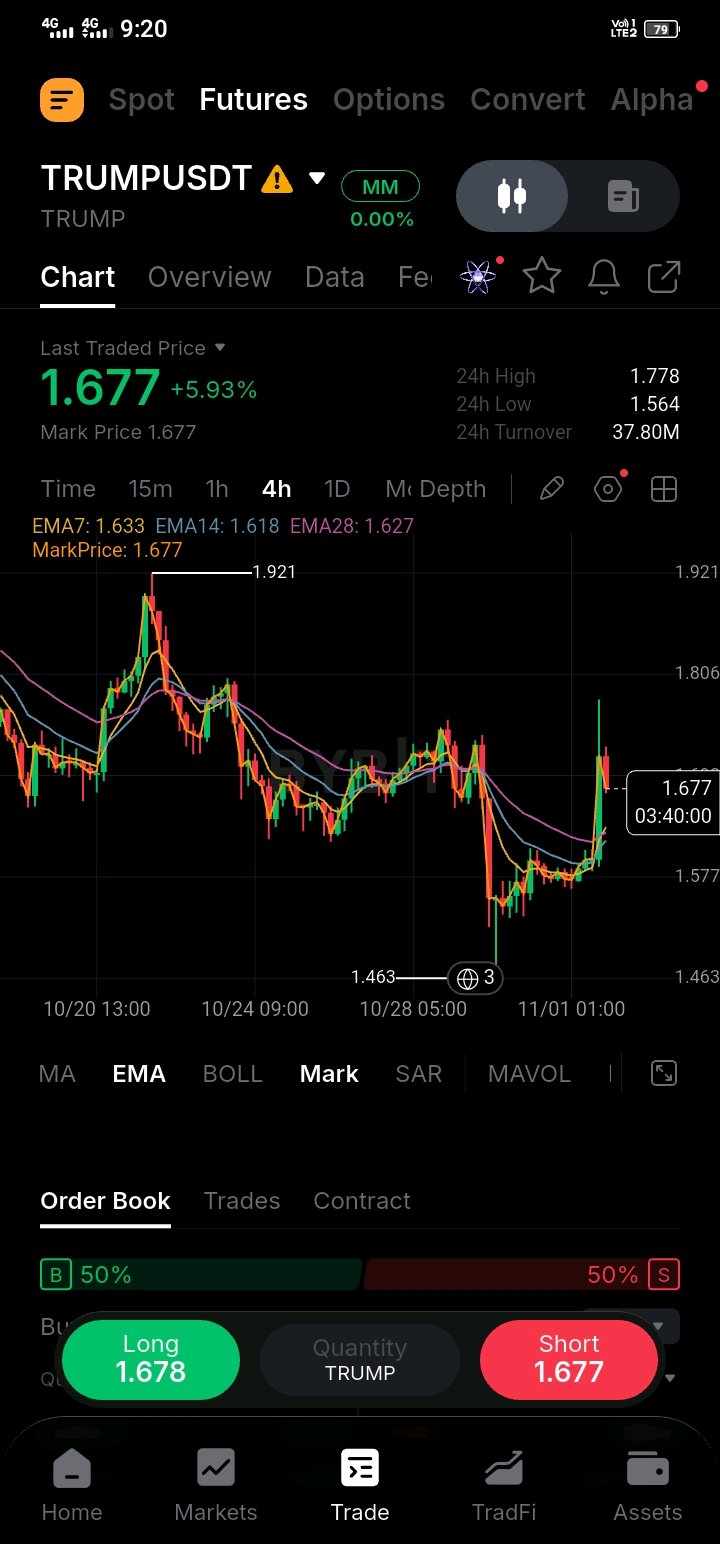
TRUMPUSDT is displaying a strong short-term bullish recovery on the 4-hour chart, rising +5.93% to trade around $1.677 after pushing up to a 24-hour peak of $1.778. Trading activity shows $37.80M in 24-hour turnover following a firm defense of its $1.564 intraday low. Order book depth reflects balanced momentum with 50% buyers and 50% sellers. However, buying immediately after a sharp vertical wick directly beneath local resistance presents suboptimal execution geometry. On the 4-hour timeframe, price action has pushed cleanly above key dynamic moving averages, reclaiming local market structure after sweeping liquidity at the $1.463 swing low. The moving average ribbon is beginning to turn upward, with the 7 EMA ($1.633), 14 EMA ($1.618), and 28 EMA ($1.627) converging to form a fresh dynamic demand base. Chasing the current green candle carries unfavorable risk-to-reward metrics, making a controlled pullback into dynamic support the preferred path. Key Levels • Resistance: $1.778 • Dynamic Support: $1.627 • Demand Zone: $1.600 – $1.635 • Breakout Trigger: $1.810 My Trade Plan • Bias: LONG (on pullback) • Entry Zone: $1.600 – $1.635 • Confirmation: 1H bullish reversal pattern or price holding above $1.620 with declining sell volume • Invalidation: $1.550 (a candle close below this level breaks local higher-low alignment and loses all 4H EMAs) • Target 1 (TP1): $1.770 • Target 2 (TP2): $1.920 • Risk to Reward: ~1:2.3 from midpoint entry to TP1 Why This Trade? This framework catches TRUMP’s emerging momentum recovery off the $1.463 bottom without chasing high-wick rejection prices at $1.778[. Scaling into orders within the $1.600–$1.635 demand pocket anchors risk tightly against the 4H EMA stack ($1.618–$1.633), establishing defined position risk with clear expansion room toward $1.770 and $1.920. Are you bidding the pull-back to $1.620 or waiting for a breakout past $1.810? Share your plan below. $TRUMPUSDT $PEPEUSDT #ByXIMPACT #IMPACTbyTrade