web3prince
30279Like14Shares425Fans11Follow
Welcome! I write for survival and I trade for fun. Over here we trade smart.
Welcome! I write for survival and I trade for fun. Over here we trade smart.
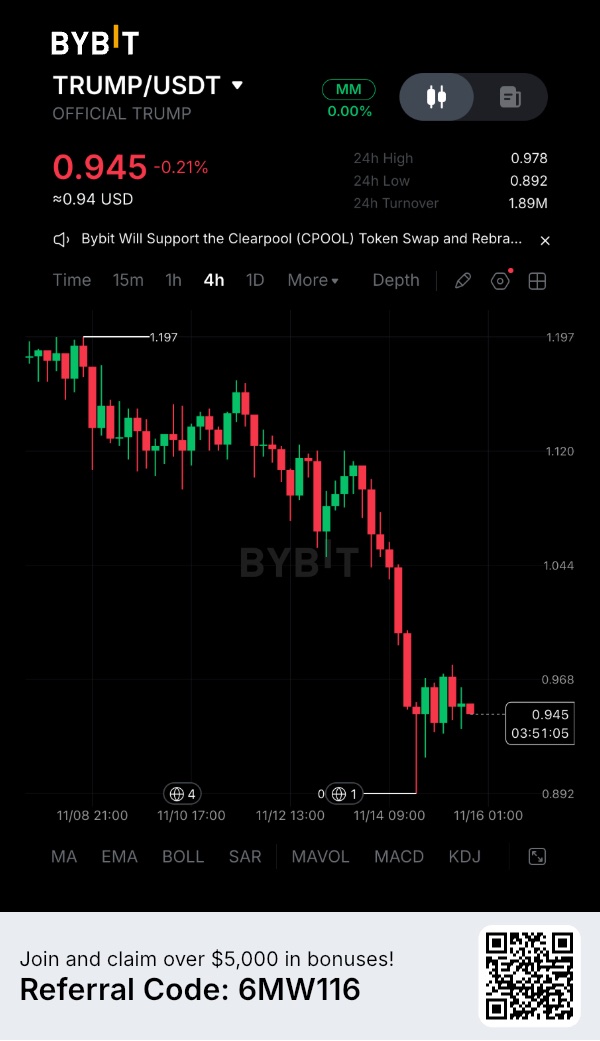
$TRUMPUSDT — A sharp sweep down to $0.892, a quick bounce to $0.945, and now a test sitting just $0.023 away. That is what makes this 4 hour chart interesting to me. TRUMP broke down through the $1.044 and $1.120 support shelves, flushed to a 24 hour low of $0.892, and immediately bounced back. On my chart, price is trading around $0.945 (-0.21%) on 1.89M in 24 hour turnover, with a 24-hour high at $0.978. The defense off $0.892 is notable, yet immediate horizontal resistance sits right at $0.968—barely $0.023 above current price. This is where I want to see whether buyers actually have enough strength to flip momentum. My constructive bounce scenario rests on that failed breakdown beneath $0.90 and the buyer reaction that followed. If $TRUMPUSDT can close decisively above $0.968, clear the $0.978 session high, and defend that pocket as support on a pullback, the recovery leg could gain real traction. I am looking toward $1.044 first, then $1.120. My main recovery objective is the previous swing high at $1.197. Risk Management A planned recovery setup marked on this structure uses: • Entry reference: $0.972 (confirmed break and retest above $0.968 resistance) • Stop Loss: $0.888 (just beneath the $0.892 swing low) • Main Target: $1.197 • Risk-to-Reward: Approximately 1:2.68 That ratio applies strictly to a confirmed breakout entry, not a blind market buy directly beneath resistance. If $TRUMPUSDT gets rejected at $0.968 and loses $0.892 on a 4 hour close, the bullish bounce thesis is invalidated and deeper price discovery opens up. Because perpetual contracts amplify volatility, position sizing and funding costs must be managed carefully. I see a clean asymmetric opportunity if buyers step up, yet after a multi-day bleed from $1.197, I do not need to guess the next candle. I want to see buyers turn $0.968 into support—much like how $APEUSDT is testing whether it can stabilize near its $0.078–$0.080 multi month lows amid its ApeChain CCIP cross-chain upgrade rather than sliding further. Are you watching $TRUMPUSDT to flip $0.968 first or keeping an eye on $APEUSDT at its lows? #ByXIMPACT #WSOT2026
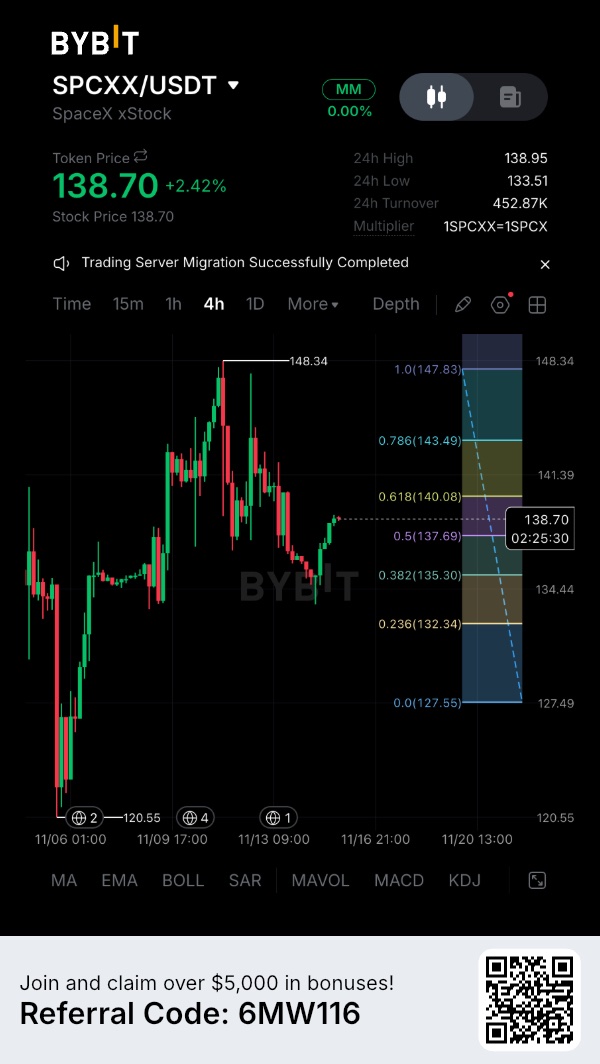
$SPCXXUSDT — The phrase I am NOT using here is "easy post-IPO breakout." My 4 hour chart shows SpaceX xStock ($SPCXX) climbing from its $120.55 base up to $148.34 before pulling back and stabilizing around $138.70 (+2.42%), right between the 0.50 ($137.69) and 0.618 ($140.08) Fibonacci levels on 452.87K in 24-hour turnover. That tells me buyers are defending the mid-range; it does not mean price automatically rockets past $148.34 in a straight line. That distinction actually makes this setup far more interesting to trade. SpaceX entered this consolidation following historic milestones. Following its massive $86B IPO and integration of xAI and X, the company posted $27.1B in revenue across the first nine months of 2026 (including $14.6B in Q3 alone). Yesterday, on November 14, SpaceX achieved another breakthrough on Flight 15—capturing a Starship upper stage returning from orbit with its launch tower "chopstick" arms for the first time while deploying 26 Starlink V3 satellites. Yet the market is weighing that engineering triumph against real operational and capital-intensity realities. During that same mission, Booster 22 aborted its tower catch and diverted into the Gulf of Mexico, while SpaceX's aggressive $48.1B nine-month capital expenditure across Starship and AI infrastructure keeps valuation multiples under intense scrutiny. So I see two forces meeting right around $138.70: The long-term aerospace, Starlink, and orbital AI compute narrative is unmatched. The short-term chart is digesting a sharp post-IPO range between $120.55 and $148.34 while traders price in execution risk. That is why I am constructive on SpaceX's trajectory, yet I am not "closing my eyes" and chasing every green candle. Because 1 SPCXX tracks 1 SPCX share, position sizing and liquidity awareness are essential. On my chart, the 0.382 Fib ($135.30) and the 24 hour low ($133.51) are the immediate support shelves I am watching if sellers press lower, with major structural invalidation sitting down at the 0.0 Fib ($127.55) and $120.55 swing low. On the upside, reclaiming the 0.618 Fib ($140.08) and 0.786 Fib ($143.49) puts a retest of the $148.34 peak back on the table. I am bullish on SpaceX long term, yet this is a range and confirmation market rather than a blind chase. If buyers turn $137.69–$140.08 into a launchpad, $148.34 comes into focus. If not, a dip back toward $132.34–$133.51 can easily unfold first. That is why I want exposure—and still keep dry powder ready for the retest. Right now, tokenized equities on Bybit are giving traders 24/7 access to major market narratives—with TSLAx and $METAXUSDT seeing strong interest alongside SPCXX as traders rotate across Musk-linked and mega-cap tech plays. Which tokenized stock are you watching closest this week: $SPCXXUSDT, TSLAx or $METAXUSDT? #ByXIMPACT

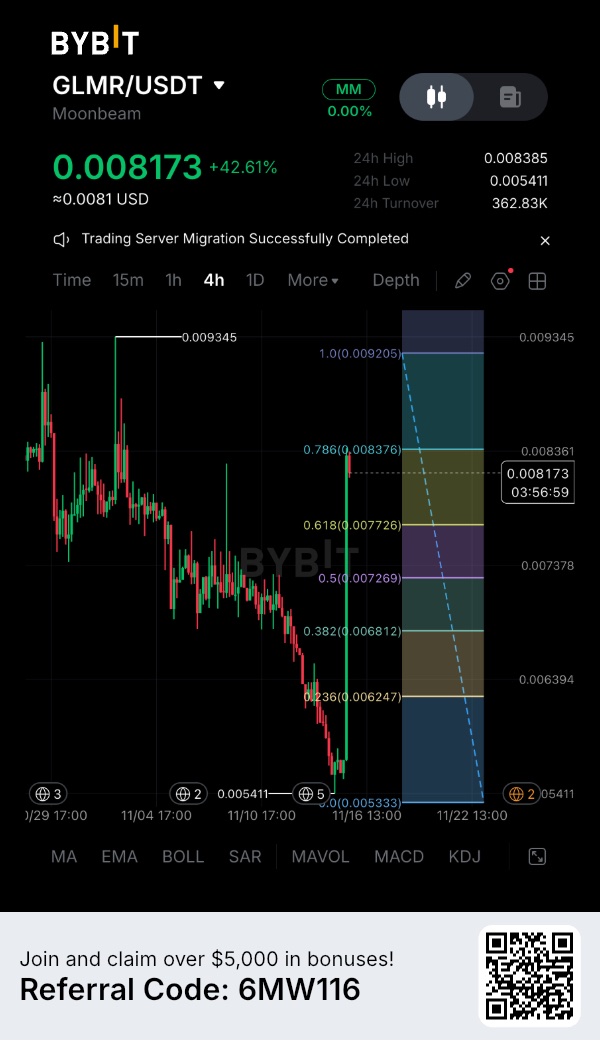
$GLMRUSDT — I am constructive on the broader recovery structure, yet the explosive 4 hour vertical surge has given me every reason to be selective rather than chasing this pump blindly. Over the last 24 hours, Moonbeam launched +42.61% off its $0.005411 base (just above the 0.0 Fibonacci floor at $0.005333), tagging a session high of $0.008385 before stabilizing around $0.008173 on 362.83K in turnover. That is a violent impulse move, but buyers immediately ran into overhead supply right at the 0.786 Fibonacci retracement ($0.008376), leaving price stalled beneath that key barrier. I see a high potential setup forming here, yet I will not confuse an aggressive single candle spike with a completed bullish trend reversal. The most attractive part of my trading plan is actually the healthy pullback before any next leg higher. I am watching for a controlled retracement back toward the 0.50 to 0.618 Fibonacci zone ($0.007269–$0.007726), where buyers have a clean opportunity to absorb profit taking and establish a higher low. If price holds that pocket, $GLMRUSDT can build a much healthier foundation for continuation. There is a secondary scenario on the table. Price could power directly through $0.008385 and flip the 0.786 Fib ($0.008376) into confirmed support on a strong 4-hour close. That would validate immediate momentum, though chasing directly into resistance offers far worse asymmetry than waiting for a retest. My immediate upside checkpoint sits at the 1.0 Fibonacci extension ($0.009205) and the major swing high at $0.009345. Clearing that ceiling opens room for broader price discovery, though that remains a conditional recovery target rather than an overnight guarantee. Risk Management Trading near $0.008173 puts price less than 3% beneath immediate resistance at $0.008385, making an immediate market buy unattractive relative to the downside air pocket below. A sustained 4 hour breakdown back below the 0.236 Fib ($0.006247)—and especially a loss of the $0.005333–$0.005411 structural base—would completely invalidate this bullish thesis. No confirmed entry or fixed risk-to-reward ratio is claimed until price either retests support or confirms acceptance above resistance. My bias leans bullish on the recovery, yet discipline matters most after a +42% spike. I’m watching the reaction at $0.008376–$0.008385 closely, just like I’m keeping $INITUSDT on watch to see if buyers step back in after its slide toward $0.107. What matters right now is discipline over impulse. It’s not about forcing a trade beneath resistance; it’s about letting the chart come to your level. #IMPACTbyTrade
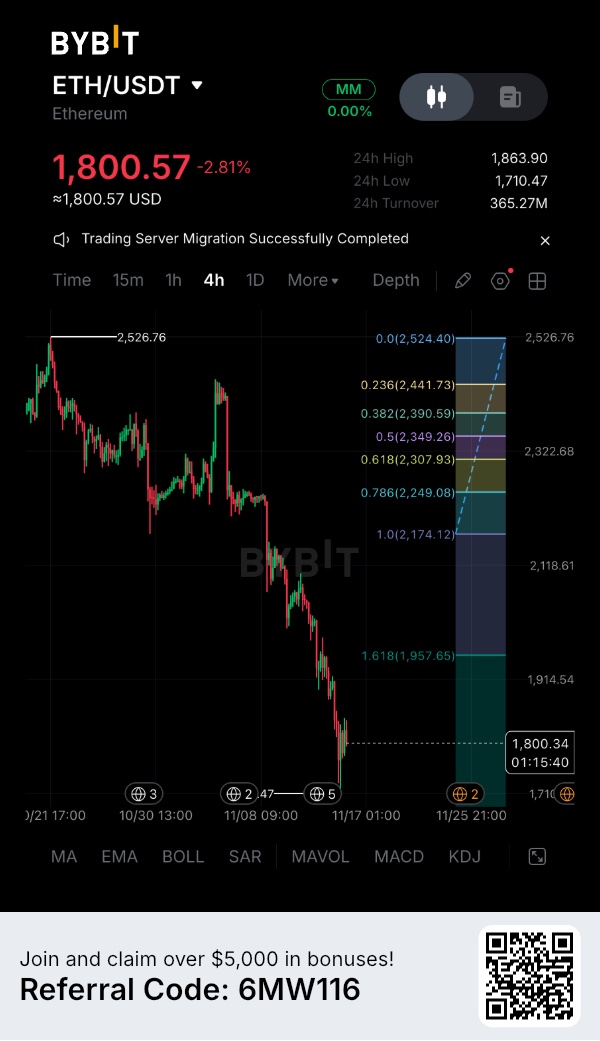
$ETHUSDT — Emergency Update: The structural support I relied on most has officially given way as Ethereum breaks below the psychological $1,800 threshold. The weekend market print is brutal. Over $845 million in leveraged crypto positions have been liquidated across the board within 24 hours, with ETH sliding -2.81% down to $1,800.57, touching a session low of $1,710.47 after failing to hold higher ground against a 24 hour high of $1,863.90 on 365.27M in turnover. I have navigated severe market corrections before, but I refuse to turn this flush into a story built on wishful thinking. Persistent institutional spot ETF outflows and broader risk-off macro pressure have heavily weighed on sentiment, while massive cascades of long liquidations accelerated the downward slide. Still, forced liquidations reflect severe market overcrowding rather than the fundamental death of the network. What concerns me more is something specific to my own Ethereum structural mapping. I expected the major higher-timeframe demand block around the 1.618 Fibonacci extension ($1,957.65) and the 1.0 Fibonacci base ($2,174.12) to absorb the selling pressure. Instead, Ethereum has traded straight through them, extending down toward the $1,710.47 wick low before a modest stabilization attempt. That is a serious development. I will not pretend those broken Fibonacci levels are still holding simply because my historical analysis gave me confidence in them. Yet the current 4 hour candle has not closed its session confirmation yet. That distinction matters. A recovery back above the $1,957.65 region would signal that buyers are attempting to reclaim lost ground. Continued trading beneath it leaves that entire zone vulnerable to acting as fierce overhead resistance. The recent lower-timeframe bounce off $1,710.47 is encouraging, but it is far from enough to declare this correction over. I have built my core Ethereum exposure over time, and my long-term investment thesis remains constructive. My short-term trading outlook, however, stays defensive until the market prints meaningful structural repair. The $1,710.47 low remains critical, and another retest is entirely possible. My final structural invalidation sits right at that $1,710 handle. A sustained breakdown beneath that floor would force me to step aside rather than defend a position emotionally. I am managing my existing exposure with strict risk control in mind, without assuming every relief bounce marks the final bottom. My longer-term recovery objectives remain entirely conditional on Ethereum rebuilding its damaged chart structure. I haven't abandoned my long-term conviction. But I am adjusting how I manage my risk because the immediate evidence on the screen has changed—much like how $SUIUSDT is fighting to defend its key structural support shelf amid this market-wide liquidity flush. #ByXIMPACT

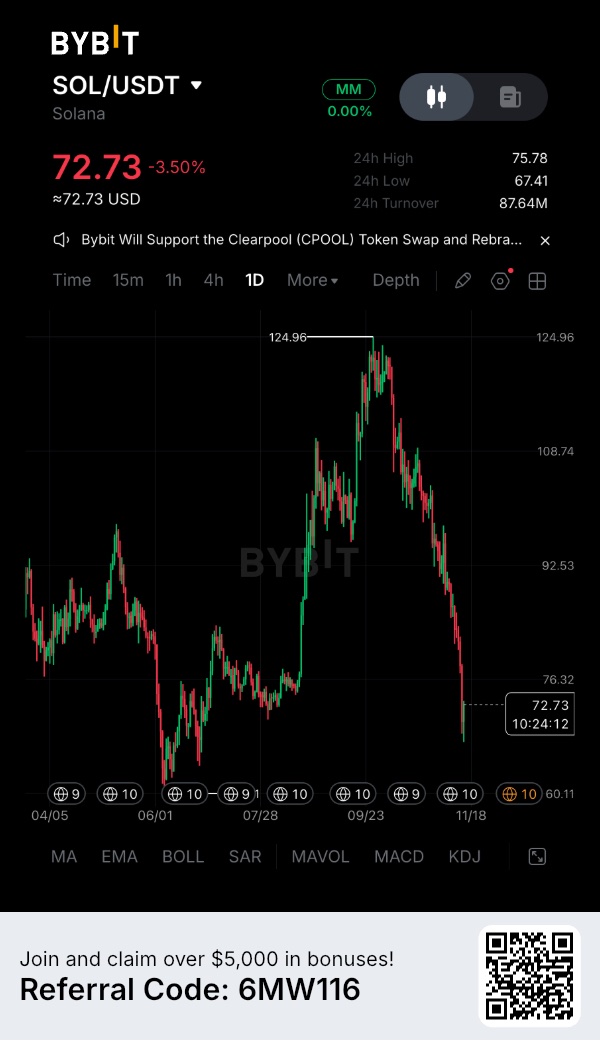
$SOLUSDT — The $76.32 support shelf I was watching in my previous Solana analysis failed. Yet that breakdown has pushed price straight back into the exact daily demand zone where I am seriously interested in building a fresh bullish position. Solana surged from its late-July accumulation base near $60.11 all the way up to $124.96, before surrendering nearly the entire advance. Once momentum stalled off the $124.96 peak, sellers drove price down through $108.74 and $92.53, dropping it right back into the $67.41–$76.32 daily accumulation zone. That completely reframes the trade. Earlier, the setup depended on whether SOL could sustain a breakout above $92.53 and $108.74. Now, I am evaluating whether buyers can defend the same origin block that launched the last major vertical leg higher. The latest daily candle shows price sweeping down to a 24-hour low of $67.41 before bouncing back toward $72.73 (-3.50%) on 87.64M in turnover. That reaction immediately grabs my attention because the major $60.11 swing low further down the chart remains untouched. I am constructive on this accumulation pocket, though the daily trend itself has not flipped bullish yet. Price is still trading underneath the broken $76.32 horizontal shelf, with heavy supply stacked overhead at $92.53 and $108.74. Before I commit aggressively, I want to see buyers convert this bounce off $67.41 into sustained spot demand. Reclaiming $76.32 on a clean daily close would improve the immediate outlook, while $92.53 remains the first major structural hurdle. My larger recovery objective sits at $124.96. I believe SOL can revisit that swing high if this $67.41–$76.32 zone develops into a durable base. That is a medium-term recovery scenario, not a call for an overnight 70% surge. The chart also provides a clean framework to manage risk. A planned spot accumulation setup uses the $72.73 zone as the entry reference, $58.50 (just beneath the $60.11 swing low) as the structural protective stop, and $124.96 as the extended target. That works out to roughly a 3.67:1 theoretical risk-to-reward ratio before fees, valid strictly around the marked reference. A decisive daily close below $67.41—and especially a breakdown beneath $60.11—would invalidate the accumulation thesis before the final stop is hit. I will not add to a losing position if the market starts accepting prices below the structure I am relying on. I like the asymmetry developing here, because the thesis has shifted from chasing strength to accumulating near the origin of the prior breakout—much like how $QNTUSDT is trying to stabilize around $148–$151 after a sharp 22% weekly slide despite Coinbase launching QNT perpetuals and The Clearing House selecting Quant for its institutional On-Chain Money Initiative. Which one builds a confirmed base first: SOL reclaiming $76.32 or QNT holding above $147? #IMPACTbyTrade

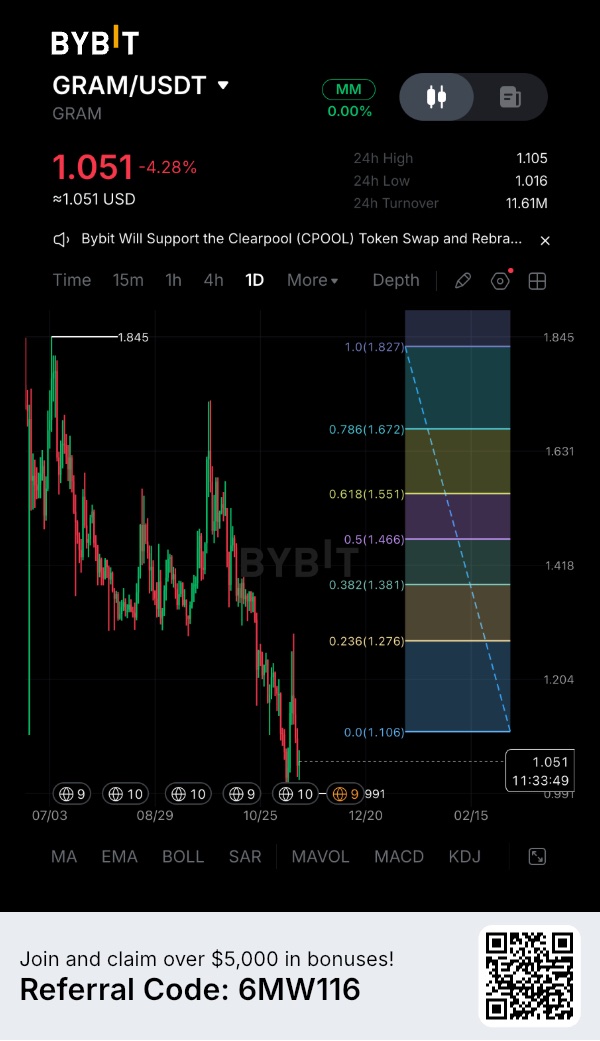
$GRAMUSDT is sliding despite Telegram's massive distribution push, and that disconnect demands a closer look. The ecosystem just reported over 1 million self custodial wallet activations within 48 hours alongside founder Pavel Durov calling the token "ridiculously undervalued" with top 3 crypto ambitions. Yet price has erased its bounce and is down over 20% across the past 30 days. The real question is whether Telegram's distribution advantage can convert into recurring spot demand, or if broader market risk-off pressure will keep weighing on the chart. On the daily chart, $GRAMUSDT is trading near $1.051 (-4.28%), with a 24 hour range between $1.016 and $1.105 on 11.61M in turnover. After topping out at $1.845 on the chart, price carved a steady sequence of lower highs through $1.631, $1.418, and $1.204 before slicing cleanly underneath the 0.0 Fibonacci floor at $1.106. Buyers are attempting to stabilize price above the $1.016 session low, while the $1.105–$1.106 breakdown level acts as immediate overhead resistance. The biggest fundamental catalyst is Telegram's accelerating self-custodial wallet rollout and proposed .gram domain initiative. With over 1 million wallets activated in 48 hours, Telegram is positioning itself as a direct crypto onboarding engine. However, wallets activate automatically upon receiving tokens, meaning headline activation counts do not automatically prove sustained buying or recurring fee-generating demand. Supply dynamics also require attention. Roughly 2.86 billion GRAM circulates out of a 5.28 billion total supply, giving the asset a multi-billion-dollar market capitalization near $3.03B. While massive user reach provides long-term potential, any ongoing supply overhang requires consistent spot absorption to prevent rallies from fading into resistance. Broader market sentiment is adding to the headwind, with the Crypto Fear & Greed Index sitting in extreme fear (around 19). Until buyers step in with conviction to absorb overhead supply, speculative bounces remain vulnerable to quick profit-taking. Key Figures • $1.051 — Current price area (-4.28%) • $1.016 – $1.105 — 24H trading range • 11.61M — 24H turnover • $1.845 — Chart swing high • $1.106 — Broken 0.0 Fibonacci support • $1.276 — 0.236 Fibonacci resistance • $1.381 — 0.382 Fibonacci resistance • $1.466 — 0.50 Fibonacci resistance • $1.551 — 0.618 Fibonacci resistance •$3.03B — Approximate market capitalization • 1M+ — 48H Telegram wallet activations Bullish Confirmation: $GRAMUSDT needs to reclaim the 0.0 Fibonacci level at $1.106 and establish acceptance above the $1.105 24-hour high on expanding spot volume. Doing so would shift short-term structure and open room toward $1.204 and the 0.236 Fib at $1.276. Bearish Confirmation: Losing the $1.016 session low and closing below the psychological $1.00 threshold would invalidate the current stabilization attempt and expose deeper downside price discovery toward the $0.991 chart marker and below. Telegram's distribution reach and wallet growth are undeniable, yet the chart is highlighting the gap between ecosystem headlines and active spot demand. Until $GRAMUSDT reclaims $1.106, the long term adoption story stays intact while short term price structure remains vulnerable. Across DeFi, $AAVEUSDT is facing a similar test around $101.90—proving resilient protocol utility as major borrowers actively defend collateral, yet still waiting for spot buyers to absorb overhead supply. Which chart are you tracking closer for the rebound: GRAM or AAVE?" #ByXIMPACT
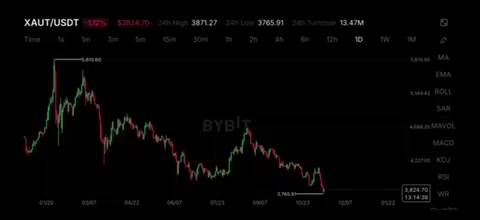
Heavy pressure is unfolding on $XAUTUSDT after slicing cleanly beneath the critical $3,920.24 floor, currently trading around $3,824.71 (-1.12%) on 13.47M in 24 hour turnover as broader cross-asset markets unwind. The macro and liquidation figures tell the full story: roughly $2 billion in leveraged crypto positions were wiped out through Sunday morning following Friday's $1.3 billion flush, while rising 10-year Treasury yields above 5% and a surging DXY dollar index are weighing heavily on non-yielding gold. This isn't a minor dip; it is a decisive structural breakdown on the daily chart, and defensive positioning is palpable across the board. What stands out most to me on the daily chart is the clean rejection from the $4,865.00 peak and the subsequent failure to hold the 0.0 Fibonacci base at $3,920.24. Price has carved out a sequence of lower highs through $4,590.22 and $4,315.45, and now sits trapped underneath the $4,040.68 shelf with zero sign of immediate reversal structure. The immediate floor I am tracking is the 24-hour low at 3,765.91. If $XAUTUSDT loses $3,765.91 on a decisive daily close, I expect sellers to press for deeper price discovery below $3,700 as weak hands continue to capitulate. Both the daily chart and the macro backdrop point in the same direction right now. With markets pricing in roughly an 88.5% to 94% chance of a Federal Reserve quarter-point rate hike and the Crypto Fear & Greed Index sitting at 21 (Extreme Fear), any short-term bounce toward $3,871.27 looks more like relief short-covering than a confirmed trend reversal. Risk Management The primary supply zone I am watching is the recent breakdown pocket between $3,920.24 (0.0 Fib) and $4,040.68. A convincing daily close back above $4,040.68 would seriously weaken my bearish view and suggest this breakdown was a liquidity sweep rather than continuation. Because price is still searching for a stable base and I have no confirmed entry or protective stop yet, I am not assigning an artificial risk-to-reward ratio here. I am interested in fading weak relief rallies back into broken support rather than trying to guess the exact bottom. Missing the first leg of a bounce is far cheaper than getting caught under another wave of macro selling. For now, I am letting $XAUTUSDT prove buyers can defend $3,765.91—are you hedging with gold here? #IMPACTbyTrade $COREUSDT #USInflationRunsHotAndRateHikeBetsRise
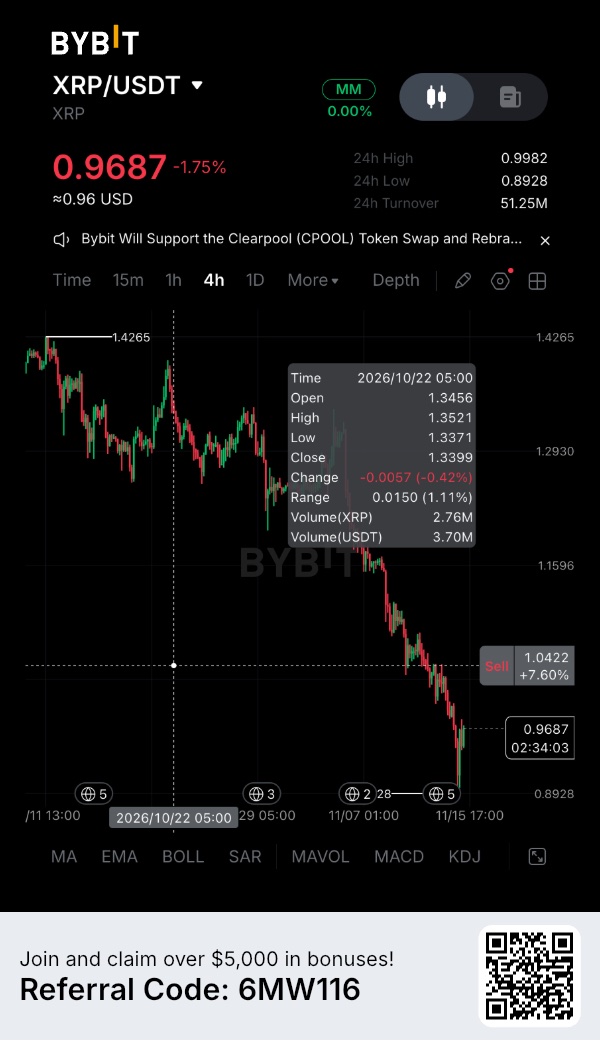
$XRPUSDT — I am constructive on an XRP recovery bounce, though the reason behind my view has shifted after this latest breakdown. The psychological $1.00 threshold and the $1.1596 structural shelf I previously tracked both gave way. XRP flushed all the way down to a 24 hour low of $0.8928 before staging a modest bounce back toward $0.9687 (-1.75%) on 51.25M in turnover. On the 4 hour chart, the broader trend remains firmly bearish following the steady bleed from the $1.4265 high. I am not going to pretend higher supports held just to defend an older thesis. Yet price action is showing an important shift in selling pressure. Look closely at how XRP reacted after sweeping $0.8928. Sellers pushed price to a fresh multi-month low amid $19.13M in weekly U.S. spot XRP ETF outflows, yet buyers immediately absorbed that liquidity below $0.90 and forced a push back toward the $0.9982 24 hour high. To me, that sharp rejection wick signals that downside momentum is starting to exhaust itself after weeks of unbroken red candles. There is still a harsh reality I have to respect. XRP remains trapped underneath the broken $1.0422–$1.1596 resistance band, meaning bearish structure is still dominant on this timeframe. I am watching closely for a recovery setup, but I will not confuse a single relief bounce off $0.8928 with a confirmed uptrend. The $0.9982–$1.0422 zone is where I will begin reassessing the immediate structure. Reclaiming $1.0422 on a clean 4-hour close and holding it on a retest would make the bullish case far more convincing. My larger recovery checkpoints sit at $1.1596 and $1.2930, with $1.4265 marked at the top of the chart—conditional targets, not an immediate guarantee. Risk Management The $0.8928 24 hour low is my immediate structural line in the sand. If XRP closes decisively below $0.8928 and fails to reclaim $0.90, this recovery thesis is invalidated and deeper support discovery opens up. Because no confirmed higher-low entry or protective stop has triggered yet, there is no fixed risk-to-reward ratio to claim here. My recovery outlook rests on buyers proving they can defend $0.8928 and win back $1.00+—much like how $CCUSDT is fighting to turn its recent institutional momentum and SEC digital commodity relief into a confirmed breakout above $0.1077 rather than getting rejected at resistance. Which one do you see reclaiming its key level first: XRP above $1.0422 or CC? NB: Never financial advice; always size positions for elevated volatility. #ByXIMPACT

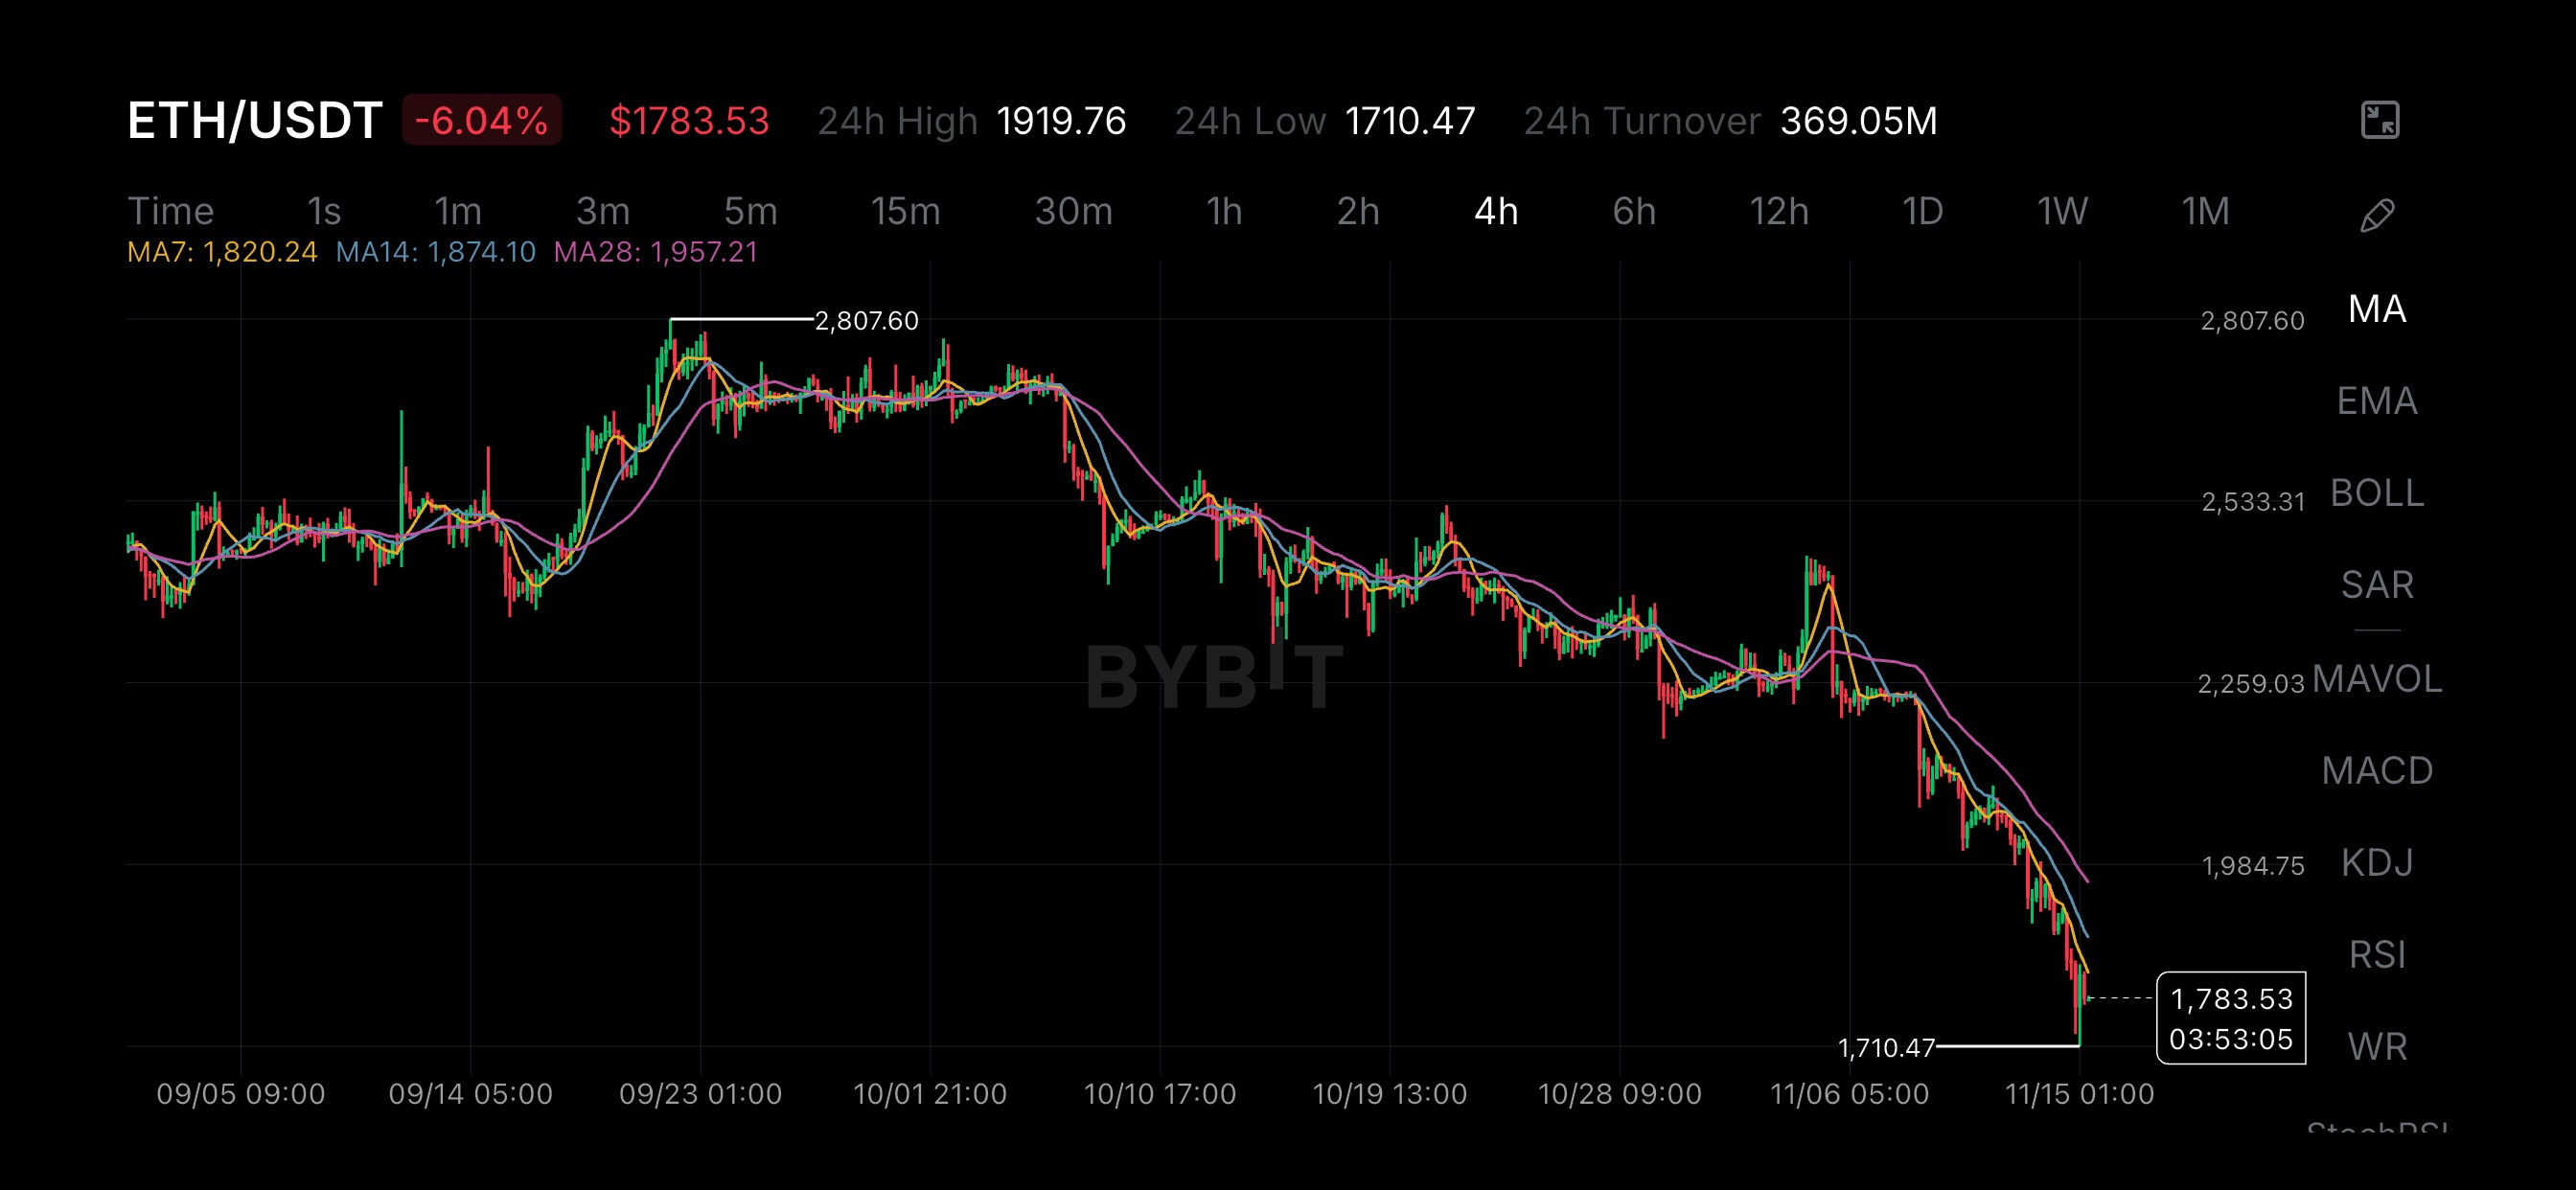
$ETHUSDT — Structural Alert: The $1,984.75 shelf I trusted to hold has officially given way. The weekend market snapshot is rough. Over $1 billion in leveraged crypto positions were liquidated across the market as total market cap slid toward $2.19 trillion. On the 4 hour chart, Ethereum has dropped -6.04% to $1,783.53, after sweeping down to a 24-hour low of $1,710.47 from a $1,919.76 session high on 369.05M in turnover. I have traded through violent flushes before, and I refuse to turn this drop into a narrative built on guesswork. Persistent U.S. spot Ethereum ETF outflows and macro rate-hike anxiety have clearly weighed on sentiment, while cascading long liquidations accelerated the downward move. Still, forced liquidations reflect overcrowding rather than a permanent death sentence for the network. What matters most to me is what just broke on my 4 hour chart. After topping out at $2,807.60 in late September, ETH spent weeks bleeding lower through $2,533.31 and $2,259.03 before slicing straight through the $1,984.75 structural support level. Right now, price sits well beneath every short-term moving average—MA7 ($1,820.24), MA14 ($1,874.10), and MA28 ($1,957.21) are all stacked overhead as dynamic resistance. That is a major structural shift. I will not pretend $1,984.75 is still intact just because previous bounces respected it. Yet the current 4-hour candle is showing early defense off the $1,710.47 wick low. That distinction matters. Reclaiming MA7 ($1,820.24) and pushing back toward the $1,957–$1,985 zone would signal buyers are fighting to recover lost ground. Remaining trapped underneath leaves that entire cluster vulnerable to rejecting future bounces. A single green reaction candle off $1,710.47 is encouraging, but it is far too early to call the downtrend over. I maintain a constructive long-term view on Ethereum's core thesis, yet my short-term trading posture stays defensive until price reclaims broken structure. The $1,710.47 low is my immediate line in the sand—a sustained 4-hour breakdown below $1,710.47 would invalidate any immediate bounce setup and force another reassessment. No confirmed long entry or fixed risk-to-reward ratio is claimed until a clean higher low forms. Conviction in an asset does not mean ignoring a broken chart. I am adapting my risk to the levels in front of me. Who else would be waiting for ETH to reclaim $1,984.75? #IMPACTbyTrade $CAPUSDT

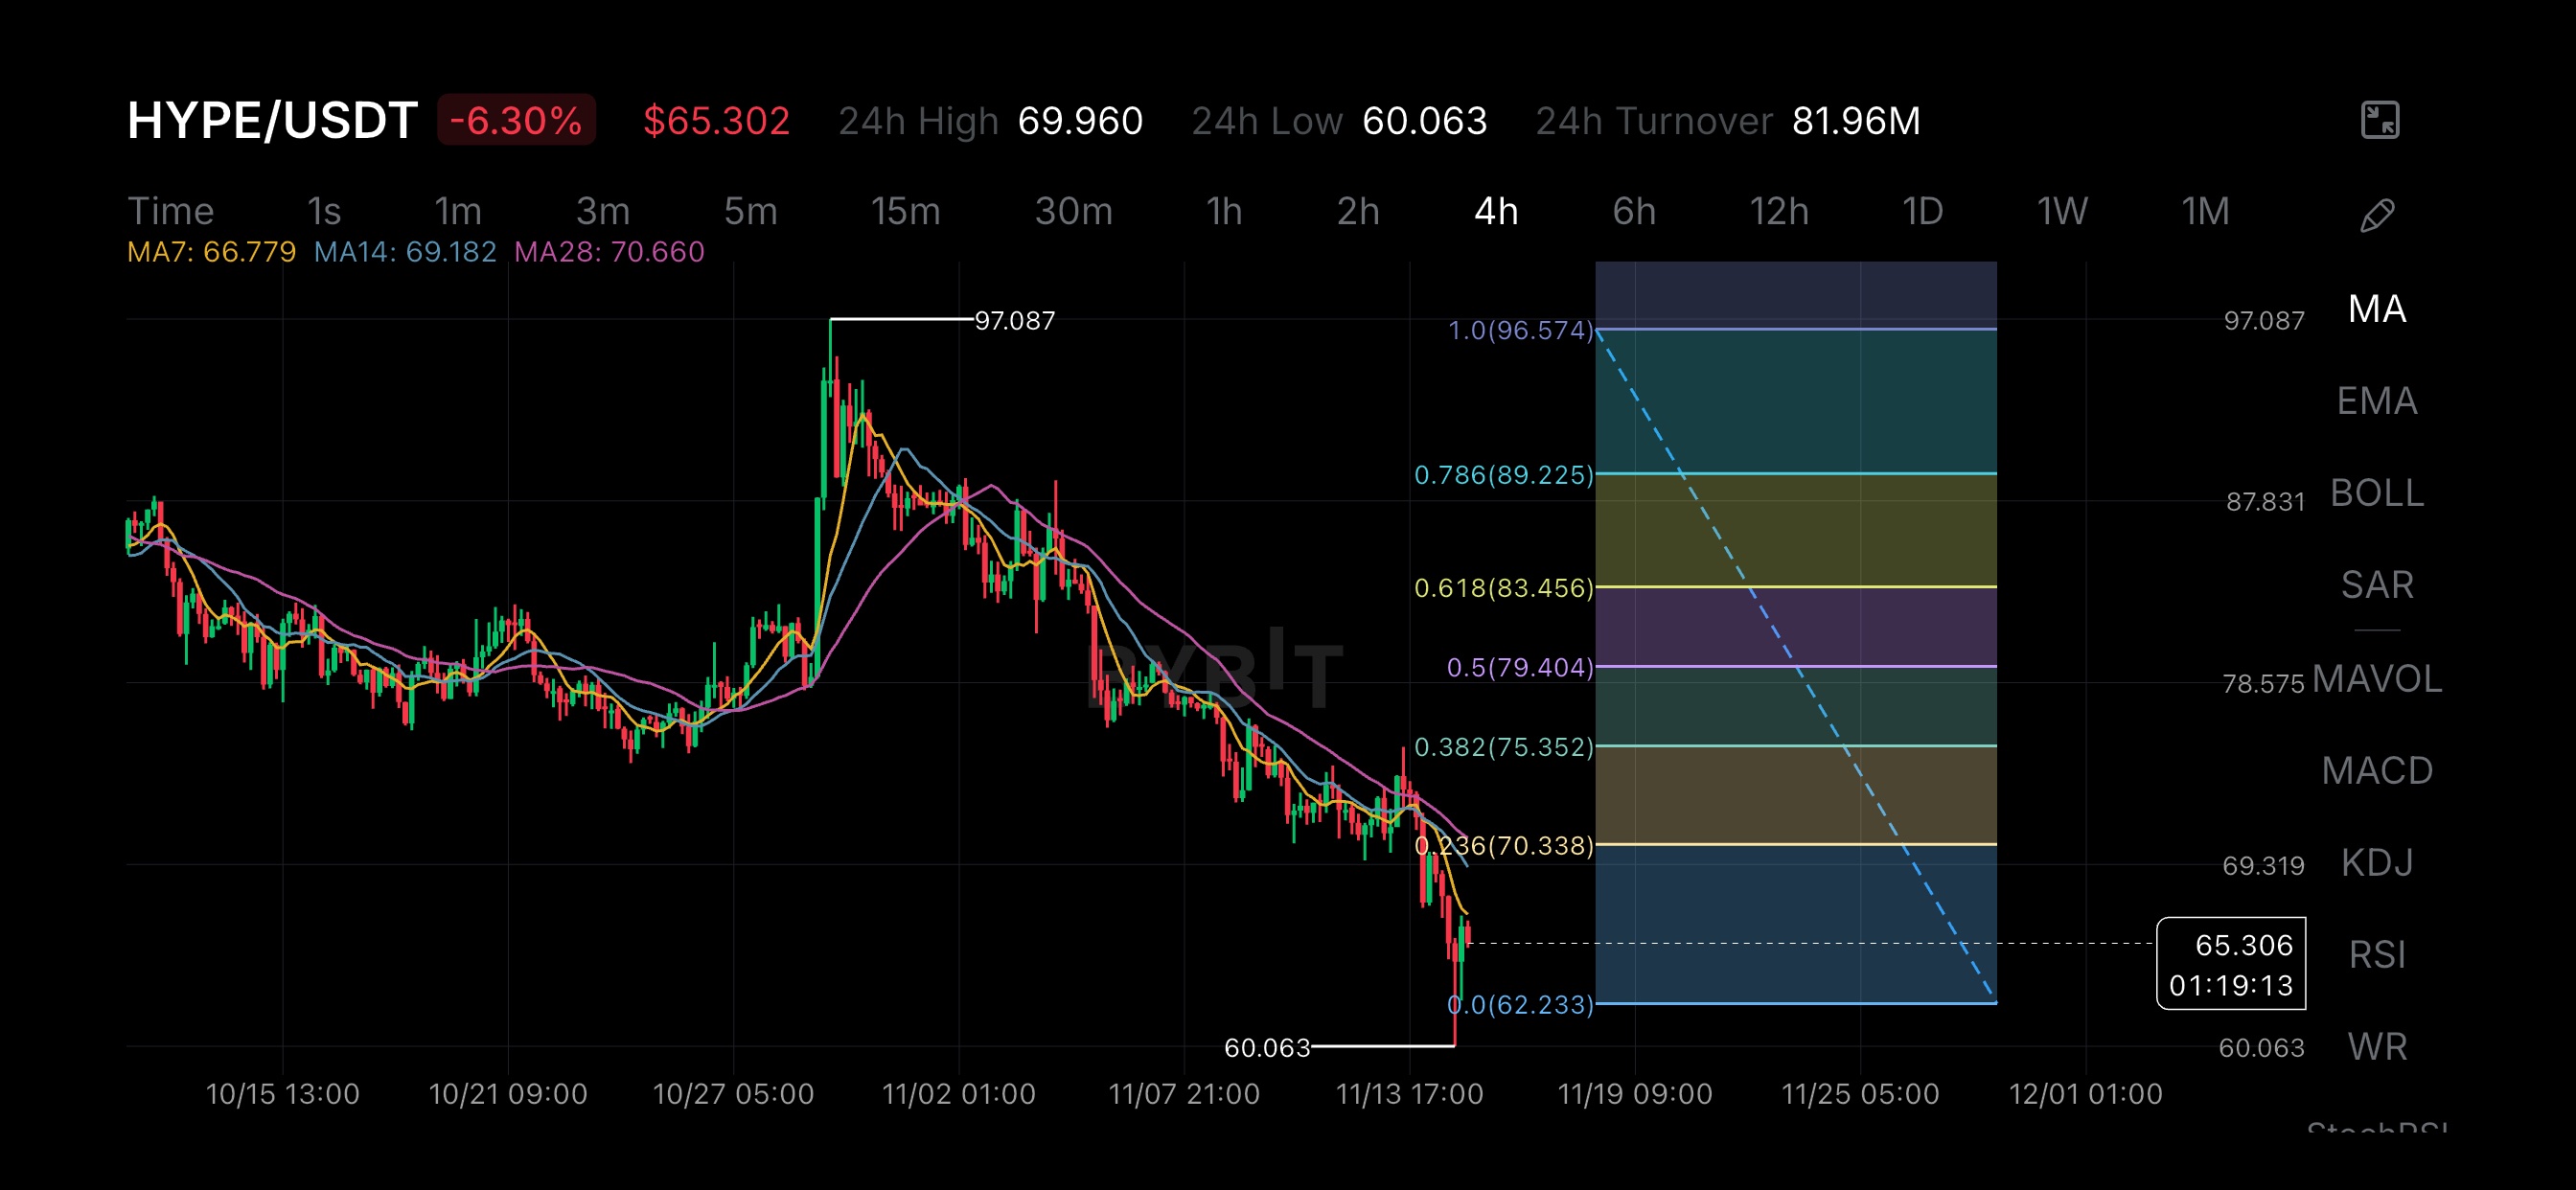
$HYPEUSDT chart was signaling heavy weakness before the liquidation cascade hit, something important happened on Hyperliquid's 4-hour chart prior to this latest flush. After failing to hold the highs above $97.087, price broke down through a key consolidation range and the moving averages (MA7 at 66.779, MA14 at 69.182, and MA28 at 70.660) flipped into immediate overhead resistance. Instead of finding a floor, buyers were repeatedly steamrolled, creating a sharp vertical drop that now has price testing the $65.306 region. Derivatives data added the final layer of pressure. Recent reports confirm that billions of dollars in leveraged positions were wiped out across the crypto market, with long positions accounting for the overwhelming majority of the damage—over 90% of recent liquidations were longs. As price broke below major support shelves, forced selling from these long positions accelerated the move, creating a self-reinforcing loop of liquidations. But here's what interests me most. Downside pressure was already building before the forced selling began. That is why I always study market structure and positioning before reacting to the headlines. Price action can reveal underlying fragility long before a liquidation candle prints. The charts cannot predict the exact trigger, but they can warn us when the market is overcrowded and vulnerable to a flush. Trading Perspective Hyperliquid is now sitting near the $65.306 level, which sits just above the 0.0 Fibonacci support level at 62.233 on the 4-hour chart. While short-term momentum looks stretched, I wouldn't call a bottom confirmed just because price has flushed hard. The bigger opportunity lies lower. I have marked the major demand block around the 0.0 to 0.236 (70.338) Fibonacci zone as the critical support area. If the current level fails to hold and the liquidation engine keeps running, that is where I will become particularly interested in a potential long setup. I'm not planning to buy simply because price reaches my box. The key driver here is the long/short ratio. The more retail traders rush to open new long positions trying to catch the falling knife, the more fuel there is for the market to continue pushing lower to hunt that liquidity. I need to see a meaningful shift in open interest and a flush of these late longs before I consider a reversal. I want to see a structural shift, a higher low, and evidence that buyers can actually defend a level. Risk Management I have no confirmed long entry yet. My stop-loss and risk-to-reward ratio will depend entirely on the actual bullish confirmation and entry price once we see a genuine capitulation. A sustained breakdown through the major demand zone without a convincing recovery would invalidate any proposed long setup. The tokenized chart mirrors the underlying asset, so entries must account for the specific liquidity of the product. Patience matters more than catching the exact bottom. Meanwhile, I'm keeping that same disciplined, cautious approach on $MNTUSDT right now. MNT has slid down toward the $0.367–$0.406 region after losing its multi-month support shelf during this broader risk-off washout. Even with Mantle's $1.62B+ community treasury and expanding tokenized RWA infrastructure, strong ecosystem fundamentals do not override a broken short-term structure. I'm constructive on Mantle's longer-term trajectory, yet I won't confuse institutional growth with a triggered entry—waiting for price to reclaim broken resistance and carve out a clear higher low first. Chasing red candles is how accounts get wiped; waiting for structure is how capital survives. I’m letting HYPE and MNT finish their flush before putting a single dollar at risk. #ByXIMPACT

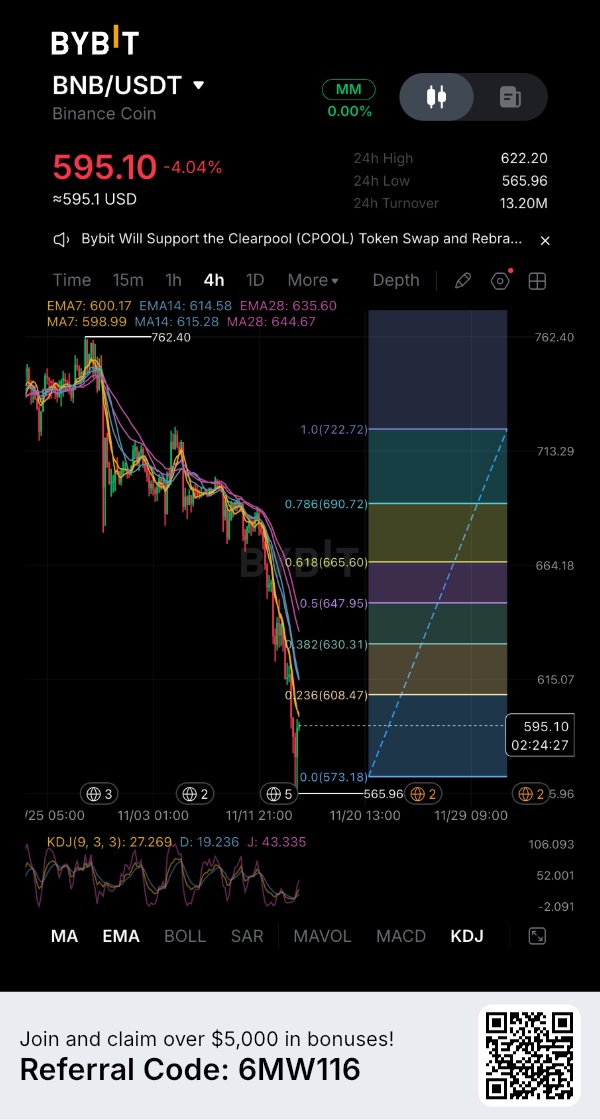
$BNBUSDT — I see a clean recovery roadmap taking shape, yet the last few 4 hour candles give me every reason to stay selective with my entry. After sliding sharply from $762.40 down to a 24 hour low of $565.96 amid broader market weakness, BNB bounced back toward $595.10 (-4.04%), backed by 13.20M in 24-hour turnover. That reaction off the lows is constructive, especially with Binance confirming over $6.34 billion in replenished assets and rising BNB reserve balances. Still, price remains pinned below the 0.236 Fibonacci retracement at $608.47 as well as the short-term moving average cluster (MA7 at $598.99 and EMA7 at $600.17). I do not want to mistake an initial relief bounce for a confirmed trend reversal. The interesting part of my trading plan is how price behaves right around this lower Fibonacci shelf. I am watching for a controlled retest above the $565.96–$573.18 base where buyers can establish a clean higher low on the 4H chart, paired with KDJ(9, 3, 3)—currently curling up with J at 43.335 over K (27.269) and D (19.236)—maintaining upward momentum. If that structure holds, BNB has room to build a sustainable recovery. There is a second scenario on my chart. BNB could push directly through $608.47 (0.236 Fib) and reclaim the $614.58–$615.28 EMA14/MA14 zone as support. That would also validate a bullish shift, though chasing a breakout right into overhead resistance changes the entry math. My immediate upside checkpoints sit at $630.31 (0.382 Fib) and $647.95 (0.5 Fib), with the golden pocket at $665.60 (0.618 Fib) and $690.72 (0.786 Fib) marking the larger recovery targets—conditional levels, not a guarantee of an immediate vertical rally. Risk Management At $595.10, price is sitting less than 2.3% below the $608.47 Fibonacci barrier and the $600 moving average cluster, making a blind long right beneath resistance far less attractive than waiting for structure. A sustained 4 hour close below $565.96 would invalidate this recovery setup and open fresh downside discovery. No confirmed entry or fixed risk-to-reward ratio is claimed before execution conditions trigger—never financial advice, always manage leverage carefully. My outlook favors a patient recovery play, yet much of the timing still depends on $BTCUSDT holding steady around the $64,700–$65,000 range rather than dragging altcoins into another leg down. Let the structure confirm before committing capital. #IMPACTbyTrade
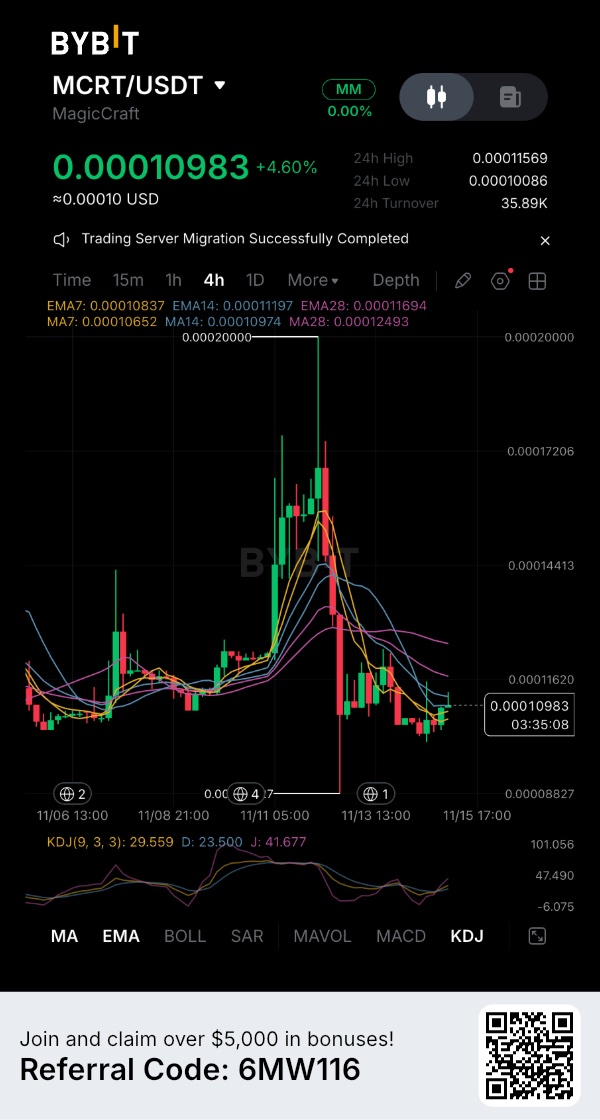
$MCRTUSDT suffered a violent rejection off its highs—a steep vertical unwind that erased its parabolic rally and caught late buyers off guard. Yet that sharp flush straight back down to origin support is the exact type of structural reset I look for. I avoid chasing green wicks during a vertical spike; instead, I wait for the liquidation dust to settle and evaluate the retest once volatility compresses. Right now, the 4H structure is offering an intriguing inflection point. Look closely at the 4H chart: price surged to a blow-off peak at $0.00020000 before plunging all the way back to a swing low at $0.00008827. That was not a minor dip—it was a complete round-trip liquidation event. Since tagging that $0.00008827 floor, the market has stabilized and begun carving out higher lows, currently trading at $0.00010983 (+4.60%) within a $0.00010086–$0.00011569 24 hour range on 35.89K in turnover. Here is my technical read on why this zone matters: >>> Dynamic Moving Average Cluster: Price is battling directly inside a tightly compressed moving average ribbon—sitting just above EMA7 ($0.00010837), MA7 ($0.00010652), and MA14 ($0.00010974), while pressing right beneath EMA14 ($0.00011197) and EMA28 ($0.00011694). Holding above the $0.00010086 24-hour low keeps this short-term base intact. >>> Momentum Reset: After the extreme selloff, KDJ has cooled off and curled upward from oversold territory (K: 29.559, D: 23.500, J: 41.677), signaling that aggressive distribution has paused and buyers are attempting an early structural shift. >>> Overhead Structural Shelves: Reclaiming the $0.00011620–$0.00011694 resistance band (aligning with EMA28 and the 24 hour high of $0.00011569) opens the path for a mean-reversion push toward MA28 at $0.00012493 and the $0.00014413 mid-range shelf. Execution Strategy and Risk Management: I am treating this as a structured base building setup rather than blindly catching a falling knife. * Reference Zone: Watching for sustained 4H acceptance above $0.00010837–$0.00010983 as price defends the $0.00010086 intraday floor. * Invalidation Level: A decisive 4H breakdown below $0.00010086 weakens the higher-low sequence, while losing the $0.00008827 macro swing low completely invalidates the recovery structure and requires stepping aside immediately. * Upside Objectives: First test sits at the $0.00011569–$0.00011694 ceiling, followed by $0.00012493 and the broader $0.00014413 structural level if momentum expands. When post spike volatility cools off, patience and strict invalidation levels matter far more than guessing exact bottoms. Are you waiting to see if $0.00010086 holds on another retest? #ByXIMPACT $VVVUSDT
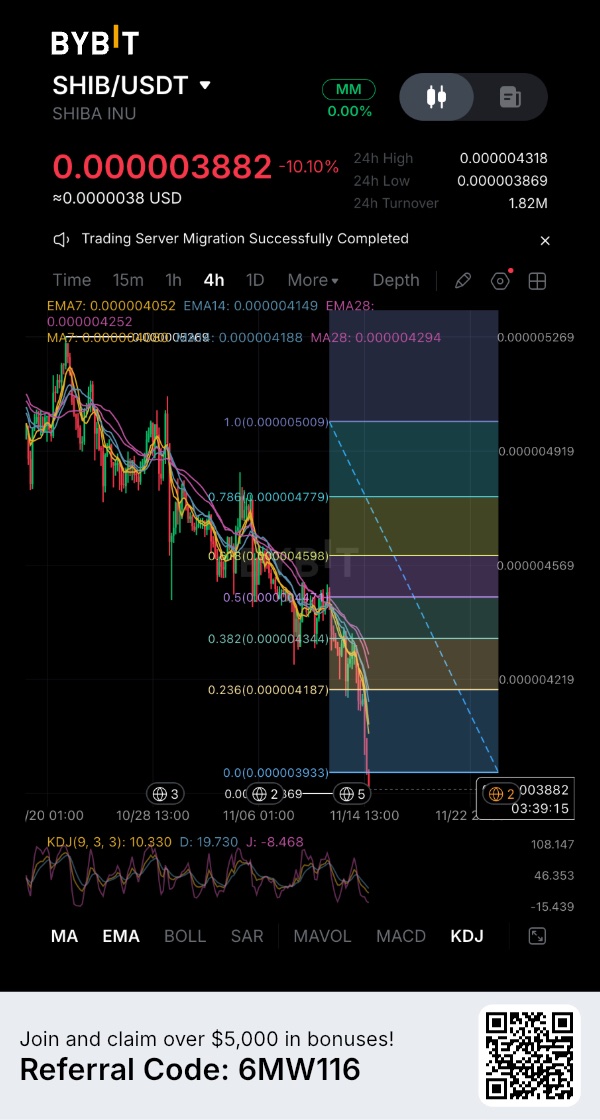
$SHIBUSDT— I am keeping the Fibonacci structure on my chart, though I am no longer treating this zone as an active buy area. I originally mapped the retracement from the $0.000005009 swing high down to the $0.000003933 base to track where buyers might step back in. However, the latest -10.10% drop has driven SHIB straight through every intermediate shelf—slicing beneath the 0.382 ($0.000004344) and 0.236 ($0.000004187) levels to press right against its $0.000003869 24 hour low, with current price hovering near $0.000003882 on 1.82M in turnover. That breakdown changes how I read these levels. What used to act as potential support—particularly the $0.000004187–$0.000004344 band, where the 4H EMA7 ($0.000004052), EMA14 ($0.000004149), and EMA28 ($0.000004252) now slope downward overhead—can easily flip into supply if SHIB rebounds into that region. I will not delete the Fib grid just because price broke below the 0.0 anchor ($0.000003933); I want to observe how price reacts when it retests those broken shelves. This kind of technical friction is showing up across other active ecosystem tokens too—$ASTERUSDT has similarly slipped toward the $0.62–$0.63 zone after breaking below its $0.68 October floor, even with 99% of daily platform fees funding token buybacks and burns, proving that strong fundamentals or prior support zones cannot immediately override overhead supply once structure breaks. There is another critical detail on my chart: even though KDJ is deeply compressed (K: 10.330, D: 19.730, J: -8.468), oversold oscillators alone do not confirm that real demand has returned. If SHIB bounces toward $0.000004052–$0.000004187 and immediately stalls against the descending moving averages, I will treat that as confirmation that former support has turned into resistance. A brief relief bounce into the lower Fib levels would not automatically restore a bullish setup. I need something far more convincing: reclaiming $0.000003933, establishing acceptance back above the 0.236 Fib at $0.000004187, and eventually challenging the 0.5 ($0.000004471) to 0.618 ($0.000004598) golden pocket. Until then, upper levels like the 0.786 retracement ($0.000004779) and the $0.000005009 peak remain distant reference markers rather than active targets. The $0.000003869 low is simply the current chart boundary, not a blind entry trigger. Any fresh position requires a verified base, a defined invalidation level, and disciplined position sizing rather than catching a falling knife. I remain open to SHIB's longer-term recovery potential, yet my view of the asset and my willingness to take a trade here are two separate decisions—and right now, the 4H chart gives every reason to keep them separate. #ByXIMPACT #BitcoinHitsTwoMonthLowAfterUSMidterms
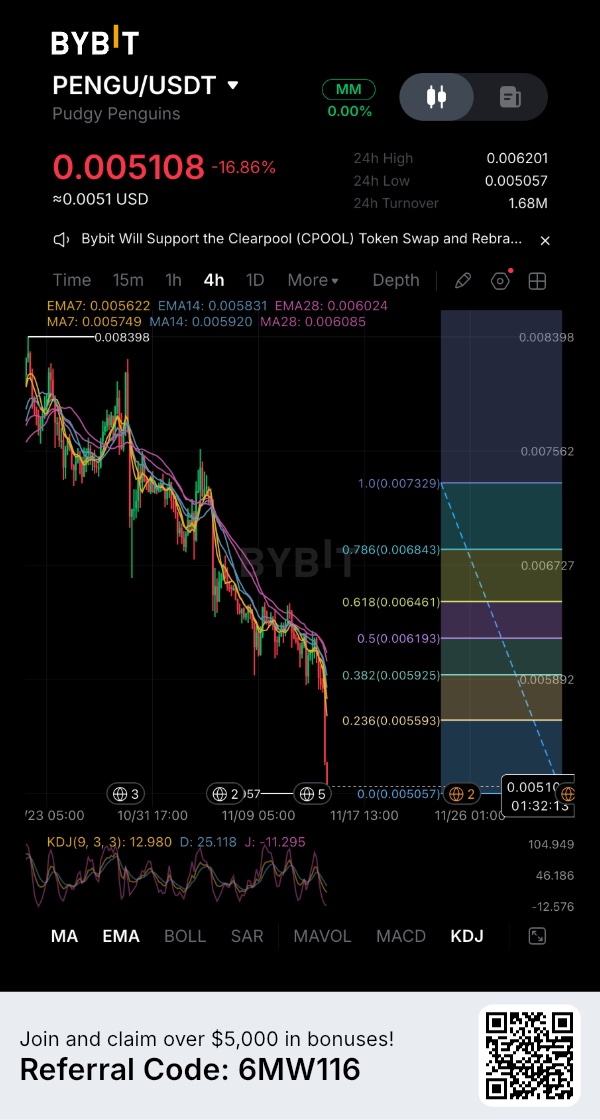
$PENGUUSDT is trading around $0.005082, recording a sharp -16.91% slide after cascading down from its $0.008398 swing peak and pressing straight into its $0.005066 24 hour low. Following the breakdown through intermediate shelves at $0.007565 and $0.006732, price recently sliced below the $0.005899 consolidation floor on 1.67M in 24 hour turnover. That kind of heavy memecoin distribution is visible across peer tokens too—Peanut the Squirrel $PNUTUSDT has similarly slid roughly 20% this month toward the $0.031–$0.032 zone, testing multi month lows as speculative liquidity rotates out of high-beta assets. On the 4H chart: >> Swing Peak Resistance: $0.008398 >> Mid Range Shelves: $0.007565 and $0.006732 >> Broken Support Ceiling: $0.005899 Price is sitting deep below every prior breakdown shelf, which turns the $0.005899–$0.006201 (24-hour high) region into a heavy structural ceiling that bulls must eventually reclaim. Right now, PENGU is hovering right at its current lows with no confirmed base yet. Stabilizing above $0.005066 and reclaiming $0.005899 would give buyers their first real sign of a relief bounce. Above that, the $0.006732 level becomes the next major resistance before higher range levels come back into view. I am watching for a range floor to form first. After a selloff as steep as the one PENGU just experienced, the next meaningful move will come once buyers either absorb supply above $0.005066 or sellers force price discovery lower. #IMPACTbyTrade
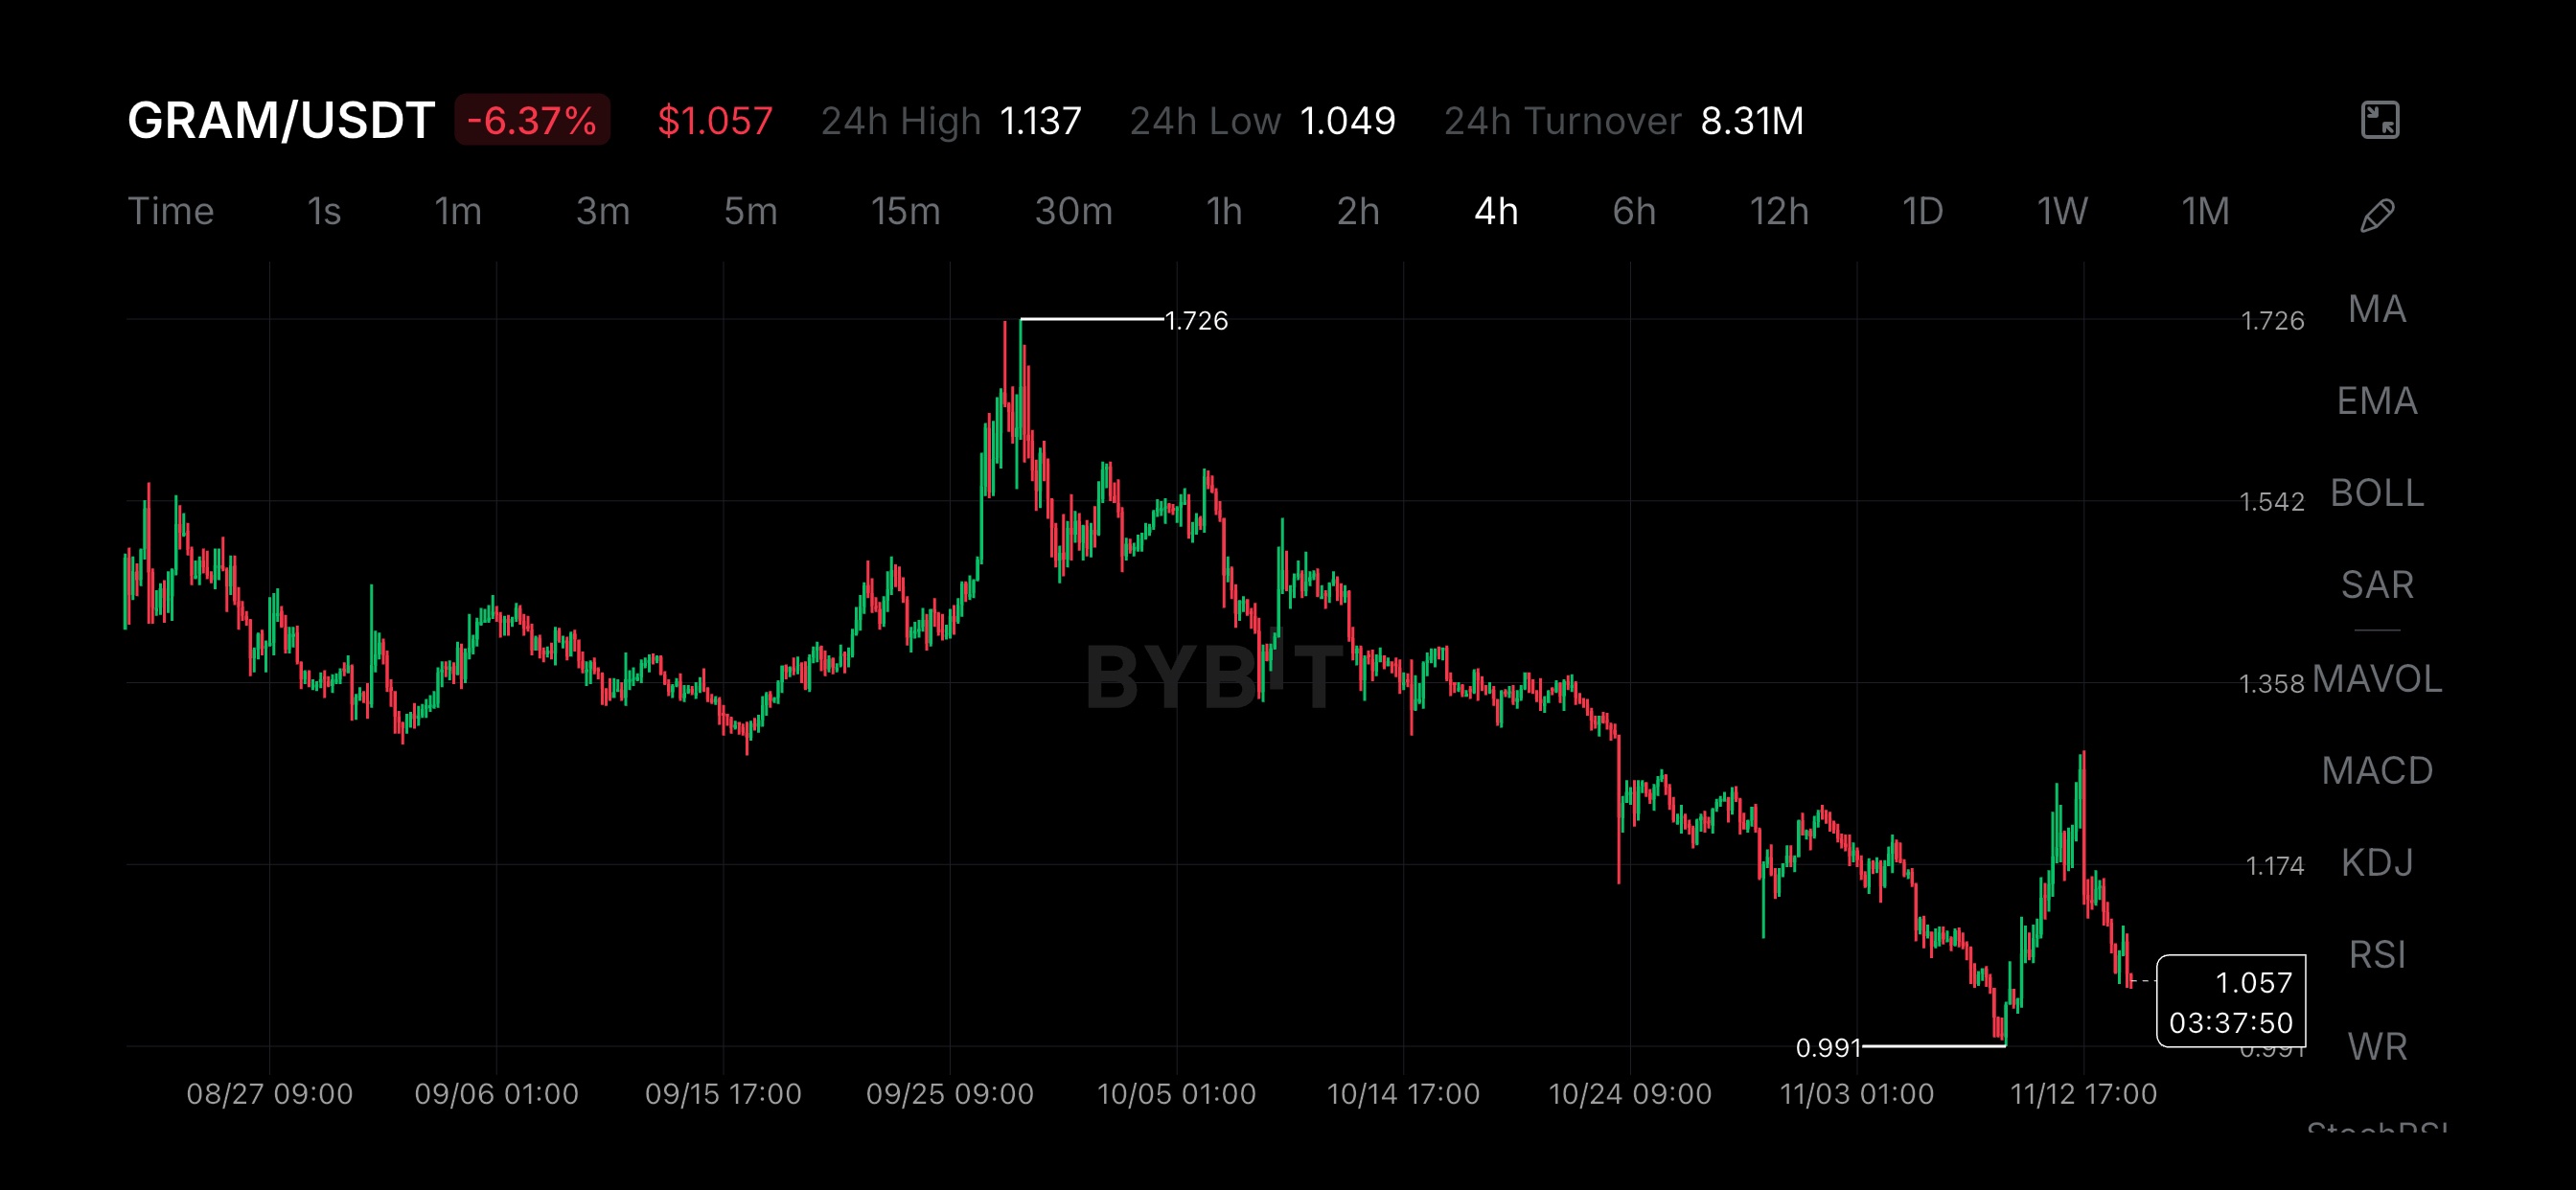
$GRAMUSDT— GRAM's recent bounce off the lows is notable, yet the current pullback toward support could decide whether buyers hold structure or give back the recovery. GRAM has rebounded sharply from its $0.991 swing floor, briefly pushing toward the $1.25–$1.30 area before sellers stepped back in. Currently trading around $1.057 (-6.37%) inside a $1.049–$1.137 24-hour range on 8.31M in turnover, buyers have struggled to sustain acceptance above $1.174. That matters because a sharp relief rally inside a broader downtrend from the $1.726 peak is not automatically a confirmed trend reversal. Broader altcoin sentiment remains fragile as high-beta tokens face steady distribution—even majors like $DOGEUSDT have slid roughly 6% today toward $0.0605, underscoring how quick traders are to lock in profits on relief bounces across speculative pairs. Where could GRAM move? GRAM is holding just above its $1.049 24-hour low on the 4H chart. If sellers continue rejecting rebounds beneath $1.137–$1.174 and force a breakdown below $1.049, I see a full retest of the $0.991 macro swing low as the primary downside test. Conversely, if buyers defend the $0.991–$1.049 demand shelf and carve out a higher low, a sustained reclaim above $1.174 would put the $1.358 mid-range shelf back in focus, with $1.542 becoming possible if momentum expands. These levels reflect the visible 4H structure. Risk Management: I won't chase an unconfirmed bounce inside a steep downtrend. I'll watch whether $1.049 holds as a higher low above $0.991 and whether turnover expands on any recovery attempt. A decisive 4H close below $0.991 would invalidate the higher-low thesis and signal continuation lower. No fixed risk-to-reward ratio is claimed without a confirmed trigger and stop-loss. This is why my short term bias is cautiously neutral. The key question now isn't whether GRAM can bounce off $0.991. It's whether buyers can build a higher low above $1.049 while the broader market remains defensive. #IMPACTbyTrade

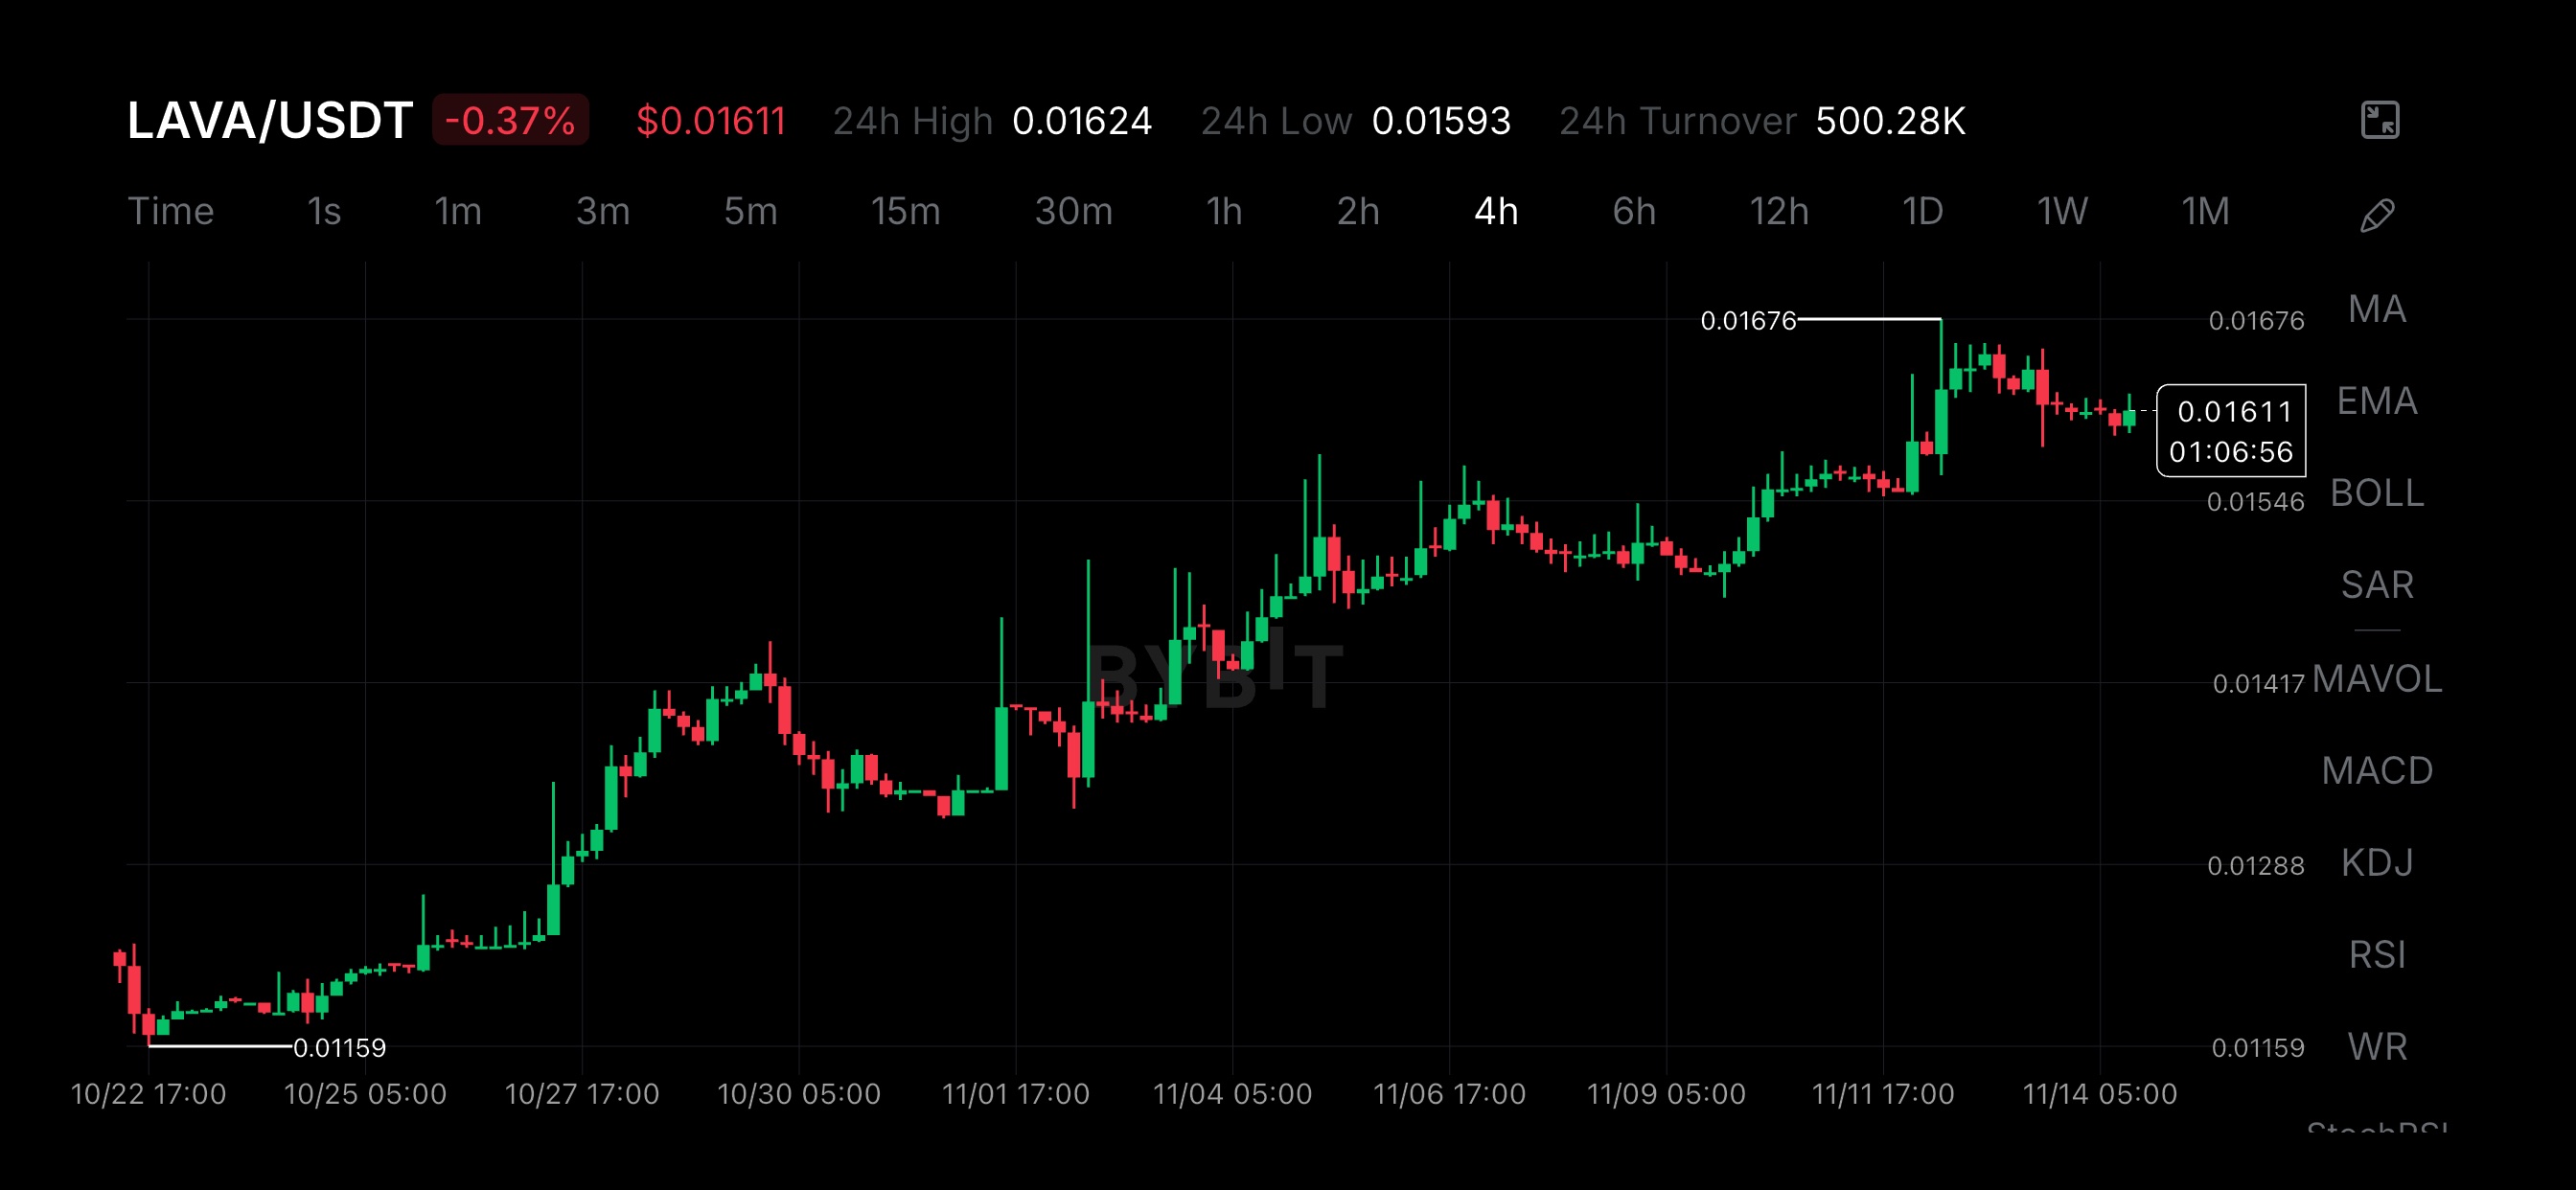
$LAVAUSDT multi week climb is impressive, yet the current consolidation near its peak could decide whether buyers force another leg higher or get sold into. LAVA has climbed steadily from its $0.01159 October base, briefly reaching a swing high of $0.01676 on the 4H chart. Yet buyers have paused just beneath that ceiling, with price drifting -0.37% around $0.01611 inside a tight $0.01593–$0.01624 24 hour range on 500.28K in turnover. That matters because stalling right under resistance after a prolonged run does not automatically guarantee an immediate breakout. My short-term bias: Considering that buyers might take over the market soon and the broader market sentiment remaining defensive as rising U.S, I'm cautiously neutral. Treasury yields and a stronger dollar have weighed on major assets—dragging Bitcoin down toward the $67,000 area and keeping Layer-2 benchmarks like $ARBUSDT under pressure near $0.1384 as traders watch whether its $0.1351 support floor holds. While LAVA has shown clear relative strength against that backdrop, macro headwinds and light weekend liquidity make overhead supply harder to absorb on the first test. Where could LAVA move? This is the question that has kept staring at the chart. Even though a move is imminent, I'm focused on seeing how the market reacts. LAVA is trading around $0.01611 on my chart. If sellers continue capping rallies below $0.01624–$0.01676 and price slips under the $0.01593 24-hour low, I see $0.01546 as the first downside support test, followed by $0.01417 and potentially the $0.01288 shelf if broader risk off selling accelerates. Conversely, a sustained 4H close above $0.01676 would invalidate the near term hesitation and put fresh price discovery back in focus. These levels reflect the visible Bybit 4H structure; spot and perpetual spreads can vary slightly across venues. I won't chase the first wick above resistance. I'll watch whether $0.01593 holds as higher-low support and whether volume expands above 500.28K on any breakout attempt. A decisive breakdown below $0.01546 would shift momentum back toward the mid-range shelves. No fixed risk-to-reward ratio is claimed without a confirmed trigger and stop-loss. The key question now isn't whether LAVA can spike. It's whether buyers can hold control above $0.01593 while the rest of the market digests macro pressure. This is a conditional market outlook, not financial advice. #IMPACTbyTrade

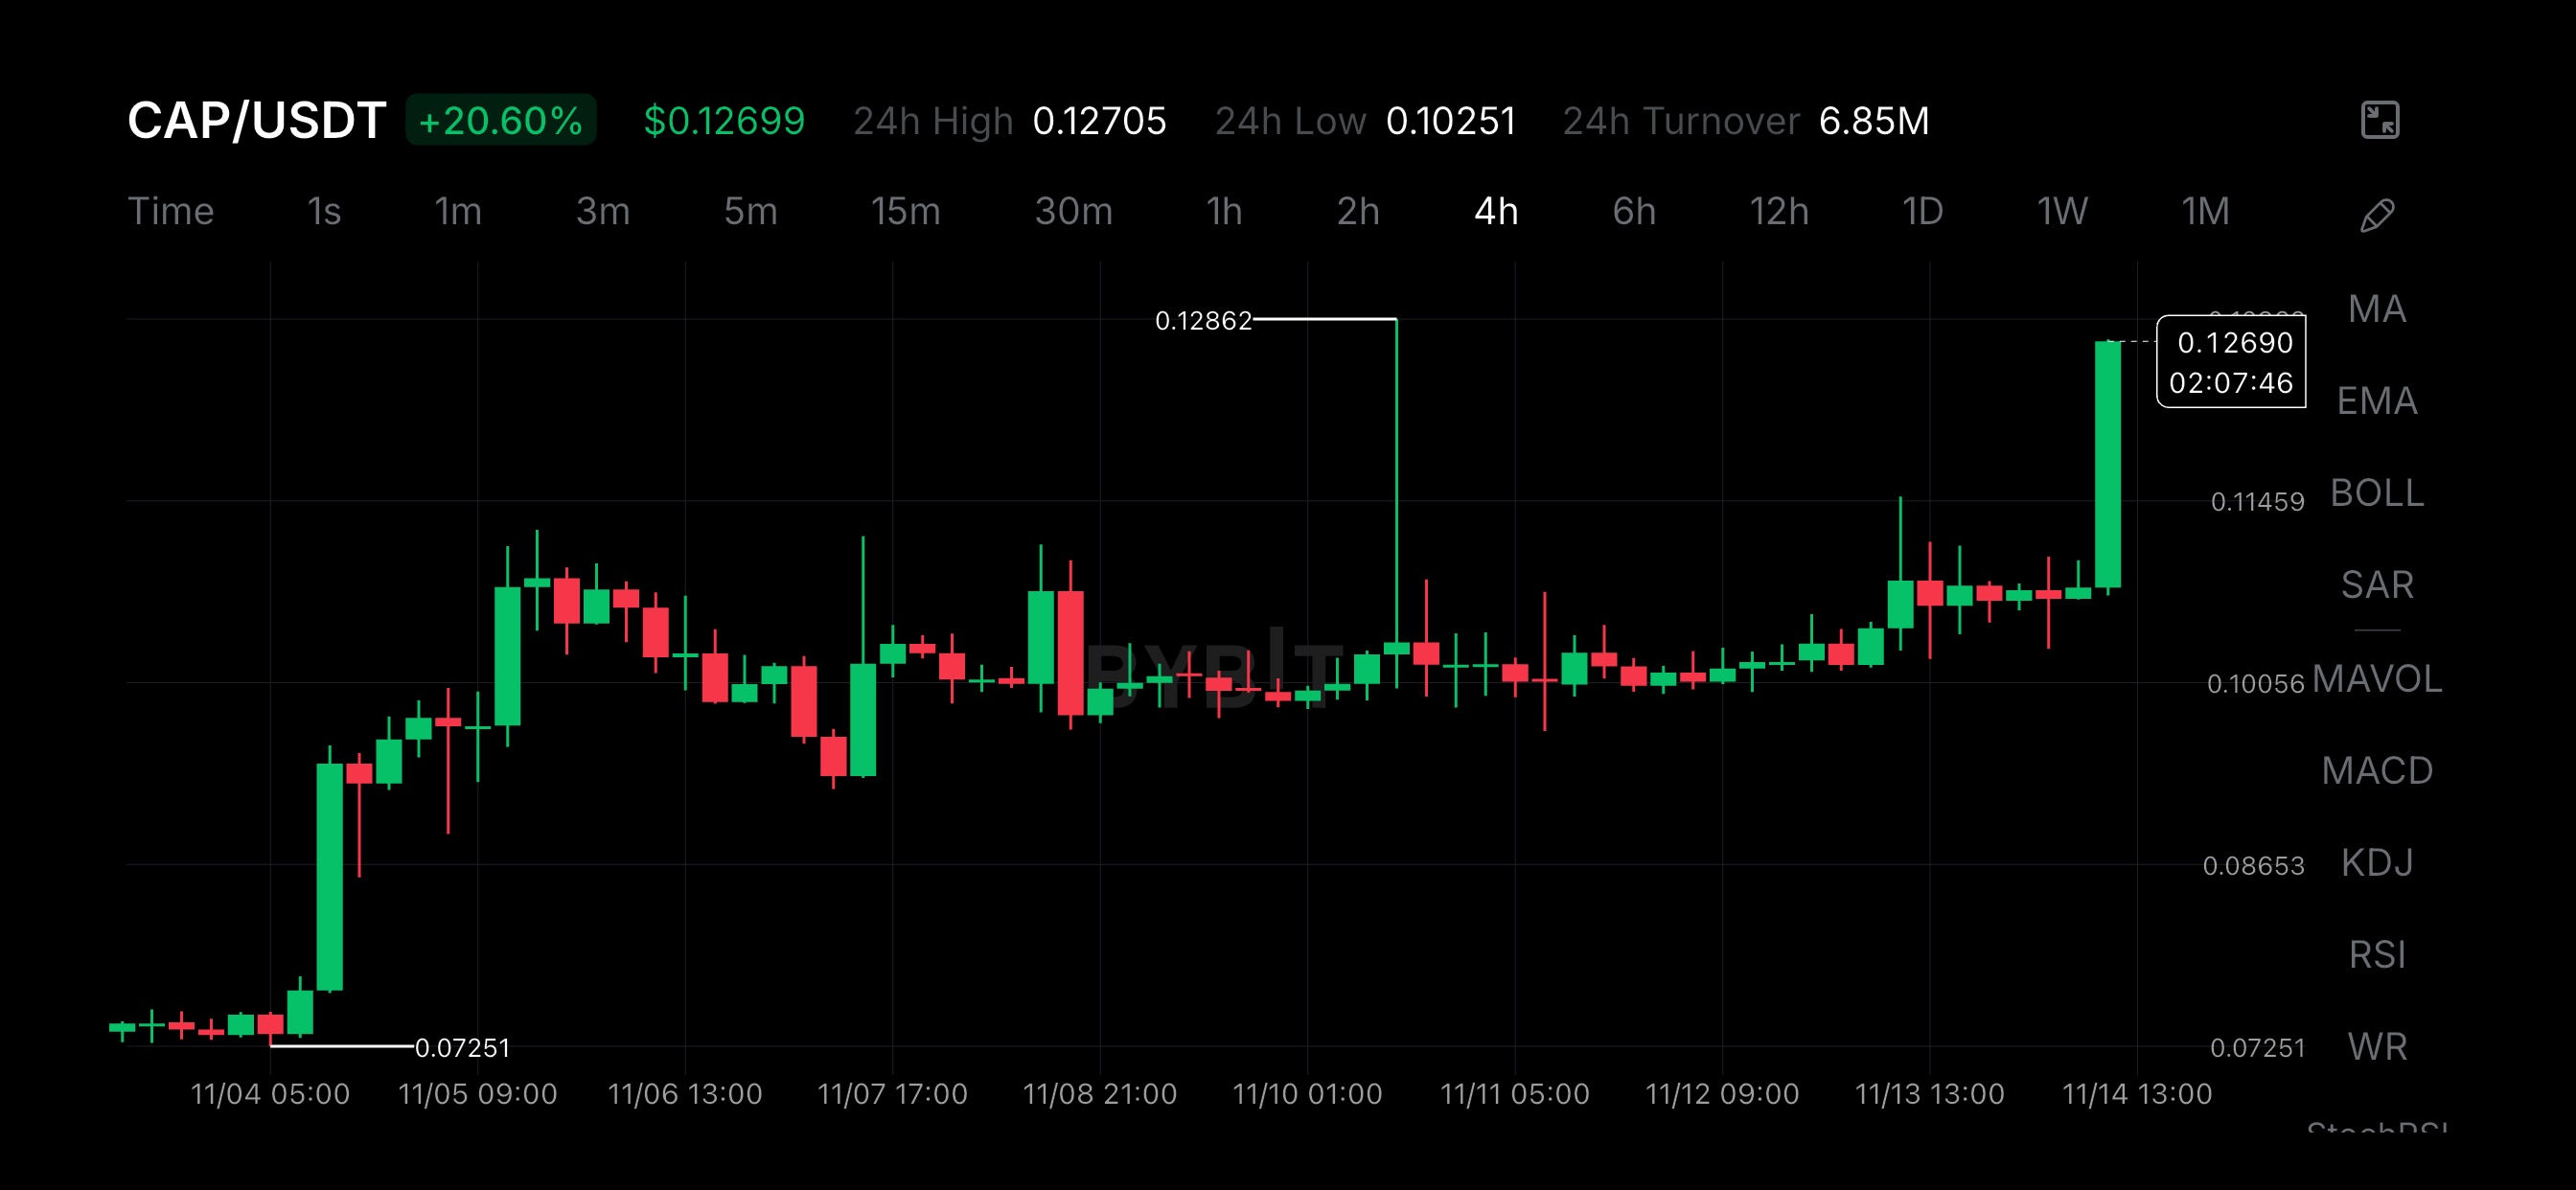
$CAPUSDT — A +20.60% breakout candle is dominating the 4H chart, yet buying straight into the $0.12862 ceiling is where disciplined traders step back and wait for structure. CAP has surged from its $0.10251 24-hour low to trade around $0.12699, backed by 6.85M in 24-hour turnover. After spending over a week consolidating tightly above the $0.10056 demand shelf following its initial run from $0.07251, buyers finally forced an aggressive expansion candle straight through the $0.11459 resistance barrier. That kind of relative strength stands out—especially while broader DeFi and real-world credit tokens have faced heavy risk-off pressure across the market. However, price is now pressing directly into the $0.12705 24-hour high and the $0.12862 wick peak. Chasing an extended green 4H candle directly into prior rejection highs often traps late entries right before early buyers take profits. What I Am Watching The structural zone between $0.10251 and $0.11459 is where my plan becomes interesting. The $0.11459 level now acts as the primary breakout shelf to flip from resistance into support. I am watching for a controlled pullback toward $0.11459, a potential sweep of intraday lows, and a confirmed 4H higher low. If buyers defend that structure, a clean breakout above $0.12862 opens the door to fresh price discovery. Risk Management This is a conditional pullback plan, not an immediate market buy. I want clear bullish defense above $0.11459 before entering. A sustained 4H close back below $0.10056 invalidates the breakout structure and exposes the $0.08653 support shelf (with wider macro invalidation down at $0.07251). Always anchor your stop-loss beneath the confirmed higher low and size positions strictly to volatility. After a +20.60% vertical expansion, the real test is whether $CAPUSDT can convert $0.11459 into higher-low support without giving back the breakout. Would you wait for a retest of $0.11459 or trade a confirmed breakout above $0.12862? #ByXIMPACT $BRUSDT #ByXIMPACT
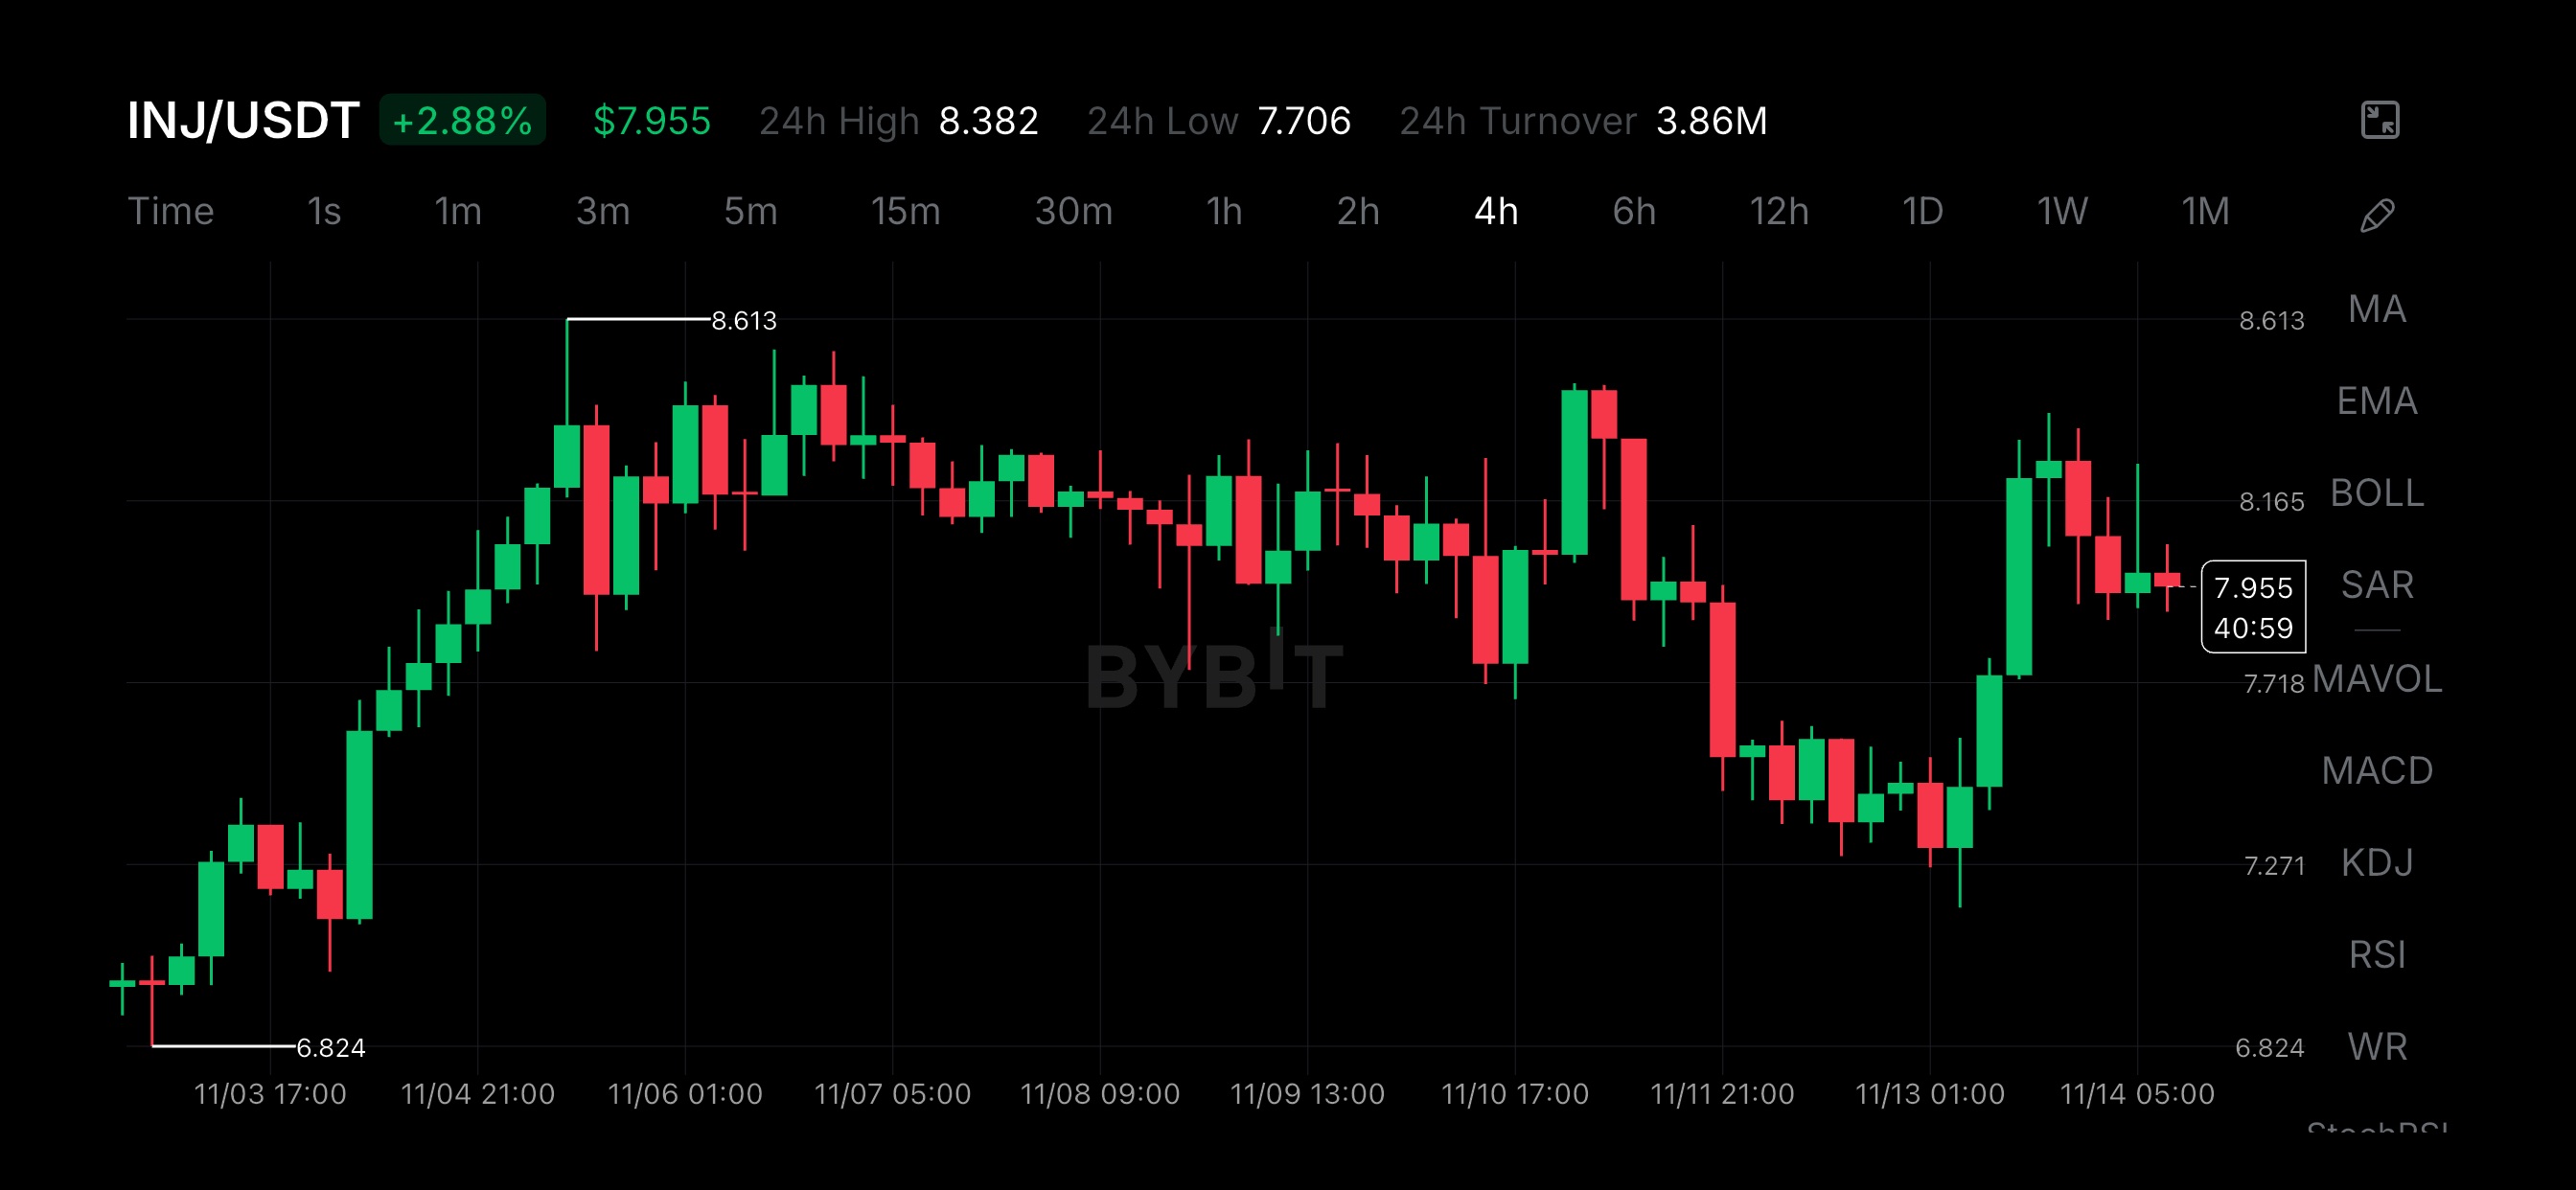
$INJUSDT — My next long setup begins with a pullback, not chasing another green candle. INJ has climbed +2.88% to $7.955 with 3.86M in 24 hour turnover, rebounding off its $7.706 24-hour low toward a $8.382 high. That momentum is solid—especially when contrasted against smaller DeFi yield assets like $SLXUSDT, which has been struggling near multi-month lows around $0.034–$0.035 under persistent supply pressure. However, after a sharp bounce into the $8.165–$8.382 resistance zone, buying right into overhead supply risks stepping in exactly where earlier buyers lock in profits. I prefer letting the initial surge cool off to see if the market offers a cleaner retest. The structural zone between $7.271 and $7.718 is where my plan becomes interesting. The $7.718 level acts as a key intermediate support shelf, sitting directly above the deeper $7.271 demand floor. I am watching for a controlled pullback into the $7.706–$7.718 area, a potential sweep of short-term lows, and a confirmed 4H higher low. If buyers defend that structure, my upside targets sit at $8.165 and the $8.382 24-hour high, followed by the $8.613 swing peak. A direct breakout above $8.382 is always possible, though I will not chase strength without confirmation. This is a conditional long plan, not an active entry trigger. I want clear bullish defense inside the $7.718 support zone before committing capital. A sustained breakdown below $7.271 (with wider structural invalidation at the $6.824 macro swing low) would cancel the setup. Any leveraged position requires a strict protective stop beneath the confirmed higher low and a risk-to-reward calculation anchored to the verified entry. After a strong bounce off the lows, the real test is whether INJ can carve out a higher low above $7.718 without giving back its gains. I also have a clean $PEPEUSDT breakdown lined up for a separate post if traders are interested. #ByXIMPACT
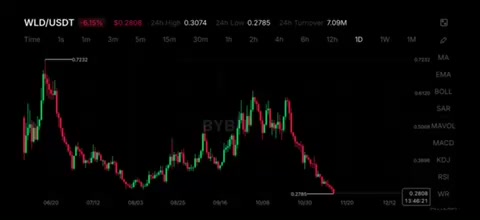
WLD: Is the Market Overlooking the Structure Behind the Breakdown? Most traders glance at $WLDUSDT and only see another steep red candle. Yet the multi-timeframe structure tells a much deeper story about how liquidity is being tested across both the 4H and daily charts. Look at the current chart numbers: • Trading around $0.2806 (-6.19%), pressing right into the $0.2785 24-hour low. • 24 hour range spanning from $0.2785 up to $0.3074. • $7.13M in 24 hour turnover volume backing the move. • Down sharply from its $0.6189 daily swing peak and $0.4439 4H breakdown high. These figures reveal something critical: Worldcoin has sliced straight through intermediate shelves at $0.3636 and $0.3198, landing directly on its August accumulation base. Just like Core $COREUSDT, which has faced steep multi-week downside pressure near $0.0115 despite ongoing BTCFi infrastructure development, WLD demonstrates a vital distinction investors cannot ignore: network narrative and user onboarding do not automatically prevent technical price distribution. The real test now is whether buyers can defend this $0.2785 floor and reclaim the $0.3074–$0.3198 resistance shelf to build sustainable demand. My question: Is $WLDUSDT finally exhausting sellers at its $0.2785 origin base or are we most likely to see another leg down forming beneath support? #IMPACTbyTrade
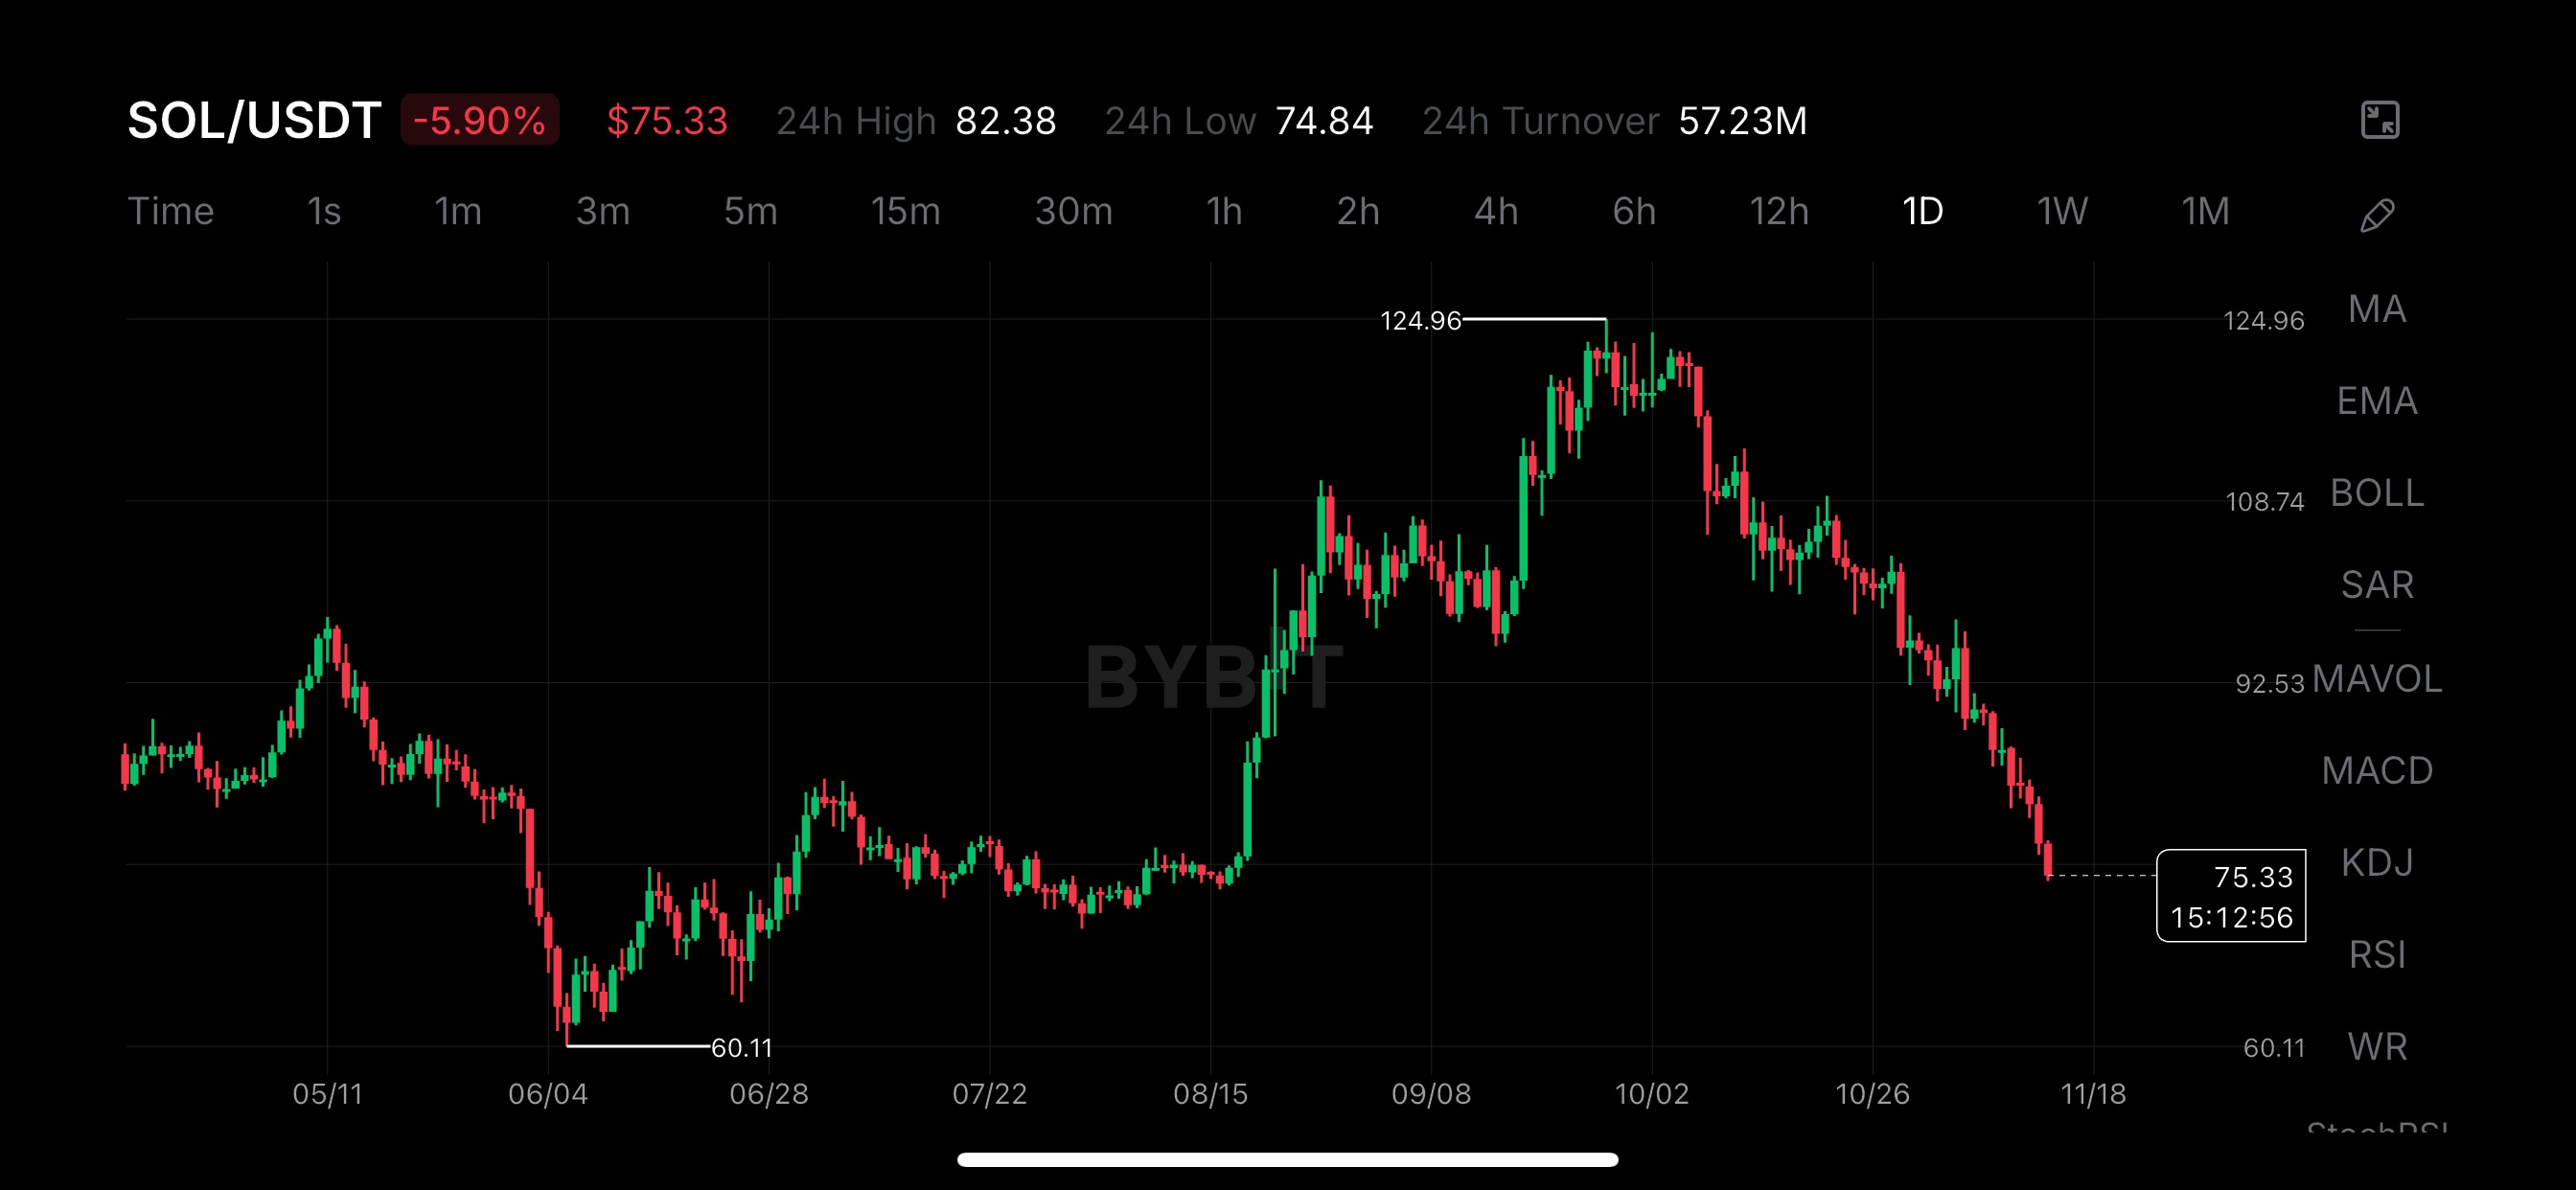
$SOLUSDT— A 44% recovery opportunity is on my chart, yet there is one critical reason I am not calling a bottom just yet. Solana has dropped roughly 40% from its $124.96 peak and the daily chart continues to print an aggressive sequence of lower highs and lower lows. That is the immediate bearish reality—especially as speculative liquidity rotates toward pockets of memecoin resilience like $PEPEUSDT (holding steady around $0.0000044–$0.0000045), leaving major Layer 1s under heavy distribution. However, an interesting structural test is unfolding near $75.33 (-5.90%). Price has pulled straight back into the $74.84–$76.00 breakout origin shelf, the exact accumulation zone that previously launched Solana's vertical expansion toward $124.96. With 57.23M in 24-hour turnover, the real question is not whether this level looks discounted—it is whether buyers can defend this floor and build a different market structure this time. What I Am Watching: The first sign of buyer absorption would be defending the $74.84 24H low and reclaiming the $82.38 24H high, followed by a clean higher low on the daily chart. If SOL can re-establish support above $92.53, I will be watching the $108.74 resistance zone next. A confirmed recovery through those levels brings a full retest of the $124.96 peak back into view. Until then, this remains an early counter-trend reversal idea inside a steep downtrend. Risk Management Planned Recovery Setup: Entry reference: $75.33 Stop-loss: $68.50 Target: $108.74 Potential upside: 44.35% Defined risk: 9.07% Risk-to-reward: 4.89:1 This is a planned reference setup, not an active entry trigger. Stepping in around support is an aggressive approach; waiting for a confirmed breakout above $82.38 would require recalculating risk-to-reward. A sustained daily close below the $74.84 demand shelf weakens this recovery thesis and opens the door toward the $60.11 macro swing low. Because volatility remains elevated, strict position sizing is non-negotiable. I am constructive on $SOLUSDT's longer term recovery potential, though buyers still have significant work to do before trend control shifts. Would you look for an early entry around this $74.84–$75.33 demand shelf? #ByXIMPACT