IMPACTbyTrade
Trading nyata. Wawasan nyata. DAMPAK lebih besar. Bagikan posisi, riwayat trading, dan analisis pasar Anda dengan Cashtag jika relevan. Wawasan orisinal dan interaksi yang tulus lebih penting daripada volume postingan. Kreator yang memenuhi syarat dapat bersaing untuk mendapatkan hadiah mingguan 100 USDT. Kelayakan, skor DAMPAK minimum, dan syarat acara berlaku.

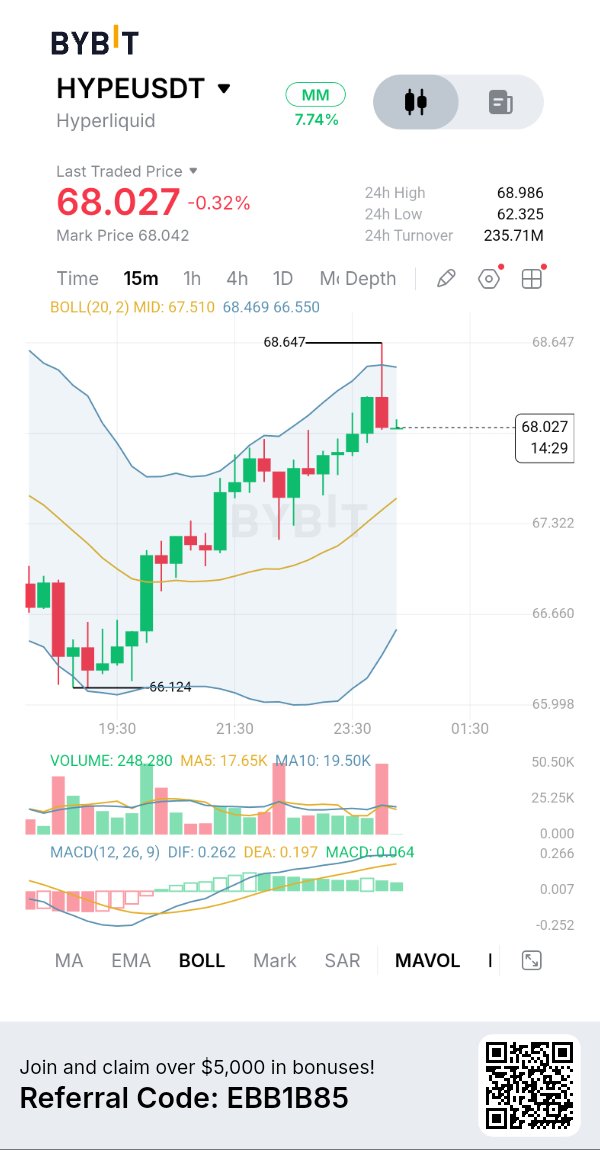
If you think $HYPEUSDT has permanently topped just because the rest of crypto is digital trash, take a hard look at its ever expanding fundamentals Why does this matter? Because Hyperliquid is a revenue machine where every dollar of collateral and every dollar of trading volume contributes to deflationary $HYPEUSDT buybacks More adoption → less circulating $HYPE overtime. Its that simple and no other asset has this. $TSLA ran hard off its early-November low, broke the prior swing high, and is now pulling back. I'm leaning long, but I'm not buying here. I want price to come down into a specific pullback zone first. Chasing the middle of a pullback is how you get a bad entry. The drop from the recent high looks like a retracement inside the up-leg, not a trend change. The 12h still prints higher lows. Why the zone matters: - The 4h, 12h and daily moving averages stack at the same level - The 62% retracement of the last up-leg lands there too - Recent equal lows sit just below it Four separate reasons on one shelf make a bounce there mean more. The ICT read: those equal lows hold a pool of stop orders. A sweep through them that snaps back into the discount zone is the setup I'd take. Targets are the liquidity resting above the recent swing highs. Where I'm wrong: if price gives up the 12h swing low, the daily 200-day average and the bottom of the optimal retracement band together, the pullback read is dead and I step aside. Risks: Nvidia earnings on Nov 18 and December rate-hike worries could shake AI and high-beta names. Thin weekend pricing means the Monday open can gap. Not investment advice. All decisions and responsibility are your own. $BTC has only been oversold on the weekly 4 times in it's entire history 📉 But, an oversold weekly RSI hasn't always marked the final bear-market bottom. 📉 2015: BTC bottomed 210 days later. 📉 2019: Oversold RSI coincided with the bottom. 📉 2022: BTC bottomed 147 days later. 2026: Already 280 days since the initial oversold signal, with a definitive bottom still to be confirmed. When BTC first became oversold this cycle, it was trading around $60,000. Yesterday's flush saw BTC trade as low as $62,000, meaning price has spent 280 days without establishing a sustained recovery. This is the longest period between an initial weekly oversold RSI signal and a confirmed cycle bottom among the historical examples examined. Only in 2019 did the oversold RSI coincide with the final bottom. The other examples tell us, an oversold weekly RSI doesn't guarantee an immediate reversal. Historically, it has often been followed by months of further consolidation or downside before a definitive bottom forms. #IMPACTbyTrade

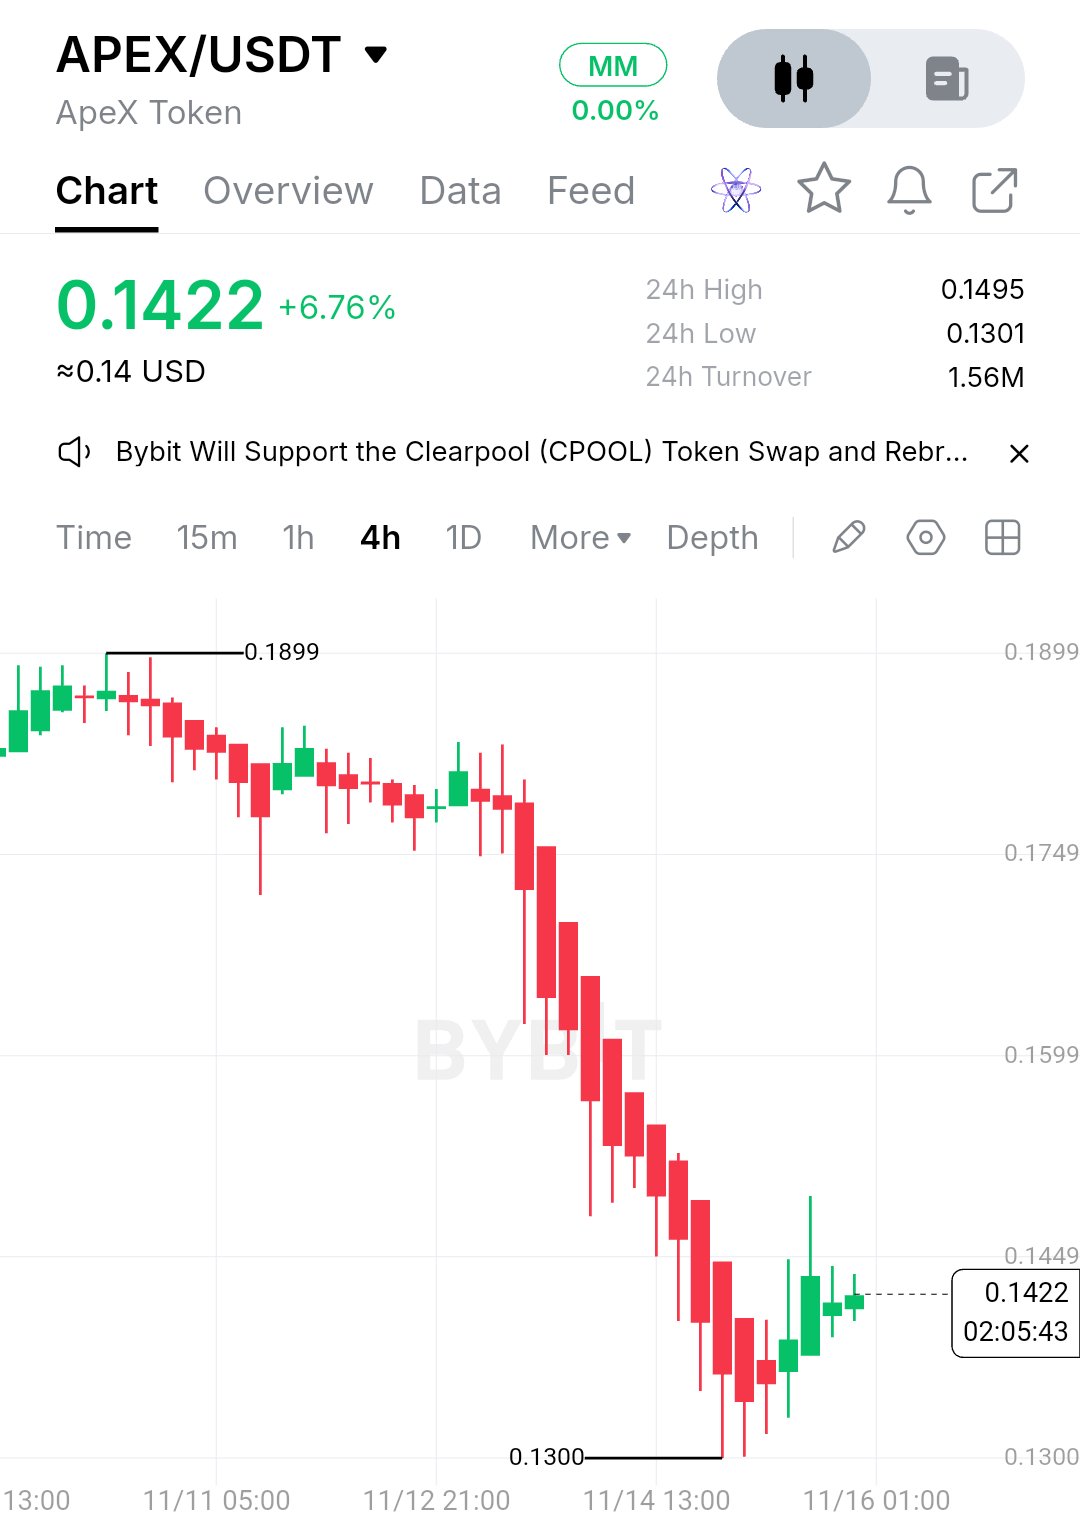
$APEXUSDT adalah token berbasis Ethereum, bukan blockchain mandiri, dan perbedaan itu penting saat melihat ekonominya. Tidak ada jumlah transaksi jaringan APEX asli, ukuran transaksi median, pendapatan biaya penambang, atau angka hashrate untuk dibandingkan dengan imbalan blok. Jadi penggunaan pembayaran bukanlah cara yang tepat untuk mengukur aset ini. APEX terikat pada Protokol ApeX, ekosistem perdagangan derivatif terdesentralisasi. APEX memiliki utilitas staking, tata kelola, dan insentif protokol, dan itulah intinya. Pemegang token bisa mendapatkan imbalan APEX, tetapi pendapatan validator, imbal hasil staking, dan rasio biaya-ke-imbalan saat ini tidak ditetapkan secara independen oleh data yang tersedia. Tidak ada halving penambangan APEX atau pengurangan imbalan blok asli untuk diperhitungkan dalam harga. Saya tidak berpikir itu adalah cacat desain. Ketika seseorang mengutip jumlah transaksi, angka yang penting untuk token ini berbeda: aktivitas protokol yang sebenarnya, pembuatan biaya, dan apakah aktivitas tersebut menciptakan permintaan yang berkelanjutan untuk APEX. Data pasar terbaru yang tersedia menunjukkan APEX sekitar $0,1422, naik sekitar 6,8% dalam 24 jam tetapi masih turun 22,6% selama tujuh hari. Grafik 4H menunjukkan aksi jual tajam dari area $0,18 menuju $0,1300, diikuti oleh pemulihan. Di bawahnya ada ekspansi ApeX Omni ke pasar perpetual, termasuk kripto, saham AS, dan pasar prediksi. ApeX juga dilaporkan telah mencatat $11,661 miliar dalam volume perdagangan 30 hari dalam perbandingan pasar DEX 22 Oktober. Itu menjelaskan perhatiannya, bukan katalis harga token yang dijamin. Tidak ada panggilan arah dari tengah kotak setelah pergerakan sebesar ini. Sebaliknya, level-levelnya: Di atas $0,1495: penutupan harian di atasnya mengubah langit-langit baru-baru ini menjadi uji dukungan. Area resistensi utama berikutnya adalah sekitar $0,1599–$0,1749. Di bawah $0,1300: penutupan harian di bawahnya menyatakan pemulihan gagal. Area penurunan berikutnya memerlukan penemuan harga baru. $0,1300–$0,1495: kisaran langsung, sekitar 15% lebar. Jendela: beberapa penutupan harian berikutnya. APEX membutuhkan aktivitas protokol yang berkelanjutan dan tekanan beli yang lebih kuat untuk mendukung pemulihan. Kasus breakout tidak valid jika diterima di bawah $0,1300. #IMPACTbyTrade

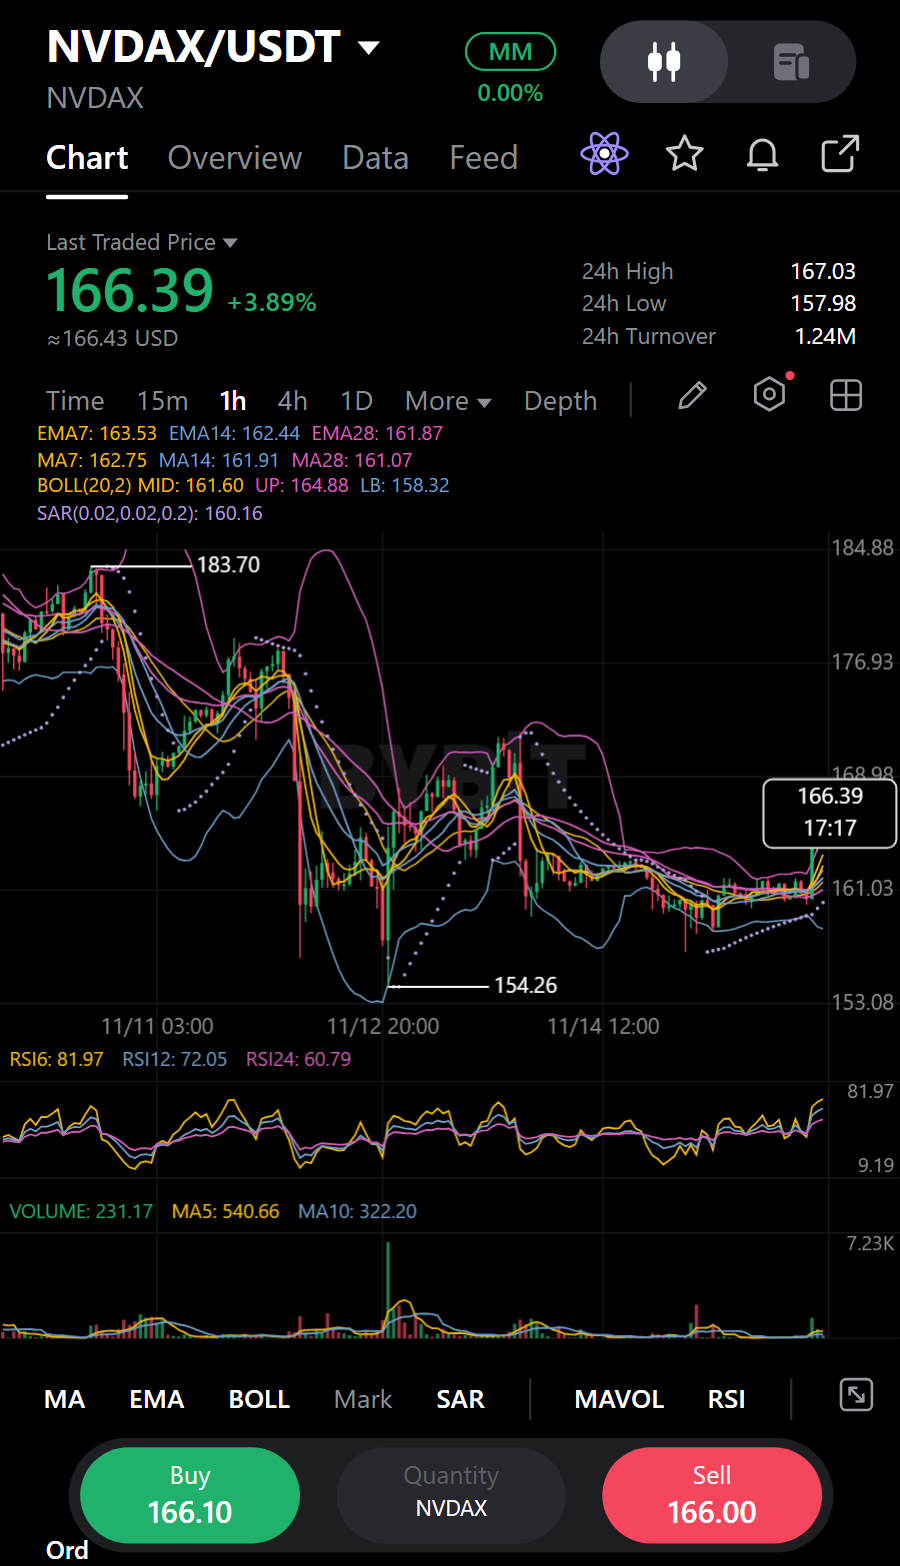
NVDAXUSDT: Pembeli Harus Mempertahankan Reclaim
Lonjakan hijau tajam per jam telah membuat $NVDAXUSDT kembali ke atas klaster moving-average-nya. Candle merah pukul 01:00 ditutup di 160,39; kemudian candle pukul 02:00 melonjak dari 160,39 ke 166,52 sebelum ditutup di 164,04. Candle hijau pukul 03:00 melanjutkannya dengan penutupan di 165,4. Itu terlihat seperti pembeli yang masuk dengan kuat dan terus menekan alih-alih melepaskan seluruh pergerakan tersebut. Harga sekarang berada di atas MA7, MA14, dan MA28, yang mendukung skenario bullish, meskipun rata-rata tersebut masih berdekatan dan belum terpaut jauh. Pergerakan 24 jam bersifat positif, dan volume telah meningkat dari hari sebelumnya, menambah partisipasi pada dorongan tersebut. Saya menyukai latar belakang itu, tetapi candle-candle kecil sebelumnya memiliki aktivitas yang ringan, jadi saya ingin breakout ini membuktikan bahwa ia bisa bertahan. Setup long saya adalah melihat harga bertahan atau melakukan retest di Entry Zone pada 165,8575 - 166,7625; saya memegang spot NVDAX, sementara kartu kepemilikan native memuat detail posisinya. Pergerakan di bawah Stop Loss pada 163,595 akan membatalkan percobaan ini. TP1 adalah 168,5725 dan TP2 adalah 170,835, dengan rasio risk-to-reward masing-masing sekitar 0,8 banding 1 dan 1,7 banding 1 dari tengah zona tersebut. Saya mendukung bulls selama harga tetap di atas level pembatalan dan pembeli mempertahankan retest; kehilangan level itu akan mengubah pandangan saya, bukan hanya membuat setup terlihat kurang rapi. Lonjakan ini juga meningkatkan risiko volatilitas, jadi saya akan berhati-hati dengan eksekusi di order book yang tipis dan tidak akan berasumsi dorongan pertama akan terus berlanjut. Rencana Trading (LONG / Bullish): • Support: 157,98 / 154,26 | Resistance: 167,03 / 178,7 • Entry Zone: 165,8575 - 166,7625 • Stop Loss (SL): 163,595 • Target: TP1 168,5725 | TP2 170,835 Apakah Anda akan mempercayai breakout bervolume tinggi ini, atau menunggu hold yang lebih bersih di entry zone? Hanya analisis saya, bukan saran.#IMPACTbyTrade


BARD diperdagangkan di kisaran $0,1038 setelah turun lebih dari 14% dalam 24 jam, dengan rentang harga $0,0996–$0,1274. Harga kembali mendekati level terendah sesi, dan pembeli harus mempertahankan level $0,100 sebelum rilis suplai pada 18 November. Ringkasan Pasar Snapshot terbaru CoinGlass menempatkan kapitalisasi pasar di angka $41,69 juta dan valuasi terdilusi penuh di sekitar $103,8 juta. Suplai beredar diperkirakan sebanyak 396,56 juta terhadap batas maksimum tetap 1 miliar. Volume spot sekitar $14,06 juta, sementara perputaran futures mencapai $109,48 juta, hampir 7,8 kali lipat dari aktivitas spot. Derivatif mendorong sebagian besar pergerakan jangka pendek sementara likuiditas spot lebih tipis. Rebound yang dipimpin terutama oleh kontrak perpetual bisa memudar jika pembeli spot tidak kembali. BARD juga berada sekitar 94% di bawah level tertinggi Maret 2026 di $1,716, yang membuat tren yang lebih luas sangat terpukul. Derivatif dan Posisi Open interest agregat berada di sekitar $19,53 juta, turun 25,16% dalam 24 jam. Funding rate sangat negatif di dekat -0,2183%, yang berarti posisi short membayar posisi long. Likuidasi mencapai total sekitar $334.600, termasuk sekitar $251.400 dari posisi long. Arus spot negatif sekitar $1,2 juta, sementara arus futures menunjukkan outflow sekitar $3,7 juta. Snapshot perpetual BARDUSDT Bybit menunjukkan harga di dekat $0,1042, OI sekitar $4,77 juta, turun 26,2%, dan funding di dekat -0,0937% per empat jam. Funding rate berbeda di setiap bursa, jadi gunakan feed langsung Bybit untuk eksekusi alih-alih menganggap tingkat agregat sebagai pembacaan kontrak yang tepat. Posisi long telah terpaksa keluar dan posisi short menjadi mahal. Hal itu dapat menciptakan potensi squeeze, tetapi penurunan OI dan arus spot negatif tidak mengonfirmasi akumulasi baru. Struktur Teknis Zona pertahanan langsung adalah $0,1000–$0,0996. CoinGlass juga mengidentifikasi dinding beli (buy wall) futures di dekat $0,1000. Jika level ini bertahan dan harga merebut kembali $0,1070, tanda pertama stabilisasi akan muncul. Di atas itu, $0,1100 dan $0,1139 adalah area resistensi berikutnya. Jika $0,0996 tembus secara meyakinkan, perhatikan $0,0964, diikuti oleh $0,0930. Pemulihan cepat di atas $0,1000 setelah wick (ekor candle) akan melemahkan sinyal bearish; penutupan berulang di bawah level itu akan membuat penjual tetap memegang kendali. Gambaran Fundamental Lombard sedang membangun infrastruktur keuangan on-chain yang berfokus pada Bitcoin. Produk unggulannya, LBTC, adalah aset Bitcoin likuid yang dirancang untuk memungkinkan pemegang mengakses DeFi tanpa menjual BTC. Tujuannya adalah menjadikan Bitcoin sebagai agunan produktif melalui integrasi DeFi. LBTC adalah aset yang terhubung dengan Bitcoin; BARD adalah token tata kelola yang terpisah. BARD tidak didukung oleh Bitcoin dan tidak mewakili kepemilikan atas cadangan BTC. Strategi imbal hasil (yield) LBTC Lombard telah berkembang: dokumentasi resmi menjelaskan strategi covered-call yang menghasilkan premi opsi, daripada mengandalkan model staking Bitcoin sebelumnya. Imbal hasil bersifat variabel, tidak dijamin. Tesis ini bergantung pada adopsi LBTC, likuiditas, dan biaya protokol. TVL saja tidak cukup: pertumbuhan produk tidak secara otomatis menciptakan permintaan untuk BARD. Utilitas dan Tokenomics Token BARD adalah token tata kelola Lombard, dengan utilitas yang dimaksudkan untuk berkembang seiring dengan pengembangan protokol. Program staking sebelumnya telah dihentikan, dan klaim airdrop telah berakhir. Memegang BARD tidak secara otomatis menghasilkan imbal hasil atau bagian dari pendapatan protokol. Alokasi resmi adalah 35% ekosistem, 25% kontributor inti, 20% yayasan, dan 20% investor awal. Suplai maksimum ditetapkan pada 1 miliar, dengan sisa token dijadwalkan untuk terbuka secara bertahap selama 48 bulan setelah peluncuran. Oleh karena itu, waktu rilis suplai penting bagi kapitalisasi pasar yang relatif kecil ini. Risiko Unlock Mendatang Tokenomics.com mencantumkan rilis berikutnya pada 18 November: sekitar 22,81 juta BARD, setara dengan 2,3% dari total suplai dan sekitar 5,6% dari kapitalisasi pasar saat ini pada valuasi yang tercantum. Penerima termasuk pihak internal, komunitas, investor swasta, dan yayasan. Hal ini tidak menjamin adanya aksi jual, tetapi menciptakan bayang-bayang kelebihan suplai (supply overhang) dalam jangka pendek. Skenario Trading Bullish: pertahankan $0,0996–$0,1000, rebut kembali $0,1070, dan tembus $0,1139 dengan perputaran spot yang lebih kuat. Funding rate yang sangat negatif dapat memicu pergerakan short-covering, dengan $0,1200 sebagai referensi berikutnya. Bearish: kehilangan $0,0996 dan gagal merebutnya kembali. Hal itu mengekspos level $0,0964, lalu $0,0930. Berlanjutnya arus keluar spot menuju waktu unlock dapat merusak pantulan harga yang dipimpin futures. Berikut adalah peta level yang saya pantau: - Support langsung: $0,1000–$0,0996 - Resistensi: $0,1070, kemudian $0,1100–$0,1139 - Konfirmasi bullish: penembusan berkelanjutan di atas $0,1139 dengan volume spot yang meningkat - Sinyal bearish: breakdown di bawah $0,0996 dan gagal merebut kembali Sikap saya defensif, tetapi potensi squeeze tetap ada. Funding rate negatif cukup ekstrem dan OI telah berkontraksi tajam, namun arus spot tetap lemah dan unlock 18 November sudah dekat. Saya ingin level $0,100 bertahan dan pembeli merebut kembali $0,107 sebelum mempertimbangkan trading pemulihan. Apakah Anda berani mengambil risiko masuk lebih awal di dekat support, atau menunggu sampai setelah unlock untuk konfirmasi?$BARDUSDT #IMPACTbyTrade

$XRPUSDT Apakah Ini Kesempatan Membeli atau Tanda Peringatan? XRP telah mengalami tekanan jual yang signifikan, sehingga konfirmasi pasar menjadi sangat penting. Saya sedang memantau: Apakah XRP dapat mempertahankan level terendah barunya. Apakah pembeli kembali dengan volume yang lebih kuat. Apakah pasar kripto secara keseluruhan mulai pulih. Mencoba menangkap pasar yang sedang jatuh tanpa konfirmasi bisa berisiko. Trader yang cerdas memperhatikan aksi harga alih-alih mengikuti emosi. Para pemegang XRP, apakah Anda tetap bersabar atau menunggu sinyal pemulihan yang lebih kuat? #IMPACTbyTrade

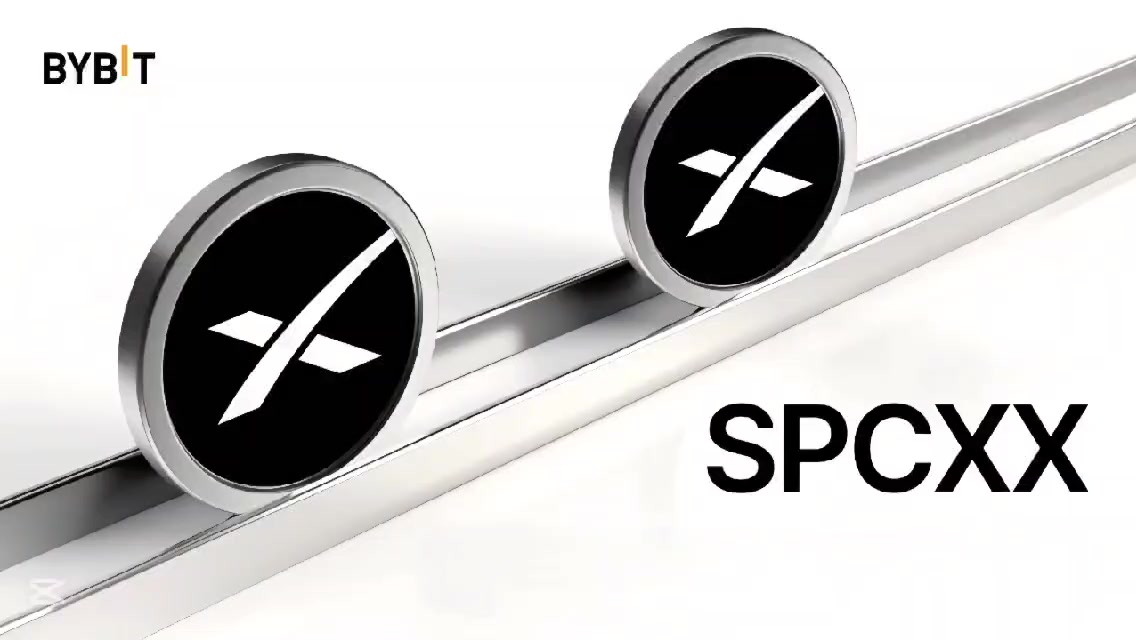
🚀 Grafik xStock SpaceX memberikan sinyal yang campur aduk sebelum berita utama muncul, ada sesuatu yang penting terjadi pada grafik harian $SPCXXUSDT selama koreksi baru-baru ini. Setelah penurunan tajam dari level tertinggi 167,05, harga menemukan dasar yang kuat di 120,55 pemulihan dari level terendah itu cukup agresif, tetapi terhenti tepat di tempat yang disarankan oleh teknikal, yaitu pada ekstensi Fibonacci 1,0 di 135,35 dan level 1,618 di 138,61 EMA50 berada lebih tinggi di 144,05, masih bertindak sebagai batas atas grafik menangkap harga di dekat 139,13, dengan candle harian yang masih terbuka dan RSI pulih ke level pertengahan 50-an Namun cerita sebenarnya ada di peta likuiditas (liquidity map) Peta panas likuidasi Coinglass untuk SPCXX menunjukkan dua kluster leverage masif tepat di atas harga saat ini Ada konsentrasi likuiditas yang berat di 140, dan pita padat lainnya tepat di bawahnya di 138, ini adalah zona di mana posisi leverage bertumpuk, dan mereka bertindak sebagai magnet bagi pergerakan harga Ketika harga mendekati kluster seperti ini, pasar sering memburu likuiditas tersebut, menyapu stop-loss dan memaksa likuidasi sebelum memutuskan arah yang sebenarnya Berita utama baru-baru ini menambah konteks pada volatilitas. SpaceX sedang menghadapi gelombang unlock saham orang dalam, termasuk rilis 59,1 juta saham dan unlock 319 juta saham yang lebih besar yang baru saja masuk ke pasar perusahaan juga meluncurkan misi keamanan nasional rahasia untuk Angkatan Luar Angkasa AS, yang menambah noise fundamental pada pergerakan harga Tapi inilah yang paling menarik minat saya 🤔 penolakan grafik di zona 138-140 dan peta panas likuidasi sudah menceritakan kisah yang sama bahkan sebelum berita unlock dirilis Itulah mengapa selalu pelajari struktur harga dan pemosisian secara bersamaan, price action mengungkapkan di mana pembeli kehilangan kendali, dan peta panas mengungkapkan di mana pasar paling rentan grafik tidak bisa memprediksi peristiwa spesifik, tetapi mereka bisa memperingatkan kita ketika leverage ditumpuk sedemikian rupa sehingga pergerakan kekerasan kemungkinan besar akan terjadi Perspektif Trading hari ini SPCXX sekarang terjebak di antara dua kekuatan. Peta panas menunjukkan bahwa jika harga bisa menembus 140 dan bertahan di atasnya, likuiditas di atas bisa memicu short squeeze menuju EMA50 di 144,05 dan ekstensi fibonacci 2,618 di 143,88 Tapi peluang yang lebih besar terletak di level yang lebih rendah 🙂↕️ Jika support 138 gagal dan kluster likuiditas yang lebih rendah di peta panas tersapu, saya melihat jalur yang jelas kembali ke zona 134-135, dan pada akhirnya ke blok permintaan utama di 120,55 jika aksi jual semakin cepat di situlah saya akan menjadi sangat tertarik pada potensi setup long Saya tidak berencana untuk membeli hanya karena harga mencapai kotak saya saya ingin melihat reaksi bullish yang bermakna, perubahan struktur pasar, dan bukti bahwa pembeli dapat mempertahankan level terendah yang lebih tinggi (higher low) yang baru hanya dengan begitu saya akan mempertimbangkan untuk melakukan posisi demi pemulihan menuju wilayah 153-167, dengan kemungkinan adanya level tertinggi baru di atas area tersebut jika katalis fundamental selaras Manajemen Risiko ⚡️ Saya belum memiliki konfirmasi entry long. Stop-loss dan rasio risk-to-reward saya akan bergantung pada konfirmasi bullish yang sebenarnya dan harga entry penurunan berkelanjutan di bawah 134,75 tanpa pemulihan yang meyakinkan akan membatalkan setup bullish saya yang diusulkan, dan saya akan menepi daripada memaksakan trading Penting juga untuk diingat bahwa SPCXX adalah derivatif yang ditokenisasi (tokenized derivative), bukan ekuitas SpaceX yang sebenarnya. Ini menawarkan eksposur harga 24/7 tetapi tidak memberikan hak pemegang saham atau dividen, jadi entry harus memperhitungkan likuiditas token itu sendiri dan spread yang lebih lebar yang muncul bersamaan dengan ketidakpastian makro saya bersedia melewatkan bagian pertama dari pemulihan daripada mengalokasikan modal sebelum kondisi saya terpenuhi. Kesabaran lebih penting daripada sekadar menangkap harga terendah yang tepat Update Cepat Nvidia 🖥 saya mempertahankan sikap hati-hati saya pada Nvidia $NVDAXUSDT mengingat risiko berita utama baru-baru ini Saham Nvidia sangat fluktuatif, dengan berita utama investigasi terkait CEO menyebabkan penurunan awal 8,8% ke 170,24 sebelum saham mengurangi kerugian untuk diperdagangkan di sekitar 179,35 pembeli ritel masuk secara agresif, dengan laporan pembelian bersih sebesar $111 juta dalam 30 menit pertama sesi, yang menunjukkan bahwa masih ada minat beli saat harga turun (dip-buying) yang kuat saya bullish pada potensi AI jangka panjang Nvidia, tetapi saya tidak akan mengacaukan cerita bisnis yang menjanjikan dengan entry trading yang terkonfirmasi saham tetap oversold pada beberapa metrik, dan relief rally mungkin saja terjadi, tetapi bayang-bayang berita utama berarti strukturnya masih rapuh untuk saat ini, saya menunggu struktur harga yang lebih kuat sebelum mengambil posisi baru peluang tidak hilang hanya karena saya memilih untuk menunggu konfirmasi 😏 #IMPACTbyTrade #Jensen Huang Mundur Menguji Kepemimpinan AI Nvidia

xmlmusdt
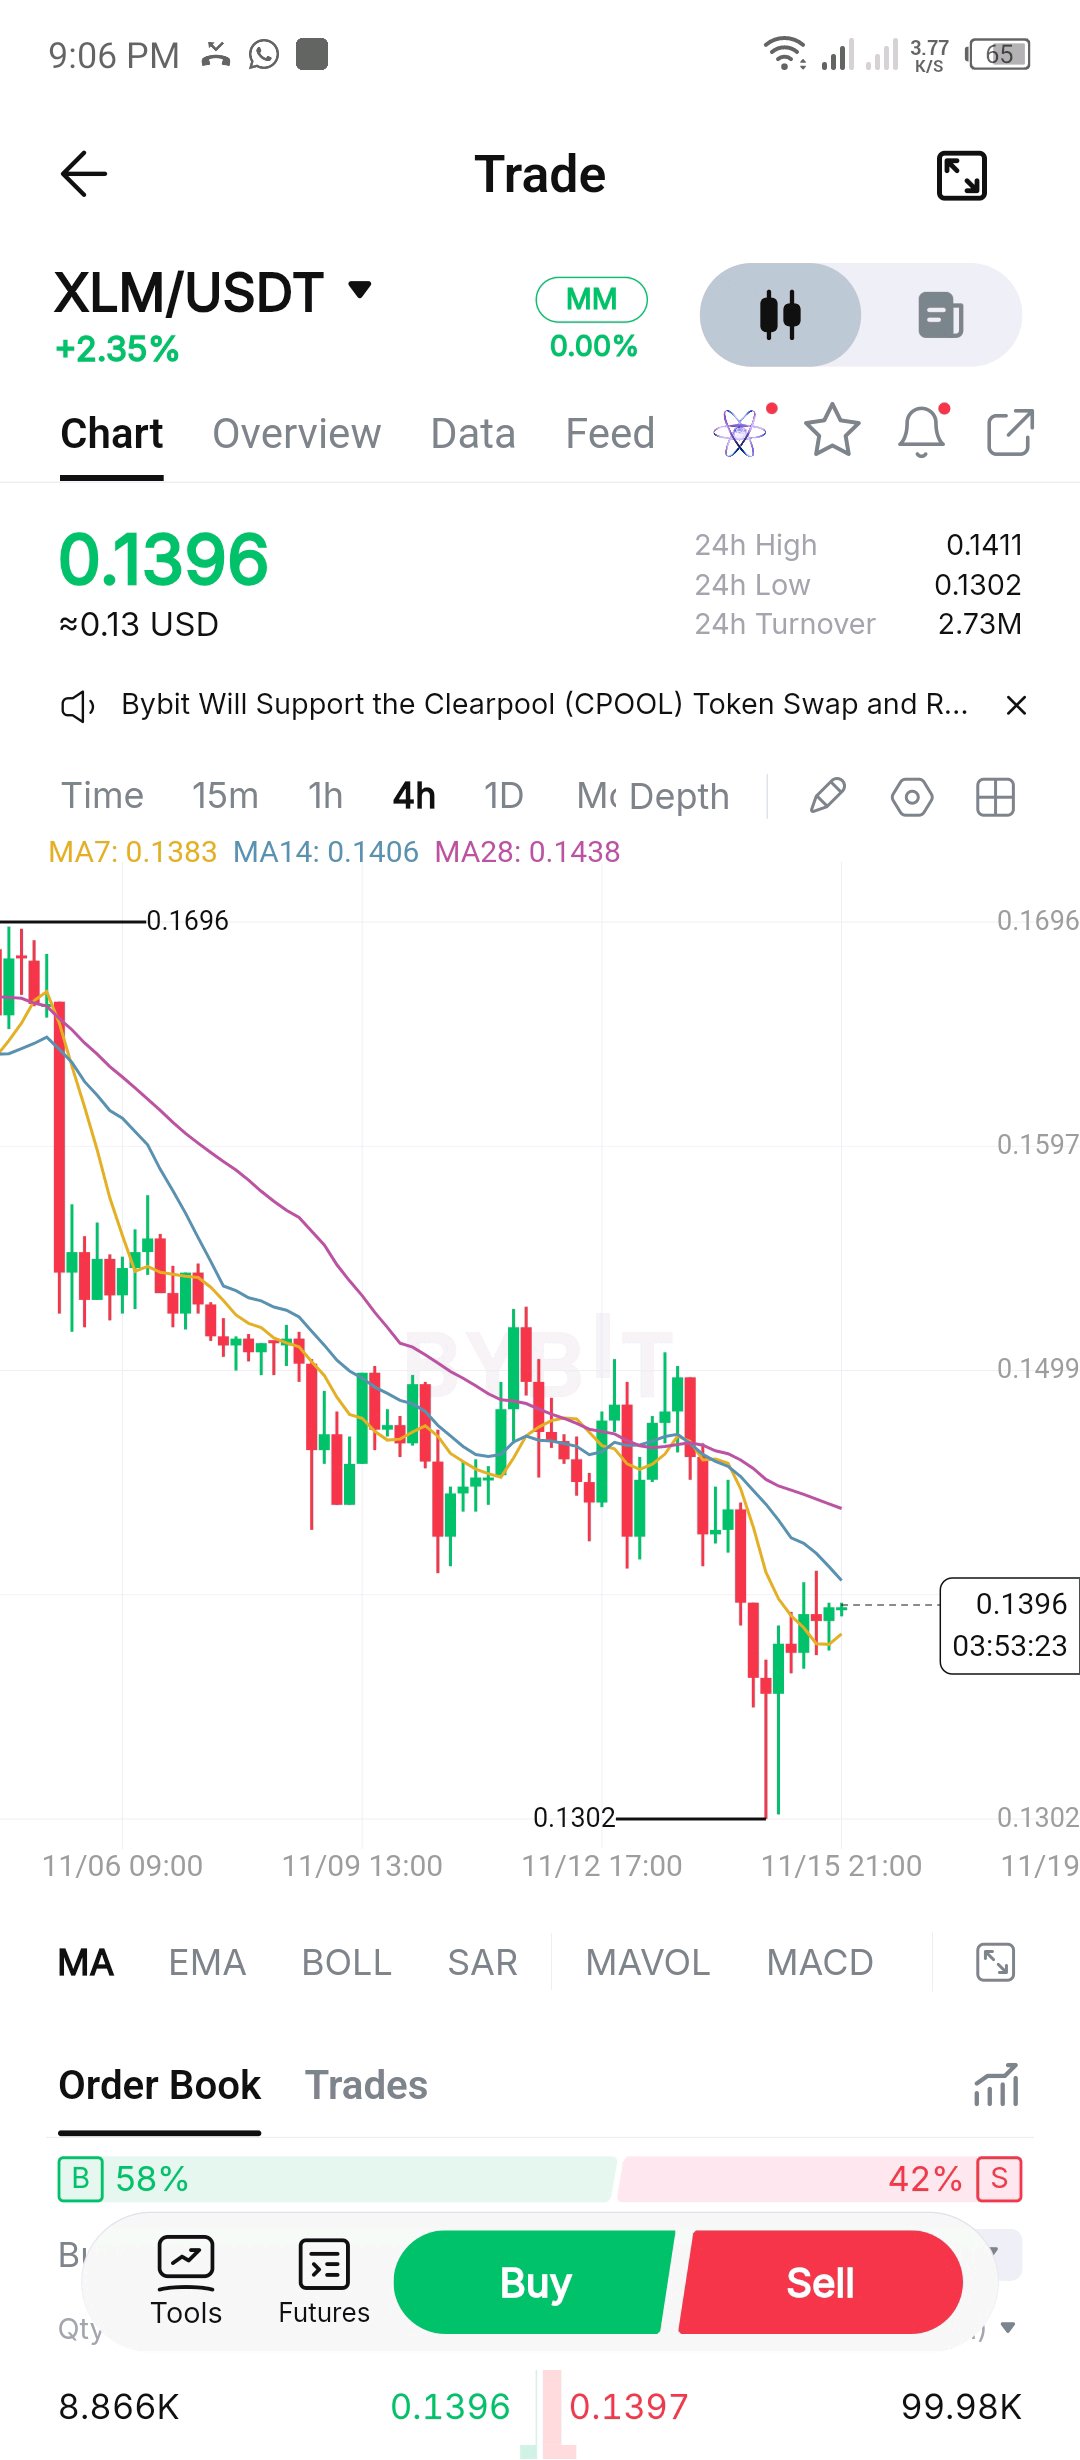
$XLMUSDT $XLMUSDT Technical Analysis Timeframe: 4H Current Price: $0.1396 24H Change: +2.35% 1. Market Trend The overall trend is still BEARISH (DOWN). MA7: 0.1383 MA14: 0.1406 MA28: 0.1438 The price is above MA7 but below MA14 and MA28. This suggests a short-term recovery inside a larger downtrend. 2. Support Levels $0.1380 – Immediate support $0.1350 – Secondary support $0.1302 – Major support 3. Resistance Levels $0.1406 – First resistance $0.1438 – Strong resistance $0.1499 – Major resistance 4. Possible Market Direction Bullish scenario: If XLM breaks and closes a 4H candle above $0.1406, it could move towards $0.1438. Bearish scenario: If price gets rejected around $0.1406, it could fall towards $0.1380 and $0.1350. 5. My Trading Bias SHORT-TERM: Slightly bullish recovery. OVERALL: Bearish. My preference is to wait for confirmation before entering a trade. Avoid rushing into BUY or SELL. A breakout confirmation is important. Verdict: DOWN bias until XLM breaks above $0.1438 convincingly. #IMPACTbyTrade

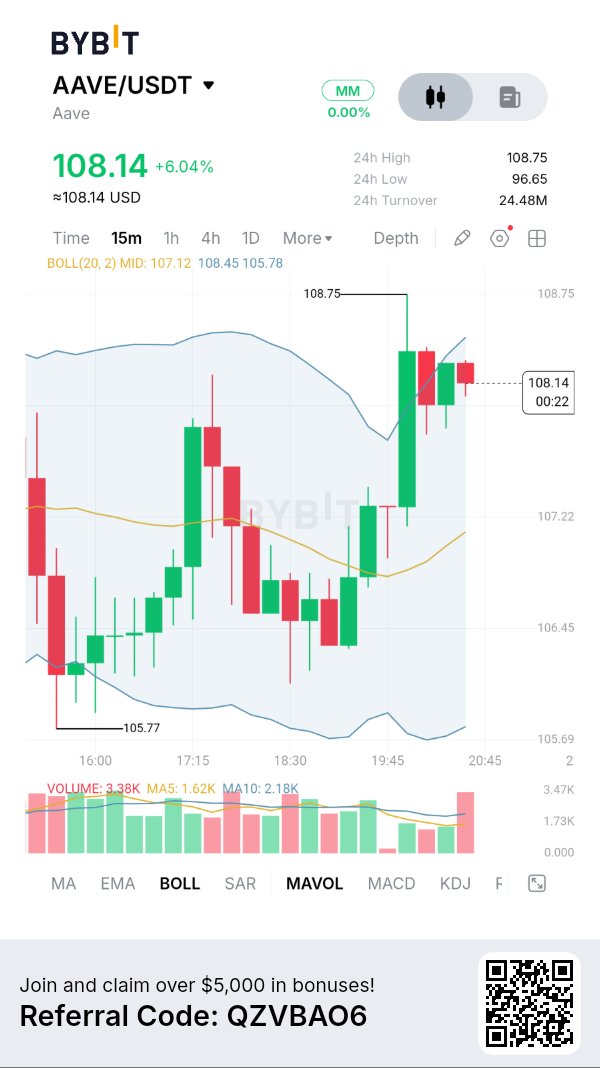
AAVE ($AAVE): Pembeli Mendorong Harga di Atas $108 seiring Meningkatnya Momentum Pemulihan ANALISIS FUNDAMENTAL Aave tetap menjadi salah satu protokol peminjaman terdesentralisasi terkemuka, yang memungkinkan pengguna untuk menyediakan aset, mendapatkan bunga, dan meminjam dengan jaminan kripto. Perkembangan besar terbarunya adalah Aave V4, yang memperkenalkan arsitektur Hub-and-Spoke yang dirancang untuk meningkatkan manajemen likuiditas, efisiensi modal, dan isolasi risiko. Pembaruan pengembangan Aave bulan Oktober melaporkan bahwa simpanan V4 melampaui $1,5 miliar, sementara protokol yang lebih luas mencapai volume pinjaman kumulatif sebesar $1,1 triliun. Pencapaian ini memperkuat posisi Aave di DeFi, meskipun pertumbuhan protokol tidak secara otomatis menjamin kenaikan harga token. TOKENOMIK AAVE memiliki pasokan maksimum 16 juta token. Utilitasnya mencakup tata kelola protokol dan partisipasi dalam Modul Keamanan (Safety Module). DAO juga mengoperasikan program pembelian kembali (buyback) yang didanai oleh pendapatan protokol, menciptakan potensi sumber permintaan pasar lainnya. Namun, program pembelian kembali, staking, dan pertumbuhan protokol harus dievaluasi bersamaan dengan pasokan yang beredar, likuiditas, dan kondisi pasar yang lebih luas. GRAFIK + INDIKATOR Berdasarkan grafik 15 menit Bybit yang diberikan: - Harga saat ini: $108,14 - Perubahan 24J: +6,04% - Tertinggi 24J: $108,75 - Terendah 24J: $96,65 - Turnover 24J: $24,48 juta - Garis tengah Bollinger: $107,12 - Pita atas: $108,45 - Pita bawah: $105,78 - Titik terendah grafik baru-baru ini: $105,77 $AAVEUSDT telah pulih dengan kuat dari $105,77 dan merebut kembali garis tengah Bollinger. Harga kini sedang menguji pita atas di sekitar $108,45. Volume berada di angka 3,38K, di atas MA5 sebesar 1,62K dan MA10 sebesar 2,18K. Hal ini menunjukkan partisipasi yang lebih kuat selama pemulihan baru-baru ini. Namun, harga sedang mendekati resistance, sehingga penolakan masih mungkin terjadi. SKENARIO BULLISH Pergerakan yang berkelanjutan di atas $108,45, diikuti dengan retest yang sukses, dapat membuka jalan menuju $108,75. Breakout yang meyakinkan di atas $108,75 akan memperkuat pemulihan dan berpotensi menarik pembeli tambahan. SKENARIO BEARISH Kegagalan untuk menembus Pita Bollinger atas dapat memicu pullback menuju $107,12. Kehilangan garis tengah akan melemahkan struktur bullish saat ini, sementara koreksi yang lebih dalam dapat mengekspos $105,78 kembali. RENCANA TRADING SAYA Saya akan menghindari mengejar candle hijau saat ini. Untuk entry bullish, saya menunggu konfirmasi breakout di atas $108,45, peningkatan volume, dan retest yang sukses. Jika harga tertolak, saya akan memantau bagaimana harganya bereaksi di sekitar $107,12 sebelum mempertimbangkan peluang lain. Ukuran posisi dan penempatan stop-loss harus mencerminkan volatilitas pasar. INTERPRETASI SAYA AAVE menunjukkan momentum pemulihan yang menggembirakan, didukung oleh volume yang lebih kuat dan pergerakan di atas garis tengah Bollinger. Fundamentalnya tetap menarik, terutama dengan ekspansi V4 dan meningkatnya aktivitas protokol. Namun, tantangan teknis langsungnya adalah apakah pembeli dapat mengatasi level $108,45 dan menetapkan penerimaan harga di atas $108,75. Apakah AAVE sedang bersiap untuk kenaikan lebih lanjut, atau pembeli sedang mendekati zona resistance di mana penjual dapat mengambil alih kendali? #IMPACTbyTrade


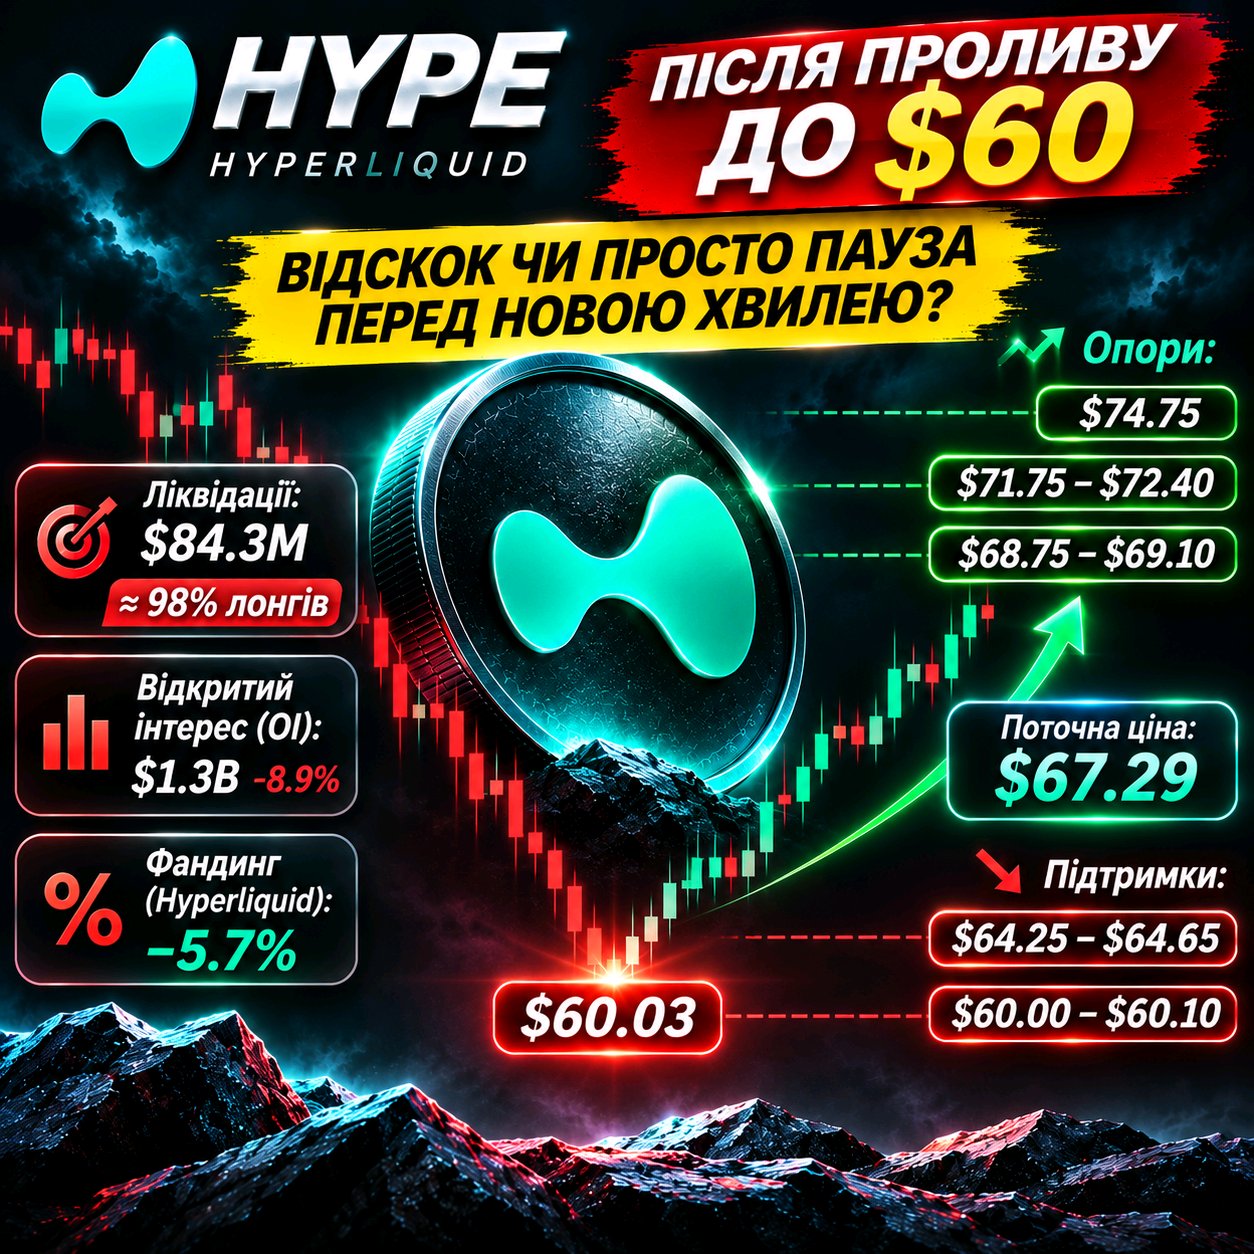
$HYPEUSDT memantul dari $60. Namun, apakah penjual benar-benar kehilangan kendali? Setelah penurunan tajam, HYPE menunjukkan reaksi pembeli yang kuat. Harga naik dari $60,03 ke area $67, tetapi saya belum terburu-buru menyebutnya sebagai pembalikan arah. Alasan kehati-hatian saya adalah struktur pasar. 98% LIKUIDASI TERJADI PADA POSISI LONG Berdasarkan data terakhir yang tersedia selama 24 jam, sekitar $84,3 juta posisi telah dilikuidasi di HYPE. Dari jumlah tersebut, sekitar $82,7 juta berasal dari posisi LONG. Ini adalah pembersihan besar-besaran bagi pembeli leverage yang mencoba mempertahankan pergerakan naik sebelumnya. Pada saat yang sama, open interest di Hyperliquid berkurang 8,9% menjadi sekitar $1,3 miliar. Bagi saya, ini adalah sinyal penting: sebagian modal spekulatif telah meninggalkan pasar. PENDANAAN (FUNDING) MENUNJUKKAN PERBEDAAN YANG MENARIK Di Hyperliquid, tingkat pendanaan (funding rate) berubah menjadi negatif, sementara di Binance dan Bybit tetap positif. Perbedaan ini menunjukkan bahwa posisi trader di berbagai bursa sangat berbeda. Pendanaan negatif dapat menciptakan kondisi untuk penutupan posisi SHORT, tetapi itu saja tidak menjamin kenaikan. DI MANA LIKUIDITAS TERKONSENTRASI SAAT INI? Saya menyoroti area berikut: - $68,75–69,10 — hambatan terdekat bagi pembeli. - $71,75–72,40 — zona resistensi penting dan potensi penutupan SHORT. - $74,75 — target pemulihan berikutnya. - $64,25–64,65 — klaster likuidasi LONG yang signifikan. - $60,00–60,10 — level terendah lokal dari aksi jual terakhir. Asimetri likuiditas sangat menarik: berdasarkan peta likuidasi yang tersedia, terdapat jauh lebih banyak potensi likuidasi LONG terkonsentrasi di bawah harga daripada posisi SHORT terdekat di atas. Ini berarti risiko penurunan kembali tetap ada. POSISI SAYA Saya melihat tanda-tanda stabilisasi awal, tetapi saya belum melihat pembalikan arah yang terkonfirmasi. Kembali ke atas $69 dengan pembentukan level terendah yang lebih tinggi (higher low) akan menjadi argumen pertama yang mendukung pembeli. Uji coba berikutnya adalah $72,40. Jika HYPE dapat bertahan di atas area ini, gambaran pasar akan menjadi jauh lebih menarik. Namun, jika harga kehilangan level $64,60, perhatian akan kembali beralih ke level terendah di $60. Hal yang paling menarik saat ini bukanlah pantulan HYPE itu sendiri, melainkan apakah pembeli dapat mempertahankannya setelah pasar melikuidasi sebagian besar posisi LONG ber-leverage. #IMPACTbyTrade $BTCUSDT
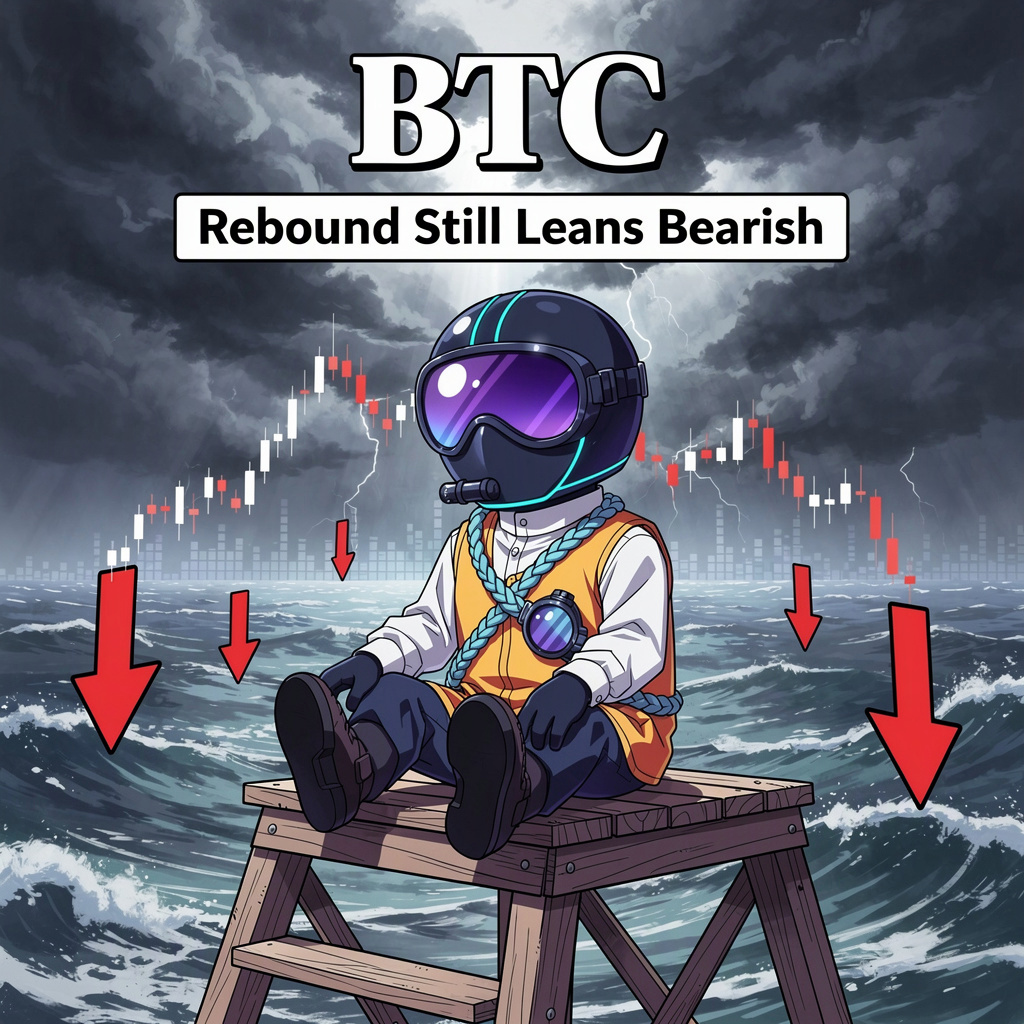
BTCUSDT: Rebound Masih Cenderung Bearish
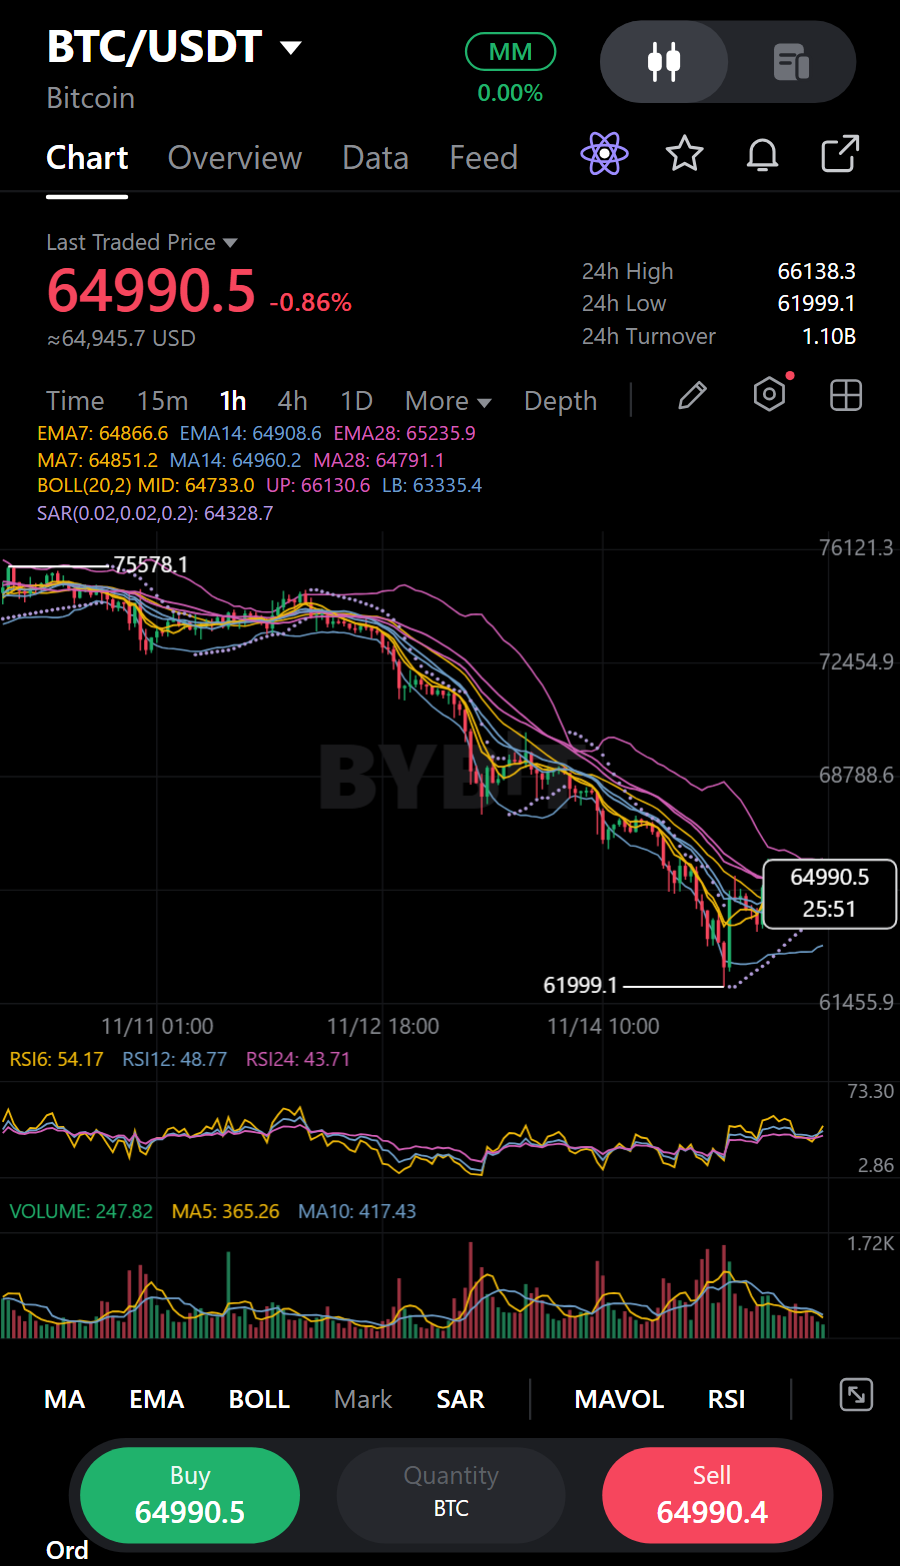
Candlestick hijau kecil adalah gangguan terbaru, bukan pembalikan: pada pukul 01:00 $BTCUSDT ditutup di 64.735,30 dengan volume hanya 0,6x rata-rata 12-candle. Sebelumnya, candle merah pukul 21:00 ditutup di 64.769,40, dan penutupan merah pada pukul 23:00 dan 00:00 membawa harga ke 64.704,60 dan 64.571,60. Urutan ini menunjukkan penjual menekan setelah rebound; kenaikan terakhir terlihat minim partisipasi. Harga terakhir diperdagangkan adalah 64.980,60, tepat di atas MA7 di 64.925,11, MA14 di 64.926,05, dan MA28 di 64.818,47. Itu memberikan pijakan bagi pembeli, tetapi rata-rata ini berdekatan dan tidak menghapus pelemahan per jam baru-baru ini. Seorang analis strategi telah menguraikan kemungkinan pemulihan Bitcoin pada tahun 2027, menghubungkan aksi jual dengan leverage dan mengidentifikasi level-level yang akan mendukung atau membatalkan pandangan tersebut. Saya melihat itu sebagai argumen tandingan berjangka panjang, bukan pemicu jangka pendek untuk BTCUSDT. Untuk setup ini, pembeli masih perlu menunjukkan kelanjutan tren di sekitar klaster moving average; satu candle hijau dengan volume rendah belum melakukan itu. Bukti pasar menjaga bias saya tetap bearish: BTCUSDT turun 1,03% dalam jendela ticker 24 jam, dan volume perdagangan sekitar 1,26x hari sebelumnya. Lebih banyak aktivitas seiring dengan penurunan tidak membuktikan penjual akan tetap memegang kendali, tetapi itu lebih sejalan dengan setup short daripada pemulihan yang terkonfirmasi. Saya ingin melihat candle per jam terbentuk di atas rata-rata sebelum mengubah penilaian tersebut. Untuk posisi short, saya akan mengamati area 64.773,64 - 65.187,56 untuk melihat apakah ada perlambatan, alih-alih mengejar pelemahan. Ide ini salah jika di atas Stop Loss 66.222,36. Dari titik tengah Zona Entry, TP1 di 63.945,80 memberikan rasio sekitar 0,8 banding 1, dan TP2 di 62.911,00 memberikan sekitar 1,7 banding 1. Target pertama menawarkan ruang terbatas relatif terhadap risikonya, jadi saya akan selektif; ayunan cepat dan sumbu hourly masih bisa menyapu entry atau stop sebelum arahnya jelas. Rencana Trading (SHORT / Bearish): • Support: 61.999,10 / 61.999,10 | Resistance: 66.138,30 / 74.822,90 • Zona Entry: 64.773,64 - 65.187,56 • Stop Loss (SL): 66.222,36 • Target: TP1 63.945,80 | TP2 62.911,00 Saat harga secara singkat merebut kembali moving average dengan volume rendah, apa yang akan meyakinkan Anda bahwa kenaikan tersebut nyata? Hanya pandangan saya, bukan saran finansial.#IMPACTbyTrade

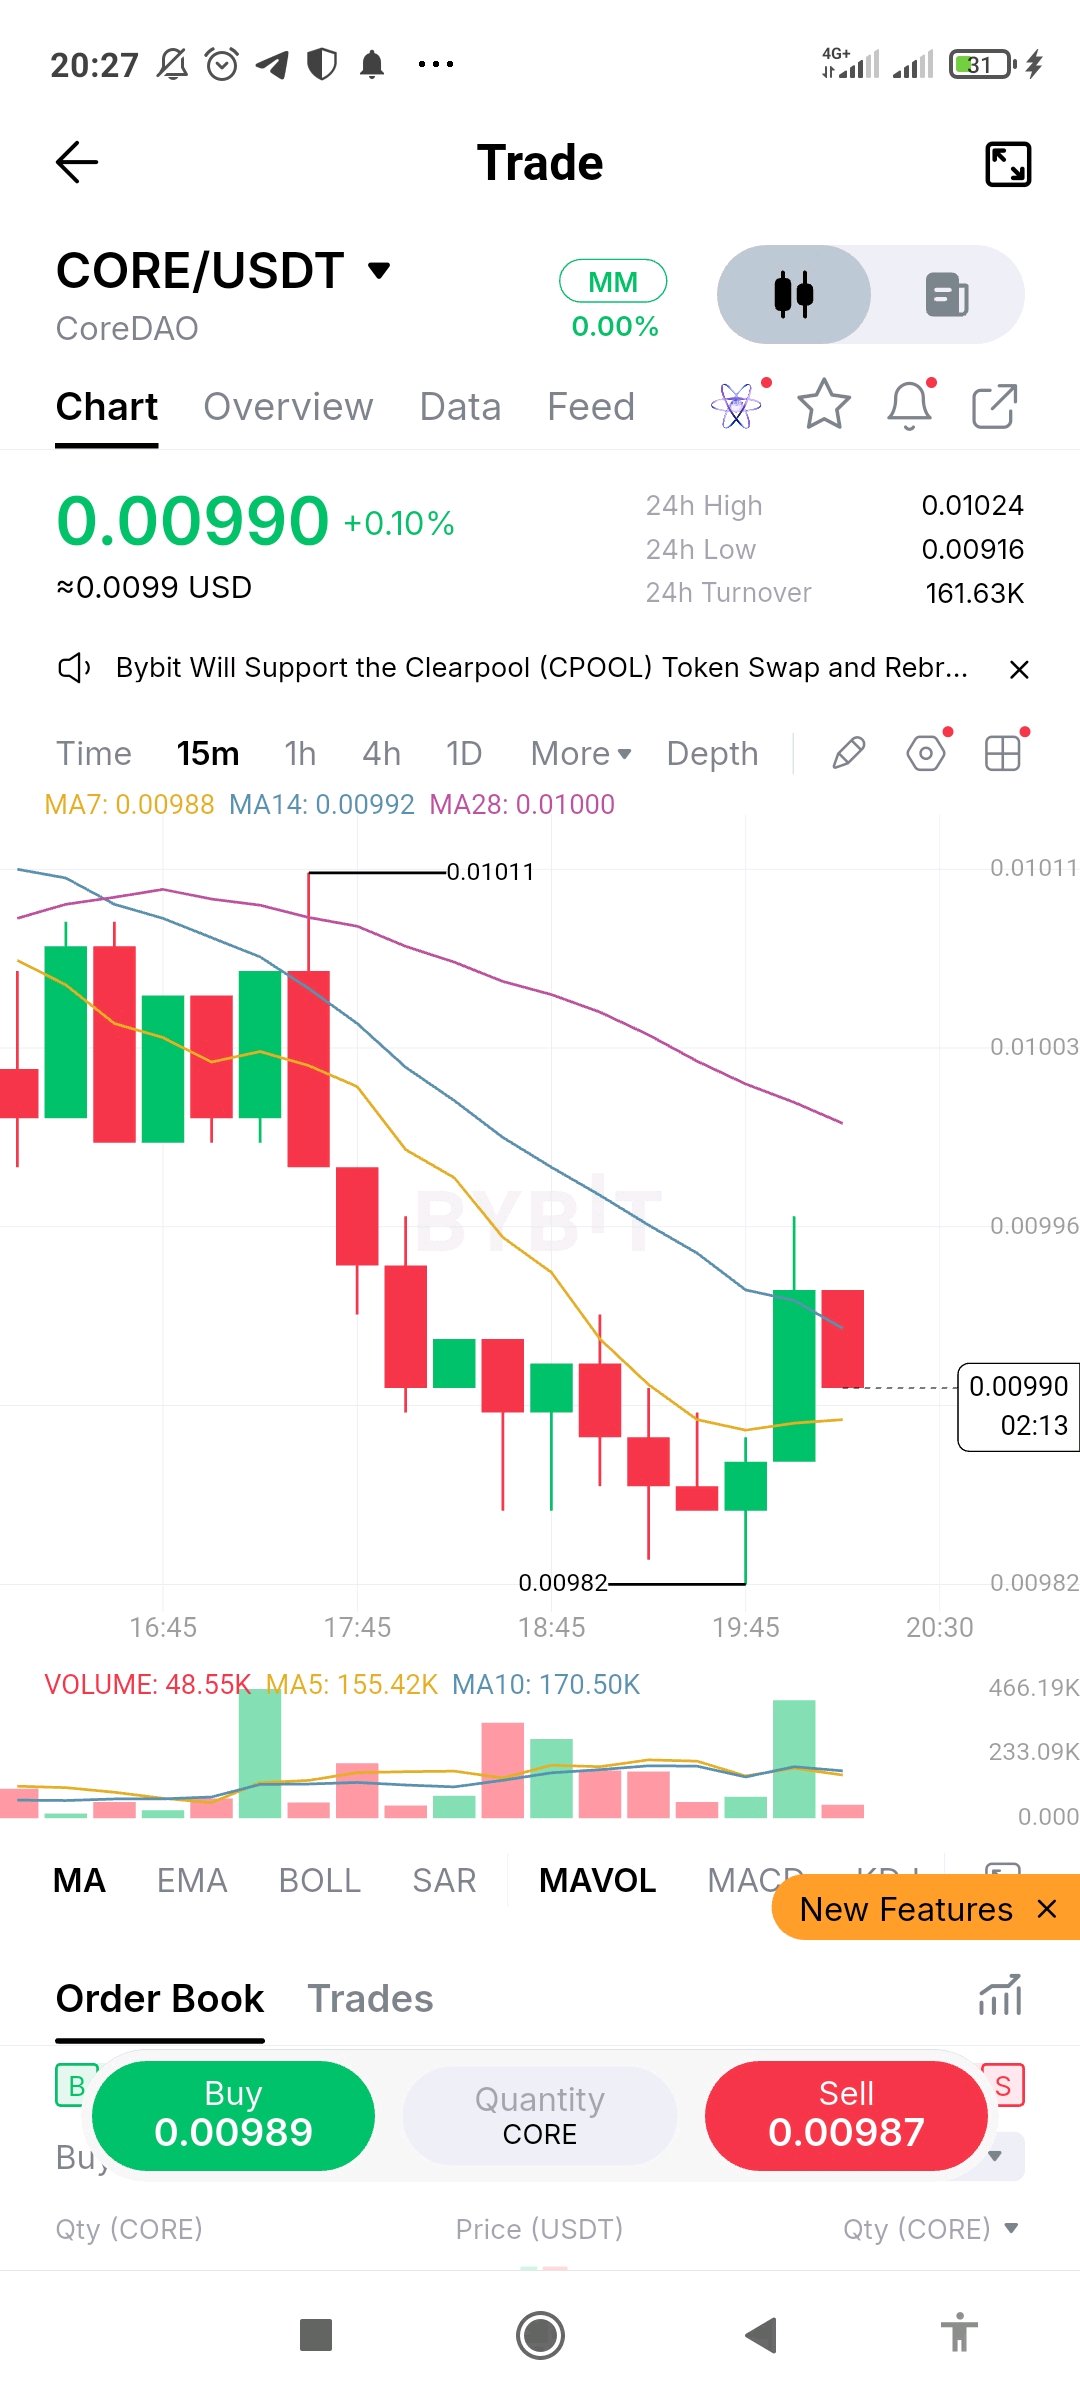
$COREUSDT berada di 0,00990 pada chart 15m, naik hanya 0,1% hari ini, tetapi tren jangka pendeknya sedang turun. Harga meluncur dari area 0,01011 ke level terendah 0,00982, memantul dengan satu candle hijau yang kuat, lalu mencetak candle merah tepat di bawah moving average yang sedang turun. MA7 (0,00988), MA14 (0,00992), dan MA28 (0,01000) tersusun dalam urutan bearish dan melandai ke bawah. Level terendah 0,00982 adalah level yang perlu diperhatikan. Penembusan di bawah level ini akan menunjukkan bahwa penjual masih memegang kendali, sementara penutupan kembali di atas MA14 di dekat 0,00992 akan menjadi tanda pertama bahwa pemantulan ini punya potensi. Volume melonjak pada candle pemantulan tetapi memudar pada candle merah setelahnya, jadi pembeli belum menunjukkan kelanjutan. Belum ada konfirmasi di sini. Pelajaran: persentase harian yang datar bisa menyembunyikan chart yang terus membuat lower high. Satu candle hijau di dalam tren turun hanyalah upaya pemantulan, bukan pembalikan arah, jadi tunggu higher low dan jaga ukuran posisi Anda tetap kecil. #$IMPACTbyTrade $COREUSDT $BTCUSDT

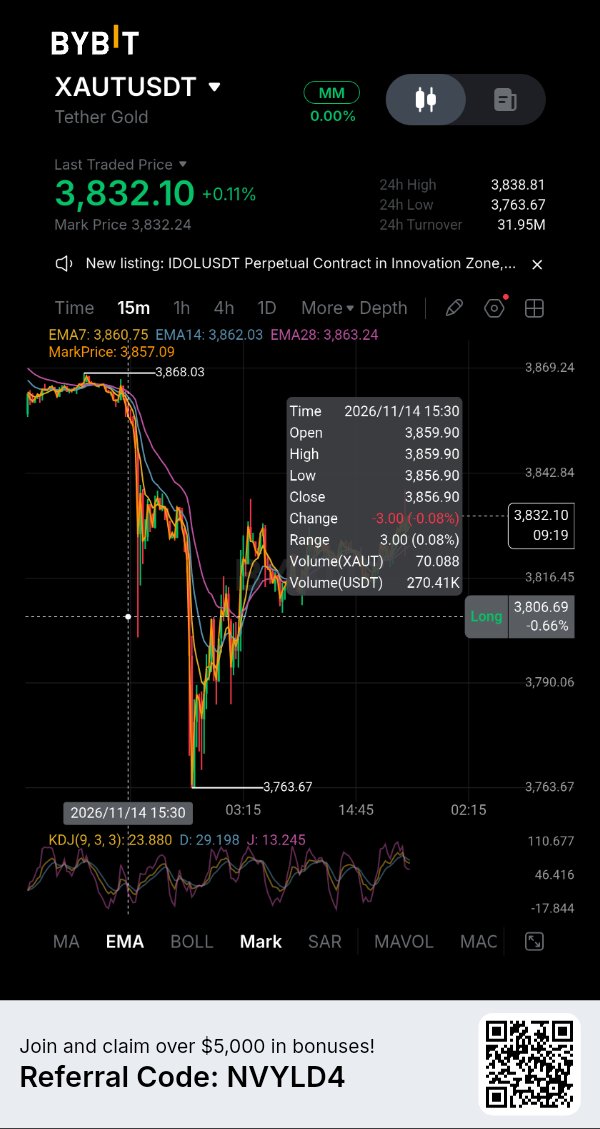
XAUT: Status Emas sebagai Safe-Haven Sedang Tertekan
Tether Gold menghadapi ujian seiring investor yang menilai kembali suku bunga AS. Emas spot ditutup pada hari Jumat di dekat $3.880 per ons setelah turun sekitar 4,5% selama seminggu, penurunan mingguan tertajam sejak awal Juni. Pemulihan singkat setelah data inflasi produsen yang lebih lunak tidak banyak mengubah aksi jual 3% pada hari Kamis. Tekanan datang dari kebijakan moneter. Rincian inflasi konsumen dan harga produsen AS tetap menjaga ekspektasi kenaikan suku bunga, sementara imbal hasil Treasury 10-tahun telah bergerak di atas 5%. Pejabat The Fed Jeff Schmid mengatakan pada 15 November bahwa inflasi tetap di atas target 2%. Imbal hasil yang lebih tinggi meningkatkan biaya peluang untuk memegang emas, yang tidak memberikan bunga. Hal itu menjelaskan mengapa ketidakpastian geopolitik belum melindungi emas batangan dari aksi jual. Kontrak perpetual XAUTUSDT di Bybit dikutip di dekat $3.823, turun sekitar 1% dalam 24 jam menurut cuplikan data bursa terbaru. Volume kontrak 24 jamnya sekitar $43,36 juta, dengan pendanaan (funding) sebesar +0,0012% per periode empat jam. Pendanaan positif berarti posisi long membayar posisi short, namun tingkatnya moderat dan tidak membuktikan posisi long yang padat. Harga perpetual juga dapat berbeda dari referensi emas spot karena jam perdagangan, likuiditas, dan penetapan harga kontrak. Ada perkembangan terpisah yang patut diperhatikan di luar grafik. Laporan cadangan Tether per 30 September menyatakan bahwa 827.417,63 XAUT beredar, didukung oleh jumlah ons troy murni yang sama yang disimpan dalam kustodian. Itu mewakili sekitar 25,7 ton emas. Pada 11 November, Anchorage mengumumkan layanan kustodian, perdagangan, dan agunan institusional bagi klien yang memenuhi syarat yang memegang XAUT. Ekspansi ini dapat meningkatkan akses institusional, namun tidak membuat setiap pemegang token memenuhi syarat untuk penukaran langsung penerbit atau menjamin likuiditas tunai segera. Untuk saat ini, arah XAUT tetap terikat pada respons emas terhadap imbal hasil dan dolar. Pergerakan berkelanjutan kembali ke atas $3.900 pada emas batangan akan membantu menstabilkan sentimen; penembusan lebih rendah lainnya akan terus menekan token tersebut. Cerita akses institusional sedang berkembang, tetapi belum membatalkan risiko makro. Pertanyaan kunci: 1. Bisakah emas merebut kembali $3.900 sementara imbal hasil Treasury tetap tinggi? 2. Akankah akses institusional diterjemahkan menjadi likuiditas XAUT yang lebih dalam dan lebih andal? 3. Apakah penurunan saat ini merupakan koreksi, atau awal dari penyesuaian harga emas yang lebih lama? IMPACTbyTrade


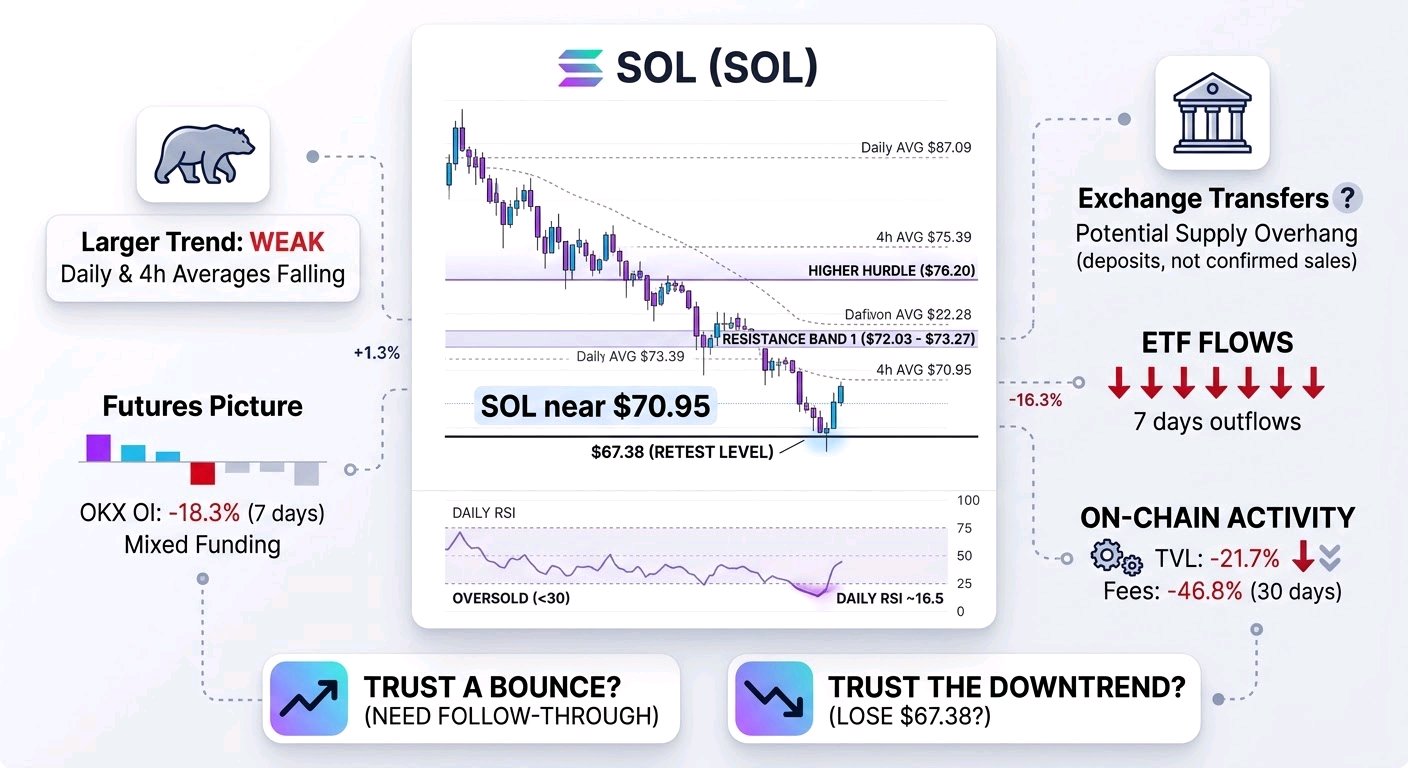
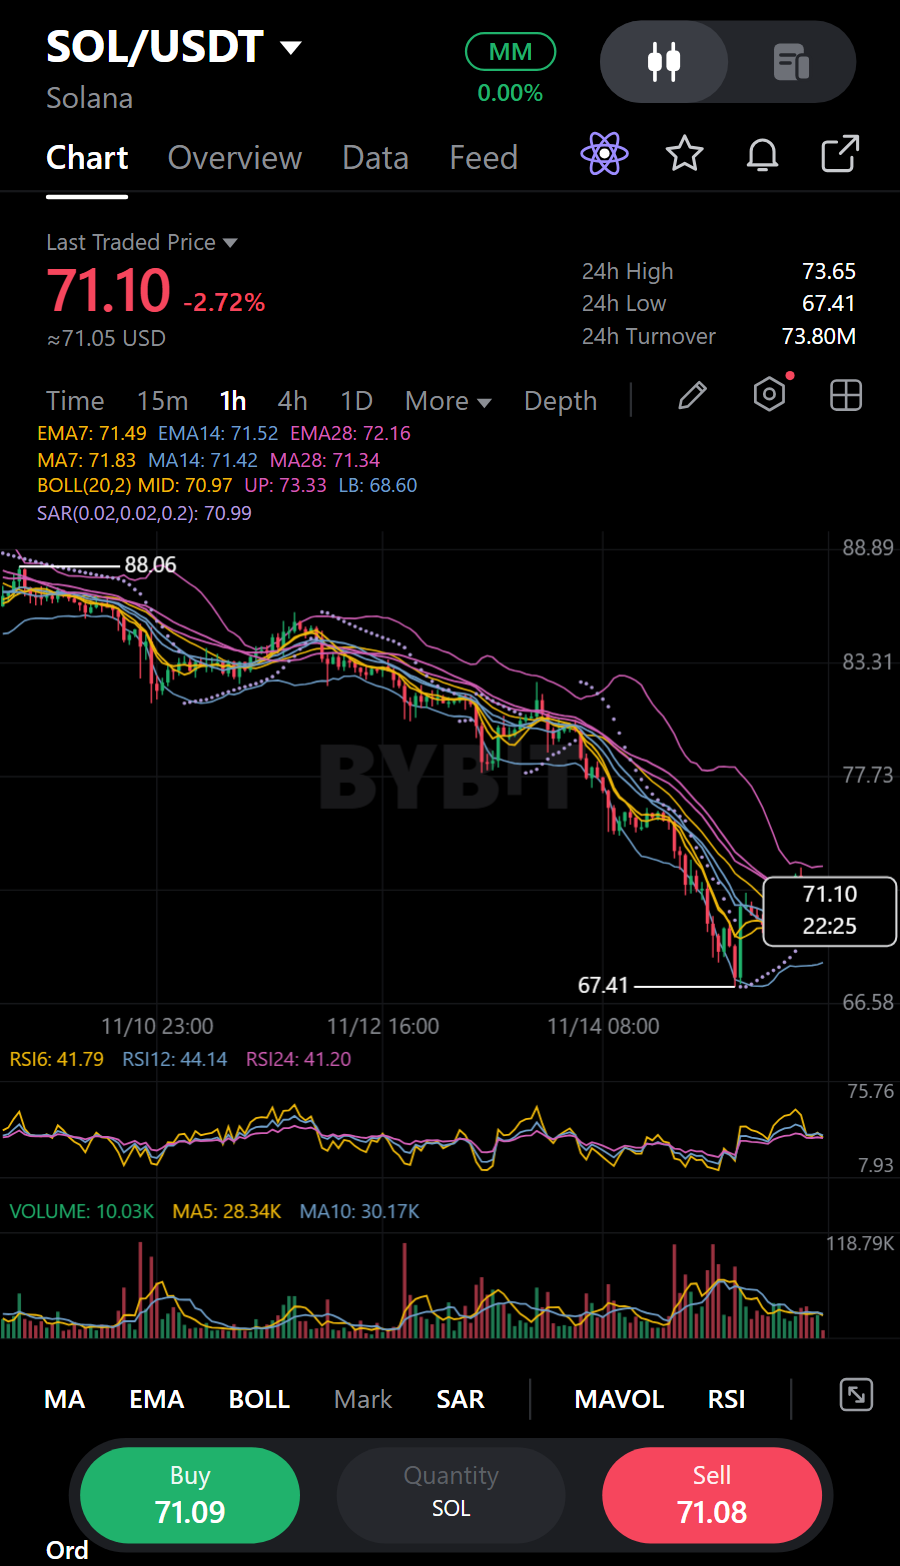
$SOLUSDT berada di dekat $70,95 setelah kehilangan 20,3% dalam 7 hari. Aset ini sempat menyentuh $67,38, level terendah sejak akhir Juni, sebelum memantul. Level terendah itu adalah pengujian terdekat yang paling jelas: jika bertahan, basis jangka pendek masih mungkin terjadi; jika jebol, berarti pemantulan gagal menghentikan rangkaian harga yang lebih rendah. Belum ada hasil yang terkonfirmasi. Tren yang lebih besar tetap terlihat lemah. SOL berada di bawah rata-rata 4 jamnya yang menurun di sekitar $75,39 dan $80,85 serta rata-rata hariannya di dekat $87,09 dan $95,48. RSI harian berada di sekitar 16,5, angka yang sangat rendah (oversold). Hal ini membuat reli pemulihan masuk akal, tetapi bukan berarti aksi jual sudah berakhir. Pada grafik 1 jam, SOL kesulitan bertahan di atas $72,03–$73,27, pita resistensi pertama yang terbentuk dari level tertinggi baru-baru ini. Pergerakan menembus zona tersebut yang diikuti oleh pengujian ulang (retest) yang kokoh akan lebih meyakinkan daripada lonjakan singkat. $76,20 adalah rintangan yang lebih tinggi; merebut kembali level ini akan memperbaiki struktur jangka pendek, meskipun tidak menghapus tren turun yang lebih luas. Apa yang membuat saya percaya pada pemantulan? Tindak lanjut (follow-through), bukan sekadar angka oversold. Candlestick terbaru menunjukkan pemantulan dari $67,38, tetapi harga belum stabil di atas resistensi terdekat. Data yang tersedia di sini tidak menyertakan grafik 15 menit yang andal, MACD, volume yang dipecah per candle, kedalaman order-book, atau peta panas likuidasi. Jadi, kita tidak bisa memverifikasi apakah pemantulan tersebut didukung oleh aksi beli spot yang kuat, mengidentifikasi klaster likuidasi yang tepat, atau mengklaim bahwa level tertentu akan memicu aksi beli atau jual paksa. Futures memberikan gambaran yang beragam. Pendanaan sedikit negatif di bursa utama, sehingga posisi short membayar posisi long; open interest OKX turun 18,3% selama 7 hari. Hal ini menunjukkan bahwa sebagian leverage telah keluar dari pasar dan memberi ruang bagi penutupan posisi short (short-covering) jika harga naik. Namun, posisi tidak satu arah: akun OKX cenderung long, sementara posisi trader teratas cenderung short. Penurunan open interest bisa mencerminkan deleveraging, belum tentu akumulasi atau short squeeze yang akan segera terjadi. Aktivitas spot cukup besar—sekitar $5,45 miliar selama 24 jam di 63 bursa—tetapi angka total saja tidak bisa memberi tahu kita apakah pembeli menyerap pasokan atau penjual mendominasi perdagangan. Transfer bursa yang dilaporkan layak diperhatikan, tetapi tidak perlu ditarik kesimpulan dramatis. Laporan berita menggambarkan deposit SOL dalam jumlah besar, termasuk pergerakan yang terkait dengan Forward Industries; perusahaan tersebut menyanggah atribusi kepemilikan untuk salah satu transfer yang dilaporkan. Pergerakan on-chain mungkin nyata, tetapi deposit tidak membuktikan adanya penjualan. Hal ini menjadikannya sebagai potensi kelebihan pasokan, bukan penjualan yang terkonfirmasi. Pasar yang lebih luas juga berada di bawah tekanan: total kapitalisasi pasar kripto turun 5,2% dalam 24 jam, dan indeks ketakutan berada di angka 10, angka yang sangat ekstrem. Apakah kelemahan SOL terutama disebabkan oleh pasokan dan aktivitasnya sendiri, atau diperparah oleh aksi risk-off di seluruh pasar? Keduanya mungkin benar. Ada nilai positif jangka panjang, tetapi itu tidak menyelesaikan perdagangan jangka pendek. Rencana tokenisasi DTCC mencakup Solana, dan jaringan tersebut mengadakan konferensi Breakpoint. Perkembangan tersebut mungkin penting seiring berjalannya waktu; namun sejauh ini belum menghasilkan pembalikan harga yang terlihat. Sementara itu, angka-angka yang lebih mendesak terlihat lemah: arus ETF menunjukkan 7 hari berturut-turut mengalami arus keluar, dengan total $32 juta selama 5 hari dan $120 juta selama 20 hari. Selama 30 hari, nilai yang terkunci (TVL) turun 21,7%, pasokan stablecoin 7,1%, dan biaya 46,8%. Ini adalah tanda-tanda nyata dari arus dan aktivitas yang lebih lemah, tetapi kita tidak bisa berasumsi bahwa ini memprediksi beberapa sesi berikutnya. Interpretasi saya sengaja dibuat kondisional. Di atas $67,38, pemantulan pemulihan tetap kredibel, terutama jika harga merebut kembali level $72,03–$73,27 dengan partisipasi yang berkelanjutan. Di bawah level terendah tersebut, interpretasi bearish akan semakin kuat. Apa yang akan mengubah keseimbangannya? Permintaan spot yang bertahan pada pengujian ulang, open interest yang kembali meningkat saat harga naik, dan arus keluar ETF yang mereda akan membuat pemantulan lebih substansial. Penolakan lain di level resistensi, berlanjutnya arus keluar, atau penurunan harga akan memperkuat argumen bahwa kondisi oversold belum menghentikan tren turun. Untuk saat ini, tidak ada pihak yang memiliki konfirmasi yang diperlukan.#IMPACTbyTrade
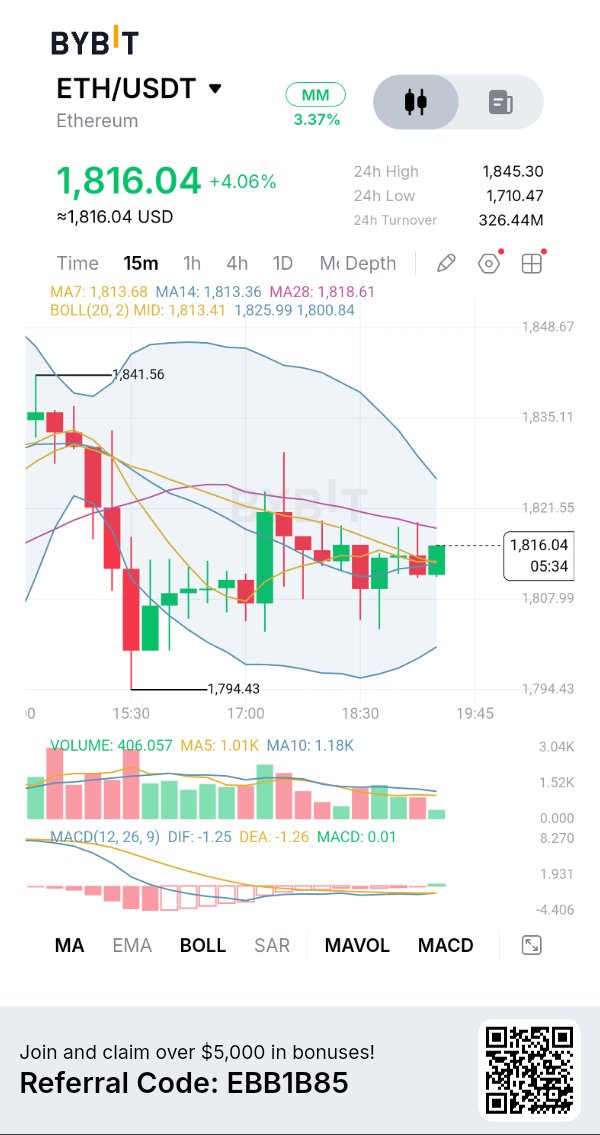
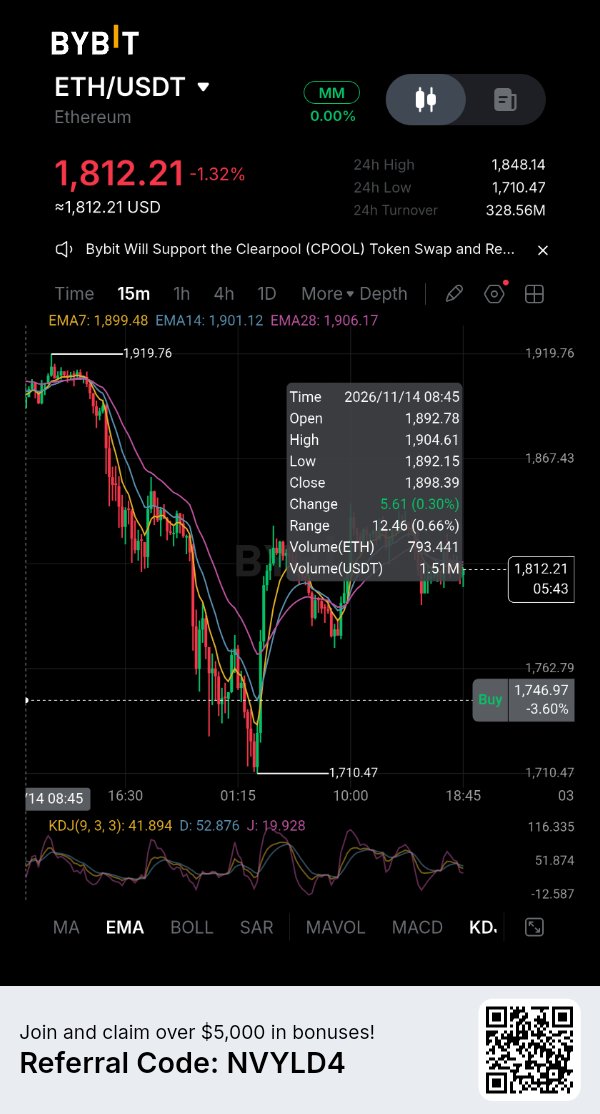
ETH Berupaya Pulih di Atas $1.816: Apakah Pembeli Sedang Bersiap untuk Reversal yang Lebih Kuat? Ethereum menunjukkan tanda-tanda stabilisasi jangka pendek setelah mengalami tekanan jual yang cukup besar, namun pemulihan saat ini masih memerlukan konfirmasi. ETH berhasil merebut kembali area $1.800 setelah penurunan menuju $1.794,43, dan pembeli kini mencoba membangun momentum di sekitar $1.816. Pertanyaan pentingnya adalah apakah pemulihan ini dapat berkembang menjadi pergerakan naik yang berkelanjutan atau apakah penjual akan menggunakan pantulan saat ini sebagai peluang lain untuk mendapatkan kembali kendali. GRAFIK + ANALISIS TEKNIS Grafik 15 menit Bybit saya untuk $ETHUSDT menunjukkan ETH diperdagangkan di sekitar $1.816,04, naik sekitar 4,06%, dengan harga tertinggi 24 jam di $1.845,30 dan terendah di $1.710,47. Struktur harga baru-baru ini menunjukkan penurunan tajam yang diikuti oleh pemulihan dan konsolidasi. Pembeli telah mempertahankan swing low di $1.794,43, tetapi harga masih mendekati beberapa level resistance di atasnya. Moving average memberikan gambaran yang menarik. MA7 berada di sekitar $1.813,68, MA14 di sekitar $1.813,36, dan MA28 di sekitar $1.818,61. ETH diperdagangkan di atas rata-rata yang lebih pendek tetapi tetap di bawah MA28, menjadikan $1.818,61 sebagai referensi resistance terdekat yang penting. Bollinger Bands menunjukkan garis tengah di sekitar $1.813,41, band atas di dekat $1.825,99, dan band bawah di sekitar $1.800,84. Pergerakan berkelanjutan di atas garis tengah dapat memperkuat pemulihan, sementara penolakan di sekitar band atas akan menunjukkan bahwa pembeli masih menghadapi resistance yang cukup besar. ANALISIS MACD + VOLUME MACD menunjukkan perbaikan awal, dengan DIF di -1,25, DEA di -1,26, dan histogram di sekitar +0,01. Histogram yang sedikit positif menunjukkan bahwa momentum bearish mulai mereda. Namun, kedua garis MACD tetap berada di bawah nol, yang berarti pembalikan momentum bullish penuh belum terkonfirmasi. Volume saat ini berada di sekitar 406.057, di bawah MA5 di 1,01K dan MA10 di 1,18K. Ini adalah kekhawatiran penting karena pemulihan berkembang tanpa partisipasi yang kuat. Saya lebih suka melihat volume yang berkembang selama breakout ke atas sebelum menganggap pergerakan ini sebagai reversal yang meyakinkan. SKENARIO BULLISH Jika ETH mempertahankan support di sekitar $1.813–$1.814 dan berhasil merebut kembali $1.818,61, saya akan memantau kelanjutan menuju $1.821,55. Breakout yang lebih kuat dapat membuka jalan menuju $1.825,99, yang sejajar dengan Bollinger Band atas. Pendekatan entry yang saya sukai adalah menunggu penutupan candle 15 menit yang menentukan di atas resistance, diikuti oleh retest yang berhasil dengan volume yang meningkat. Penurunan berkelanjutan di bawah $1.807,99 akan melemahkan pengaturan bullish jangka pendek ini. RENCANA TRADING SAYA Saya tidak akan mengejar pemulihan saat ini selama ETH diperdagangkan di antara support dan resistance. Untuk posisi long, saya ingin melihat pembeli merebut kembali $1.818,61, mengonfirmasi breakout tersebut, dan menunjukkan volume yang lebih kuat. Untuk posisi short, saya akan menunggu konfirmasi breakdown di bawah $1.807,99 dan upaya pemulihan yang gagal. $IMPACTbyTrade

Hyperliquid was built to pull leveraged trading away from centralized exchanges. So what does it say that its own token now trades on a centralized venue with a 10x leverage tag? That tension is the real fundamental question. HYPE is the native asset of Hyperliquid, a decentralized perpetual futures platform. The screenshot shows it at 66.365, up 1.18%, beside a 67.95M figure that isn't labeled, so I won't assume what it measures. What is visible is enough to ask where the token's value actually comes from. The project's strength is focus. Rather than a general-purpose chain searching for a use case, Hyperliquid is organized around one proven source of demand: leveraged derivatives trading. A token placed at the center of that activity has a clearer economic story than most Layer 1 assets. The hidden contradiction is that token price and protocol economics are different things. A modest daily gain on a leveraged listing reflects speculative flow, not platform revenue. Traders can push HYPE higher elsewhere without a single additional user touching Hyperliquid itself. Price discovery is happening off-platform, so the market may be pricing the narrative faster than fundamentals can confirm it. For monetization, the key issue is whether platform trading activity converts into durable token demand through fees, buybacks or staking utility. None of that is verifiable from this screenshot, and no revenue, supply or unlock data is shown, so I am leaving tokenomics out rather than guessing. The bullish case is a focused product, strong brand recognition and listings on major venues that widen access and liquidity. The bearish case is cyclicality. Perpetual futures volume depends on volatility and appetite for leverage, and when traders step back, both activity and the token's value proposition thin out. The critical risk is competition. Derivatives traders move wherever liquidity and fees are best, and that includes centralized exchanges, which are the very venues Hyperliquid set out to displace. My view: the thesis is credible but concentrated. HYPE is effectively a claim on one business line, and that purity cuts both ways. It deserves serious attention, not blind enthusiasm. The milestone that would change my assessment is evidence that platform revenue translates into measurable, recurring token demand independent of price momentum. Until that link is visible, price strength is a sentiment signal rather than a fundamental one. If a token's price is set mostly on centralized venues, how much of its value does the protocol itself actually control? $HYPEUSDT #IMPACTbyTrade
HYPERLIQUID (HYPE): Is the Market Underestimating Its Potential? Hyperliquid is an interesting project to watch in the decentralized trading sector. My focus is on three factors: 1. Growth in platform activity. 2. User adoption and ecosystem development. 3. Whether HYPE can regain market strength. Long-term potential and short-term price action are two different things. I want to see real ecosystem growth before becoming overly bullish. What matters more to you: HYPE's technology, adoption, or price performance? $HYPEUSDT #IMPACTbyTrade


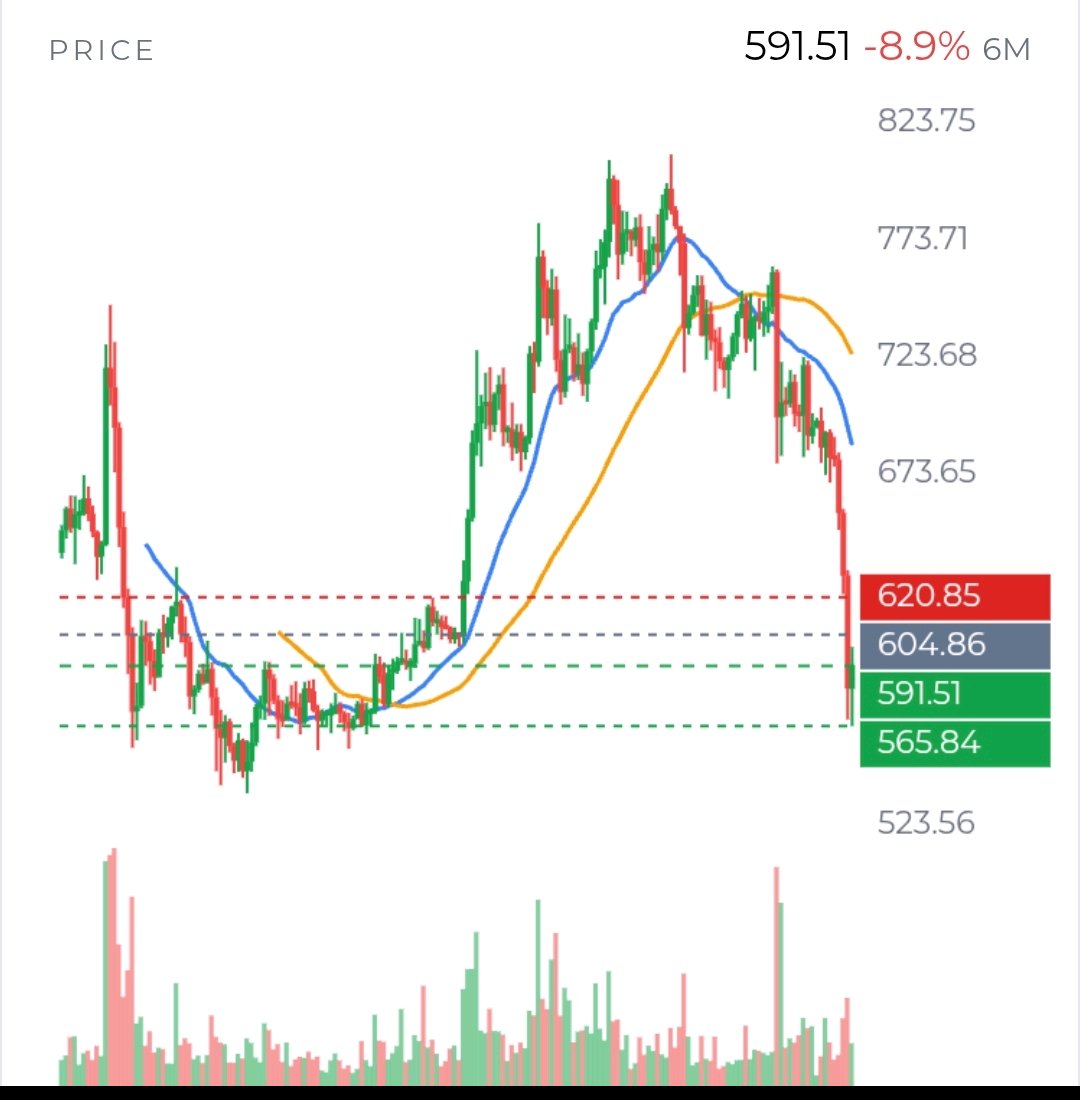
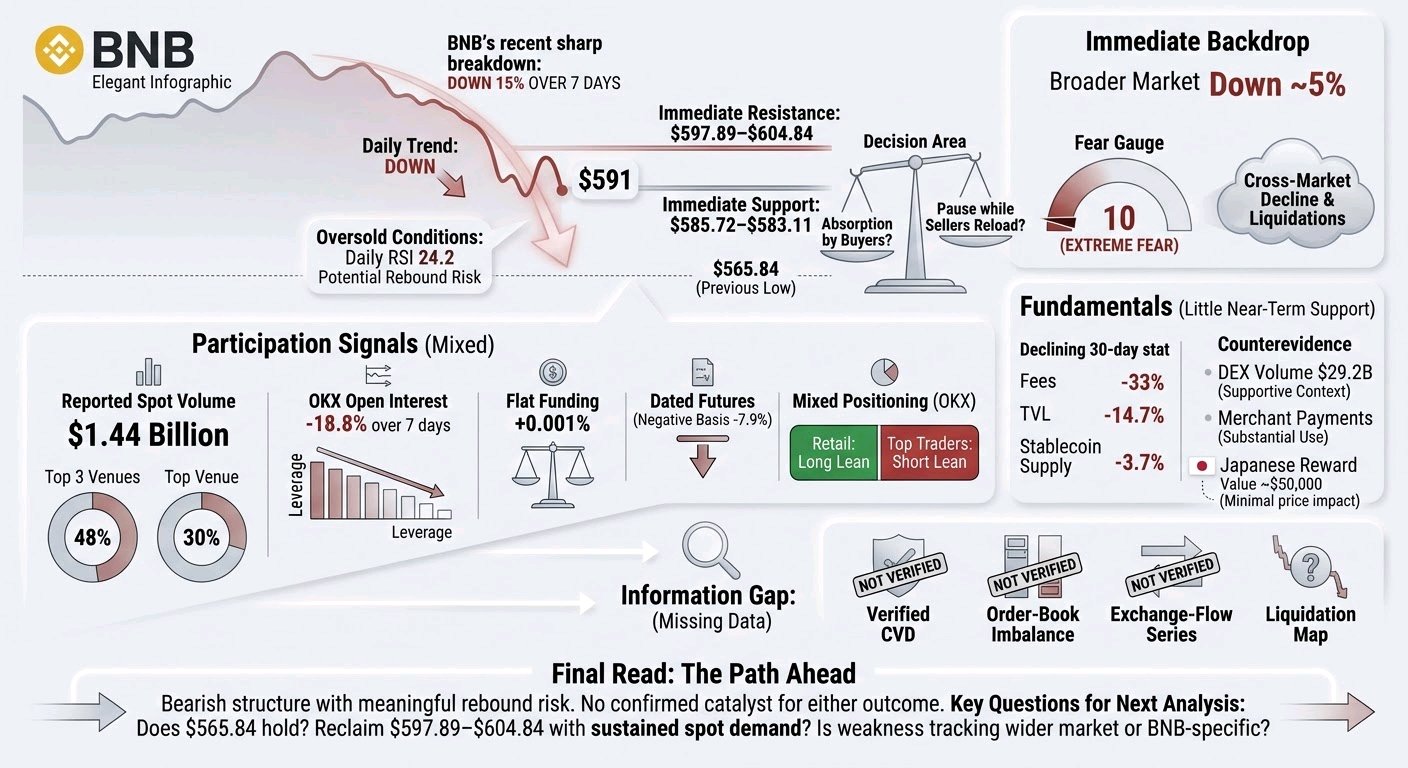
$BNBUSDT is not giving a clean signal yet. The important question is no longer simply “Is it oversold?” It is whether the market can turn a sharp drop into a stable base—or whether each bounce is an opportunity for sellers to exit. The verified picture is weak, but not one-sided. BNB is around $591, down about 15% in 7 days and 18% in 30 days. It remains below its daily EMA20 near $675 and EMA50 near $703; the hourly trend is also down. Daily RSI is 24.2, a level commonly called oversold. That tells us the decline has been forceful. It does not tell us the decline is finished. The levels closest to price matter most. Buyers have a first test at $585.72–$583.11, with the recent low at $565.84 below that. If price breaks the nearby support and cannot reclaim it, the low becomes a plausible retest. But if price holds support, could this be the beginning of a base? I would look for follow-through, not just one green candle. On the upside, $597.89–$604.84 is the first meaningful reclaim area, including the hourly EMA50. BNB has traded above part of that zone, but has not established a sustained hold. $620.60–$620.85 is the next important hurdle. Holding above it would weaken the immediate bearish interpretation; failing there would suggest the rebound has not yet changed the trend. A move all the way back to the daily EMA20 near $675 would require a much larger recovery, not merely a short-covering pop. Participation offers clues, but not a verdict. Reported spot volume is about $1.44 billion across 62 venues, though the top 3 account for 48%, including one venue at 30%. That concentration makes the aggregate number less convincing as evidence of broad buying. Perpetual open interest is reported at $563 million across 4 tracked venues; OKX open interest is down 18.8% over 7 days. That points to leverage coming out on that venue, but does not tell us what happened across the whole market. Funding is nearly flat, at roughly +0.001% per 8 hours. OKX accounts lean long, while top traders’ positioning measures lean short. The disagreement matters: it does not look like a clear, market-wide pile-up of shorts that must be squeezed, or longs that are certain to be liquidated. We also do not have verified liquidation levels, taker-flow data, or order-book evidence. So I would not claim that a particular price is a liquidation magnet or that a squeeze is underway. The wider market is a real part of this story. Total crypto market value is down about 5% in the latest snapshot, and fear is at 10, compared with 28 a week ago. Recent coverage described broad market stress and liquidations. That makes BNB’s fall look partly connected to risk aversion across crypto, not necessarily to a single BNB-specific event. If Bitcoin and the wider market stabilize, BNB could benefit; if they weaken again, local support may be less reliable. BNB Chain’s fundamentals are mixed over different timeframes. Over 30 days, fees fell 33%, TVL fell 14.7%, and stablecoin supply fell 3.7%. Those declines are a genuine headwind, though they do not identify the cause of the current selloff or time a trade. In the other direction, reported 30-day DEX volume is $29.2 billion, and a 12-month merchant-payments report found BNB Chain and Tron handled 75% of merchant USDT pay-ins. That is evidence of use, but not proof that buyers are stepping in now. My analytical view: the downtrend remains intact, while oversold conditions and nearby support make an immediate bearish continuation less certain. The most informative evidence next will be whether $565.84 holds on a retest, whether price can sustain a reclaim above $604.84, and whether any recovery comes with broader-market stability. Until those questions are answered, both a relief bounce and another leg down remain plausible. #IMPACTbyTrade
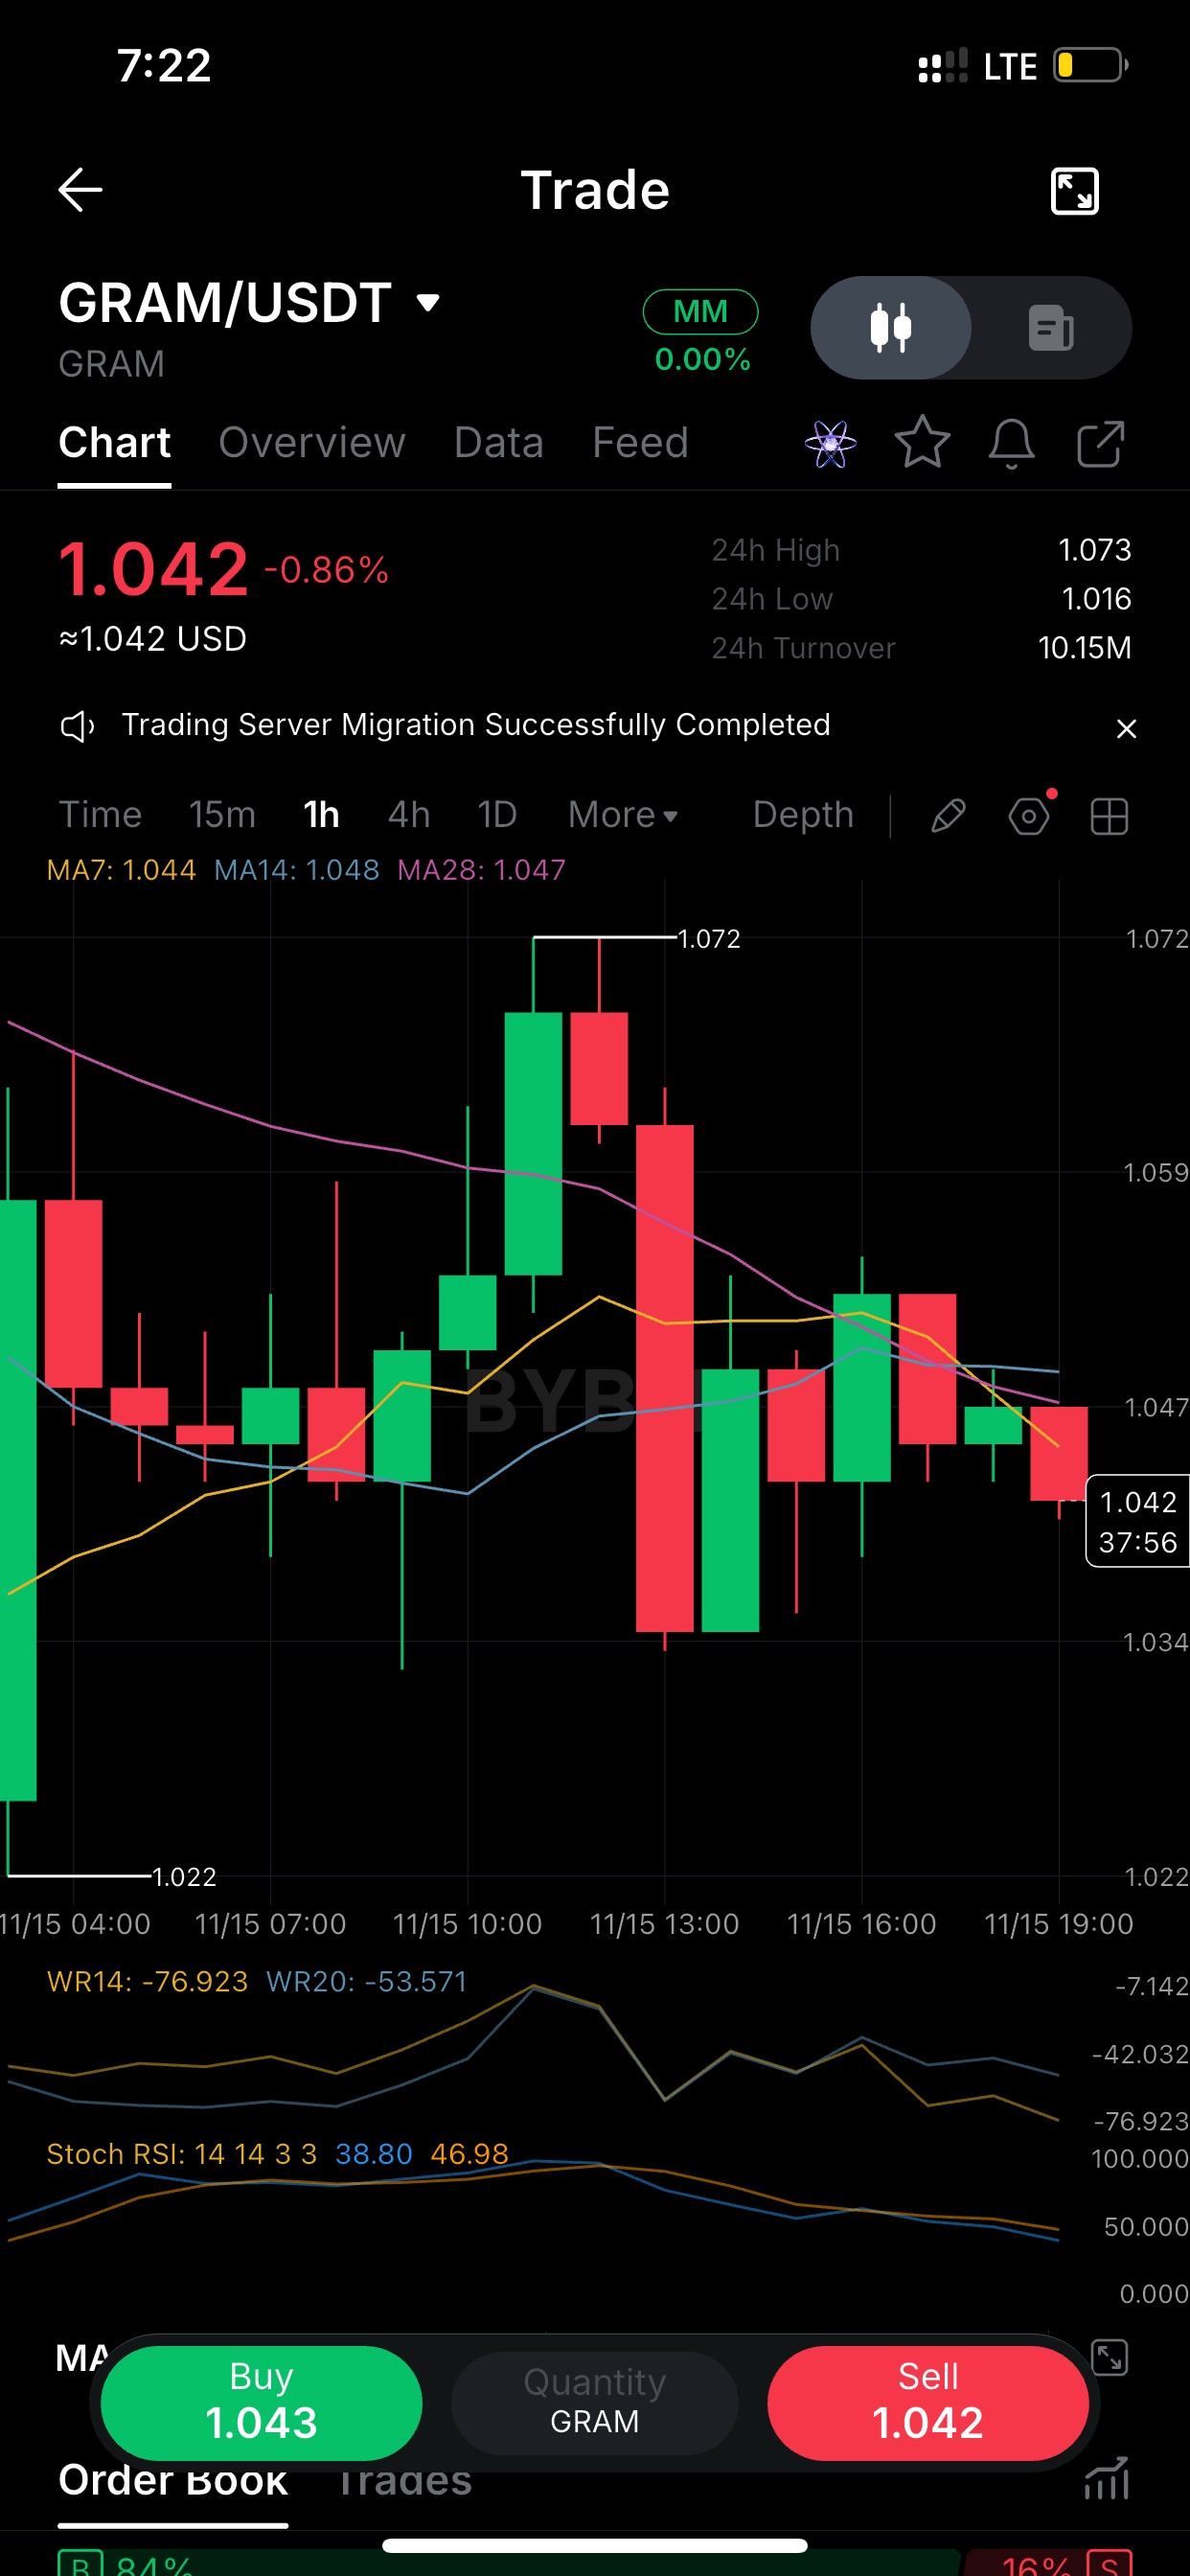
$GRAMUSDT printed 1.072 around 10:00 UTC and got sold straight back down. The red candle that followed erased almost the whole move and wicked to 1.034. Since then it's been lower highs, and price now sits at 1.042 under all three MAs (7/14/28 clustered at 1.044-1.048). That cluster is the first thing bulls need to reclaim. Until then I treat bounces as rallies into resistance, not a trend change. GRAM/USDT, 1h. Range is clean: 1.022 low, 1.072 high, and price is chopping in the lower half at 1.042. Momentum read: Stoch RSI is mid-range (about 39/47), so it's not oversold and there's room to slide further. Williams %R(14) is at -77, leaning weak but not washed out. If 1.034 (the last swing low) breaks on a closing basis, I'd expect a retest toward the 1.02 area. If buyers push back above 1.048, the bias flips neutral. Waiting on one of those two. 24h turnover on $GRAM is about 10M with a 1.016-1.073 range, so it's moving, but the 1h structure says sellers have the upper hand right now. Not chasing either side here. The setup I'd watch: a 1h close back above the MA cluster near 1.048 with a green candle that holds. Without that, every pop is just noise inside the range. One heads-up: the GRAM/USDT screen shows an MM tag and 0.00% fee badge. If this is a zero-fee or market-maker pair, trades on it are excluded from the trading impact part of the score. Your posts can still earn points on content quality, engagement and consistency, so make sure to use the coin tag or trading widget on each post. Also, spread these out over the day rather than posting all three at once, since high-frequency posting can get muted. #IMPACTbyTrade
$BNBUSDT is trying to stabilize after a sharp breakdown, but I don’t yet see evidence that the market has changed character. The key distinction is whether buyers are absorbing supply—or merely taking a pause while sellers reload. Verified: BNB is near $591, down 15% over 7 days. It fell to $565.84 and rebounded as high as $599.63, but recent hourly closes failed to hold above $597.89. The 1-hour, 4-hour and daily trends remain down. Daily RSI is 24.2, which signals oversold conditions, not a confirmed bottom. Price remains below the 1-hour EMA50 at $604.84, the 4-hour EMA20 at $615.86, and the daily EMA20 at $674.78. That leaves a nearby decision area. $585.72–$583.11 is short-term support; below it, the market would be testing $565.84 again. If that low breaks and price cannot quickly reclaim it, sellers retain control. On the other hand, a sustained move above $597.89–$604.84, followed by a successful retest, would be more meaningful than a brief intraday spike. The next substantial resistance is around $620.60–$620.85. Could BNB reclaim those levels while the broader market remains weak? That would be stronger evidence of demand than oversold readings alone. Participation signals are mixed. Reported spot volume is $1.44 billion across 62 venues, but the top 3 account for 48%, with one venue representing 30%. That makes the headline volume less persuasive as proof of broad-based buying. Perpetual open interest is $563 million across 4 tracked venues; OKX open interest is down 18.8% over 7 days. That suggests leverage has been coming out there, but it does not establish the direction of aggregate market-wide positioning. Funding is nearly flat at +0.001% per 8 hours, while dated futures trade at a negative 7.9% annualized basis. On OKX, retail accounts lean long, while top traders’ positioning leans short. Those crosscurrents do not point to an obvious, crowded short that must be squeezed. The important gap is what we cannot establish from these figures: there is no verified CVD, order-book imbalance, exchange-flow series, or liquidation map here. So we cannot confidently say whether spot buyers absorbed the selloff, where forced liquidations clustered, or whether the rebound was driven mainly by short covering. A liquidation level, if identified, would be a possible volatility point—not a guaranteed turning point. The immediate backdrop also matters. The broader crypto market is down about 5% in the latest snapshot, with fear at 10, down from 28 a week ago. News on Nov. 13 described a sharp cross-market decline and forced liquidations as Bitcoin and other major assets fell. That supports the interpretation that BNB’s slide was amplified by general risk aversion, rather than being solely a BNB-specific event. But it raises a useful question: if the broader market stabilizes, does BNB recover with it—or continue to lag? Fundamentals give little near-term support for a bullish reversal. Over 30 days, BNB Chain fees fell 33%, TVL fell 14.7%, and stablecoin supply fell 3.7%; these figures reinforce a weaker activity backdrop, though they do not prove what caused this week’s price move. There is counterevidence: reported 30-day DEX volume is $29.2 billion, and a recent merchant-payments report described substantial use of BNB Chain. Those are supportive context, not evidence of new buying pressure. A Japanese company’s announced BNB shareholder reward is worth watching, but its reported value is only about $50,000 and the reference date is Dec. 31. It does not look large enough to explain this selloff or reverse it by itself. My read: bearish structure, meaningful rebound risk, and no confirmed catalyst for either outcome. The next analysis should answer three questions: does $565.84 hold on a retest; can BNB reclaim $597.89–$604.84 with sustained spot demand; and is the weakness still tracking the wider market, or becoming BNB-specific?#IMPACTbyTrade

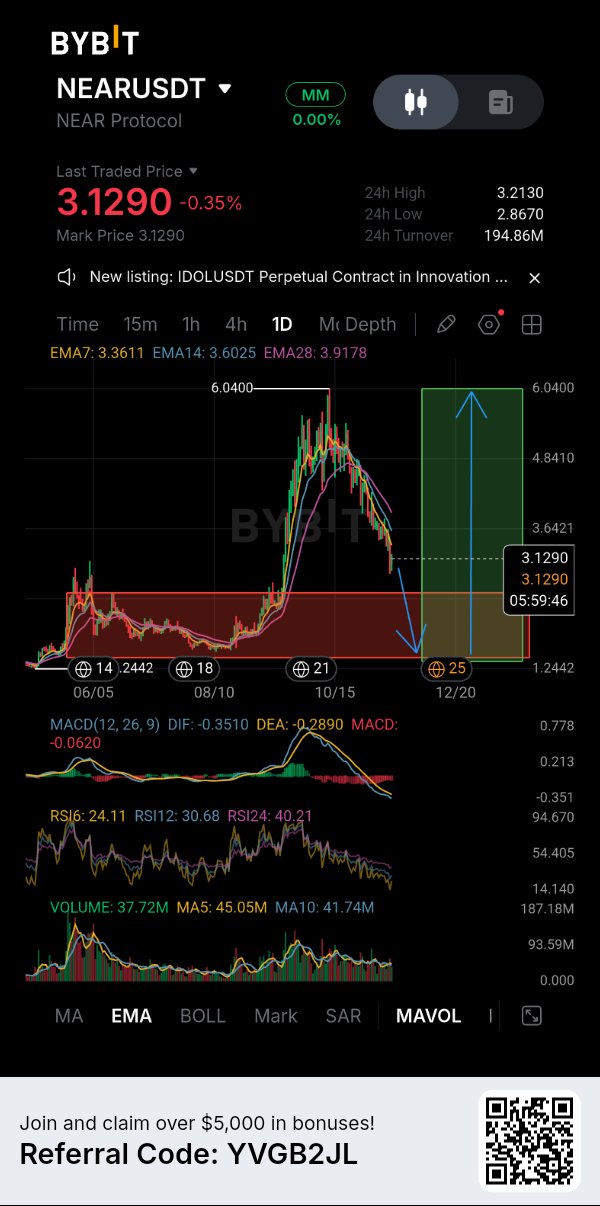
NEAR SPOT BUY 🟢 GREAT OPPortunity
$NEAR EMERGENCY UPDATE : DOWNTREND IS GETTING DEEPER, BUT I'M WATCHING THE BIGGER OPPORTUNITY💯 $NEARUSDT is currently trading around $3.129, and the daily chart is showing clear signs of weakness. After the strong rally toward $6.04, price has gradually lost momentum and sellers have taken control. What concerns me most is that NEAR is now trading below all three visible EMAs. The EMA 7 is at $3.3611, EMA 14 at $3.6025, and EMA 28 at $3.9178. This bearish alignment tells me that buyers still have some work to do before the recovery becomes convincing. MY BYBIT 👉 WHAT THE DAILY CHART IS TELLING ME📊 RSI is another important detail here. RSI 6 is sitting at 24.11, RSI 12 at 30.68, and RSI 24 at 40.21. Short-term momentum is clearly stretched toward oversold territory. Meanwhile, MACD remains negative, with DIF at -0.3510 and DEA at -0.2890. The histogram is also below zero. So, although a relief bounce is possible, I don't want to confuse oversold conditions with a confirmed trend reversal. TWO SCENARIOS I'M WATCHING🟢🔴 BULLISH SCENARIO🟢 First, I want to see NEAR defend its current lower price region and establish some buying strength. The first recovery area I'm watching is around $3.36, followed by $3.60 and $3.92, where the visible EMAs are positioned. Reclaiming these levels would gradually improve the daily structure. A stronger recovery could eventually bring the previous $6.04 swing high back into focus, but that's a much bigger possibility, not an immediate target. BEARISH SCENARIO🔴 If sellers continue pushing price lower, the recent 24H low around $2.867 becomes an important nearby reference. A sustained breakdown could expose the much wider historical support region visible around $1.24. The chart annotation also illustrates a possible deeper correction before a larger recovery. However, I would need to see actual price confirmation before treating that projection as a realistic trading setup. FOR TRADERS ALREADY HOLDING NEAR🎯 I wouldn't make decisions based on RSI alone. If price starts recovering toward the EMA resistance cluster, partial profit-taking could be considered depending on individual entry prices. For anyone looking to build a larger position, I'd prefer seeing a confirmed recovery rather than averaging down blindly during continued weakness. RISK MANAGEMENT⚠️ $2.867 area deserves attention as the recent daily low. Losing it could increase downside pressure. A bounce without confirmation isn't a reliable entry. Liquidity zones aren't automatically buying opportunities either. Entry, stop-loss, position sizing, and risk-to-reward should all be considered before taking a trade. MY FINAL THOUGHTS🤔 I still see potential for a larger recovery in NEAR, but the current daily structure isn't bullish yet. I'd rather wait for buyers to prove themselves than rush into a falling market. Sometimes protecting capital during a weak market is the best trade. Are you accumulating NEAR at these prices, or waiting for a deeper correction before considering an entry? #IMPACTbyTrade #WSOT2026 #WSOTShowYourAITradeToEarn10USDT #JensenHuangExitTestsNvidiasAILeadership #USPPITestsTheHigherForLongerTrade


⚠️ ZRO/USDT — Is This a Deeper Correction Before Recovery, or Has the Trend Broken? ZRO is trading near $1.3765, down 10.33% in 24 hours, after falling from the recent $1.5468 high. The 24H low is $1.3421. Both 4H and daily charts remain weak; oversold RSI alone is not a buy signal. On 4H, RSI(6) is 25.94, RSI(12) 31.68 and RSI(24) 37.43. Daily RSI readings are also weak: 25.27, 34.93 and 42.69. Oversold conditions can bounce, but timing is uncertain. MACD is negative on both timeframes. On 4H, DIF is around -0.0392 versus DEA at -0.0230, with a negative histogram near -0.0162. Daily DIF is -0.0863 and DEA -0.0605. Volume is 332.60K, below MA5 at 575.88K and MA10 at 663.76K. Sellers remain in control; volume does not show a clear capitulation spike. The moving averages reinforce the caution. On 4H, MA7/EMA7 sit near $1.4406/$1.4416, MA14/EMA14 near $1.5041/$1.4792, and MA28/EMA28 around $1.5326/$1.5140. Daily averages are even higher: MA7 $1.4974, MA14 $1.5957 and MA28 $1.6837. Price must reclaim these areas; one bounce will not erase the downtrend. The Fibonacci map is important. The 4H chart marks $1.5042 as the 0.0 reference and $1.3817 as 1.0. Between them are 0.236 at $1.4753, 0.382 at $1.4574, 0.5 at $1.4430, 0.618 at $1.4285 and 0.786 at $1.4079. ZRO is now below the 1.0 level, so the full measured retracement has been exceeded. These are reference zones, not guaranteed support. Fundamentals are more nuanced than the chart. LayerZero says its interoperability protocol connects 165 networks and has moved more than $260B in cross-chain value. Its June 2026 token explanation describes ZRO as the asset intended to capture value across LayerZero, Stargate and the planned Zero network. Stargate revenue is directed to ZRO buybacks, while a separate LayerZero protocol fee switch would require governance activation before it can generate buyback-and-burn demand. Zero is designed for institutional settlement, payments and capital markets, with partners including DTCC, ICE, Citadel Securities, Tether and Google Cloud. These ambitions matter, but planned economics are not yet fully realized token value. There is also a near-term supply event. DeFiLlama lists 23.63M ZRO scheduled to unlock on November 19, around 5.91% of current circulating supply, allocated to core contributors and strategic partners. Unlocks do not mean automatic selling. LayerZero says actual investor sales have been below headline unlocks and points to Foundation and Stargate-funded buybacks. Still, new supply arrives while the chart is weak. Levels I am watching: 🔴 $1.4079: First Fibonacci reclaim level (0.786). A recovery above it would be an early sign of stabilization. 🔴 $1.4285–$1.4430: Fibonacci 0.618/0.5 zone, close to the 4H MA7 area. Reclaiming and holding this band would improve short-term structure. 🔴 $1.4574–$1.4753: Fibonacci 0.382/0.236 resistance. Buyers need to defend a retest after a breakout. 🔴 $1.5042: Fibonacci 0.0 reference and near the 4H MA14. A sustained reclaim would be a more meaningful recovery signal. 🟢 $1.3817: Fibonacci 1.0 reference, now just above price and an immediate reclaim test. 🟢 $1.3421: Visible 24H low. A decisive break below would expose further downside and weaken the case for a near-term base. I prefer evidence over trying to call a bottom. First I want price to reclaim $1.3817, then hold $1.4079 and work back through $1.4285–$1.4430 with improving volume. If rallies keep failing below the moving averages, the downtrend remains intact. A break under $1.3421 would make me more defensive. I would not treat oversold RSI as a standalone long signal. ZRO has a credible cross-chain role, but adoption, buybacks, fee-switch activation and token demand must be proven, not assumed. Strong fundamentals cannot cancel weak market structure. 🔥 Will ZRO reclaim $1.4079 and build a base, or will the November unlock and bearish momentum push it below $1.3421? $ZROUSDT #IMPACTbyTrade
ETH: Reset Leverage Belum Selesai
Ethereum masih diperdagangkan di bawah tekanan setelah siklus likuidasi tajam minggu lalu. Snapshot CoinGlass terbaru menempatkan $ETHUSDT di dekat $1.816,60, turun 1,32% selama 24 jam dan 14,35% selama tujuh hari. Rentang harian telah melebar dari $1.710 hingga $1.857,60. Pembeli telah mempertahankan level terendah, tetapi belum merebut kembali batas atas dengan penuh keyakinan. Data derivatif menunjukkan bahwa sebagian leverage telah keluar, meskipun prosesnya belum selesai. Minat terbuka (open interest) futures ETH agregat berada di dekat $21,90 miliar, turun 3,02% selama 24 jam. Pada saat yang sama, likuidasi yang terlacak mencapai sekitar $360,82 juta, dengan $279,74 juta berasal dari posisi long. Penurunan harga di samping minat terbuka yang lebih rendah menunjukkan bahwa posisi ditutup atau dilikuidasi, bukan berarti short baru yang masuk. Perpetual $ETHUSDC Bybit menawarkan pemeriksaan silang yang berguna. Minat terbukanya sekitar $1,36 miliar, turun 2,55% selama 24 jam, sementara tingkat pendanaan (funding rate) sekitar −0,0047% per periode delapan jam. Pendanaan negatif berarti posisi short membayar posisi long, yang menunjukkan pasar perpetual sedang diperdagangkan dengan premi bearish. Bybit mencatat sekitar $37,13 juta dalam likuidasi ETH selama periode 24 jam yang sama, sangat condong ke arah posisi long sebesar $33,32 juta dibandingkan $3,81 juta dalam posisi short. Eksposur sedang turun, tetapi posisi long masih terus terpaksa keluar. Ketidakseimbangan antara aktivitas derivatif dan spot adalah peringatan lain. CoinGlass melaporkan volume futures ETH sekitar $64,45 miliar dibandingkan volume spot $4,48 miliar, rasio sekitar 14,4 banding satu. Ini menunjukkan pergerakan jangka pendek mungkin lebih didorong oleh leverage daripada akumulasi spot yang tahan lama. Pembacaan ETF ETH spot AS terbaru adalah arus masuk bersih yang moderat sebesar $2,30 juta pada 13 November; terlalu kecil untuk membangun tren permintaan yang berkelanjutan. Agar ETH membangun pemulihan yang kredibel, buktinya perlu meningkat di luar pantulan dari area $1.710. Partisipasi spot harus menguat, minat terbuka harus stabil tanpa pendanaan menjadi positif secara agresif, dan harga harus bertahan di atas zona pemulihan intraday baru-baru ini. Jika harga tergelincir kembali menuju level terendah sementara likuidasi posisi long tetap dominan, pengaturan ulang mungkin masih berproses di pasar. Pertanyaan kunci: 1. Bisakah ETH bertahan di atas area $1.710–$1.800 setelah gelombang likuidasi terbaru? 2. Akankah volume spot berkembang cukup untuk mendukung pemulihan di luar perdagangan derivatif? 3. Apakah penurunan minat terbuka menandakan pengurangan leverage yang lebih sehat, atau sekadar tahap lain dari keluarnya posisi secara paksa? $IMPACTbyTrade

Can a network that sells blockchain data access to everyone survive if the market barely trades its own token? That is the tension around Lava. The project positions itself as a decentralized access layer, where independent providers serve RPC requests and applications pay for reliable connectivity. The problem is real. Many "decentralized" apps still depend on a few centralized RPC vendors, which quietly reintroduces single points of failure. If Lava delivers a credible multi-provider alternative, the technology matters. The screen shows something narrower. LAVA trades at 0.01596 USDT, down 2.15% on the session, with 574.58K displayed beside the ticker. If that is LAVA-denominated volume, the notional is roughly 9,000 USDT. That is my arithmetic, not a confirmed exchange statistic, and I can't verify the time window. It does frame the question: an infrastructure token needs real market depth before any usage story can be priced with confidence. The contradiction sits in who the customer is. Developers buying data access want cheap, predictable costs, not token exposure. Paying in the token is a design choice, not a necessity. If demand comes mainly from incentives, with providers earning rewards for serving requests, the token reflects subsidy rather than consumption. Nothing supplied shows revenue, supply, unlocks or fee data, so I won't pretend to know which one dominates. The bull case is that RPC is a recurring cost for every onchain application. Capturing even a small share of that spend through token-linked settlement could make a sub-two-cent asset look mispriced. The bear case is that centralized providers already compete well on latency and price. Developers switch only when decentralization becomes a purchasing criterion rather than a talking point. The critical risk is that the token's utility can be bypassed. Entrenched competitors plus optional token payments is a hard combination, and thin liquidity makes it worse. When small orders move price, a single-day percentage change says very little. My view: the thesis is plausible, but the evidence in front of me doesn't confirm it. A 2.15% decline on light turnover is noise, not a verdict on fundamentals. The next milestone is verifiable growth in fee-paying request volume, reported separately from incentive-funded activity, along with the share of provider rewards covered by organic fees. That would show whether usage is earning its place rather than being paid for. If Lava's customers could pay in any currency, would the token still be necessary? $LAVAUSDT #IMPACTbyTrade

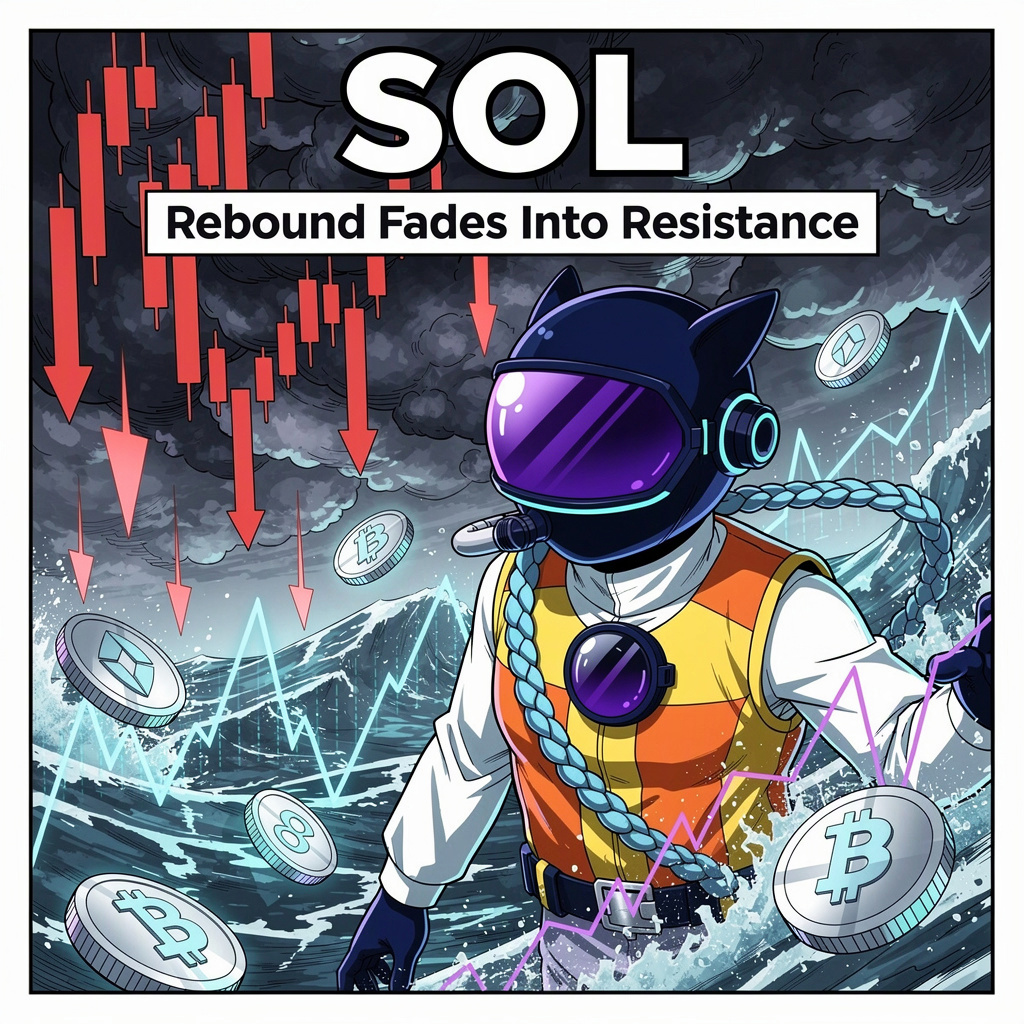
SOLUSDT: Rebound Memudar di Area Resistance
Pantulan harga terakhir terhenti sebelum berhasil melakukan reclaim yang bersih: $SOLUSDT berada di 71,06, sementara candle penutupan terakhir berakhir di 71,42. Sebelumnya, candle merah pukul 12:00 ditutup di 70,76 dan candle merah pukul 14:00 di 69,98, menunjukkan penjual menekan harga lebih rendah sebelum pembeli masuk. Candle hijau pukul 15:00 kemudian ditutup di 71,11 dengan volume terberat dalam urutan tersebut, sebuah respons nyata, tetapi belum menjadi pergeseran kendali yang bertahan lama. Pemulihan berlanjut hingga pukul 19:00, ketika candle hijau ditutup di 72,87, namun dorongan berikutnya ditolak: candle merah pukul 21:00 ditutup di 71,3 setelah rentang terlebar dalam urutan tersebut. Pada pukul 23:00, pembeli hanya mampu mencatatkan penutupan di 71,42. Harga berada di bawah MA7, MA14, dan MA28, jadi rebound tersebut belum memperbaiki struktur per jam. Pergerakan 24 jam turun 2,78%, sementara volume sekitar 1,31x dari hari sebelumnya; aktivitas yang lebih tinggi di tengah penurunan ini membuat pandangan saya tetap bearish, terlepas dari adanya pantulan. Saya memegang spot SOL, dan saya melihat ide short ini sebagai sesuatu yang kondisional, bukan mengejar kelemahan di sini. Zona Entry ada di 70,748 - 71,372; pengujian di sana yang gagal menembus moving average terdekat akan memberikan setup yang lebih bersih bagi penjual. Stop Loss berada di 72,932, dengan TP1 di 69,5 dan TP2 di 67,94. Dari tengah zona tersebut, risiko-terhadap-imbalan (risk-to-reward) yang dinyatakan adalah sekitar 0,8 banding 1 untuk TP1 dan 1,7 banding 1 untuk TP2, jadi target pertama cukup moderat dibandingkan dengan risikonya. Pandangan bearish melemah jika harga berada di atas area stop dan bertahan di sana; hilangnya pijakan kembali setelah gagal reclaim akan mendukung pandangan tersebut. Rentang 24 jam dan candle pukul 21:00 yang lebar adalah pengingat bahwa harga bisa bergerak tajam, jadi saya akan berhati-hati dengan eksekusi dan slippage daripada menganggap level-level tersebut sebagai jaminan. Apa yang Anda cari untuk membedakan reclaim per jam yang nyata dari pantulan yang bisa dipatahkan oleh penjual? Rencana Trading (SHORT / Bearish): • Support: 67,41 / 67,41 | Resistance: 73,65 / 85,82 • Zona Entry: 70,748 - 71,372 • Stop Loss (SL): 72,932 • Target: TP1 69,5 | TP2 67,94 Apa yang Anda cari untuk membedakan reclaim per jam yang nyata dari pantulan yang bisa dipatahkan oleh penjual? Hanya pendapat saya, bukan nasihat investasi.IMPACTbyTrade

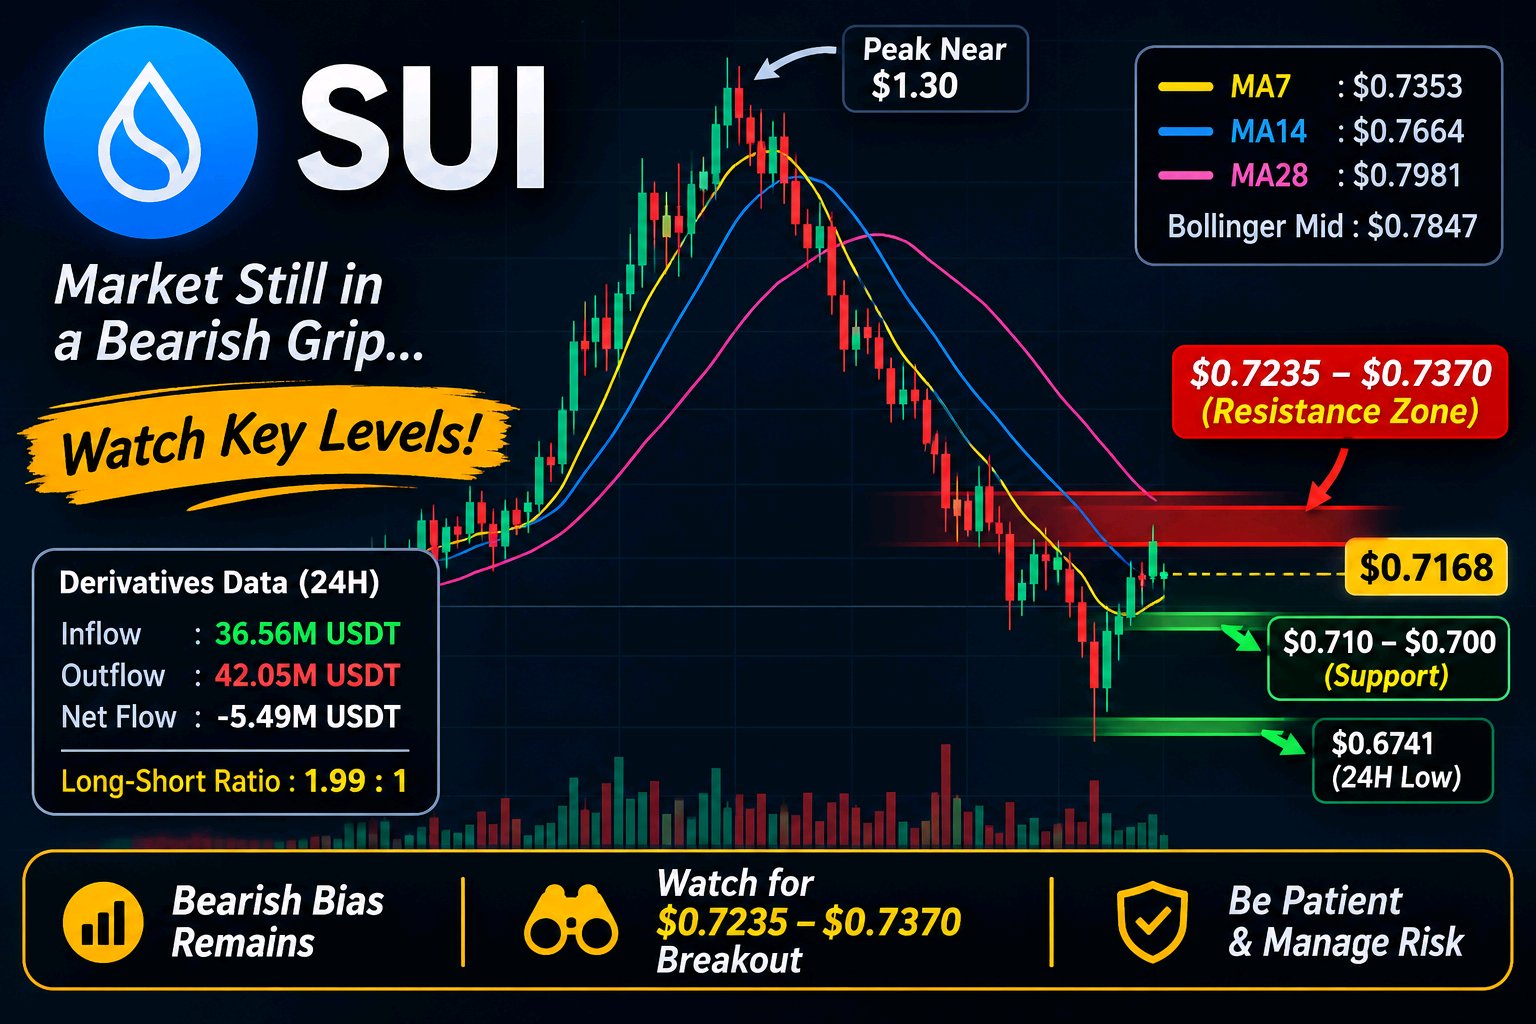
I've been watching $SUIUSDT closely, and what concerns me most right now is that the price is still struggling to build a strong recovery. Trading around $0.7168, SUI remains under selling pressure, and the overall market structure hasn't shown any convincing signs of a bullish reversal yet. There is a small recovery on the lower timeframe, but I don't think it's enough to change the bigger picture. Looking at the 6H chart, the downtrend is quite clear. SUI previously reached around $1.30, but since then, sellers have maintained control, pushing the price into a pattern of lower highs and lower lows. The moving averages support this bearish outlook. MA7 is around $0.7353, MA14 is near $0.7664, and MA28 stands at approximately $0.7981. With the current price trading below all three, buyers still have some work to do before the market can regain strength. Another level I'm paying attention to is the Bollinger middle band around $0.7847. If SUI manages to recover and hold above this area, it could be an early sign that buying momentum is improving. Until then, I would remain cautious. On the 15M chart, SUI has bounced after dropping toward $0.669. However, the recovery is facing resistance around $0.7235–$0.7370. This zone matters because it brings together the short-term moving averages and the upper part of the immediate recovery area. If buyers fail to reclaim it, the current bounce could simply develop into another lower high rather than the beginning of a new uptrend. The derivatives data adds another interesting perspective. The long-short ratio is approximately 1.99:1, showing that long positions are considerably higher than short positions. Meanwhile, 24H derivatives inflows are around 36.56M USDT, while outflows have reached 42.05M USDT, leaving a negative net flow of approximately 5.49M USDT. This suggests that more capital is leaving the derivatives market than entering it. With long positioning already elevated, another downward move could create additional liquidation pressure. For the downside, I'm watching $0.710–$0.700 first, followed by the previous 24H low at $0.6741. On the upside, $0.7386 is the first important level buyers need to reclaim. A stronger recovery would require sustained buying pressure rather than just a temporary bounce. Personally, I'm staying patient with SUI. I'm not treating this as an active long or short position. I want to see how price reacts around these levels before making a decision. Right now, protecting capital and waiting for confirmation makes more sense to me than rushing into a trade. #IMPACTbyTrade
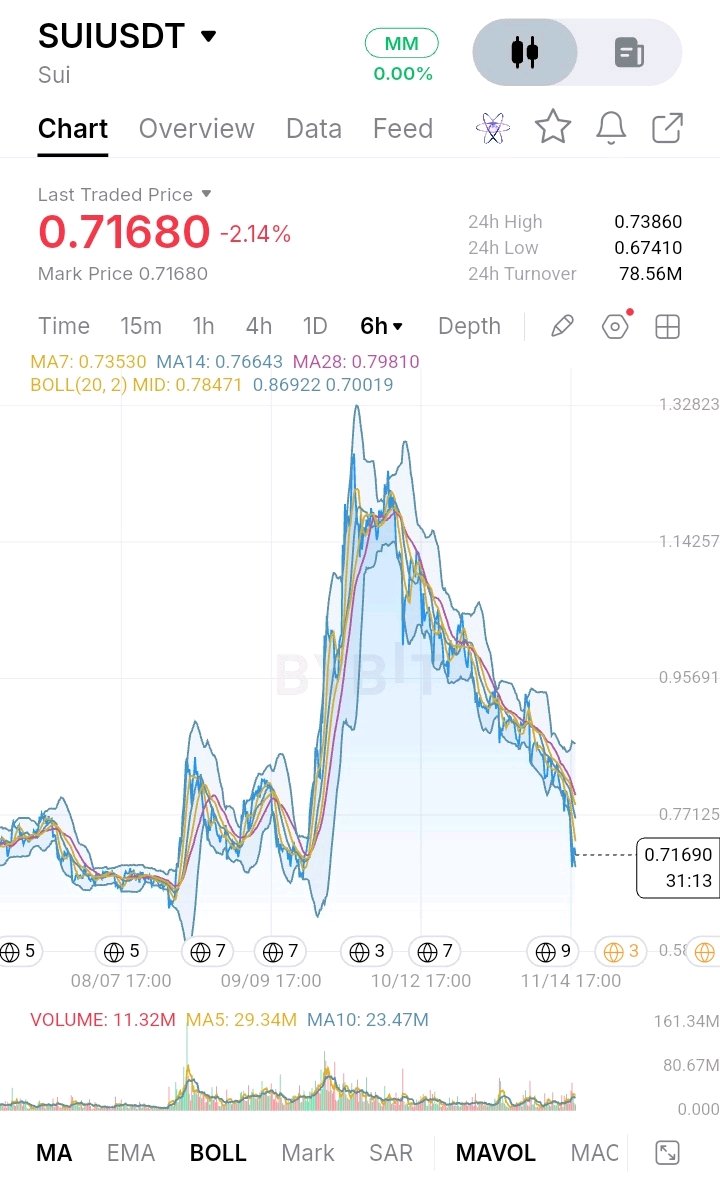
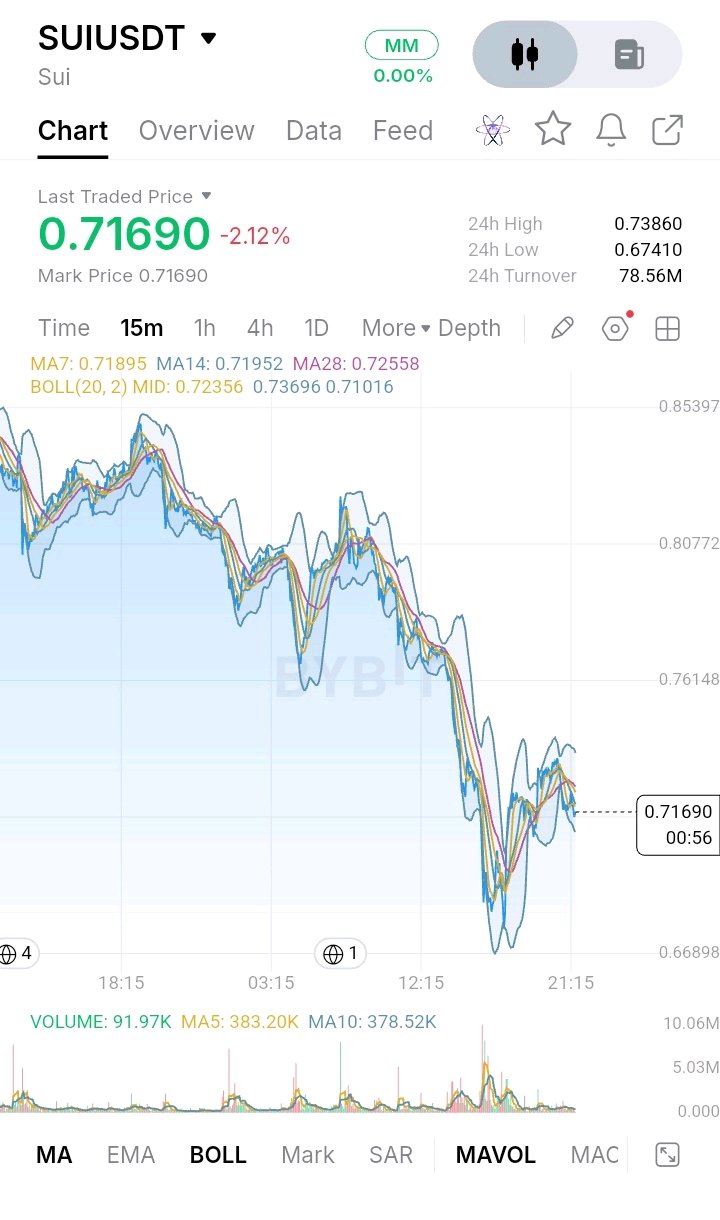

SUI Is Struggling to Hold $0.72 After Its Bounce From $0.6754 — Recovery or Another Breakdown? SUI has recovered sharply from $0.6754, but the rebound is now losing momentum around the $0.72 area. What makes this setup interesting is that buyers managed to recover a significant part of the drop, yet they have not reclaimed the resistance levels needed to change the broader trend. SUI/USDT: $0.7171 | -1.04% The 4H trend remains bearish The moving averages tell an important story: - MA7: $0.7181 - MA14: $0.7502 - MA28: $0.7816 Price is hovering around the 4H MA7 but remains well below MA14 and MA28. Both longer averages are still above the market, showing that sellers retain control of the broader structure. For buyers, reclaiming $0.7392 would be an early improvement. A stronger confirmation would require a sustained move above $0.7502. The 15-minute chart shows fading momentum The lower timeframe is also showing some weakness: - MA7: $0.7196 - MA14: $0.7201 - MA28: $0.7262 SUI is trading below all three short-term averages. The recent recovery has stalled, and the moving-average cluster around $0.7200–$0.7262 is now acting as overhead resistance. Volume adds another caution: current displayed 15m volume is 7.15K, compared with MA5 at 58.36K and MA10 at 55.71K. The rebound is not currently supported by strong trading participation. Key levels to watch Resistance - $0.7200–$0.7262: Short-term moving-average zone - $0.7392: 24H high and immediate breakout level - $0.7502: 4H MA14 - $0.7816: 4H MA28 Support - $0.7000: Nearby psychological and chart level - $0.6754: Recent low and major support Trading outlook Bias: WAIT — bearish structure, with a possible short-term recovery. A sustained breakout above $0.7392 could improve the recovery and bring $0.7502 into focus. Stronger confirmation would come if SUI reclaims the 4H MA14 with convincing volume. If price continues to struggle below $0.7262 and loses $0.7000, sellers could push it toward $0.6754 again. A decisive breakdown below $0.6754 would invalidate the current recovery structure and signal renewed downside pressure. I would avoid chasing either direction while price remains trapped between nearby support and resistance. The next confirmed move matters more than the temporary bounce. Do you think SUI can reclaim $0.7502, or will sellers push price back toward $0.6754 first? What are you watching on the 4H chart?$SUIUSDT #IMPACTbyTrade

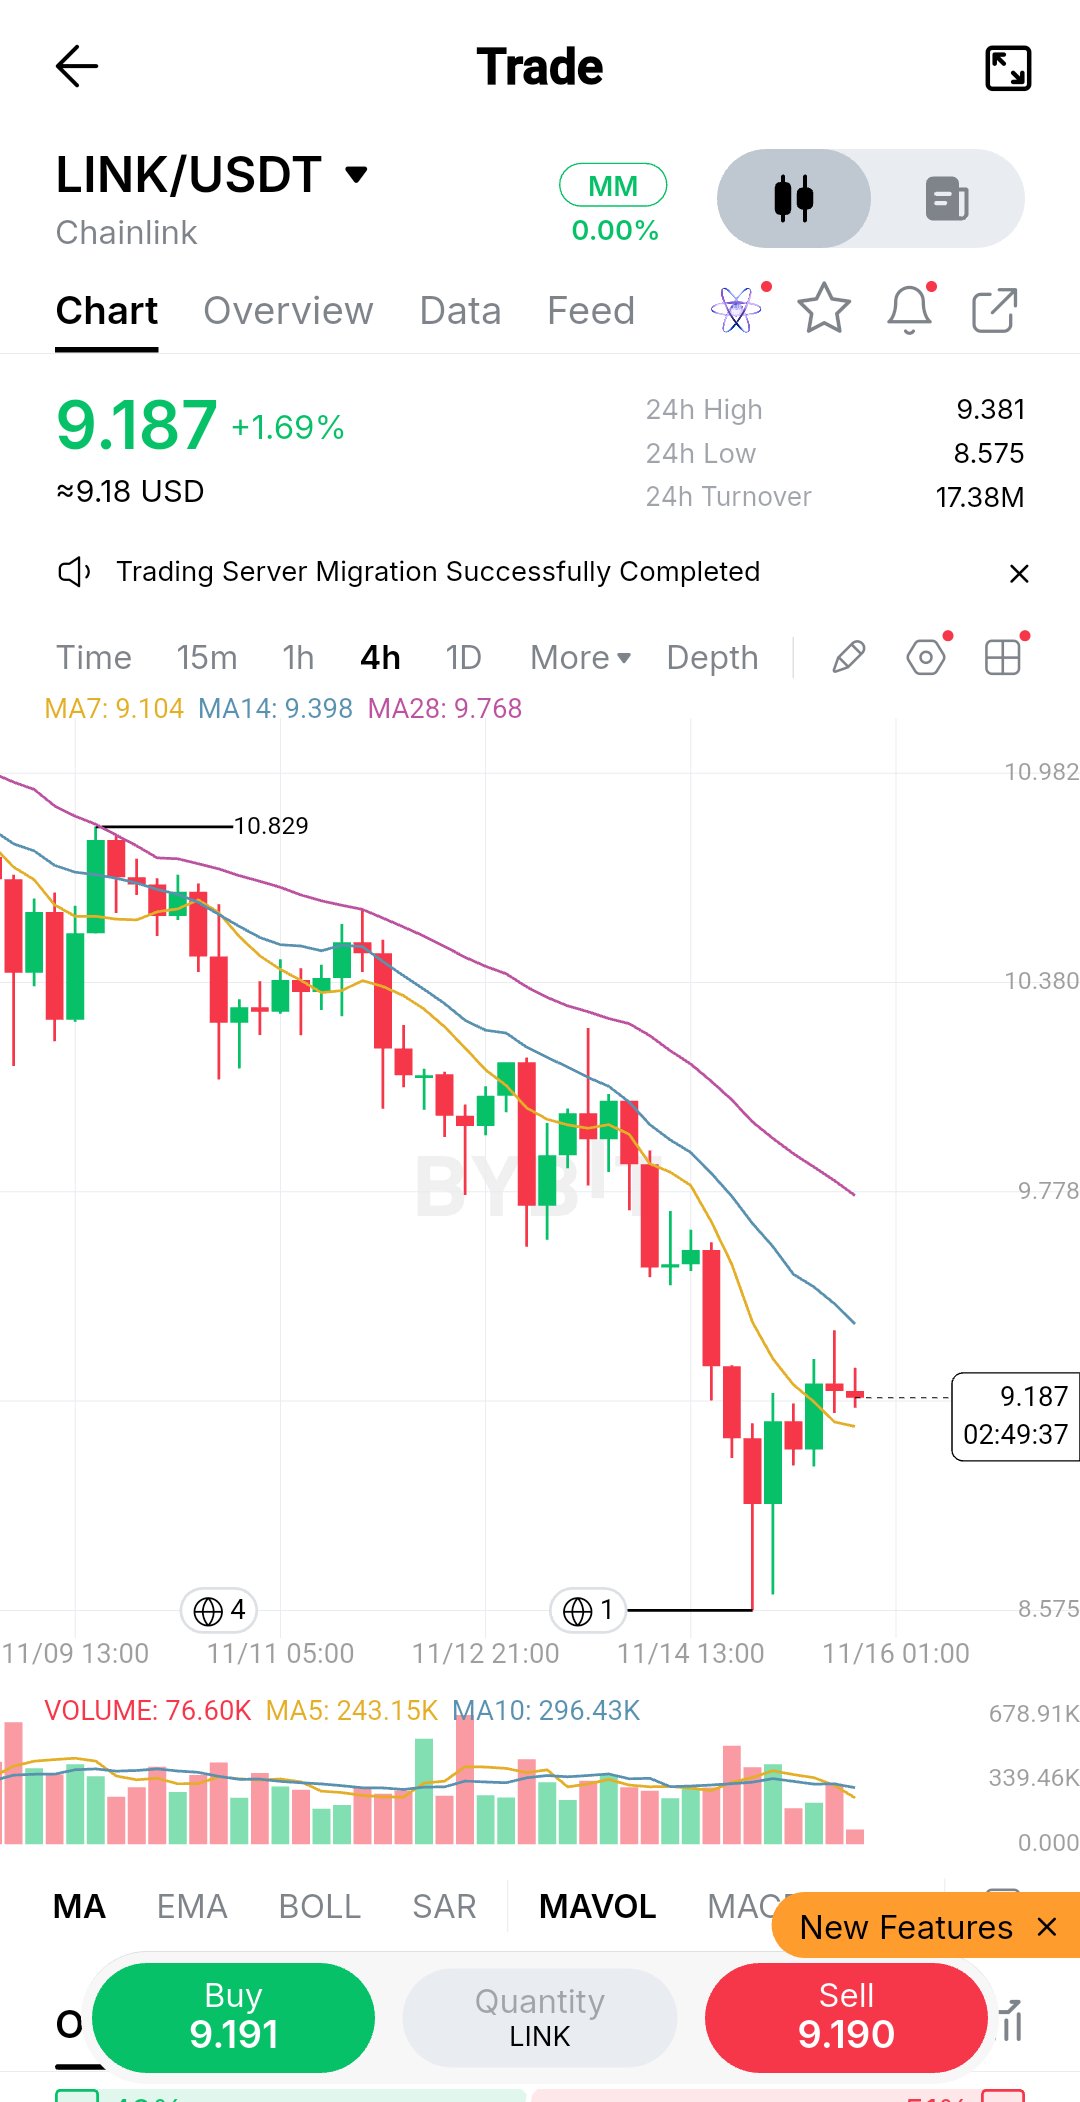
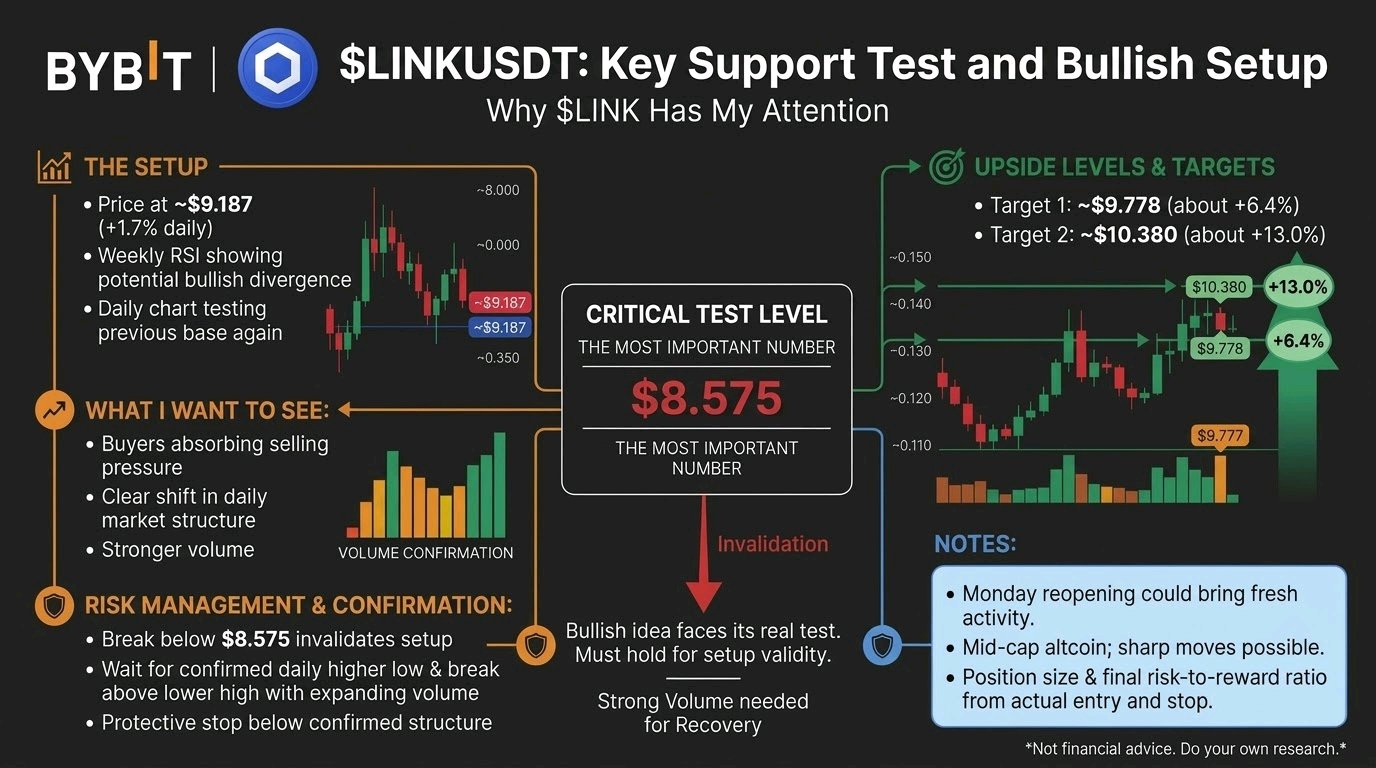
One red line. Two upside levels. This is why $LINKUSDT has my attention. The most important number on my chart is $8.575. That's where my bullish idea faces its real test. The setup $LINK is up about 1.7% on the day at roughly $9.187 after a bounce off the lows, and it is trading far below its prior highs after a steep multi-day slide. Weekly RSI analysis suggests a possible bullish divergence. The daily chart has already shown an initial reaction, and price is now testing that base again. What I want to see is buyers absorbing the selling pressure, followed by a clear shift in daily market structure. If that happens with stronger volume, I'm watching two swing levels: 🎯 Target 1: ~$9.778 (about +6.4% from $9.187) 🎯 Target 2: ~$10.380 (about +13% from $9.187) These are ambitious scenarios, not guaranteed returns. Monday's reopening of traditional markets could bring fresh activity, but $LINK needs its own buying volume to support a meaningful recovery. As a mid-cap altcoin, sharp moves can happen in either direction. Management: If price breaks below $8.575 and cannot recover that level, my bullish setup is no longer valid. For a new position, I want a confirmed daily higher low, a break above the latest lower high, and expanding volume. The protective stop belongs below the confirmed structure. Position size and the final risk-to-reward ratio must be calculated from the actual entry and stop, not assumed in advance. I'm heavily bullish on $LINK's recovery potential, but the next volume-backed move will determine whether this remains a promising chart or becomes a trade worth taking. Not financial advice. Do your own research and manage your risk. #IMPACTbyTrade

GLMR/USDT — Buyers Have Finally Stepped In, But Can They Turn This Bounce Into a Real Reversal? GLMR has caught my attention after the latest move. After spending weeks under selling pressure, buyers have suddenly stepped in and pushed the price toward $0.00790. The move is strong, and the volume makes it worth watching. But I don't want to confuse one powerful green candle with a confirmed trend reversal. There are still a few important levels that buyers need to overcome. What I'm seeing on the Daily chart GLMR is trading around $0.00778, with the latest daily candle showing a gain of nearly 38%. The first thing I noticed is that price has recovered above the EMA7 at $0.006862 and EMA14 at $0.007170. It is also approaching the EMA28 at $0.007711. However, the MA28 at $0.007912 is still an important overhead level. This means the recovery is improving the daily picture, but buyers haven't cleared every major resistance yet. Volume is particularly interesting. Daily volume has reached 46.39M, compared with the MA5 at 21.67M and MA10 at 20.71M. That's a meaningful increase in participation and gives this move more weight than a low-volume bounce. The daily RSI readings are also improving: - RSI6: 62.85 - RSI12: 52.26 - RSI24: 48.82 MACD is still slightly negative, with DIF at -0.000581 and DEA at -0.000554. So the daily momentum has not completely turned bullish yet. The 4H chart is showing something more encouraging This is where the recovery becomes more interesting. Price has moved above all the displayed short-term moving averages: - EMA7: $0.006765 - EMA14: $0.006479 - EMA28: $0.006519 - MA7: $0.006351 - MA14: $0.006203 - MA28: $0.006479 The 4H MACD has also moved into positive territory. DIF is at 0.000011, DEA at -0.000222 and the histogram at 0.000234. That's an improvement in short-term momentum. But there is one thing I wouldn't ignore: RSI6 has reached 76.59, while RSI12 is at 69.65 and RSI24 at 61.44. Short-term momentum is now quite stretched. Buyers may still push higher, but a pullback or consolidation wouldn't surprise me. The price levels I am watching Here are the areas that matter most to me: - $0.008385 — Recent high and immediate breakout resistance. - $0.00791–$0.00792 — Daily MA28 resistance zone. - $0.007823 — Important 4H Fibonacci reference level. - $0.00717–$0.00686 — Daily EMA14 and EMA7 support area. - $0.00675–$0.00620 — Important 4H moving-average support cluster. - $0.006034 — Additional downside reference from the displayed Fibonacci tool. - $0.005411 — Recent low and major structural support. What would make me more confident? I want to see GLMR hold above the $0.00782–$0.00792 region rather than simply touch it and fall back. If buyers manage to establish support above this zone, the next important test will be $0.008385. A convincing break above that high, supported by sustained volume, would make the recovery considerably more interesting. Beyond that, $0.00876 becomes the next visible chart reference. On the other hand, if price gets rejected around $0.00791–$0.008385 and starts losing $0.00717, I'll be watching for a deeper pullback toward the $0.00675–$0.00620 area. A move back below $0.005411 would seriously damage the current recovery structure. How I would approach a trade I wouldn't chase GLMR after a nearly 38% daily move. For a long setup, I'd rather wait for a pullback and see whether the $0.00782–$0.00792 region can hold as support. A confirmed breakout above $0.008385 followed by a successful retest would be another possible setup. For an invalidation level, the $0.00717 area is an important first reference, while a deeper structural failure below $0.00620 would weaken the recovery further. The actual stop should depend on the entry and position size. My view is that GLMR has finally shown buyers are willing to defend the market, and the 4H momentum supports that improvement. But the daily chart still needs confirmation. I want to see buyers prove they can hold the reclaimed levels, not just produce one impressive candle. The bounce is real. Whether it becomes a trend reversal is the next question. $GLMRUSDT #IMPACTbyTrade

BNBUSDT: A $1.19B Token Burn Couldn't Prevent the Sell-Off. Here's What Matters Now. BNB's latest correction is exposing an interesting contradiction: its token supply continues shrinking, but market demand is not strong enough to protect price. BNB is trading around $590–$599, following a sharp decline from the $680 region. On November 14, it dropped 7.68%, and the November 15 session has so far produced a rebound from approximately $566. That recovery deserves attention, but I wouldn't call it a trend reversal yet. The supply story is improving. The demand story is not. On October 19, BNB completed its 37th quarterly burn, permanently removing 1,646,196.44 BNB, worth approximately $1.197 billion at the time. This is more than a headline event. BNB's Auto-Burn mechanism gradually reduces supply toward a target of 100 million tokens. Additionally, BEP-95 burns a portion of gas fees generated through BNB Chain activity. There is a structural supply-reduction mechanism behind the asset. But here's the overlooked part: a token burn reduces available supply; it does not guarantee immediate buying pressure. Derivatives are revealing the weakness. Current aggregated market data shows: - Futures volume: approximately $1.33B. - Spot volume: approximately $193M. - Open interest: approximately $962M, down around 0.86% over 24 hours. - Funding: slightly positive at approximately 0.0008%. - Liquidations: approximately $13.4M, with roughly 97% coming from longs. Futures activity is almost seven times spot volume. More importantly, both spot and futures flows have recorded net selling over the past seven days. This suggests the correction isn't simply a temporary leverage reset. Actual spot demand also needs to improve. What the chart is telling me The $566–$582 region is becoming an important short-term demand area after the latest sell-off. The market has bounced from that zone, but buyers still need to establish control. My key levels: - $566: Recent session low. Losing this level would weaken the recovery attempt. - $582: Important short-term price reference from the previous daily close. - $600–$612: Immediate recovery territory where buyers need to demonstrate strength. - $630: A more meaningful resistance area following the recent breakdown. On the 15M, I want to see higher lows rather than another short-lived bounce. On the 1H, holding above $600 would improve the immediate structure. On the 4H, reclaiming $630 would provide stronger evidence that sellers are losing control. The broader market matters too. Binance Research's November report highlighted rising inflation, stronger expectations of a December Fed rate hike and weaker institutional demand as important pressures on crypto markets. BNB cannot completely escape that environment, regardless of its own token-burning mechanism. My approach is conditional: If buyers defend $582 and reclaim $612 with stronger spot participation, recovery toward $630 becomes more credible. If $566 breaks decisively, I would avoid assuming that the recent bounce represents a bottom. BNB's tokenomics are reducing supply, but the market is demanding something more important right now: evidence that real buyers are willing to absorb the available selling pressure. A burn supports the long-term supply story; demand must prove the short-term price story. $BNBUSDT #IMPACTbyTrade
$XRPUSDT terjepit di antara rebound tajam dari level terendah dua tahun dan tren turun yang masih utuh. Di harga sekitar $0,958 pada tanggal 15 November, aset ini naik 4,78% dari penutupan harian sebelumnya, setelah sempat diperdagangkan serendah $0,8993. Pantulan ini penting, tetapi belum mengubah struktur pasar: XRP tetap berada di bawah $1, di bawah EMA20 4 jam di dekat $0,991, dan jauh di bawah EMA20 harian di dekat $1,131. Pasar bertanya-tanya apakah pembeli telah menemukan permintaan nyata—atau apakah mereka hanya merespons kepanikan jual (oversold flush). Ujian terdekat adalah kisaran $0,9795–$0,9983. Zona tersebut menggabungkan harga tertinggi intraday baru-baru ini, area support $1 sebelumnya, dan EMA20 4 jam. Pergerakan singkat di atas level tersebut saja tidak cukup. Saya ingin melihat XRP bertahan di atas zona tersebut pada pengujian ulang (retest), dengan pembelian spot yang signifikan dan pembangunan kembali open interest. Jika tidak, reli tersebut bisa jadi hanya berupa penutupan posisi short atau penyesuaian posisi, bukan permintaan baru. Penurunan di bawah $0,943 akan melemahkan pantulan jangka pendek; $0,8929, level terendah baru-baru ini, adalah support yang lebih krusial. Jika level itu jebol, pasar belum menunjukkan basis yang kuat di dekatnya. Gambaran teknis yang lebih luas tidak ambigu, meskipun bukan sinyal waktu yang pasti. XRP turun 17,2% selama 7 hari dan 28,0% selama 30 hari. RSI harian berada di 24,3, angka oversold, namun pasar yang oversold bisa tetap lemah. Pada grafik 1 jam, harga berada di dekat EMA20 dan di bawah EMA50 di sekitar $0,976; pada grafik 4 jam, harga tetap berada di bawah EMA20 dan EMA50. Fakta-fakta ini membuat kita perlu berhati-hati terhadap pantulan tersebut, namun keberhasilan merebut kembali $0,9983 akan membuat interpretasi bearish menjadi kurang kuat. Gambaran derivatif bercampur. Pendanaan (funding) sedikit negatif di seluruh bursa yang dipantau, dengan tingkat tertimbang sebesar -0,011% per 8 jam; posisi short membayar posisi long, yang dapat membuat posisi short menjadi mahal dan memberikan ruang untuk short squeeze. Namun, ini bukan bukti bahwa squeeze sedang terjadi. Open interest OKX turun 9,4% selama 7 hari, tetapi itu hanya satu bursa, dan open interest dalam denominasi dolar dapat turun hanya karena harga token turun. Data long/short juga bertentangan: akun-akun secara bersih bersifat long (net long), sementara posisi trader teratas cenderung short. Likuidasi terbaru yang dilaporkan paling menghantam posisi long, tetapi angka yang tersedia tidak menetapkan klaster likuidasi yang tepat atau membuktikan adanya deleveraging di seluruh pasar. Kita masih harus bertanya: jika harga naik, apakah open interest tumbuh bersamanya, atau posisi short hanya menutup posisi di tengah permintaan yang tipis? Ada hambatan fundamental yang nyata, tetapi waktu terjadinya kurang jelas. Dana spot XRP di AS mencatat arus keluar bersih sebesar $6,48 juta selama 5 hari dan $1,18 juta selama 20 hari, meskipun sesi terakhir yang dilaporkan positif. Pasokan stablecoin XRPL dan nilai yang terkunci (value locked) masing-masing turun sekitar 25% selama 30 hari. Itu adalah tanda-tanda melemahnya permintaan marjinal dan modal jaringan, bukan bukti bahwa hal tersebut menyebabkan aksi jual minggu ini. Laporan transfer 240 juta XRP tidak mencapai bursa, dan pembacaan saldo bursa diperdebatkan karena dompet yang baru dilacak mengubah totalnya. Keduanya tidak membuktikan adanya gelombang deposit di sisi jual. Tidak ada pengumuman baru yang terverifikasi atau pembukaan kunci token (token unlock) dalam berita terbaru yang secara jelas menjelaskan pergerakan tersebut; 36,5% dari pasokan maksimum tetap di luar sirkulasi, sebuah pertimbangan pasokan jangka panjang, bukan bukti pelepasan segera. Menurut analisis saya, kelemahan kripto secara luas, ketakutan ekstrem, arus keluar ETF, dan likuidasi posisi long menjelaskan tekanan tersebut dengan lebih baik daripada satu peristiwa spesifik XRP mana pun. Namun, kita kekurangan data spot CVD, ketidakseimbangan order-book, dan bukti arus whale yang dapat diandalkan, sehingga klaim akumulasi atau distribusi masih terlalu dini. Kasus bull membutuhkan keberhasilan merebut kembali $0,9983, yang didukung oleh permintaan spot; kasus bear menguat jika $0,943 gagal dipertahankan dan terutama jika $0,8929 jebol. Pihak mana yang sebenarnya mengambil inisiatif—pembeli spot atau trader dengan leverage—dan akankah pergerakan berikutnya pada open interest mengonfirmasinya?#IMPACTbyTrade
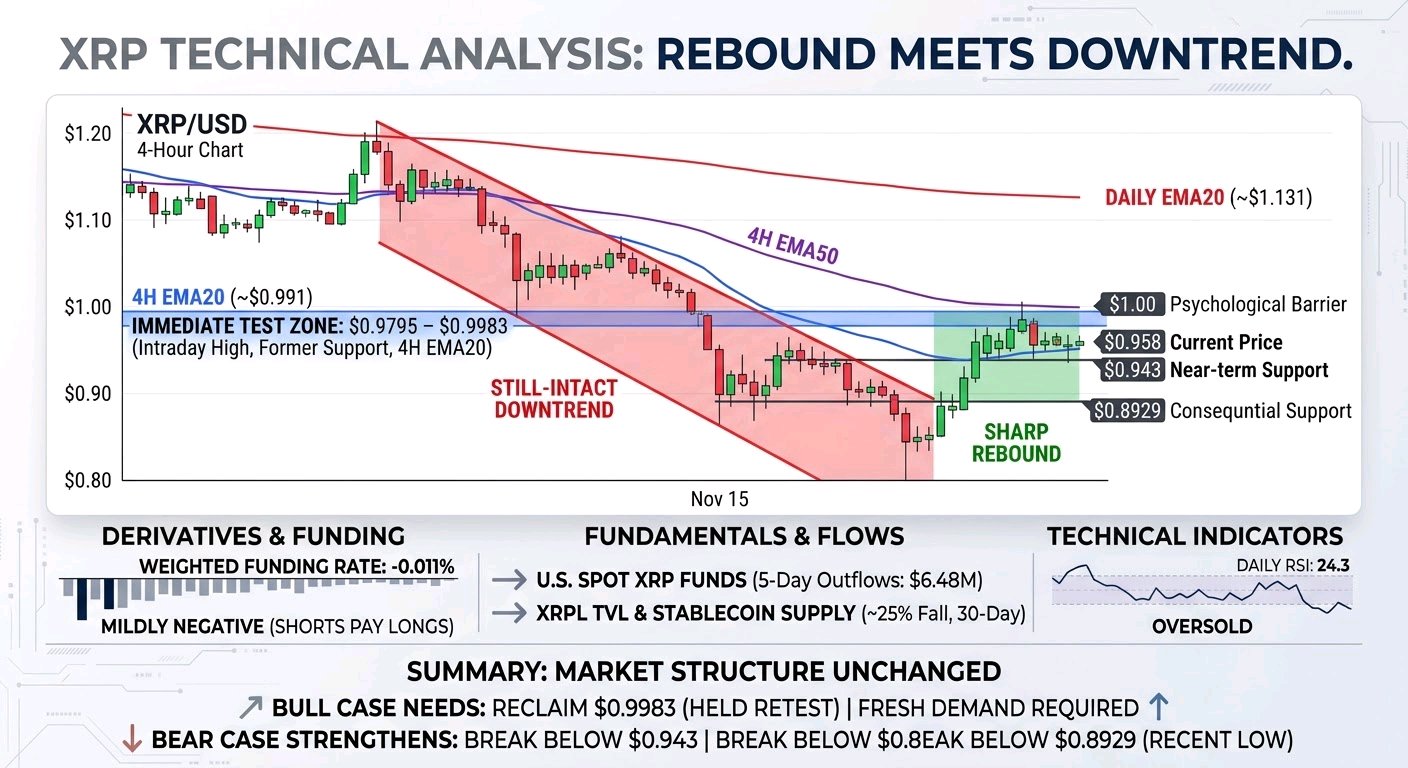

NVDA has gone from a hard slide to a quiet base, and a quiet base is the kind of chart where I'd rather buy a small dip than chase the high. The chart attached is only background on the bigger picture. The trade below stands on today's Bybit 1h and 15m charts alone. $NVDAXUSDT is at 161.55 (+1.12%), inside a 24h range of 156.15 to 161.74 That puts it 97% of the way up the range, 3.5% above the low and 0.1% under the high. Turnover is 54.23M. The levels I'm watching: Up: 161.74 (24h high) -> 163.99 (chart gridline, an area) -> 171.84 (1h chart high) Down: 160.89 (1h MA7) -> 160.80 (1h MA14) -> 160.70 (15m MA14) -> 160.35 (1h MA28) On the 1h, price is over MA7 (160.89), MA14 (160.80) and MA28 (160.35), by 0.4%, 0.5% and 0.7% The three have flattened and bunched after the slide from 171.84, so I read 160.35 to 160.90 as one support zone, and price is only now stepping away from it. On the 15m, price is over MA7 (160.85), MA14 (160.70) and MA28 (160.84), by 0.4%, 0.5% and 0.4% All three are tightly stacked and turning up, and the last candles are a clean run of green into the 24h high. I don't want to buy the top of that run, I want it to come back to the stack. I'm watching volume. The 15m bar is 2.79K against MA5 2.66K and MA10 2.38K with 06:42 left, so the push is above both averages but still forming. The 1h bar is 12.87K against 8.80K and 8.64K with 06:37 left, also above both. Participation is picking up on the way up, which is what I want from a base, but it is still small next to the flush earlier in the week. The trade, buying the dip into the stack: - Entry: 160.60 to 161.00 (limit, needs a 0.3% to 0.6% dip) - Stop: below 159.90 - Target 1: 162.30 (~1.7R from 160.80) - Target 2: 163.60 (~3.1R) Invalid if the 15m closes below 159.90, because that loses the 1h MA28 and the whole stack together. My thinking is to stay small, since this is a TradFi perp with thin liquidity and price is already at the 24h high. Limit orders, small size, and no dip, no trade. #IMPACTbyTrade
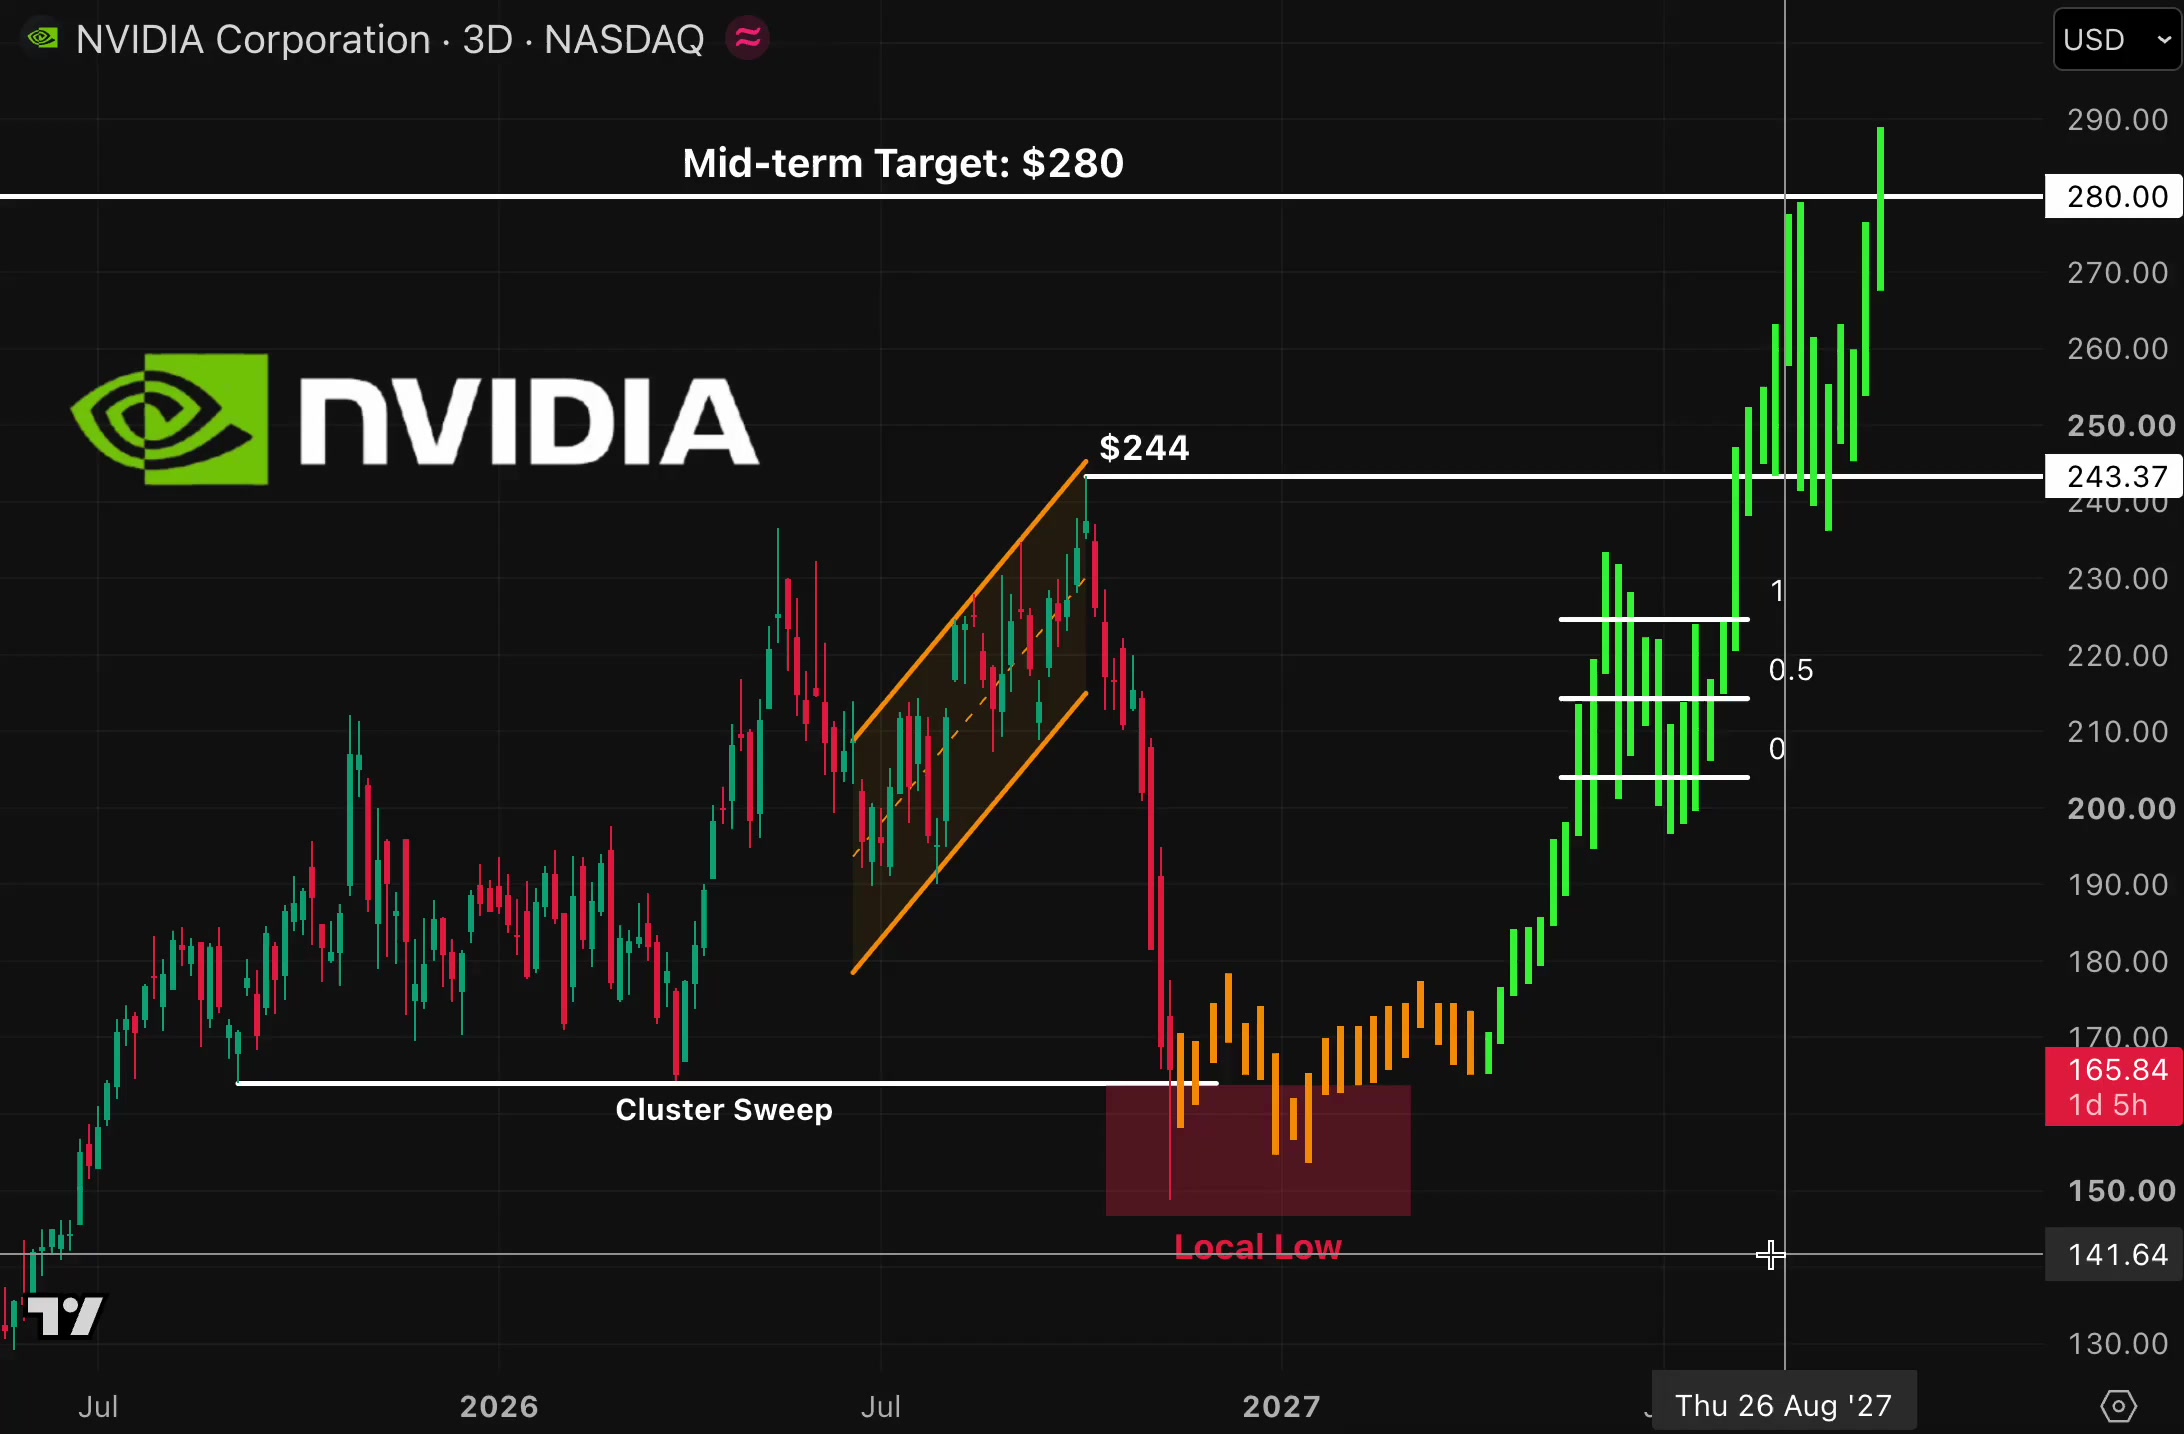
SOLANA ($SOLUSDT): Can Bulls Turn the Momentum Around? Solana is facing a challenging market environment, and traders are watching closely for signs of strength. Here are three things I am monitoring: Whether buyers defend the recent support area. Whether trading volume starts recovering. Whether SOL can build a stronger market structure. A recovery needs confirmation, not just hope. SOL community: Are you waiting for a bullish reversal or expecting more downside? #IMPACTbyTrade

$GRAMUSDT – SELLING PRESSURE IS STILL PRESENT, BUT I'M WATCHING THE $1.06 RECLAIM FOR A POSSIBLE RECOVERY $GRAM is approaching an important decision zone, and I'm paying close attention to how price reacts around the $1.01–$1.04 support area. The market is showing mixed signals. While the 4H structure has some recovery potential, the 1H and daily trends remain under pressure. I don't want to assume a bullish reversal before buyers prove they can take control. Market Overview GRAM is trading around $1.04–$1.05, with recent price action showing continued weakness after a significant decline. On the broader timeframe, the monthly performance remains negative, suggesting that sellers still have the advantage in the bigger picture. I'm monitoring the 1H and 4H charts closely. A sustained move above $1.063 would be the first indication that short-term momentum is improving. The next important resistance sits around $1.078, followed by the $1.098–$1.14 region. Volume Analysis GRAM has maintained meaningful trading activity, with recent market data showing approximately $105M in futures volume and $38M in spot volume over 24 hours in one reported snapshot. However, trading activity alone doesn't confirm accumulation. Recent order-flow data also showed negative cumulative volume delta, indicating that aggressive selling has been outweighing buying across tracked markets. For me, the important signal will be whether spot buyers start supporting the recovery rather than relying entirely on futures activity. My Trading Plan I'm interested in a potential recovery setup, but I want confirmation before committing to a position. Initial Entry Zone: $1.014–$1.035 Preferred DCA Level: $0.990–$1.010, only if support holds and buyers show a clear reaction. First Resistance: $1.063–$1.078 Primary Target: $1.098 Additional Upside Potential: $1.14–$1.185 if momentum strengthens and price establishes acceptance above the previous resistance zones. My preferred confirmation is a strong 4H recovery followed by a successful retest. I don't want to chase a sudden green candle without evidence that buyers are taking control. What Could Go Wrong? The biggest risk is another breakdown below the $1.014 support area. If sellers push price below this level, the $0.990 region becomes an important structural support to watch. A sustained 4H breakdown below $0.990 would significantly weaken my recovery expectations and could open the door to another downward move. I also want to see improving spot demand. If futures activity increases while spot buying remains weak, any recovery could struggle to maintain momentum. Risk management remains essential. I would rather miss an entry than hold a position through a confirmed structural breakdown. My Perspective GRAM is interesting because price is approaching a major support region while trading activity remains relatively strong. However, I don't see enough confirmation to call this a confirmed bullish reversal yet. My focus is on three things: 1. Whether $1.014–$1.035 attracts genuine buying interest. 2. Whether GRAM can reclaim $1.063 and challenge $1.078. 3. Whether spot volume starts supporting upward price movement. My expectation is a possible short-term recovery if buyers defend the current support region. A move toward $1.098 and potentially $1.14 becomes more interesting after resistance is reclaimed. For now, I'm staying patient. The support reaction and the $1.063 breakout will tell me much more than simply guessing the next direction. $GRAMUSDT #IMPACTbyTrade
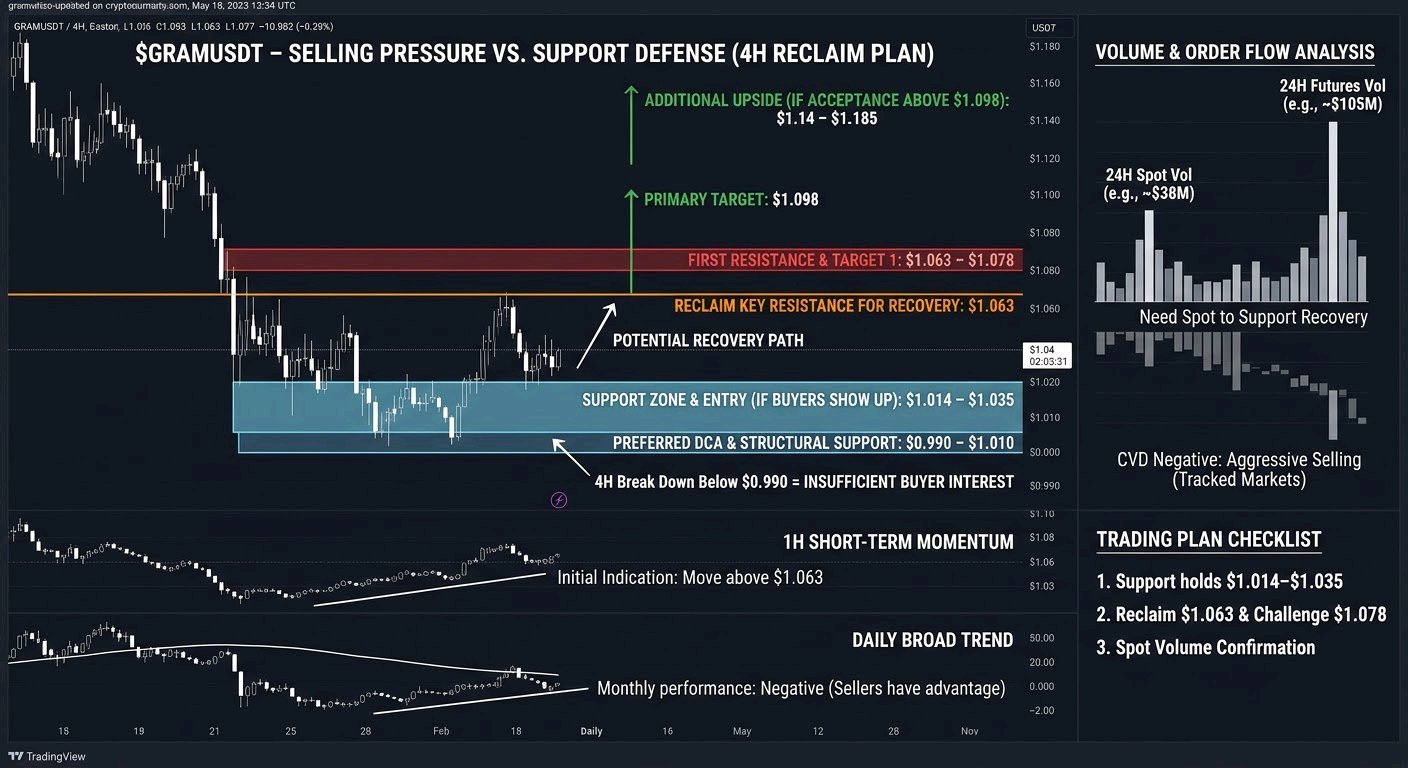

AVAX daily chart still locked in a clear downtrend
$AVAXUSDT is trading at 7.155 after a sharp -4.29% move, sitting well below the declining MA7, MA14 and MA28 on the daily timeframe. 📊 Market Structure: The chart shows a sustained series of lower highs and lower lows from the 11.654 area down to current levels. Price remains under the downward-sloping moving averages (MA7 at 8.050, MA14 at 8.189, MA28 at 8.597), confirming the bearish structure. A large red candle printed recently, followed by a small green candle near 7.155. 24h range sits between 6.725 and 7.573. 🎯 Potential Setup: Direction: WAIT Entry: unclear TP1: unclear TP2: unclear SL / Invalidation: unclear ⚠️ Confirmation: A clean break and hold below the recent 24h low of 6.725 with expanding volume would support continuation of the downtrend. Reclaiming and holding above the declining MA7 would be the first sign of potential stabilization. ❌ Invalidation: A sustained daily close back above the MA7 (currently 8.050) would weaken the immediate bearish structure and suggest the downtrend is losing momentum. 🧠 Risk Note: Position size carefully in this environment. The daily structure remains bearish, but sharp daily drops can produce short-term bounces. Always define risk before entry and avoid oversized positions. #IMPACTbyTrade
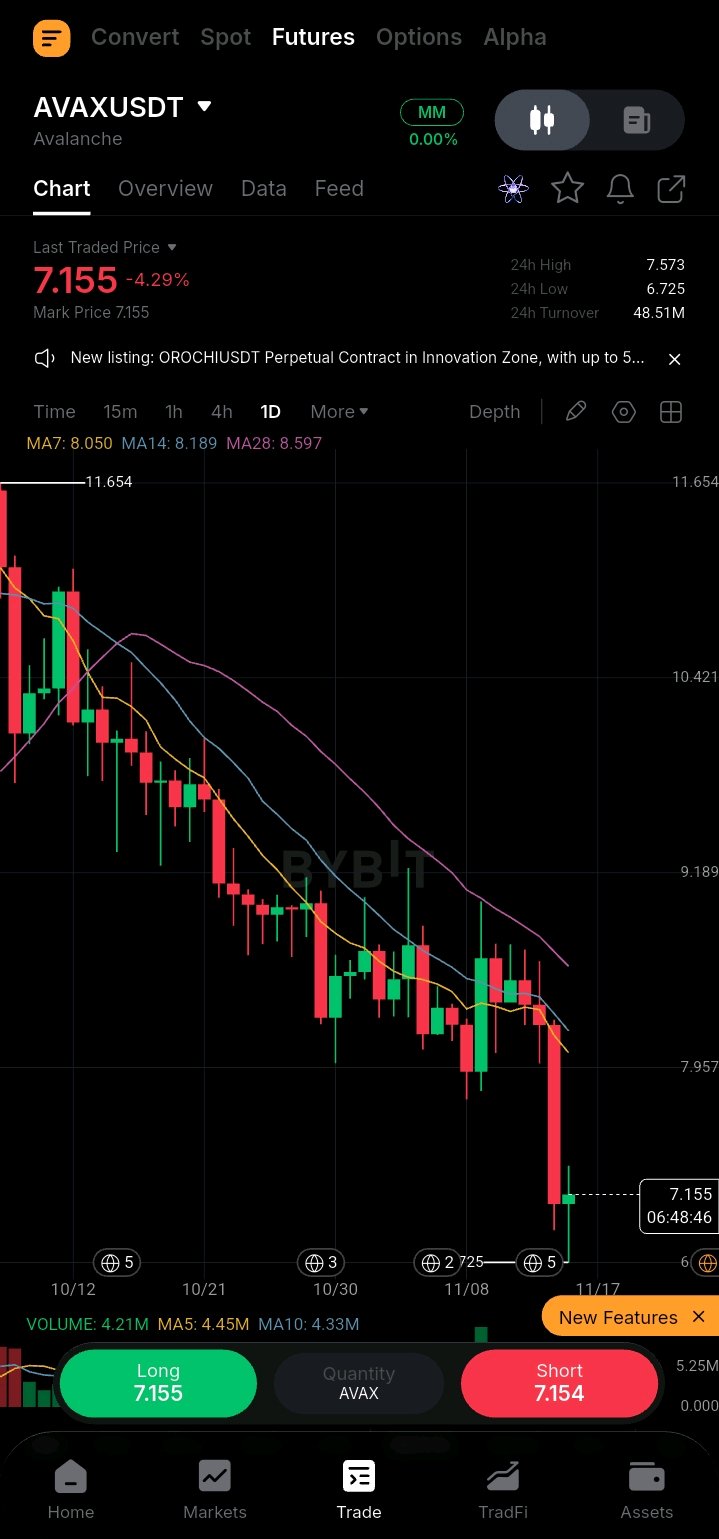
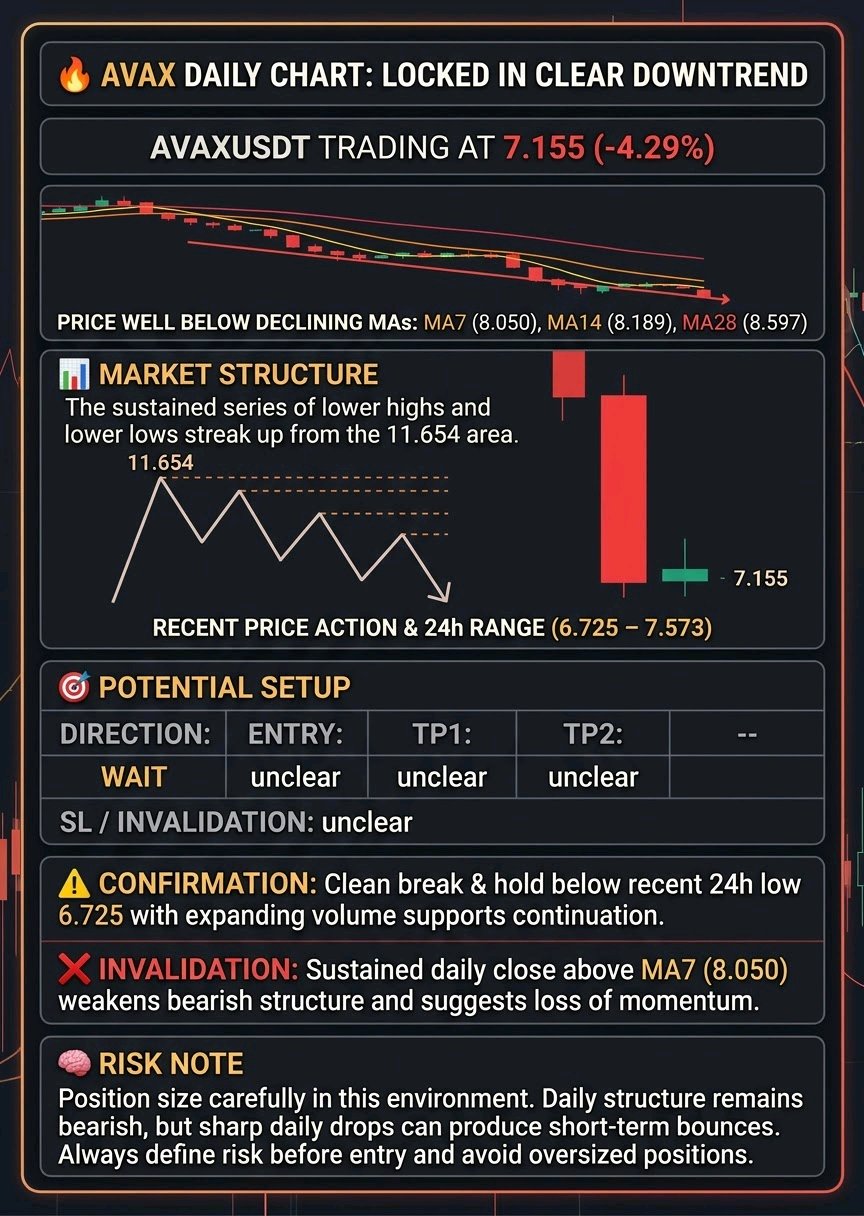
BR is trading near $0.4277 on Bybit, down roughly 1% on its exchange snapshot, while broader data shows a sharper daily decline. After pulling back from $0.47, the key test is whether buyers defend $0.416–$0.420. Market Snapshot CoinGlass showed an aggregate quote near $0.4415, while its Bybit exchange table showed $0.4277; I’m using the Bybit-specific quote for this trading read. CoinGlass reported a 24-hour range of $0.4164–$0.4732, market cap near $132.25 million, fully diluted valuation around $441.5 million, and spot volume near $1.06 million. Futures volume was about $15.66 million, almost 15 times spot turnover. CoinGlass lists 301.67 million circulating against a 1 billion maximum, though other trackers report a lower float. Treat the exact circulating figure cautiously; most of the maximum supply is not yet in circulation. Derivatives and Positioning Aggregate OI is $21.49 million, down 4.47%. Funding is positive near 0.025%, meaning longs are paying shorts. Liquidations were $48,900, about 96% from longs. Price weakness alongside positive funding and long liquidations suggests leveraged buyers have been caught leaning into the market. Bybit’s table showed BRUSDT futures volume near $1.29 million and OI around $1.89 million, down about 5.9%. Funding remains positive, so crowded longs may still need to unwind. A recovery with stronger spot volume would be healthier than a futures-only spike. Technical Structure Support sits at $0.420–$0.4164. A hold and reclaim of $0.435 would suggest buyers are absorbing supply. Above that, watch $0.450, then $0.470–$0.473 resistance. If $0.4164 fails on expanding volume, watch $0.400 and then $0.380. A quick reclaim after a wick below support would weaken the bearish case; repeated closes beneath it would strengthen it. Fundamentals and Product Activity Bedrock builds Bitcoin-focused DeFi infrastructure through uniBTC, brBTC and liquid-staking assets including uniETH and uniIOTX. The thesis is to make Bitcoin capital productive across DeFi and multiple networks. DefiLlama’s uniBTC dashboard reported TVL of about $247.8 million, but that figure had fallen around 29% over 30 days, from approximately $355 million on October 16 to $258 million on November 14. That contraction suggests capital has been leaving the product. The dashboard showed just $1,047 in 30-day uniBTC fees and revenue, with zero holder revenue. TVL is deposited capital, not sustainable income or direct value flowing to BR holders. Stronger fees and retained liquidity are needed. Token Utility and Governance BR is Bedrock’s governance and reward token. Locking it creates veBR, which provides voting rights over protocol decisions and gauge incentives. This utility does not mean holders automatically receive protocol revenue. Long-term demand depends on reasons to lock BR beyond emissions. Watch governance participation, product usage, liquidity and fee growth. Tokenomics and Unlock Risk BR has a 1 billion maximum supply. Tokenomics.com lists 20% strategic reserve, 20% team, 18.5% marketing, 14.5% future incentives, 12.5% seed investors, 5.5% airdrop, 5% IDO and 4% liquidity. Its vesting page lists a December 20, 2026 unlock of approximately 70.8 million BR, or 7.1% of total supply, allocated to insiders and private investors. Trackers disagree on supply and vesting, so verify the official schedule. Even so, a release this large relative to market cap is a material risk when spot liquidity is thin. Trading Scenarios Bullish case: defend $0.4164, reclaim $0.435 and then break $0.450 with rising spot volume. A sustained break above $0.473 could open $0.50. Bearish case: lose $0.4164 and fail to reclaim it. That would keep sellers in control and put $0.400, followed by $0.380, on the radar. Positive funding and weak spot turnover make a leveraged bounce vulnerable to another flush. Here’s the level map I’m tracking: - Immediate support: $0.420–$0.4164 - Resistance: $0.435, then $0.450–$0.473 - Bullish confirmation: sustained break above $0.473 with stronger spot participation - Bearish signal: breakdown below $0.4164 and failed reclaim My view is cautious. Bedrock has a BTCFi product suite and governance utility, but falling TVL, low reported fees, positive funding and the upcoming unlock deserve respect. I want spot demand before chasing a futures-led bounce. Are you watching $0.416 support as a potential entry, or waiting for a confirmed reclaim of $0.473?$BRUSDT #IMPACTbyTrade

Pendiri Cardano baru saja menyatakan roadmap-nya "selesai" — di minggu yang sama ADA anjlok ke $0,1429, 95% di bawah harga tertingginya sepanjang masa (ATH). Cardano adalah Layer-1 proof-of-stake yang telah melalui tinjauan sejawat (peer-reviewed). Pada 13 November, pendiri Charles Hoskinson mengatakan dalam siaran langsung berjudul "Finishing Cardano" bahwa roadmap aslinya telah selesai. Pasar merespons dalam waktu sehari: ADA kehilangan 12,3% nilainya pada 14 November, ditutup di $0,1478, penutupan terendah sejak 30 Juni, dan sempat menyentuh $0,1429 secara intraday. Setahun yang lalu, harganya $0,5033 — lebih dari 3x harga hari ini. Katalisnya lebih dari itu. Permintaan perbendaharaan untuk cadangan strategis Copper sebesar 22 juta ADA ditutup hari ini — pemungutan suara langsung mengenai Cardano yang menimbun tokennya sendiri. Di baliknya: hard fork Dijkstra dengan penskalaan Leios, testnet yang aktif sejak Oktober, dan Peras, yang dijadwalkan pada Q2 2027. Kondisi makro sangat tidak menguntungkan: The Fed memiliki peluang kenaikan suku bunga sebesar 88,5% pada 8–9 Desember, Bitcoin diperdagangkan di dekat $65.000 setelah $1,91 miliar keluar dari ETF spot dalam tujuh sesi, dan Fear & Greed Index berada di angka 12. ADA jatuh lebih dari dua kali lipat lebih dalam dibandingkan Bitcoin. Pengaturan short squeeze terlihat dari angkanya: ADA turun 16,6% dalam tujuh hari dan 67,9% dalam setahun, dengan kapitalisasi pasar $5,5 miliar. RSI harian mencapai 25,7 pada 14 November — sangat jenuh jual (oversold). Open interest berkurang menjadi $284 juta, turun 13% dalam 24 jam, dan pendanaan (funding) berada di -0,0139% per 8 jam, sekitar -15,2% secara tahunan: posisi short membayar posisi long untuk tetap melakukan short. Volume futures melonjak 79% menjadi $726 juta; $6,3 juta dilikuidasi dalam 24 jam, 95% adalah posisi long. Tangan-tangan lemah (weak hands) sudah keluar; buku posisi short berada di titik terendah tahun ini. Secara teknikal, ADA berada 30% di bawah rata-rata 50 hari dan 27% di bawah rata-rata 200 hari — seperti karet gelang yang ditarik kencang. Zona $0,1426–$0,1442 adalah penentunya: harga terendah hari ini dan harga penutupan 30 Juni. Pertahankan level ini dan ada ruang untuk bounce; jika jebol, level $0,13 adalah target berikutnya. Trading: LONG ADA $0,1500–$0,1530, stop $0,1425, di bawah harga terendah hari ini. TP1 $0,1650 (1,5R), TP2 $0,1750 (2,6R), TP3 $0,1870 (3,9R). Swing 24–48 jam; pantau RSI harian, rata-rata 50/200 hari, pendanaan, dan open interest. Skenario Bullish: RSI 25,7 dengan pendanaan yang sangat negatif adalah pola klasik untuk squeeze — posisi short membayar untuk bertahan di harga terendah tahun ini, dan stabilisasi di atas $0,1500 memaksa mereka melakukan cover di tengah likuiditas yang tipis. Jika pemungutan suara Copper lolos hari ini, kata "selesai" akan berubah dari tanda menyerah menjadi tanda pencapaian. Skenario Bearish: Pendiri yang menyatakan kemenangan saat token berada 95% di bawah harga tertingginya terbaca sebagai tanda kapitulasi. Peluncuran di Ethiopia tidak pernah terjadi, The Fed akan menaikkan suku bunga, dan ADA tidak menunjukkan kekuatan relatif apa pun. Penutupan harian di bawah $0,1425 membatalkan semuanya dan membuka peluang penurunan lebih lanjut. A: ADA melonjak kembali di atas $0,1650 minggu ini — "selesai" menandai dasar harga. B: $0,1425 jebol dan ADA meluncur menuju $0,13 — roadmap selesai dan minat beli pun hilang. Anda di pihak mana? $ADAUSDT #ByXIMPACT #IMPACTbyTrade Ide trading, bukan nasihat investasi — level-level ini kondisional dan bisa gagal.
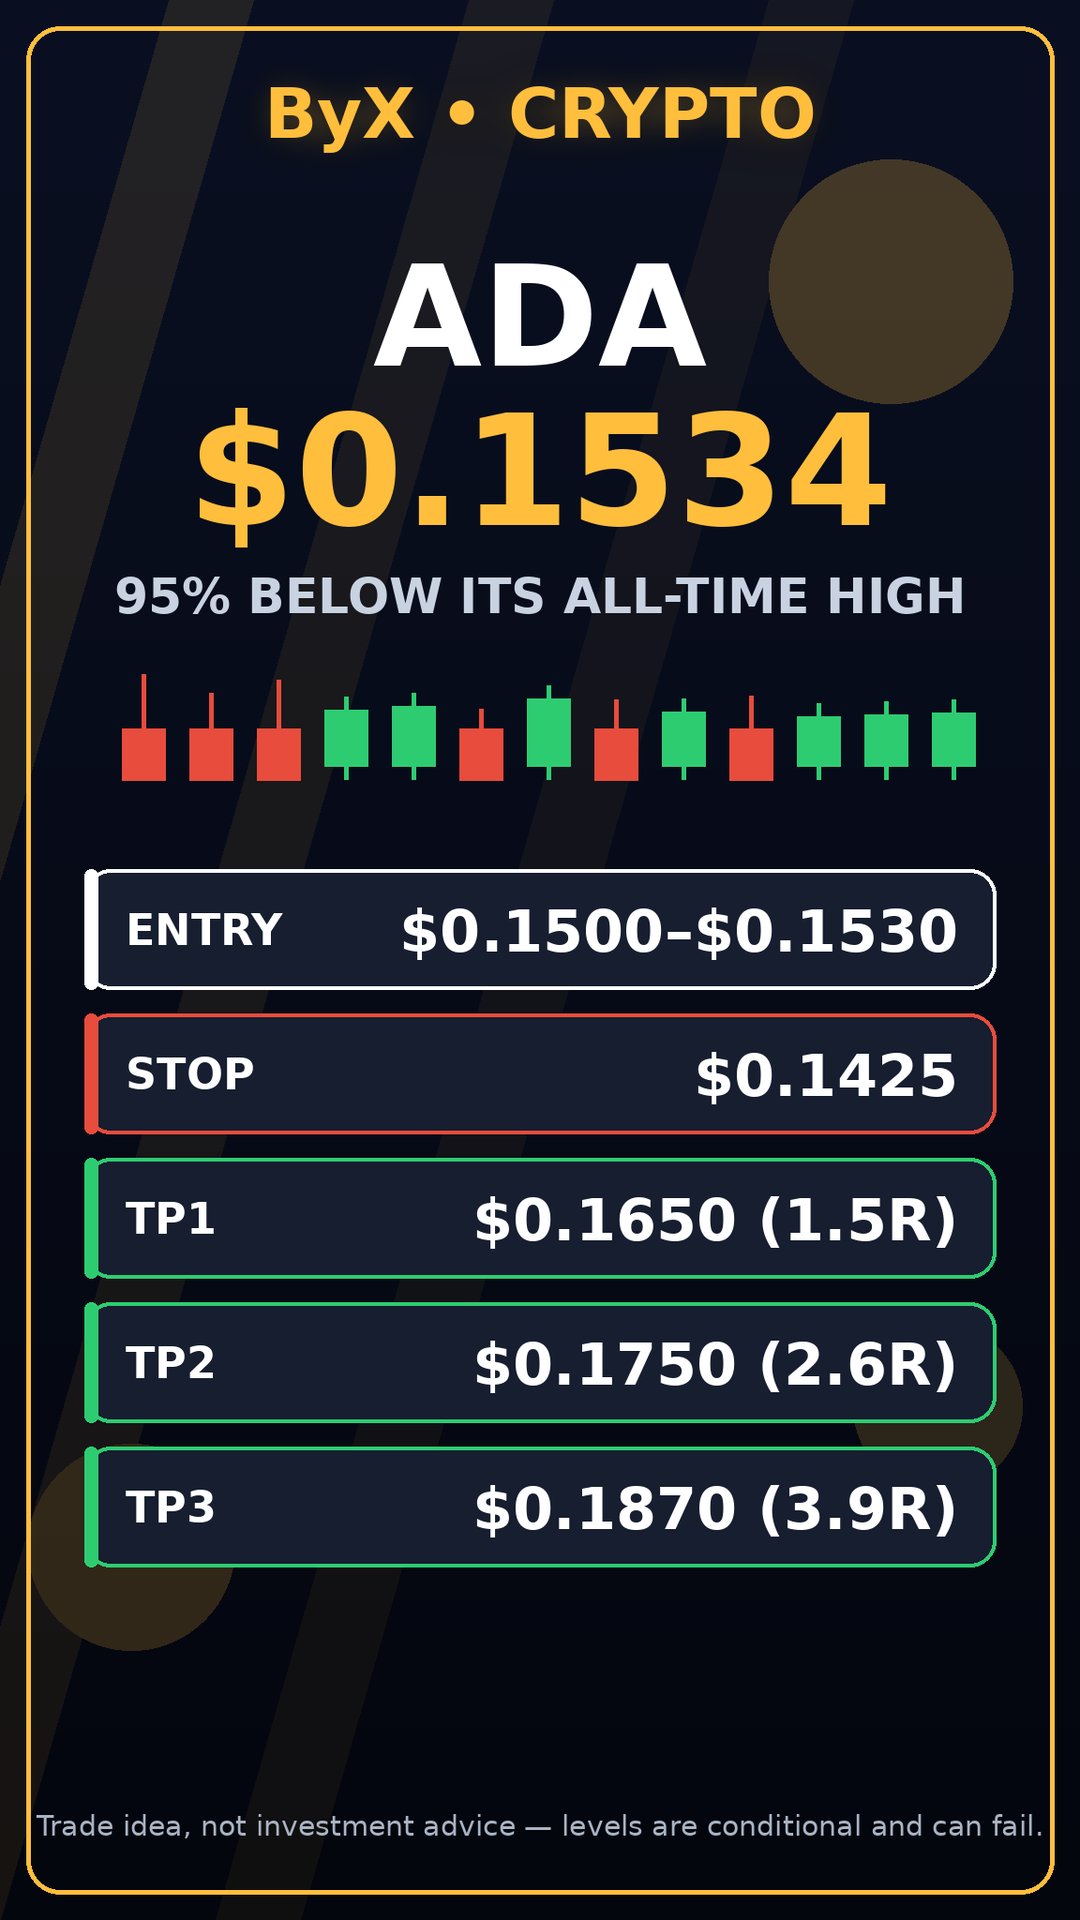
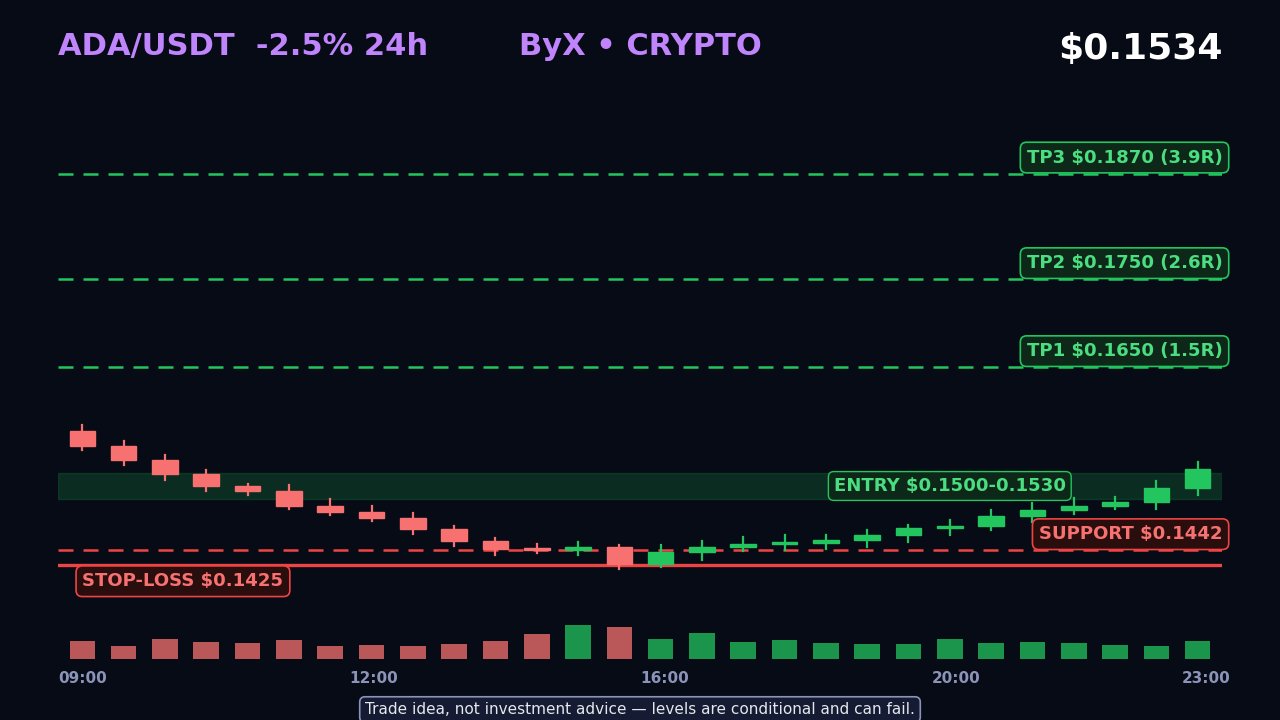

$GRAMUSDT just did something rare: every average agrees on the price. After sliding from 1.113 to 1.016 (about 8.7%), GRAM is sitting at 1.049 with the 7, 14 and 28-period MAs stacked at 1.051, 1.049 and 1.049. On the 1h chart, that's a market that has stopped disagreeing with itself. For most of this move, the 28 MA was a ceiling sloping down and every bounce died under it. Now it's flat, and price is sitting on it instead of below it. That's not a reversal. It's the end of the one-way pressure. What bothers me is the volume. The latest bar is 156K against a 5-bar average of 384K. The sell-off came on heavy volume. The recovery from 1.016 came on lighter, fading volume. Buyers stepped in, but they haven't paid for the move yet. The order book shows 91% bids, but I wouldn't lean on that. Bids can be pulled in seconds, and a lopsided book next to shrinking volume often means people are placing orders, not taking price. What I'm watching -Above 1.073: the 24h high and the first higher high since the drop. That's the real signal. - Below 1.016: the low gets swept and the recovery was just a pause. - 1.016–1.073: a range about 5.6% wide, and price is sitting in the middle of it. The part most people will skip Suppose GRAM breaks 1.073 and you chase it, with a stop under 1.016. Risk is about 5.3%. The first logical target, 1.113, is only about 3.7% away. That's roughly 0.7R, which is a bad trade even if you're right about direction. The better version is a reclaim of 1.073, a retest that holds, and a tighter invalidation. Without that, this isn't a setup yet. It's a compression, and a compression on fading volume resolves with a candle, not an opinion. I'm not calling it either way. I need a close above 1.073 with volume well above that 384K average, or a break under 1.016 that fails to bounce. #IMPACTbyTrade

Chainlink (LINK): Building the Infrastructure for the Next Generation of Global Finance 🌐 Chainlink is becoming much more than an oracle network. It is building essential infrastructure that could help connect traditional finance with the expanding blockchain economy. What Makes Chainlink Different? Blockchains cannot independently access real-world data or communicate seamlessly with other networks. Chainlink addresses this challenge through decentralized oracles, connecting smart contracts with external information, financial systems, and blockchain networks. Its ecosystem includes Data Feeds, Data Streams, and the Cross-Chain Interoperability Protocol (CCIP). Ecosystem Development Recent progress makes the bigger picture interesting. CCIP 2.0 introduced enhanced security, customizable compliance, and more flexible cross-chain transfers. Chainlink also introduced Fulcrum for institutional financing and collateral management. Additionally, its CCIP Vault Adapters enable DeFi vaults to accept deposits from more than 80 blockchains. Why Future Demand Matters As tokenized assets, stablecoins, and decentralized finance expand, reliable data and secure interoperability become increasingly important. LINK also has real ecosystem utility through service payments, node operator compensation, and network security. Risks Worth Watching Competition, regulatory uncertainty, technical vulnerabilities, and slower institutional adoption remain important challenges. Ecosystem growth does not automatically guarantee higher token value. My Final Perspective I believe Chainlink deserves attention because it is solving infrastructure problems rather than chasing temporary crypto trends. If blockchain adoption continues expanding, Chainlink could become an increasingly important part of that transformation. The real story is whether ecosystem usage and demand for LINK continue growing together. $LINKUSDT $BTCUSDT #IMPACTbyTrade
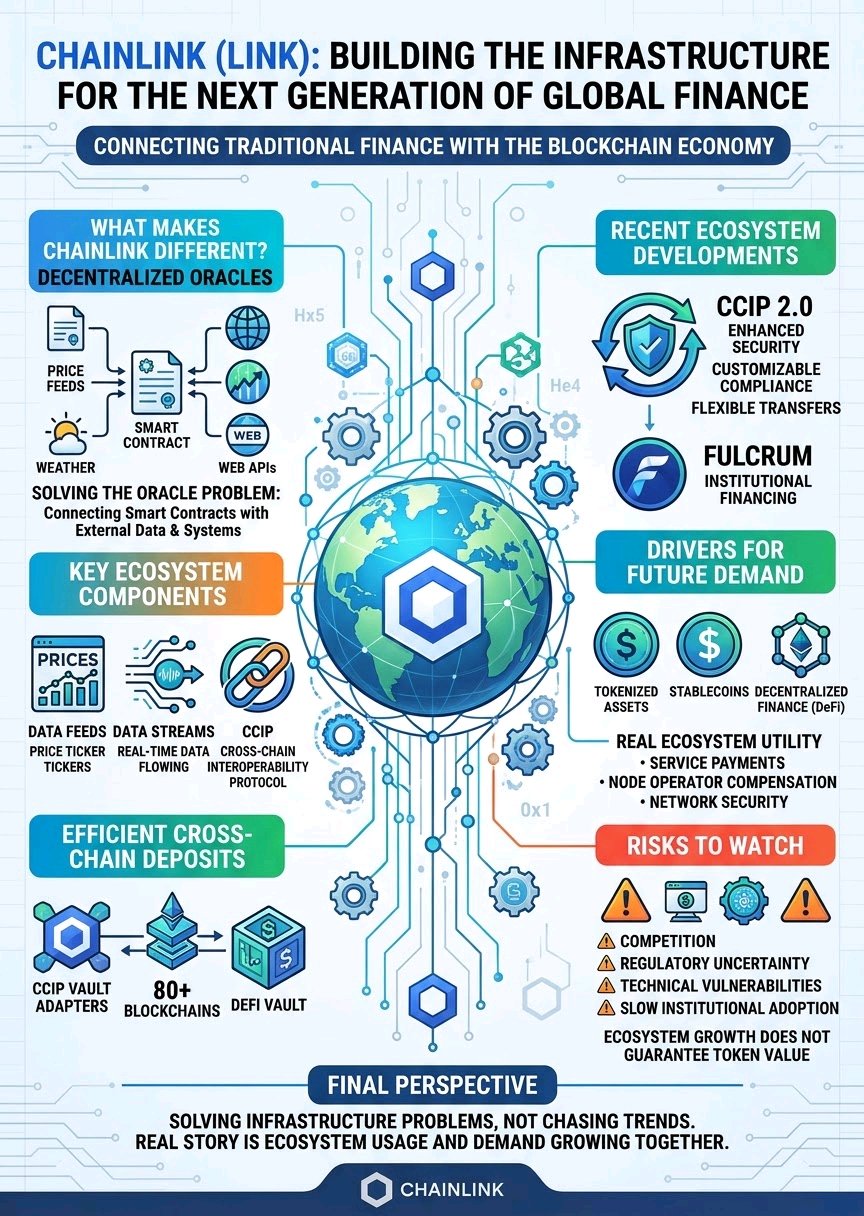

ONDO Reclaims $0.30 — But the 4H Trend Still Has Something to Prove ONDO is showing signs of short-term stabilization after dropping to $0.2853. Price has recovered toward $0.3055, but I am paying more attention to what happens around the $0.3075–$0.3125 resistance area than to the bounce itself. The recovery is visible. A confirmed trend reversal is not. ONDO/USDT: $0.3055 | -0.71% The 4H chart is still under pressure The current 4H moving averages are: - MA7: $0.3036 - MA14: $0.3180 - MA28: $0.3366 ONDO has moved back above MA7, which suggests that buyers are attempting to establish short-term support. However, price remains below MA14 and MA28. That distinction matters. The nearest average has been reclaimed, but the broader trend has not yet improved enough to support a confident bullish position. The 15-minute chart shows a tight resistance cluster The current 15m moving averages are: - MA7: $0.3045 - MA14: $0.3061 - MA28: $0.3075 Price is trading around the short-term averages but remains below MA14 and MA28. The $0.3061–$0.3075 zone is therefore an immediate test for buyers. There is also a volume concern. The displayed 15m volume is 36.84K, compared with MA5 at 43.81K and MA10 at 69.45K. Participation is relatively weak. I would want to see volume expand alongside a breakout rather than assume that the recovery has enough strength to continue. The important levels Resistance - $0.3061–$0.3075: 15m moving-average resistance - $0.3125: 24H high - $0.3180: 4H MA14 - $0.3366: 4H MA28 Support - $0.3045: 15m MA7 - $0.3036: 4H MA7 - $0.2964: Nearby chart support - $0.2853: Recent low and major downside reference My trading outlook Bias: Cautious — short-term recovery, broader trend still bearish. If ONDO reclaims $0.3075 and holds above it with stronger volume, the next test would be $0.3125. A sustained move above $0.3125 would improve the recovery structure and bring $0.3180 into focus. However, rejection from the $0.3061–$0.3075 zone followed by a loss of $0.3036 would weaken the rebound. Below that, $0.2964 becomes an important support reference, with $0.2853 remaining the major low. A decisive break below $0.2853 would invalidate the current recovery attempt. I would avoid chasing a long position directly into resistance. The better setup is a confirmed reclaim with volume or a clear rejection that establishes the next direction. What matters more to you here: ONDO holding above $0.3036 and building a base, or reclaiming $0.3125 before considering the recovery genuine? $ONDOUSDT #IMPACTbyTrade
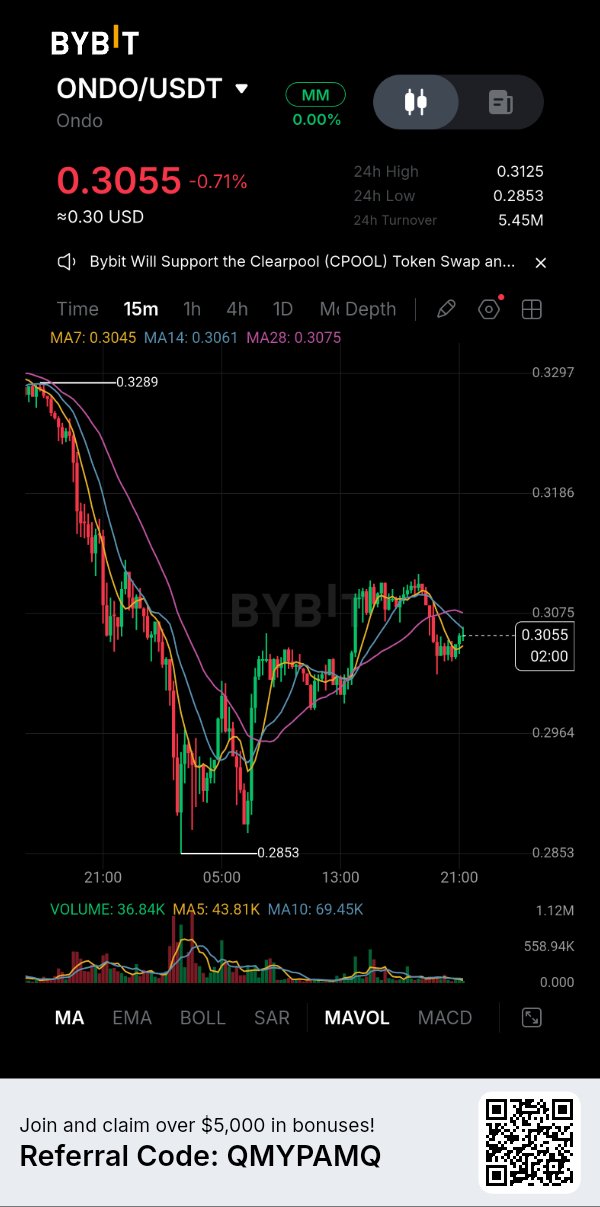
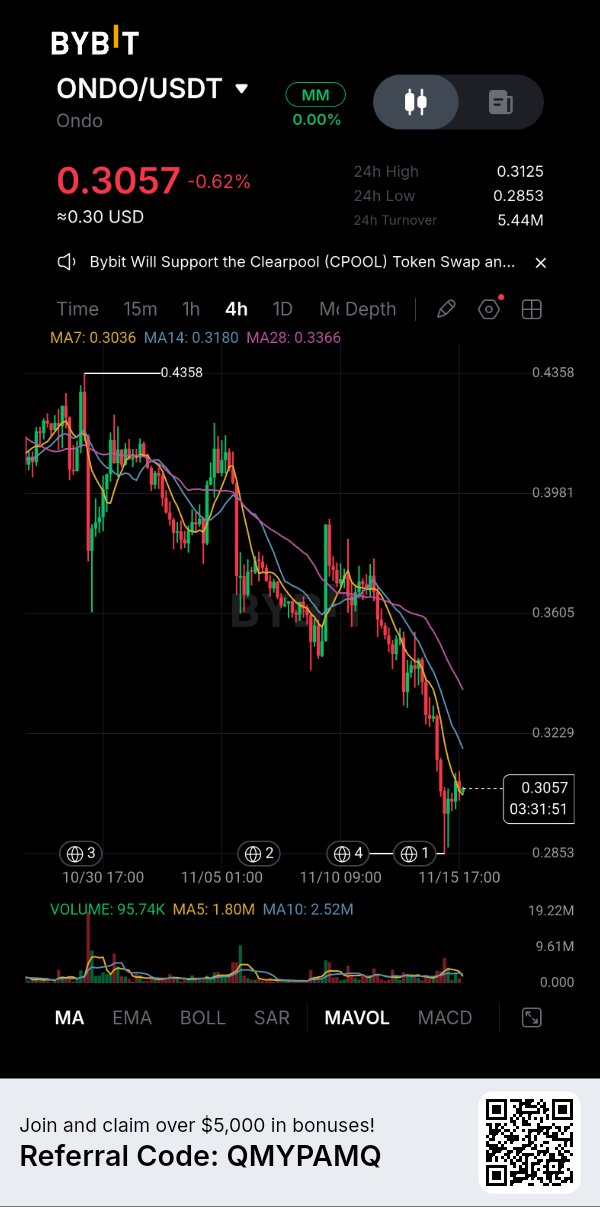

OPUSDT: The Sell-Off May Be Losing Momentum, But Is This Really a Reversal? Optimism has an interesting setup right now. OP is trading around $0.0823, down approximately 5.9% over 24 hours. However, today's recovery from the $0.0755 area deserves attention. Here is what caught my eye: 🔍 The overlooked signal Derivatives data shows: - Open interest: $50.99M, down 1.36%. - Funding rate: -0.0212%. - 24h liquidations: $1.78M, with approximately $1.73M from longs. This combination suggests significant long-side deleveraging. The rebound is interesting, but it is not yet proof of fresh accumulation. Key technical levels: 🟢 Support: $0.0755–$0.0741 🔴 Resistance: $0.0864 Bullish scenario: OP holds its recovery structure and breaks above $0.0864 with convincing volume. That would improve the short-term outlook. Bearish scenario: Another rejection followed by a breakdown below $0.0800 could expose the previous low again. My approach? I would rather wait for confirmation than chase this bounce. The important question isn't how quickly OP recovered. It's whether buyers can defend the recovery when selling pressure returns. What do you think? Is OP building a genuine bottom, or are we simply watching a temporary relief rally? $OPUSDT #IMPACTbyTrade