米国雇用統計と金利決定が主導するマクロ週
11月5日12:00(UTC)に、イングランド銀行(BoE)が金利を4.00%へ引き上げると予想されています。米国の雇用統計は11月6日13:30(UTC)に発表予定で、6万5千件の雇用増、失業率4.2%、前月比+0.3%の賃金上昇が見込まれています。 雇用や賃金が予想を上回れば利回りとドルが上昇し、BTC、金、成長株には圧力がかかる可能性があります。一方、予想を下回れば景気後退懸念が強まらない限り、それらを支える材料となるかもしれません。 どの資産が最も反応するでしょうか?


GOLD Smashed our $3800 target zone🎯
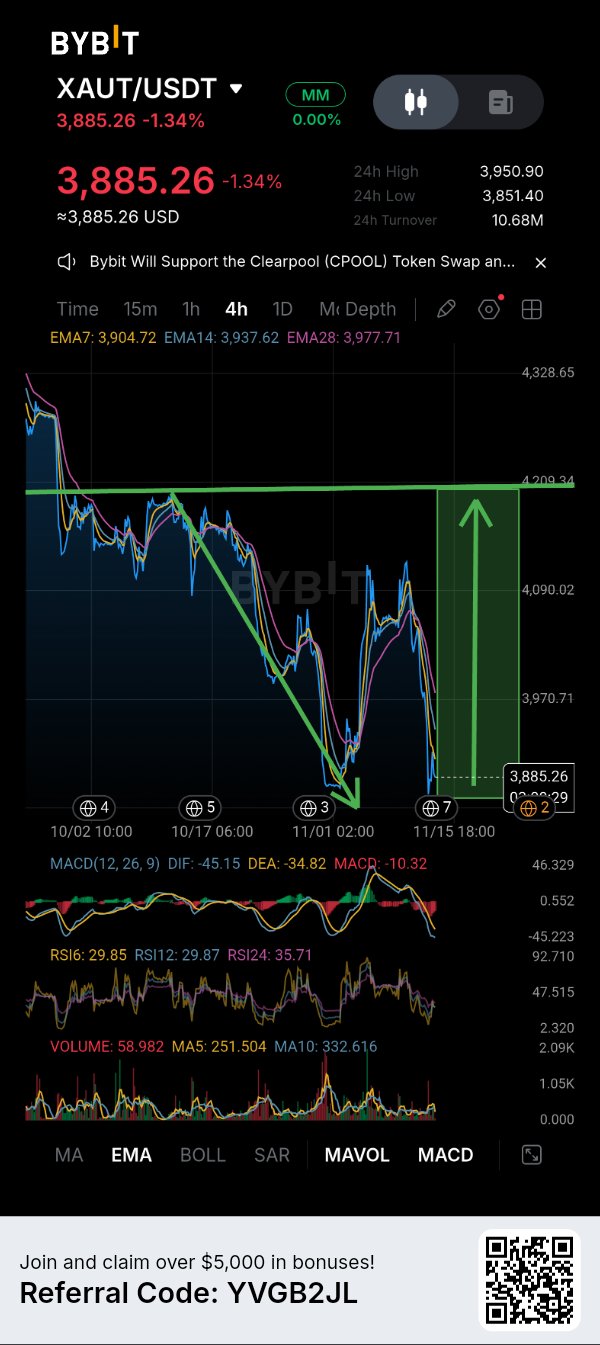
$XAUTUSDT is aproaching an important decision zone, and I think the reaction around $3,850–$3,885 could determine the next meaningful move🤔 4h structure is still bearish. Price is currently trading around $3,885.26, down 1.34%, after another rejection from the higher price region. What concerns me is the EMA structure: EMA7 sits at $3,904.72, EMA14 at $3,937.62, and EMA28 at $3,977.71. All three are above the current price, showing that sellers still have control of the short-term trend. however, I don't want to ignore the momentum situation either. RSI6 and RSI12 are both near 29.85, while RSI24 is around 35.71. This suggests considerable downside pressure and potentially stretched short-term momentum. with DIF at -45.15 and DEA at -34.82. So, although a relief bounce is possible, I would not treat oversold conditions alone as a buy signal my primary area of interest is $3,851–$3,885. The 24H low is already around $3,851.40, making this an important nearby support area to watch. If buyers defend this region, reclaim $3,905 first, and gradually push above $3,938, I would start paying more attention to a potential recovery first important resistance sits around $3,970–$3,978, where the EMA28 also comes into play. A stronger recovery could open the way toward $4,090, followed by the larger resistance area around $4,200 on the other hand, a decisive 4H breakdown below $3,851 would weaken the bullish recovery idea considerably. I would rather wait for a confirmed reclaim and a higher-low structure than attempt to catch a falling market📊 For now, $3,851 is the level I'm watching most closely. XAUT neds to prove that buyers are willing to defend this area before I consider a long position Patience first. Confirmation second. Execution comes last......👍 market is volatile, so you have to manage your own risk✅ #ByXIMPACT #SanDiskAnnounces8For1StockSplit #DeutscheBankLaunchesDigitalAssetCustody #USPayrollsAndRateDecisionsDriveMacroWeek

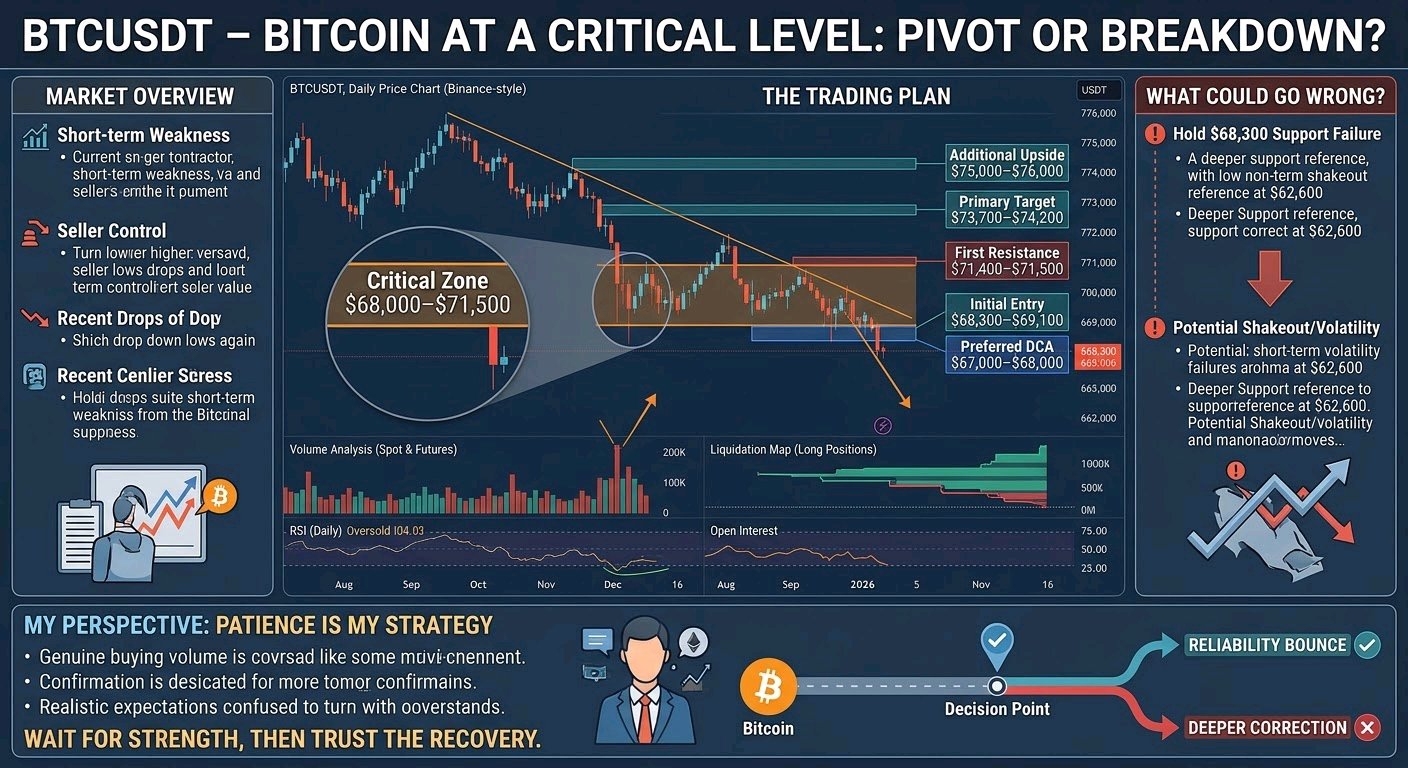
BTCUSDT – ビットコインは重要な局面を迎えています。次の動きを注視しています。 ビットコインは最近、顕著な売り圧力にさらされており、プライスアクションが興味深い状況になっています。直近の下落を受けて、買い手が参入する準備ができているのか、それとも売り手が依然として主導権を握っているのか、慎重に見極めています。 市場概況 日足チャートを見ると、BTCは依然として短期的な弱さを見せています。売り手が価格を押し下げており、買い手はまだ本格的な回復を確認できるほどの強さを見せていません。 68,000ドル~68,300ドルのゾーンは、私が特に注目しているエリアです。もし買い手がここを守り切れば、反発が期待できるかもしれません。しかし、価格が大幅に下落したという理由だけで「底打ち」だと決めつけるつもりはありません。 出来高分析 今回の値動きの中で取引活動が活発化しており、市場参加者が現在の状況に対して強く反応していることがわかります。 清算(ロスカット)も圧力を強めており、特にレバレッジをかけたロングポジションに影響が出ています。これは時に回復のチャンスを生むこともありますが、下降トレンドが終了したと自動的に判断できるものではありません。 私が本当に見たいのは、現物市場に本格的な買いの出来高が入ってくることです。 トレードプラン 小さな値動きのたびにビットコインを追いかけるつもりはありません。重要な水準付近での明確な反応を待つ方が賢明です。 - 初回エントリー: 68,300ドル~69,100ドル(買いの強さが確認できれば) - 推奨DCA(時間分散投資): 67,000ドル~68,000ドル(このエリアで強い反応がある場合のみ) - 最初のレジスタンス: 71,400ドル~71,500ドル - 第1目標: 73,700ドル~74,200ドル - さらなる上昇: 強気モメンタムが改善すれば75,000ドル~76,000ドル 71,500ドルを超えて回復すれば、セットアップはより面白くなります。それまでは現実的な期待値に留めておきます。 懸念材料 主な懸念は、68,300ドルのサポートエリアを維持できないことです。 もし売り手がこの水準以下にBTCを押し下げ、買い手が奪還に失敗した場合、さらなる下落が続く可能性があります。その場合は、より深いサポートとして62,600ドル付近を注視するつもりです。 また、短期的な揺さぶり(シェイクアウト)の可能性も無視できません。市場はボラティリティが高く、早すぎるエントリーは損失につながる可能性があります。 私個人の見解 個人的には、ビットコインは重要な分岐点に差し掛かっていると考えています。 直近の売りと清算の動きにより、買い手と売り手の双方が力を証明しなければならない市場になっています。現在はベア(売り手)が優勢ですが、サポートラインが強力に守られ、その後71,500ドルを上回る動きがあれば、短期的な見通しが変わる可能性があります。 すぐに急騰すると言っているわけではありませんし、再度の下落を排除しているわけでもありません。 今のところ、私の戦略は「忍耐」です。買い手が戻り、出来高がその動きをサポートし、市場構造が改善し始めるのを待ってから、よりアグレッシブに動くつもりです。 ビットコインは今日動く必要はありません。私が次の回復を信じるためには、まずは強さを見せる必要があります。 米国雇用統計と金利決定が主導するマクロ週

今日のニュースと市場の重要ポイント
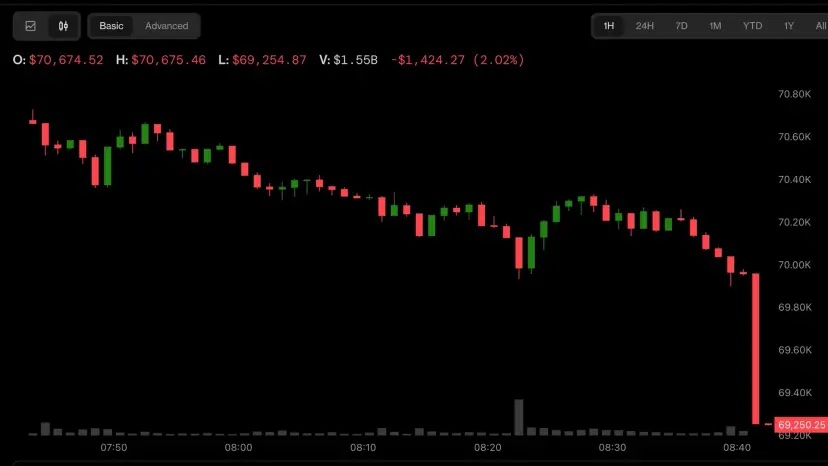
金曜早朝、仮想通貨市場の売りが加速しました。ビットコインは7万ドルを割り込み、イーサ(ETH)は2,000ドルを下回って取引され、先物市場で大規模な清算を引き起こしました。 要約: ビットコインは金曜早朝、ドル指数が19ヶ月ぶりの高値圏で推移する中、8月19日以来の安値となる7万ドル割れを記録しました。 中東での軍事的緊張が再燃したとの報道を受け、売りが加速しました。これには、イランがバーレーンにある米国の早期警戒レーダーを破壊したとする主張も含まれています。 取引所では、24時間で13億ドルを超える仮想通貨先物ポジションが清算されました。 市場全体が打撃を受けました。第2位のトークンであるイーサ(ETH)は1,935.76ドルとなり、8月以来初めて2,000ドルを割り込みました。XRP(XRP)は1ドル付近で取引され、ソラナ(SOL)のSOLは80ドルを下回りました。GT、Stacks、XMRなど、いくつかの小型トークンは7%以上の下落となりました。 ドル指数(DXY)が2025年4月以来の高値となる103を超えて推移したことで、売り圧力はさらに強まりました。ドル指数は、主要な法定通貨に対する米ドルの為替レートを追跡するものです。 今週初めに発表された10月の米消費者物価指数(CPI)が予想を上回ったことを受け、米連邦準備制度理事会(FRB)が12月に0.5%の利上げを行う確率は上昇しています。 #WSOT2026 #AnthropicIPOValuationTest #AITechSelloffErases2Point5TrillionFromNasdaq100 #米国雇用統計と金利決定が主導するマクロ週 @STRATEGY @

🚨 なぜ$BTCは69,000ドルを割り込んで暴落しているのか?
2026年11月の仮想通貨暴落の本当の理由 みんな… $BTCUSDT がついに7万ドルを割り込み、現在68,850ドル前後で推移している。24時間で6.5%の急落だ。 正直に言って…これはもう単なる調整には見えない。 複数の要因が同時に市場を襲っている: • 機関投資家のETF資金流出 • 大規模なレバレッジ解消(強制決済) • インフレ懸念 • FRBの金利見通し • ハイテク株の弱さ • 投資家のリスク許容度の低下 数字を見てみよう…状況はより深刻になっている。 1. ビットコインは最高値から45%以上下落 2026年11月13日: • BTC価格:約68,850ドル • 24時間パフォーマンス:-6.5% • 過去最高値(ATH):約126,198ドル • 現在のドローダウン:約-45.4% • 直近のチャート高値:87,383ドル • その高値からの下落率:約21.2% ビットコインは現在、2025年10月のピークを大きく下回って取引されており、売り圧力は加速している。 2. 機関投資家の資金がビットコインETFから流出 米国のスポット・ビットコインETFが、5営業日連続で純流出を記録したと報じられている。 11月5日~11日: • 11月5日:-4億3,020万ドル • 11月6日:-4億1,190万ドル • 11月9日:-2億100万ドル • 11月10日:-9,500万ドル • 11月11日:-2億9,980万ドル 合計:約14億3,800万ドルの純流出。 さらに気になる詳細がある… ブラックロックのIBITは11月11日に約2億6,970万ドルの流出を記録したと報告されており、9営業日連続の流出となった。 この9日間での累計流出額は、約20億ドルに達したという。 みんな…これは無視できない事態だ。 現物ETFは、機関投資家がビットコインにアクセスする重要な手段となっていた。 ETFの償還が続けば、機関投資家の需要がこれまでのような買い支えとして機能しなくなる。 3. 約6億8,100万ドルの仮想通貨が強制決済(リクイデーション) 11月13日の報道で引用されたCoinGlassのデータによると: • 仮想通貨全体の強制決済:6億8,081万ドル • ロング(買い)の決済:約88% • ショート(売り)の決済:約12% • ビットコインの決済:3億2,528万ドル • イーサリアムの決済:1億607万ドル • 決済されたトレーダー数:112,947人 • 最大の単一決済:3,109万ドル ビットコインの決済額は約3億2,500万ドルで、その95.3%がロングポジションによるものだったと報告されている。 これは典型的なレバレッジ解消の動きだ。 価格下落が証拠金追加(マージンコール)を誘発し、取引所がレバレッジポジションを強制的に決済する。それがさらなる売りを呼び、別のロングポジションが巻き込まれる。 この悪循環が続いている… 単なる現物市場の動きではなく、強制売却によって下落が増幅されているのだ。 4. マクロ経済のプレッシャーが売りを加速 インフレ懸念、FRBの今後の利下げに対する不透明感、そしてハイテク株の弱さが投資家をより慎重にさせている。 ビットコインは依然として流動性や広範なリスク許容度の変化に敏感だ。 もし投資家が「金利は当面高いまま」と予想すれば、投機的な資産はさらなる圧力を受けることになる。 ただし、BTCの売り圧力のすべてが直接FRBに起因しているという証拠はない。 5. テクニカル構造は依然として弱気 これらの状況を実際のBybitのチャートと照らし合わせてみよう… BTCは主要な日足移動平均線を下回っている: • EMA7:72,902ドル • EMA14:74,909ドル • EMA28:77,133ドル 4時間足チャートも弱気を示唆している。 • EMA7:70,888ドル • EMA14:72,066ドル • EMA28:73,290ドル 価格はこれら3本すべての下に位置しており、市場は高値を切り下げ、安値を更新し続けている。 ビットコインは一度67,468ドルまでタッチした後、68,850ドル付近までわずかに回復した。 しかし、この程度の反発ではトレンド転換を確認するには不十分だ。 6. 次のターゲットは65,000ドルか? 個人的に、注目している重要な下値水準は以下の通り: 67,468ドル → 66,000ドル → 65,000ドル もしビットコインが売り圧力にさらされたまま67.4kドルを割り込めば、65kドルへの動きがより現実味を帯びてくる。 ただし、後追いのショート(売り)勢にはリスクもある。 これほど激しい強制決済の後では、一時的な反発だけでも鋭いショートスクイズ(踏み上げ)を引き起こす可能性があるからだ。 本格的な強気回復には、BTCが以下の水準を奪還する必要がある。 70,900~71,300ドル、その次は72,600~73,300ドル。 それが起こるまでは、短期的な市場構造は依然として弱気だ。 個人的には、ビットコインが最高値から45%以上下落したという理由だけで盲目的にロングを入れることはしない。 かといって、巨大な陰線が出た後に、適切なセットアップを待たずにショートを追いかけることもない。 ETFの流出、レバレッジの強制決済、マクロの不透明感、そして弱気のテクニカル指標が、同時にプレッシャーをかけている。 ビットコインは7万ドルを失った。 今の本当の疑問は、買い手が67.4kドルを守れるかどうか…それとも65,000ドルが次の主戦場になるのかということだ。 米国雇用統計と金利決定が主導するマクロ週
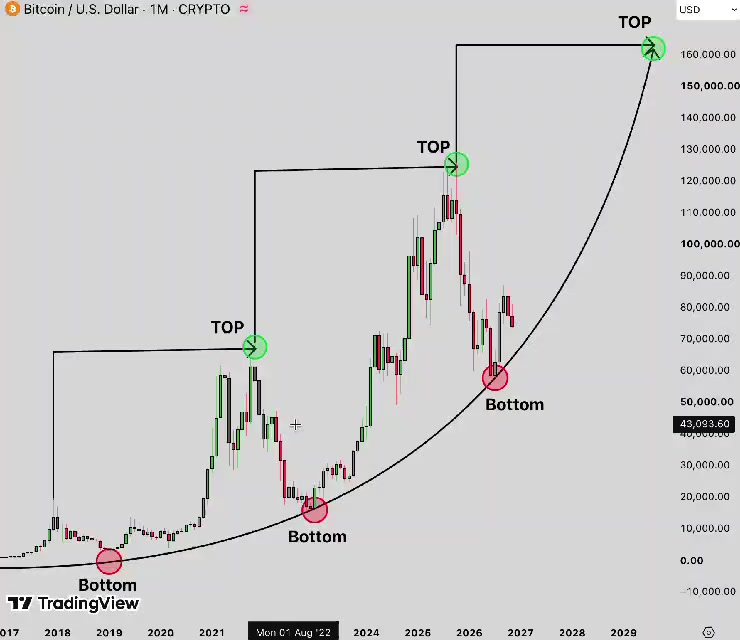

BTC keeps falling
BTC keeps falling below $70 down to $68 lets wait and see what comes next #BitcoinHitsTwoMonthLowAfterUSMidterms #USPayrollsAndRateDecisionsDriveMacroWeek #USInflationRunsHotAndRateHikeBetsRise @BybitX @Sabeer @btcflow @realklyro1 $BTCUSDT $NEARUSDT

HYPE‑USDT Trading & Analytics Brief (For WSOT Disclaimer: This is educational‑market overview only, not financial advice. 📌 About HYPE‑USDT HYPE‑USDT is the main trading pair for Hyperliquid’s native token on Bybit, available for spot and perpetual futures in the WSOT tournament. HYPE powers the Hyperliquid Layer‑1 trading blockchain, used for staking, governance, fee payments, and regular token‑buy‑and‑burn from protocol revenue . 📊 Core HYPE‑USDT Analytics To Watch ‑ On‑chain data: Total burned tokens, whale accumulation, staking ratio, new wallet growth ‑ Market metrics: 24‑h trading volume, open interest, funding rates, key support & resistance zones ‑ Key catalysts: Elysium Layer‑2 updates, institutional partnership news, global crypto market sentiment ‑ Risk note: HYPE has high volatility — price moves fast during WSOT trading rounds 🧩 WSOT Quick‑Check List for HYPE‑USDT 1. First check the overall crypto trend before opening HYPE positions 2. Track volume spikes — these often signal incoming momentum shifts 3. Mark clear support / resistance levels on your daily chart 4. Always set stop‑loss rules to protect squad tournament points ✅ Ready‑to‑Post WSOT Caption “HYPE‑USDT WSOT update! Hyperliquid’s ecosystem keeps expanding, with ongoing token‑burn activity and high trading volume — our squad watches key zones & news triggers closely for set‑ups!” $HYPEUSDT $SPXUSDT #ByXIMPACT #WSOT2026 #PiecesOf8 #NovUSCPIWatch #USPayrollsAndRateDecisionsDriveMacroWeek

ジェンスン・フアンが辞任
NVIDIAのAI帝国を築いた男。迫る退任の可能性。揺れる市場。 ジェンスン・フアン氏の退任報道は、NVIDIAにとって決定的な瞬間となる可能性がある。 コレット・クレス氏が暫定CEOに就任すると報じられているが、最大の課題は、AI経済において最も重要な企業の一つである同社の勢いを維持することだ。 今、一つの問いが市場を支配している。 果たして$NVDAXUSDT はジェンスン・フアン氏よりも大きな存在なのか? ウォール街はまもなくその答えを知ることになるだろう。 #AITechSelloffErases2Point5TrillionFromNasdaq100 #米国雇用統計と金利決定が主導するマクロ週 #米中間選挙後、ビットコインが2か月ぶりの安値を記録 #AnthropicIPOValuationTest #米国のインフレ率は高止まりし、利上げ観測が高まる


クジラのポジション(本音バージョン)
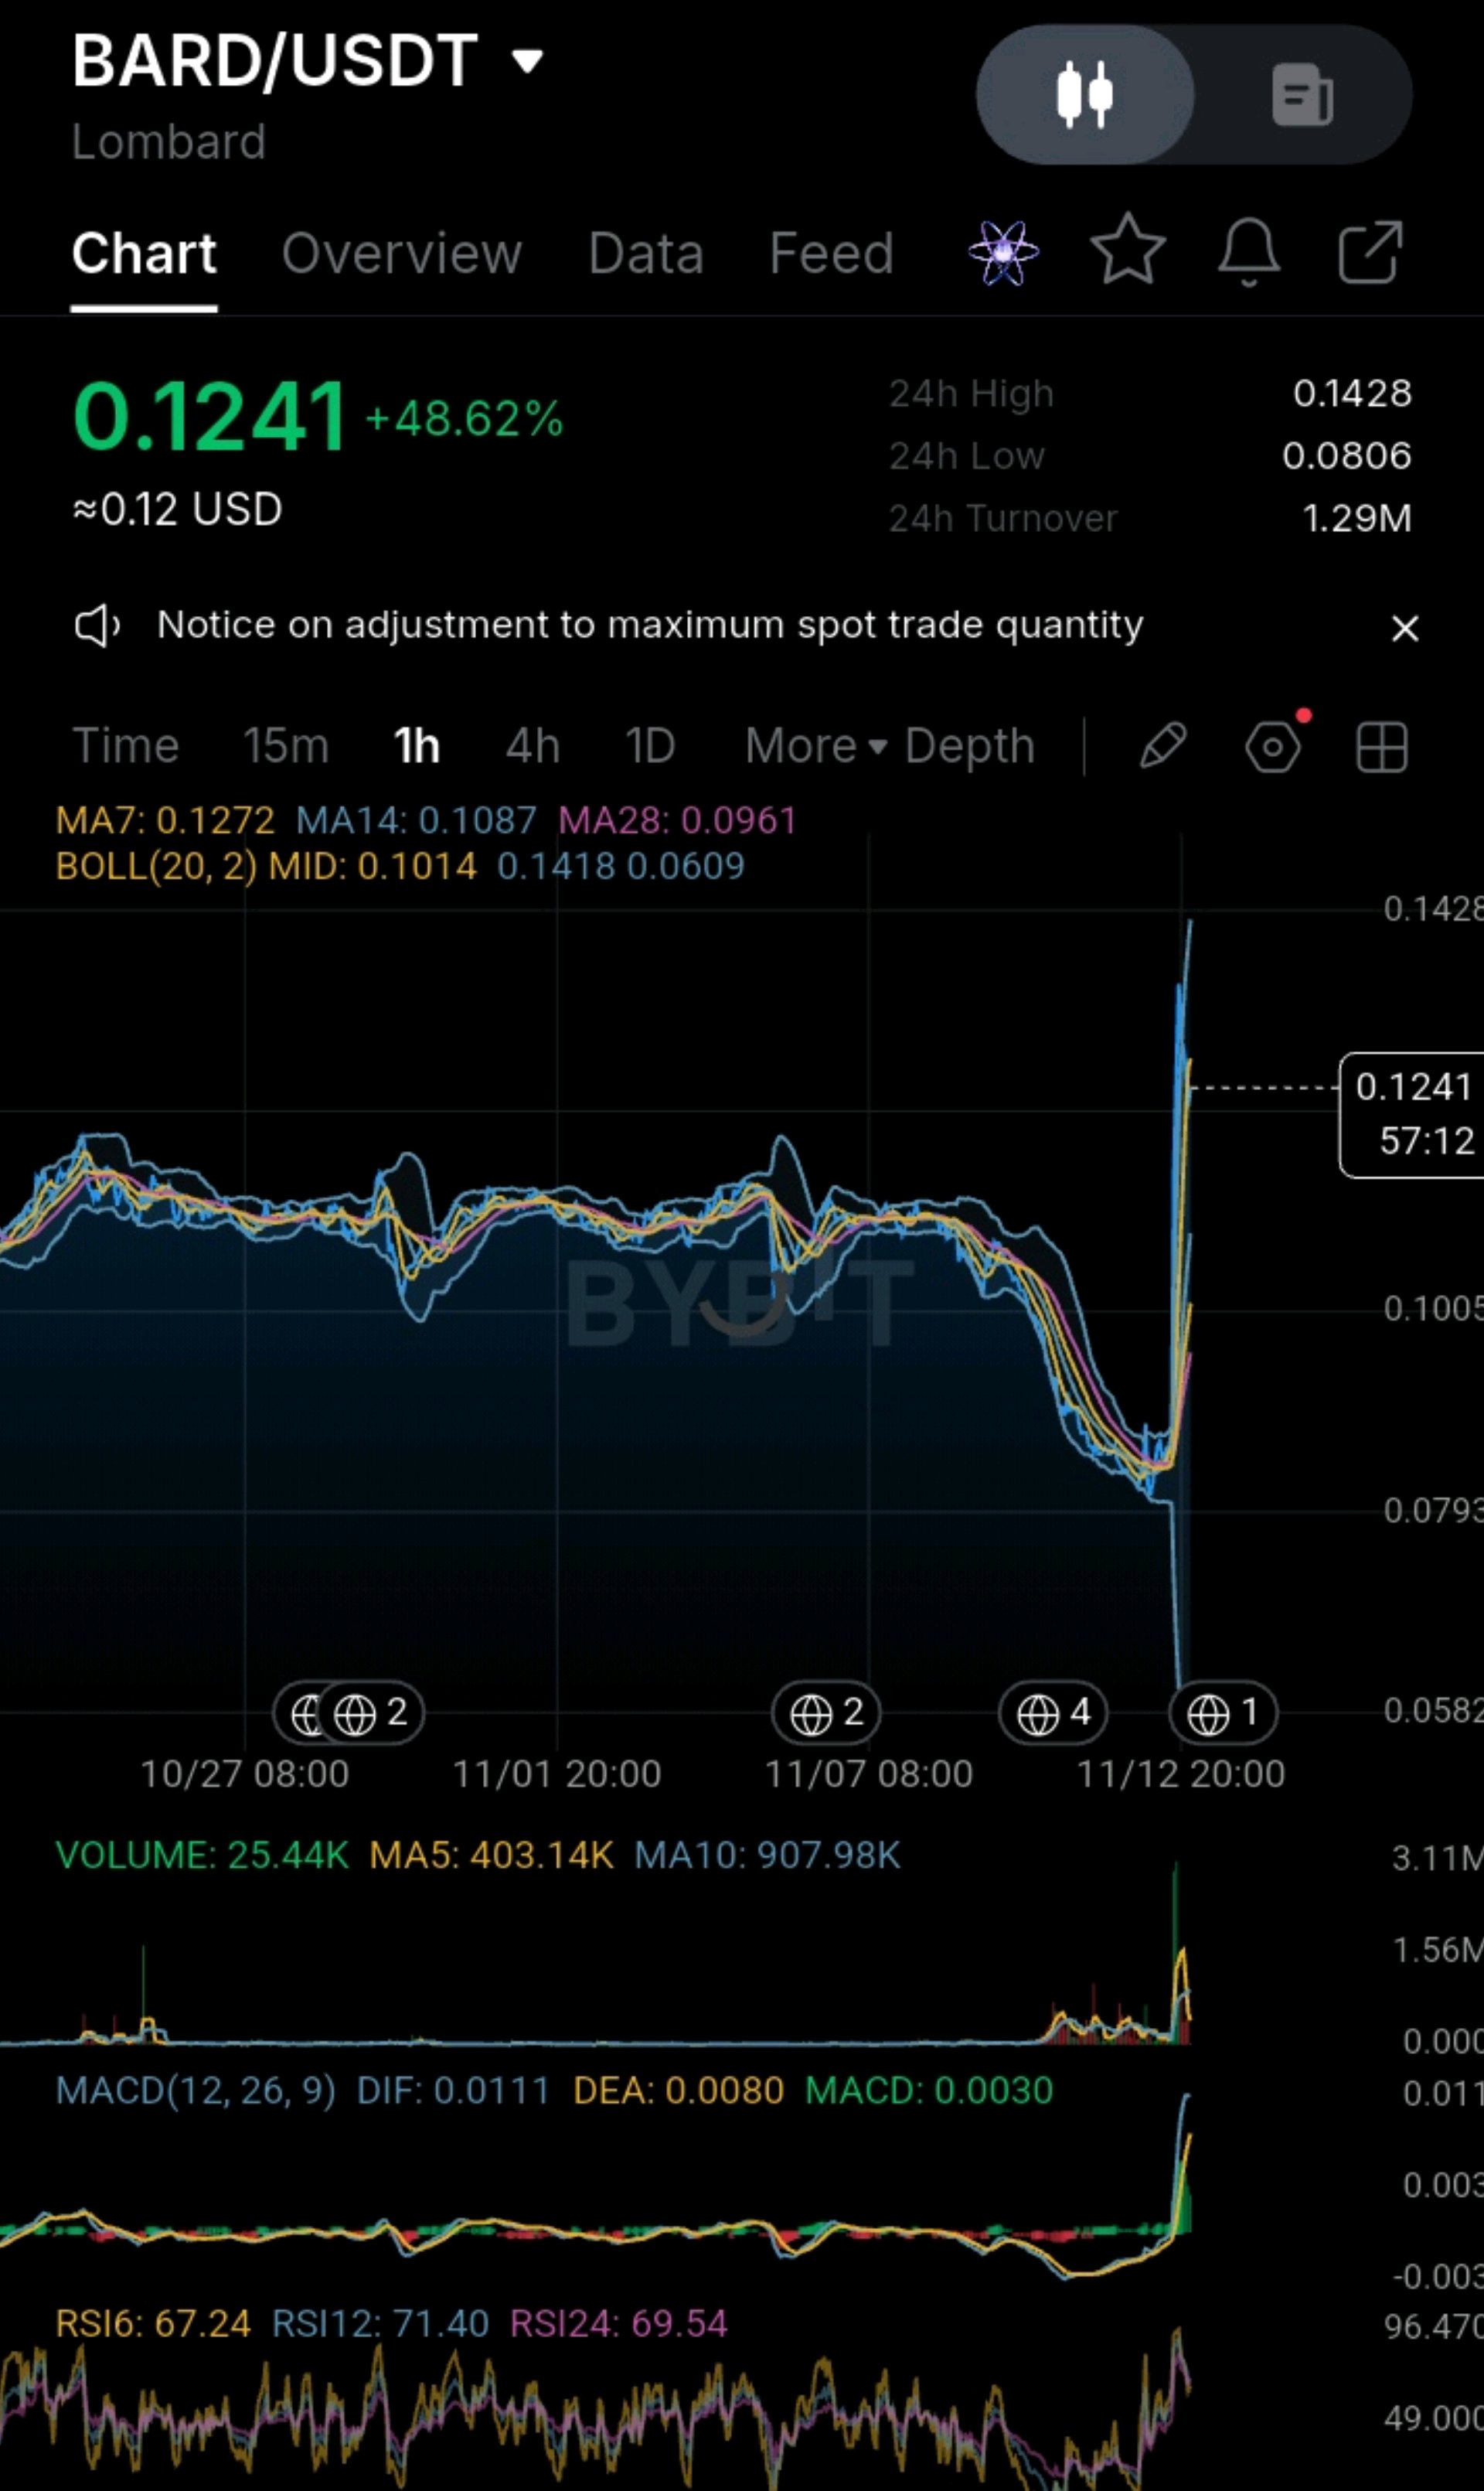
#IMPACTbyTrade #米国のインフレ率は高止まりし、利上げ観測が高まる #WSOT2026 #11月米国CPIウォッチ #米国雇用統計と金利決定が主導するマクロ週 🐋 クジラの動き(ホンネ版) BARD:クジラ関連の主なリスクは、予定された供給量です。プライベート投資家には、供給量の20%が12ヶ月のクリフ(ロックアップ期間)を経て36ヶ月かけてベスティング(権利確定)されるように設定されており、投資家とチームのアンロックは2026年9月から加速すると報告されています。 大規模なアンロックは売り圧力を高める可能性があるため、現在のアンロック日は確認しておきましょう。以前のスナップショットでは、無期限先物の出来高がスポット(現物)の約14倍となっており、レバレッジ取引が活発であることを示唆していましたが、そのデータは古い可能性があります。 KOR:新規上場銘柄は通常、初期保有者が集中し、フロート(流通枚数)が少なく、投機が激しくなりがちです。あるスナップショットでは、無期限先物のオープンインタレスト(未決済建玉)が約110万ドルで、資金調達率(ファンディングレート)が8時間ごとに0.0294%のプラスでした。これはロングポジションの保有コストを支払っている状態を意味し、急速に解消(急落)する可能性があります。 シリーズAの投資家は2026年7月に1億ドルの評価額で資金調達を行っているため、大規模なロックアップポジションを保有したままの初期投資家がいる可能性があります。これは結論ではなく、検証すべきリスクです。 ArkhamやNansenでラベル付けされたウォレットをチェックし、プロジェクトのブロックエクスプローラー(BARDならEtherscan、KORならBasescan)、Coinglassでオープンインタレストとファンディングレートを、各プロジェクトのドキュメントでアンロック日を確認してください。 📈 テクニカル分析 BARD:ブレイクアウト後、調整に入っています。価格はMA14(14日移動平均線)より上ですが、MA7より下です。出来高は減少しており、RSIは上昇しています(RSI6: 67.24, RSI12: 71.40, RSI24: 69.54)。レジスタンスは0.1272(MA7)、次いで0.1418と0.1428。サポートは0.1087(MA14)、0.1014(ボリンジャーバンド中央)、0.0961(MA28)、そして0.0806です。 KOR:トレンドはより強力ですが、危険なほど過熱しています。チャート形状は強気ですが、RSI6が75.45であることや、MA14から50%近く乖離していることを踏まえると、今は忍耐が必要です。 レジスタンスは0.000629、次いで約0.000680(推測値)。サポートは0.000546(アッパーバンド)、約0.000528(以前の急騰ゾーン)、0.000479(MA7)、次いで0.000403/0.000396、そして安値の0.000301です。 クイック・スコアカード: 短期トレンド:KORの方が強い。BARDは既にMA7を割り込んでいる。 モメンタム:両銘柄ともMACDが新たにゴールデンクロスを形成。出来高はKORの方が維持されており、BARDは急速に減少している。 乖離率:BARDの方が過熱感は少ない。KORは過熱しすぎている。 プロジェクトの成熟度:BARDの方が明らかに確立されている。KORは上場から数日しか経っていない。 全体的なリスク:KORの方がはるかに高い。BARDはアンロックによる供給懸念がリスク。 最適なエントリーエリア:BARDは0.1090-0.1130(MA14付近)。KORは0.000480-0.000500(MA7付近)で、これは現在の価格より約16-19%低い水準です。 🧭 初心者へのアドバイス +45%もの急騰を追いかけるのはやめましょう。どちらも高値掴みするより、押し目を待つ方が賢明です。 新規上場銘柄には特に注意してください。KORは上場初日の高値からすでに約98%下落しており、その中での反発はトレンド転換を意味しません。 アンロックのスケジュールを確認してください。BARDのように大量の予定されたアンロックがあると、チャートが良く見えても価格に重くのしかかる可能性があります。 ファンディングレートを監視してください。KORのスナップショットのように、プラスのファンディングレートが高いまま推移しているということは、ロングポジションが過密で非常に脆い状態にあることを意味します。 流動性の低いトークンでは指値注文を使いましょう。スプレッドやスリッページで実際のお金を失うことになります。 必ずエントリー前にストップロスを設定し、一度エントリーしたら動かさないでください。 取引ごとにアカウントの1-2%以上のリスクを取らないようにしましょう。ストップロスを広く設定する場合、ポジションサイズは小さくする必要があります。慣れるまではレバレッジは控えましょう。 🎯 私の見解 リスク調整後のパフォーマンスを考えると、BARDの方が良い候補です。より確立されており、過熱感が少なく、明確な押し目ゾーンがあります。MA14での反発か、出来高を伴う0.1272の回復を待ちたいところです。KORは現在チャートが強いですが、上場から数日の超小型株で、移動平均線から50%近くも乖離しています。もし取引するならポジションサイズを小さくし、MA7ゾーンまでの押し目を待ちましょう。どちらも今すぐ飛びつく銘柄ではありません。 アクション:市場が冷え込んだ場合、どちらがより持ちこたえると思いますか? $BARDUSDT か $KORUSDT か? 皆さんの予想をコメントで教えてください👇。BARD 0.1272 / 0.0990、KOR 0.000629 / 0.000440 にアラートを設定し、押し目を待つのかブレイクアウトを待つのか教えてください。 これは議論のためのテクニカル分析であり、投資助言ではありません。新規上場銘柄や小型トークンは非常にボラティリティが高く、資金をすべて失う可能性があります。ご自身のリスク許容度を守り、常にストップロスを設定してください。 時価総額やアンロックの数値は、参照するデータサイトによって異なり、最新ではないことも多々あります。これらを根拠にする前に、必ずリアルタイムのデータを確認してください。皆さんがリサーチに使っているデータサイトをコメント欄で教えてください。$BTCUSDT $KORUSDT

アメリカかヨーロッパの女の子が必要なんだけど
#ShowMyRWATrades #USInflationRunsHotAndRateHikeBetsRise @usayouths #SanDiskAnnounces8For1StockSplit @AMERICA #米国雇用統計と金利決定が主導するマクロ週電話番号#2348137826026 彼女になってくれる?これが俺のワッツアップ 関係 #米国雇用統計と金利決定が主導するマクロ週
i need a girl from USA or Europe
#ShowMyRWATrades #USInflationRunsHotAndRateHikeBetsRise @usayouths #SanDiskAnnounces8For1StockSplit @AMERICA #USPayrollsAndRateDecisionsDriveMacroWeek phne#2348137826026 $BTCUSDT @miami @NEWYORKSTOCKEXCHANGE
アメリカかヨーロッパの女の子が必要なんだけど
#ShowMyRWA #米国のインフレ率は高止まりし、利上げ観測が高まる @usayouths #サンディスクが8対1の株式分割を発表 @AMERICA #米国雇用統計と金利決定が主導するマクロ週 phne#2348137826026 $BTCUSDT @miami @NEWYORKSTOCKEXCHANGE


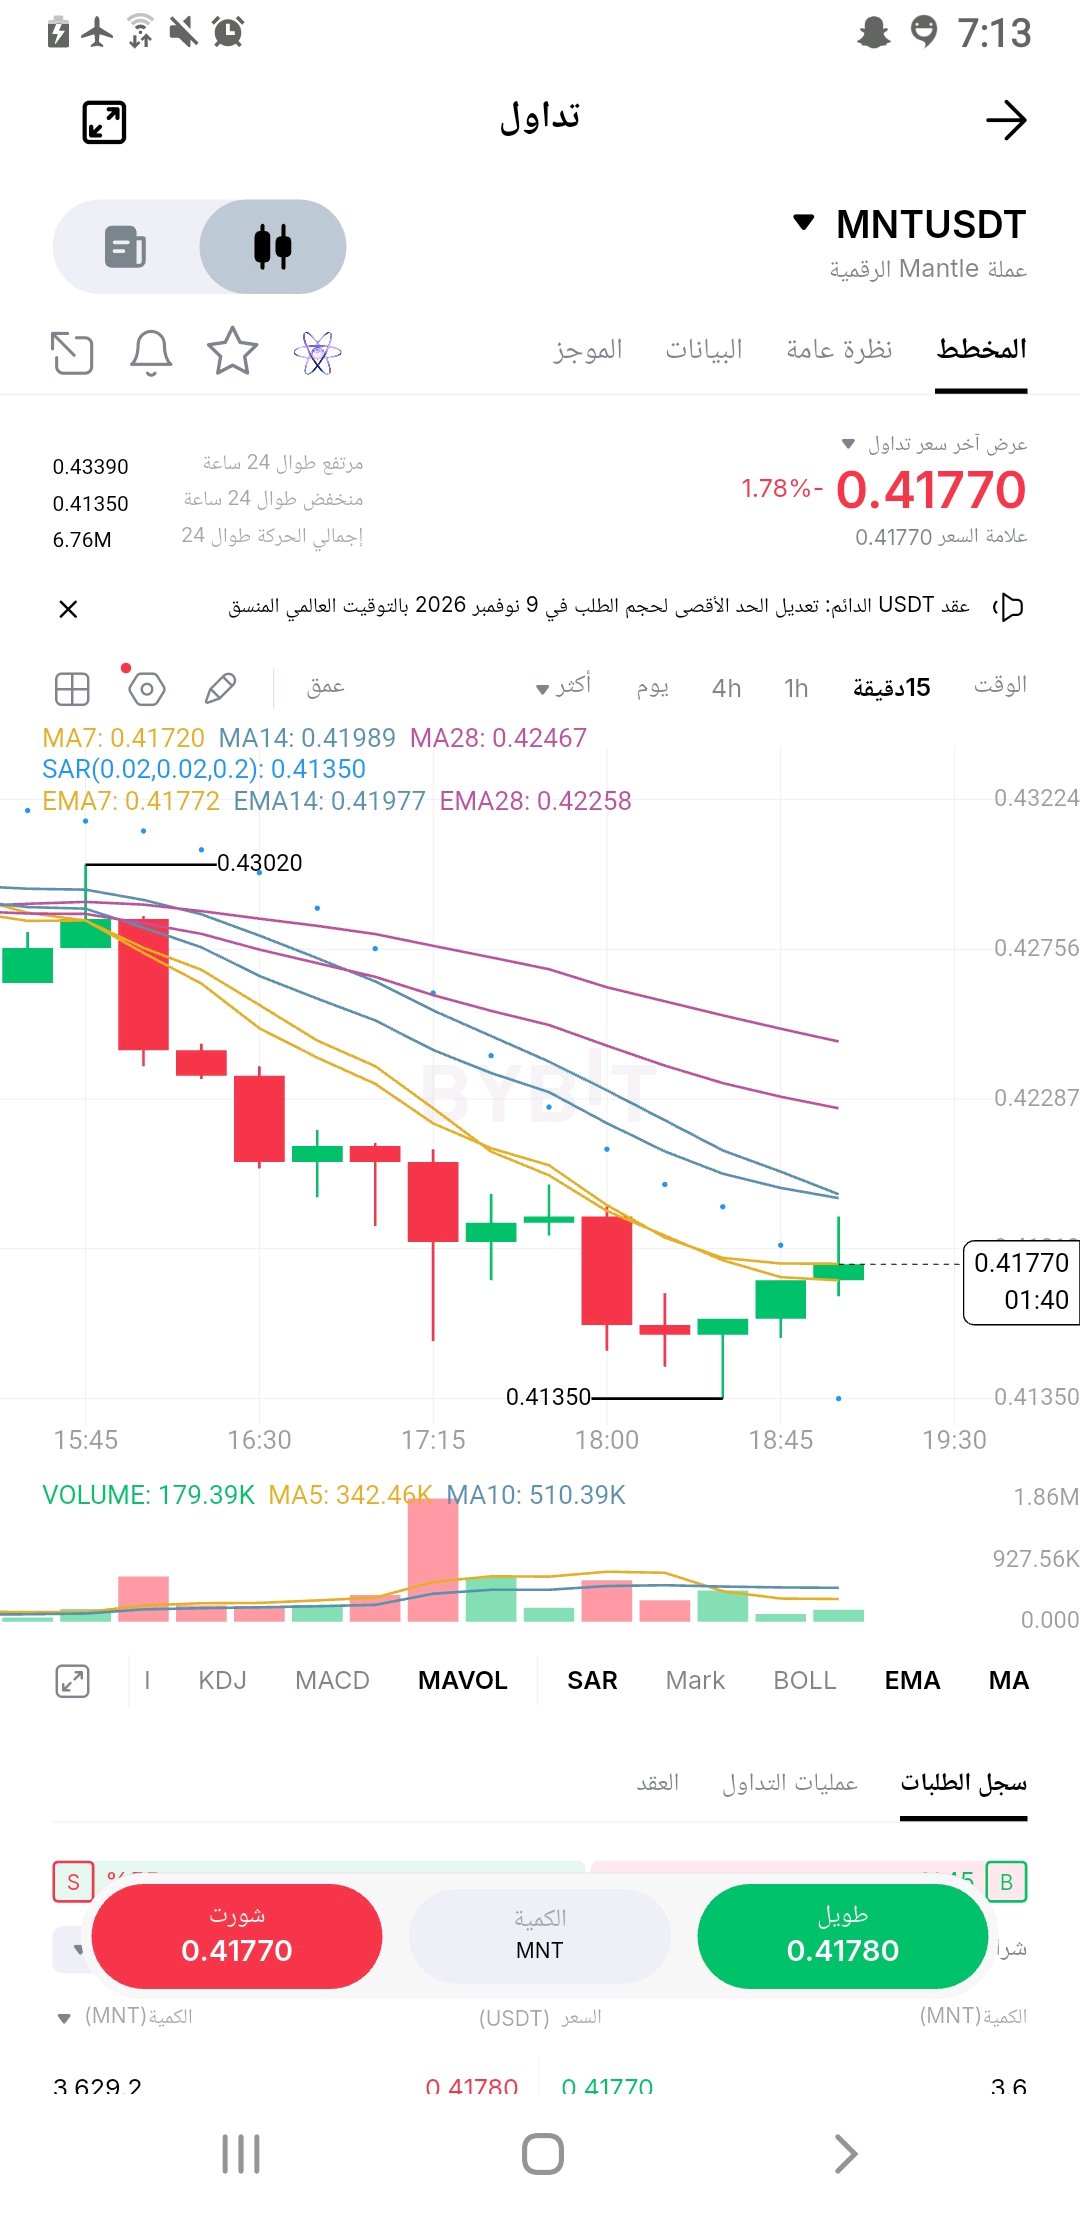
🚨 MNT is poised for a strong move! Has the bullish bounce begun? 🔥 💎 MNT/USDT | 15-minute timeframe 💰 Current price: $0.4177 🟢 Entry zone: $0.4170 – $0.4190 🚀 Bullish confirmation: Breakout above $0.4200 🎯 TP1: $0.4225 🎯 TP2: $0.4245 🎯 TP3: $0.4280 🛑 Stop loss: $0.4130 📊 A bounce from the $0.41350 support is underway as the price attempts to regain momentum, but the trend still needs confirmation with a break above the $0.4200 resistance. 🔥 All eyes are on MNT... Will we witness a new surge? #MNT #Crypto #Bybit #Trading #Altcoins ⚠️ Technical analysis is not a guarantee of profit. Risk management is key. #WSOT2026 #ارتفاع التضخم الأمريكي وزيادة الرهانات على رفع أسعار الفائدة #كشوف المرتبات الأمريكية وقرارات أسعار الفائدة تحرك الأسبوع الاقتصادي #مراقبة مؤشر أسعار المستهلك الأمريكي لشهر نوفمبر $MNTUSDT #ByXIMPACT $SUIUSDT @ByX

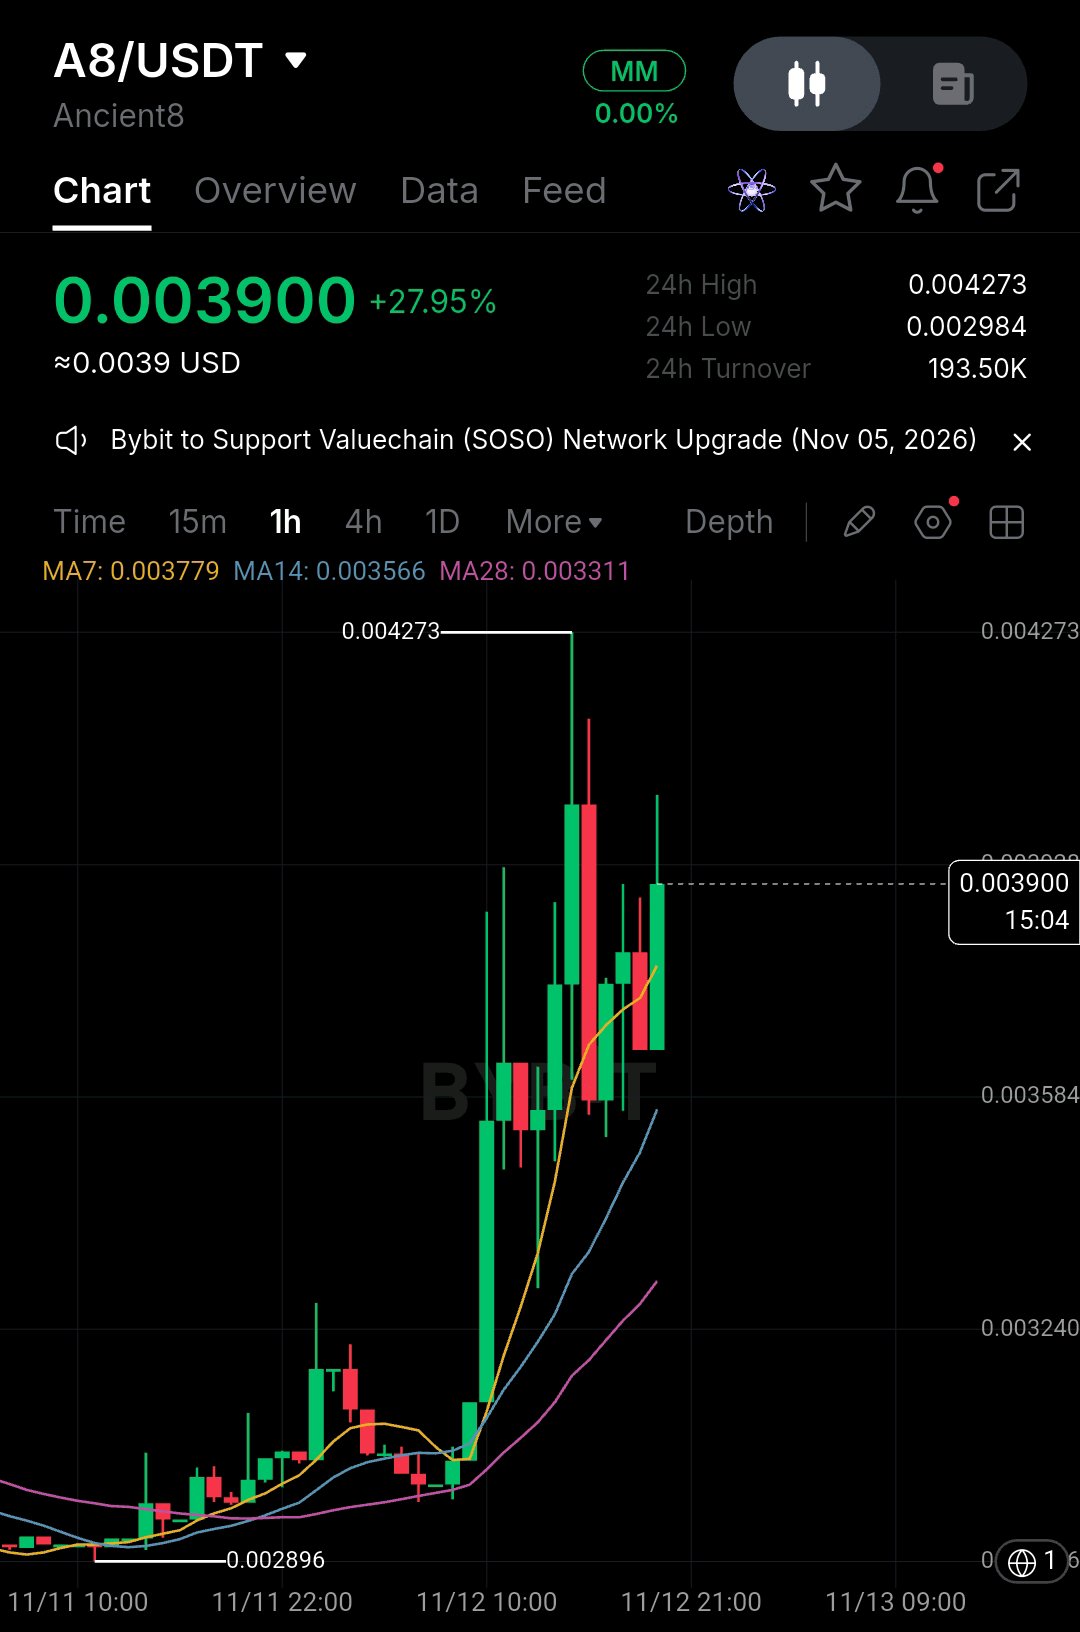
$A8 IS SHOWING STRONG MOMENTUM — BUYERS ARE TAKING CONTROL. 🚀 Ancient8 ($A8) is up nearly 28% in the last 24 hours, with price trading around $0.00390 after a strong breakout on the 1H timeframe. The chart is showing a clear shift in momentum. Price is holding above the 7, 14 and 28-period moving averages, suggesting buyers are maintaining short-term control. The key level I'm watching is $0.00427, the recent swing high. A clean breakout and sustained close above this resistance could open the door for another upside extension. On the downside, $0.00378 is the first level to watch, followed by the $0.00358 support zone. Momentum is strong, but after such a sharp move, some consolidation or a healthy pullback would not be surprising. I'm watching for confirmation rather than chasing the green candles. $A8 | Patience over FOMO. $A8USDT #WSOT2026 #USPayrollsAndRateDecisionsDriveMacroWeek #NovUSCPIWatch #PiecesOf8 #USInflationRunsHotAndRateHikeBetsRise
The 1H chart just gave us a textbook capitulation candle. $AAVEUSDT Price absolutely nuked down to $110.45, sweeping the lows and triggering panic stops. But look at that immediate rejection—we are already back at $112.57. The bears overplayed their hand, and the MACD is already showing hidden bullish divergence. The bounce is loading. Here is the Trade Setup: 🎯 EP (Entry Point): $112.57 (Current Market Price) · We are buying the immediate rejection of the sweep. 🛑 SL (Stop Loss): $109.50 · Strict risk management. If we lose the $110.45 wick low, the setup is invalidated, and the dump continues. No holding and hoping. 💰 TP (Take Profit): · TP1: $116.39 (Local resistance / reclaiming the breakdown level) · TP2: $124.00 (Major liquidity grab above / previous structural supply zone) The Numbers: · Risk: ~2.7% (Downside) · Reward: ~10.1% (Upside to TP2) · R:R Ratio: 3.7 : 1 The trend is heavy, but the selling is exhausted. We play the bounce, take the liquidity, and protect the capital. Let's ride the relief rally. 🚀 #ByXIMPACT #WSOT2026 #USInflationRunsHotAndRateHikeBetsRise #USPayrollsAndRateDecisionsDriveMacroWeek #DeutscheBankLaunchesDigitalAssetCustody $AAVEUSDC

🚨 BREAKING: MAJOR SHAKE-UP AT NVIDIA!
Jensen Huang has reportedly resigned as NVIDIA CEO and board member, effective immediately, with CFO Colette Kress stepping in as interim CEO. If confirmed, this would mark one of the biggest leadership changes in the AI and semiconductor industry. With NVIDIA at the center of the global AI boom, the market will be watching closely for what comes next. A new chapter for NVIDIA begins. 👀 #USPayrollsAndRateDecisionsDriveMacroWeek #WSOT2026 #USInflationRunsHotAndRateHikeBetsRise



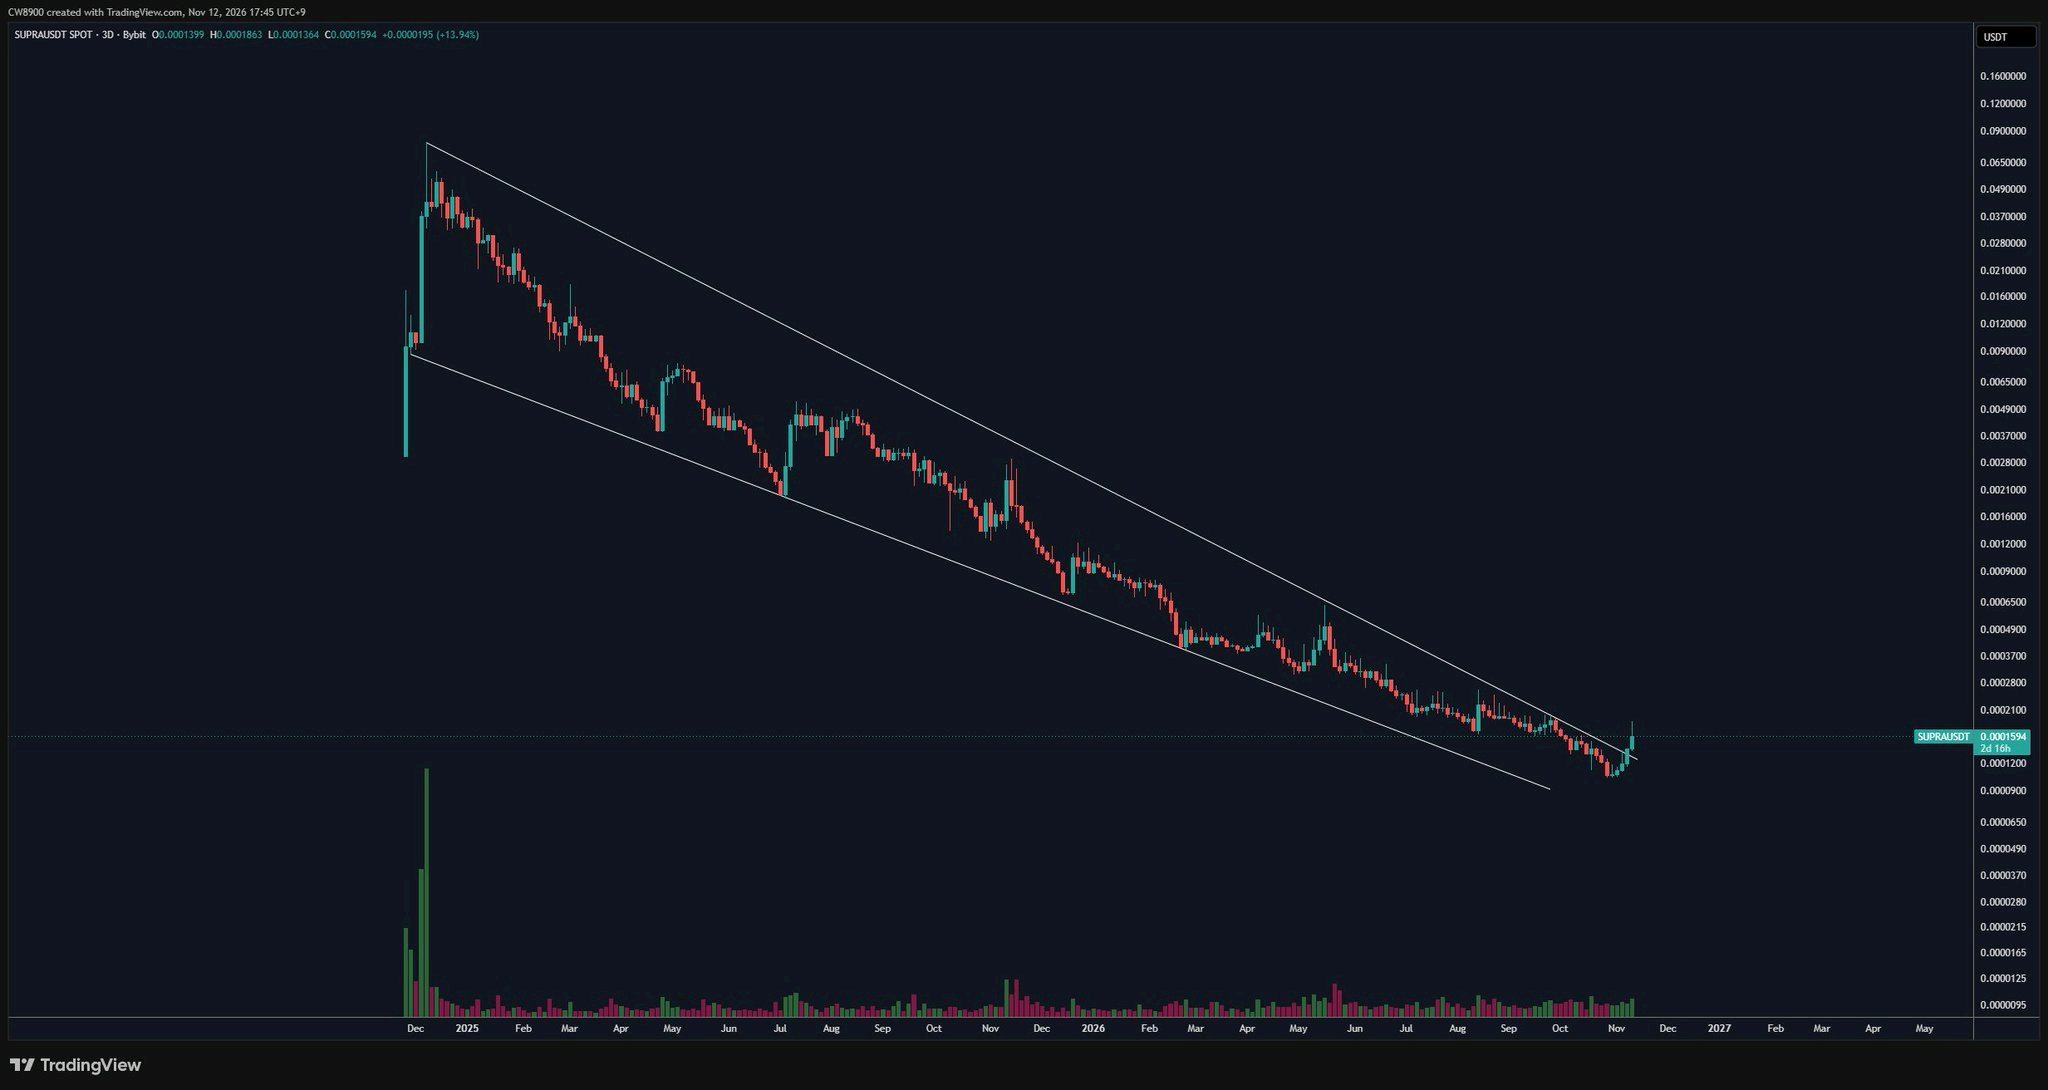
$SUPRAUSDT has broken out of a massive falling wedge pattern. The downtrend has ended, and an uptrend is beginning. #USPayrollsAndRateDecisionsDriveMacroWeek #NovUSCPIWatch #DeutscheBankLaunchesDigitalAssetCustody #AITechSelloffErases2Point5TrillionFromNasdaq100 #PiecesOf8
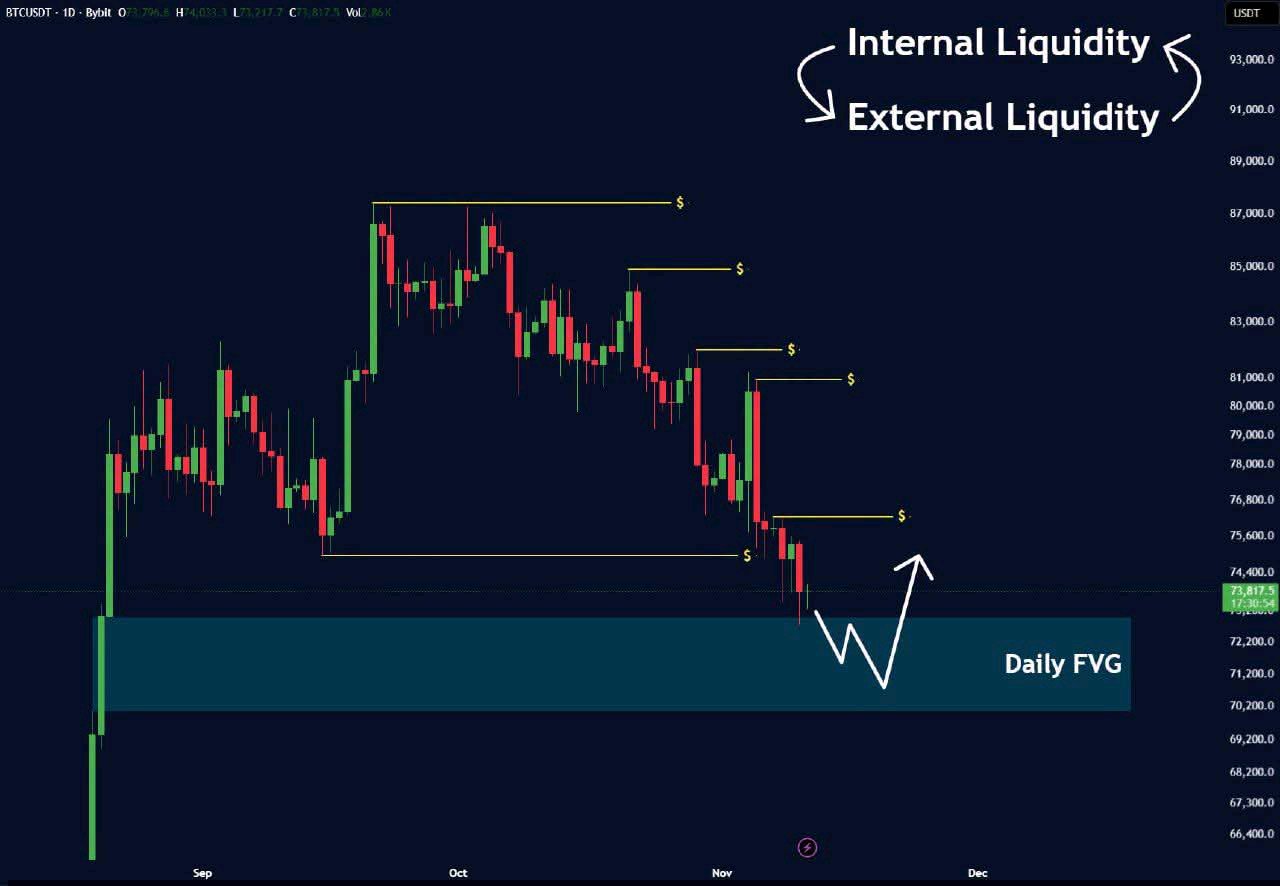
BTC has approached the Daily FVG around $70K–$73K. 👀 Could this be where we see a bounce from? What's your take for today? 🔥 #USInflationRunsHotAndRateHikeBetsRise #AnthropicIPOTestsTheAIBoom #SanDiskAnnounces8For1StockSplit #PiecesOf8 #USPayrollsAndRateDecisionsDriveMacroWeek $BTCUSDT

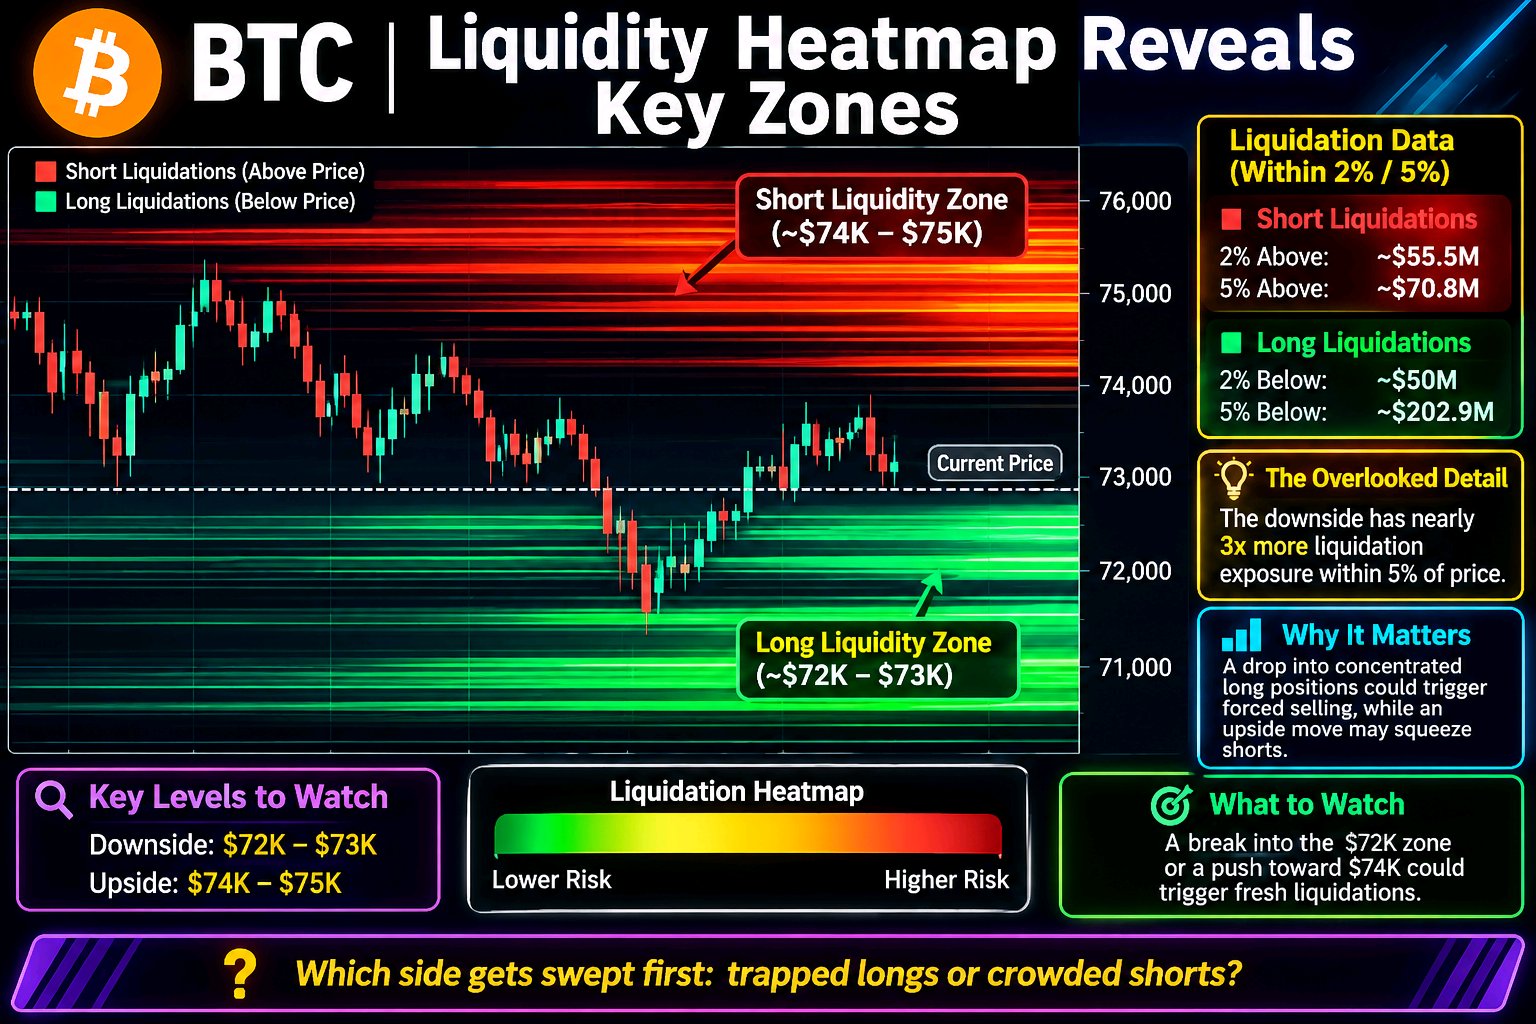
BTC Liquidity Clusters Reveal Two Key Zones
$BTCUSDT Bitcoin is approaching a liquidity battle on both sides, but the downside carries a much larger pool of potential liquidations. Market Observation — November 12 Around 05:26 UTC, BTC liquidation data showed: - Long liquidations within 2% below price: approximately $50M. - Short liquidations within 2% above price: approximately $55.5M. - Long liquidations within 5% below: approximately $202.9M. - Short liquidations within 5% above: approximately $70.8M. The Overlooked Detail The downside has nearly three times the estimated liquidation exposure within 5% of price. Why It Matters A drop into concentrated long positions could trigger forced selling and accelerate volatility. Meanwhile, an upside move could squeeze shorts near current levels. What to Watch Watch the $72K–$73K downside area and nearby $74K–$75K upside liquidity. These are estimated liquidation zones, not guaranteed price targets. Which side gets swept first: trapped longs or crowded shorts? #NovUSCPIWatch #AnthropicIPOTestsTheAIBoom #USPayrollsAndRateDecisionsDriveMacroWeek

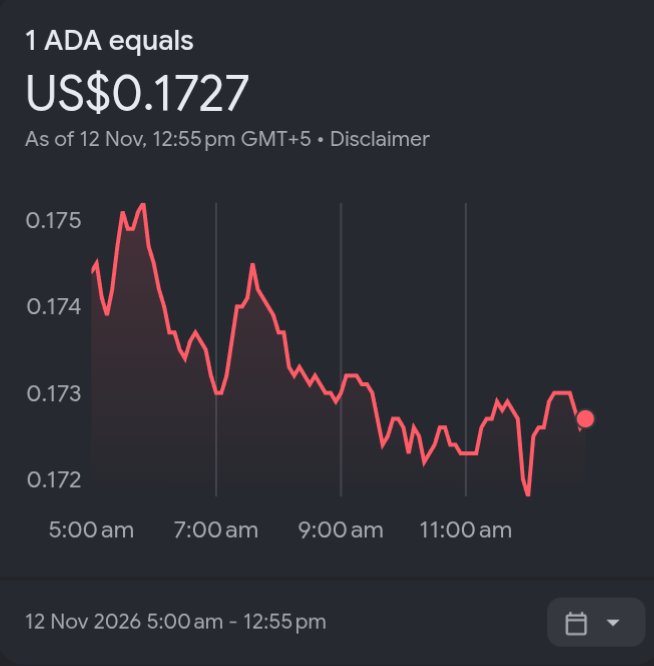
CARDANO (ADA) LATEST MARKET UPDATE 🚨
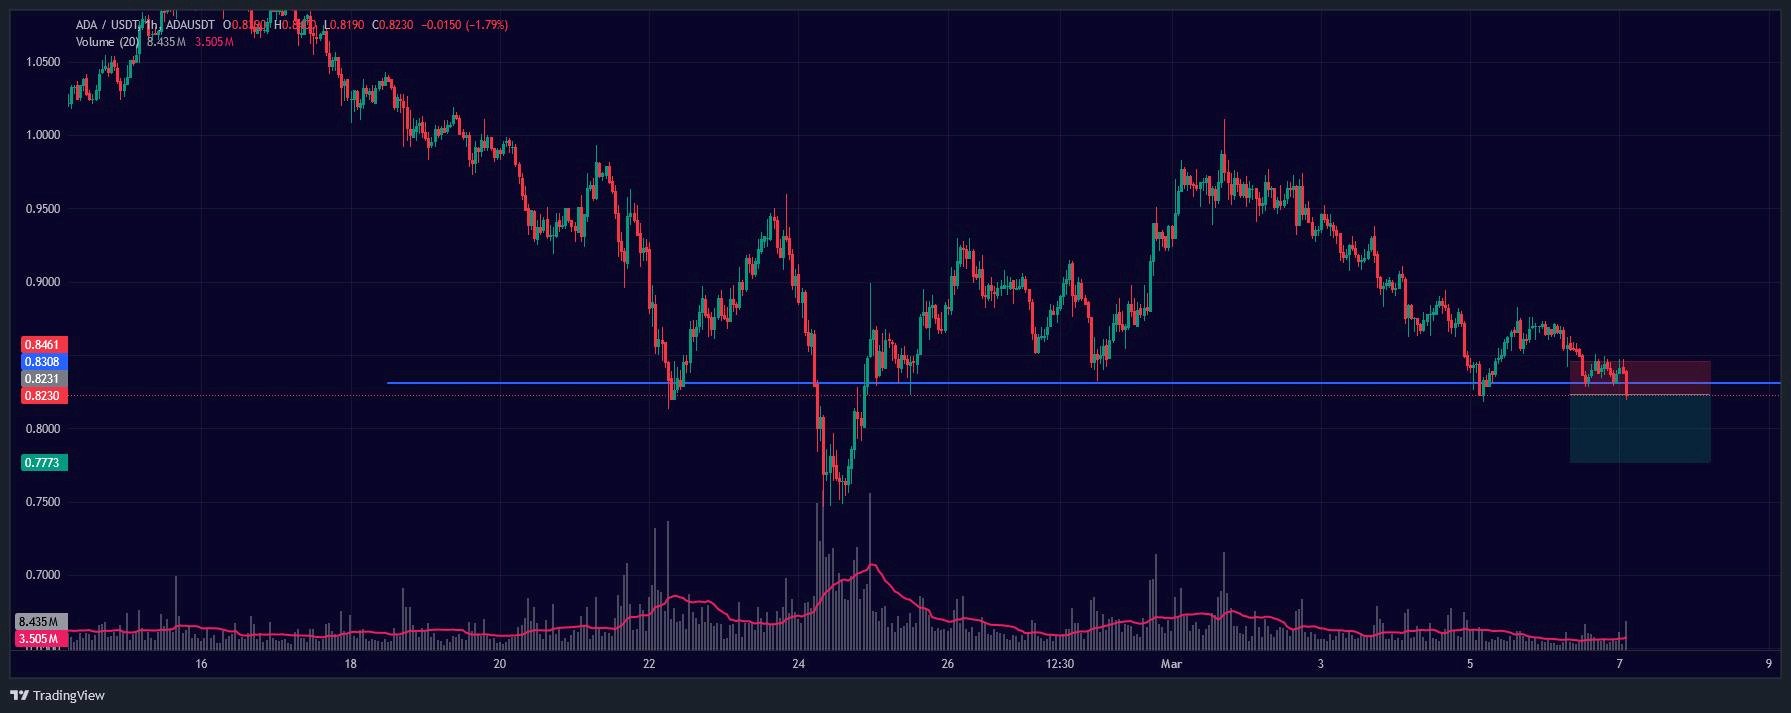
$ADAUSDT CARDANO (ADA) MARKET ANALYSIS | NOVEMBER 12, 2026 Cardano is currently trading around $0.1742, with sellers maintaining pressure on the daily timeframe. 📊 Technical Overview: • Current Price: $0.1742 • Resistance 1: $0.1782 • Resistance 2: $0.1827 • Support 1: $0.1706 • Support 2: $0.1648 📈 Bullish Scenario: A strong breakout above $0.1782 could push ADA towards $0.1827. 📉 Bearish Scenario: A breakdown below $0.1706 could bring further downside towards $0.1648. Market Sentiment: Bearish in the short term. RSI indicates weak momentum, so traders should watch for confirmation before entering positions. 🎯 My Strategy: Watch key support and resistance levels. Avoid chasing sudden price movements. What is your prediction for ADA? 🚀 BULLISH or 🔻 BEARISH? #USPayrollsAndRateDecisionsDriveMacroWeek #NovUSCPIWatch #AnthropicIPOTestsTheAIBoom #OilVolatilityTracksIranPeaceTalks #PiecesOf8 #ADA #Cardano #CryptoAnalysis #BinanceSquare #CryptoTrading


🥷$ASTER:BEYOND PRICE ACTION
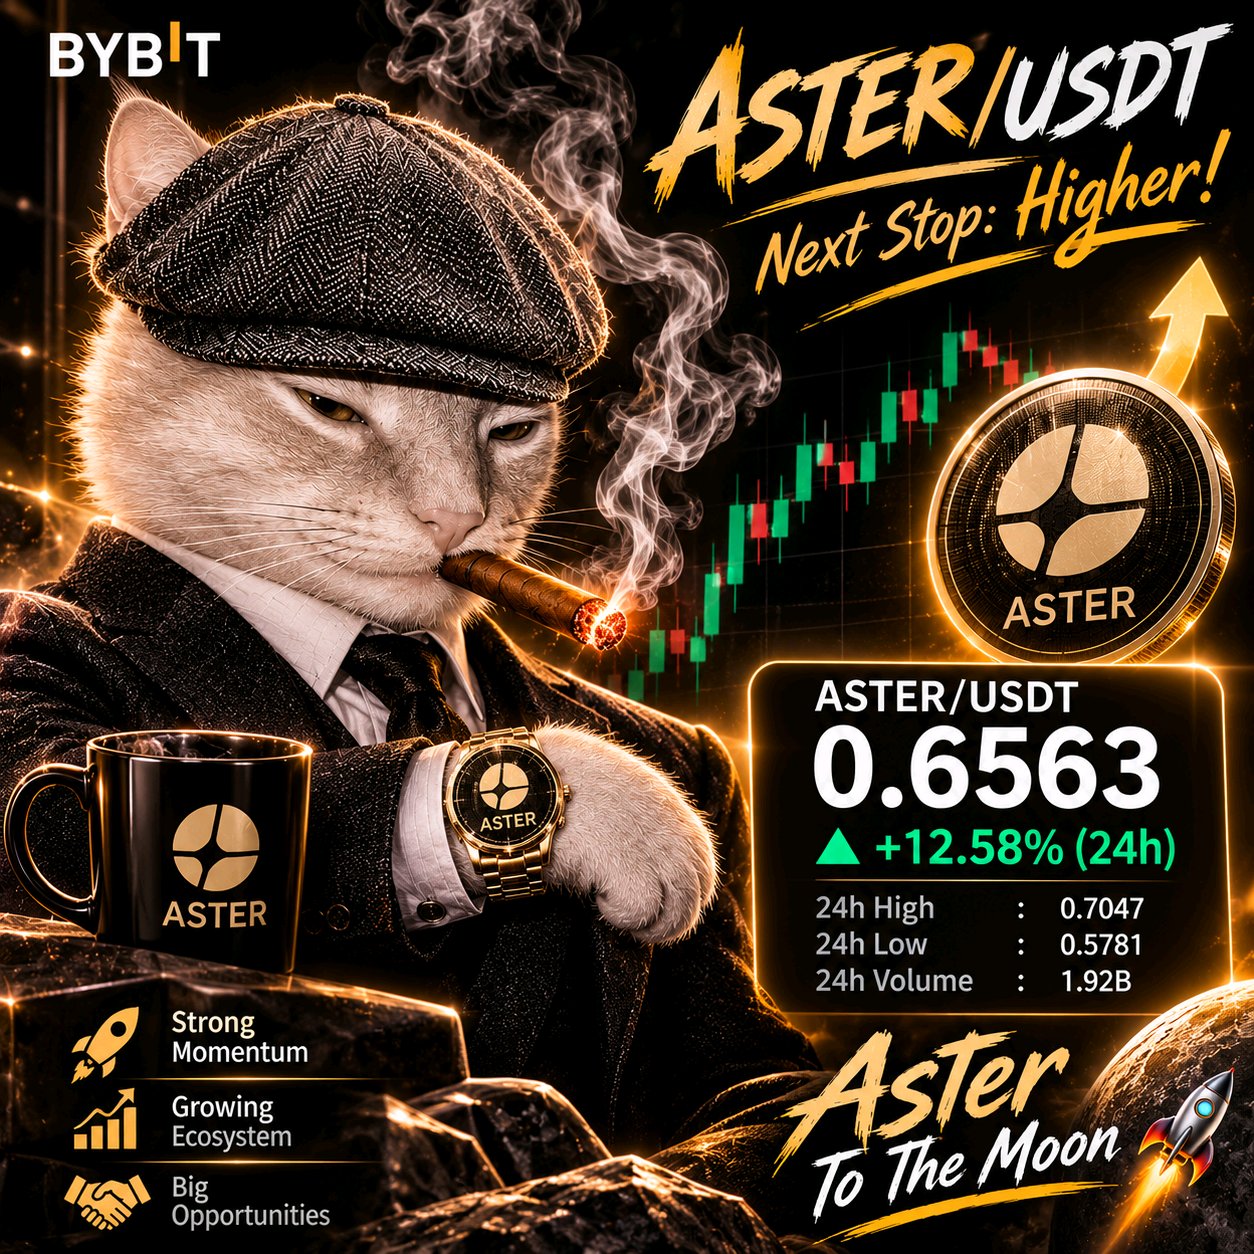
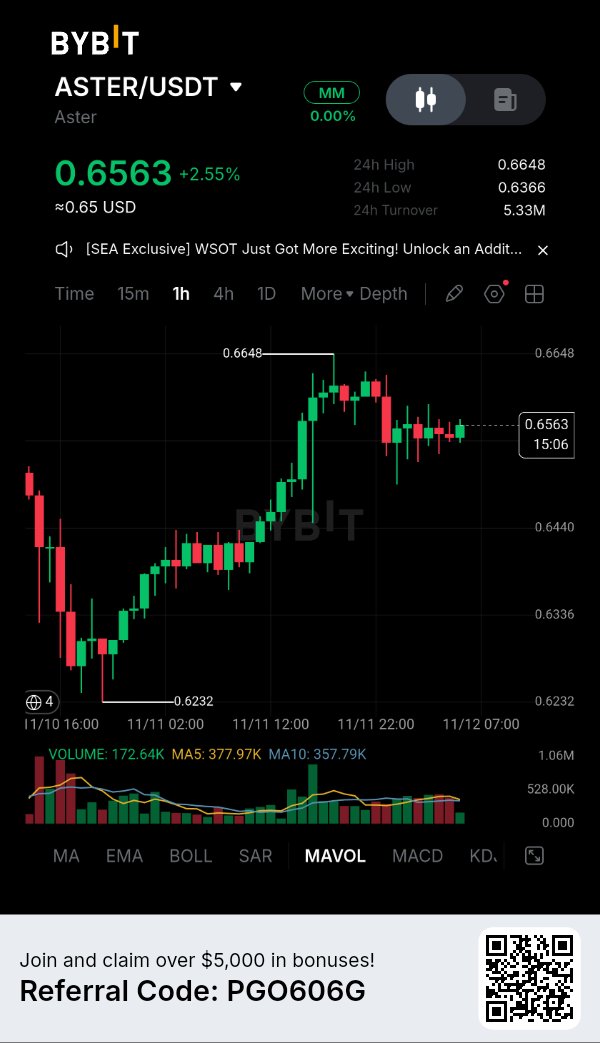
Aster is attracting attention, but the real opportunity may lie beyond short-term price movements. The project recently reported $35 billion in cumulative taker volume through its USD1 RWA Boost program after 10 epochs. This highlights significant trading activity, although volume should not be confused with revenue or net capital inflows. Sotwe Market overview — November 12: ASTER price: approximately $0.6548 24H change: +2.39% 24H range: $0.6362–$0.6643 Open interest: approximately $368.47M What I'm watching: The $0.6362 area is an important short-term reference. A confirmed breakout above $0.6643 could strengthen bullish momentum, with $0.68 as the next area to monitor. However, failure to hold support could expose ASTER to renewed selling pressure. Fundamentally, Aster's combination of perpetual trading, RWA exposure, multi-chain infrastructure and fee-linked buybacks makes it an interesting DeFi ecosystem to follow. Its long-term success will depend on sustainable adoption, real revenue and token utility. DefiLlama +1 My perspective: I'm interested in ASTER's ability to transform trading activity into sustainable ecosystem growth. A price rally is temporary; real utility is what deserves long-term attention. 💬 Do you believe ASTER has the potential to become a major player in DeFi? $ASTERUSDT #ByXIMPACT #USInflationRunsHotAndRateHikeBetsRise #USPayrollsAndRateDecisionsDriveMacroWeek #OilVolatilityTracksIranPeaceTalks #AnthropicIPOTestsTheAIBoom

THANKS TO MY BYBIT FAMILY
💙 BYBIT FAMILY — STRONGER TOGETHER, GROWING TOGETHER! 🚀 Every great journey becomes special because of the people who walk alongside us. My Bybit family, you are more than followers; you are a community built on support, trust, friendship, and shared dreams. I truly appreciate every like, comment, repost, and encouraging word. Your love and support motivate me to keep creating, learning, sharing, and growing every single day. The digital world is full of opportunities, but the real achievement is building genuine connections with amazing people. Let's continue supporting one another, celebrating every milestone, and making this journey unforgettable. Thank you, Bybit family, for being part of my journey. ❤️ Together we grow, together we shine! #Bybit #BybitFamily #CryptoCommunity #TogetherWeGrow #PiecesOf8 #DeutscheBankLaunchesDigitalAssetCustody #NovUSCPIWatch #AnthropicIPOTestsTheAIBoom #USPayrollsAndRateDecisionsDriveMacroWeek $NEARUSDT $ETHUSDT


🚨 BITCOIN UNDER SELLING PRESSURE — WHAT'S NEXT?
Bitcoin traders need to stay alert. When the market turns red, panic is not a strategy. What I'm Watching: 1. Selling pressure and lower highs 2. Key support levels 2. Trading volume and breakout confirmation Bullish Scenario: If buyers regain control and BTC breaks above resistance, a recovery could develop. Bearish Scenario: If support breaks with strong selling volume, further downside may follow. My approach is simple: Wait for confirmation instead of chasing market movements. Remember, protecting capital is just as important as finding opportunities. What do you think? Is Bitcoin preparing for a recovery or another correction? $BTCUSDT $SOLUSDT #BitcoinHitsTwoMonthLowAfterUSMidterms #USPayrollsAndRateDecisionsDriveMacroWeek #AITechSelloffErases2Point5TrillionFromNasdaq100


アダム・バックの100万ドルの賭けには、別のサイクルが必要だ
今週のCNBCで、アダム・バック氏はビットコインのサイクルはまだ初期段階にあると述べ、個人的にはサイクルが終わるまでに100万ドルを超えると予想している。彼はそれを2028年と見ている。出回っている引用では「2028年後半」とされているが、私が見つけた報道では「2028年までに」としか書かれていない。BTCUSDT これは新しい予測ではない。彼は4月のビットコインカンファレンスで、そして6月にもコインテレグラフに対して、2028年までに50万ドルから100万ドルという予測を口にしており、今日の個人投資家やETFの需要だけでも十分である可能性があると主張していた。彼の論理は、ビットコインの普及の大部分(彼は約95%と推測している)はまだこれからであり、退職金やファンドといった巨大な資金はまだ本格的に流入していないというものだ。彼はこれを保証ではなく、個人的な賭けと呼んでいる。 そこで私は計算してみた。11月10日から11日にかけての約73,000ドルから74,000ドルという価格からすると、100万ドルは現在の価格の約13.5倍から13.7倍に相当する(私の計算)。 2028年末までにそこに到達するには、「2028年後半」が12月を指すか10月を指すかによって異なるが(私の計算)、ビットコインは年間約240%から290%の複利で成長する必要がある。その価格では、ネットワーク全体の価値は約20兆ドルとなり、コインの総発行枚数は約2010万枚となる(私の試算)。 私がずっと考えているのはタイミングの問題だ。過去4回のピークはすべて半減期から12~18ヶ月後に訪れ、そのたびに弱気相場が続いている。 - 2013年11月:2012年の半減期から約12ヶ月後 - 2017年12月:2016年の半減期から約17ヶ月後 - 2021年11月:2020年の半減期から約18ヶ月後 - 2025年10月、約126,000ドル:2024年4月の半減期から約17~18ヶ月後 これらの日付は複数のサイクル追跡データ(CoinGeckoが最初の3つをカバーしている)と一致しているが、正確な日は取引所によって異なる。6月の安値は約58,000ドルから59,000ドルだった。 2028年に100万ドルに到達するには、今回のサイクルの真のピークは過去4回よりも遅く訪れなければならない。 ビットコインへのエクスポージャーを提供する企業であるストラテジー社は、10月29日、次の強気相場の始まりが見えると述べた。それに対し、米国のスポットETFは11月9日までの2026年の時点で約11億ドルのマイナスとなっており、ビットコインは11月8日の週次終値で50週平均線を下回った。 私の見解:2028年までに100万ドルという主張は、「まだ序盤」という言葉よりもはるかに大きな主張だ。 私は一つのチェックポイントに注目している。2027年中にビットコインが再び126,000ドルを超えれば、現時点から約70%から73%の上昇となる(私の計算)。もし2027年末時点でその数値を下回っていれば、2028年の100万ドル到達には単年で少なくとも約8倍の上昇が必要となり、価格が低ければさらに高い倍率が必要になる。 原油価格の変動がイランの和平交渉に連動米国雇用統計と金利決定が主導するマクロ週 AnthropicIPOValuationTest Bybit8周年記念 11月米国CPIウォッチ

MY CRYPTO JOURNEY
My Crypto Journey — 3 Years of Hope, Losses and Learning* Three years ago, I was jobless. No income. No source. Life felt stuck. Then crypto found me. Crypto did not make me rich. It gave me something bigger — hope. It gave me a reason to wake up, to learn, to try again when everything felt closed. I started with Creator Pad campaigns and social media campaigns. I learned posting, engaging, building, and staying consistent. In trading, yes, I faced big losses. Losses that hurt and cannot be cured. But campaign rewards helped me survive, stay alive in this market, and keep going. My experience in crypto is not bad. It taught me patience, discipline, and reality. There is so much to learn about trading, about market, about myself. Now I want one thing more — friends. Because in this digital world, without friends, you are nothing. With friends, every loss becomes a lesson, and every win becomes a celebration. If you are on this journey, let's connect and grow together. #PiecesOf8 #AnthropicIPOTestsTheAIBoom #USPayrollsAndRateDecisionsDriveMacroWeek #NovUSCPIWatch #DeutscheBankLaunchesDigitalAssetCustody $BTCUSDT $NEARUSDT

SUPRA vs NIGHT
#IMPACTbyTrade #WSOT2026 #AITechSelloffErases2Point5TrillionFromNasdaq100 #NovUSCPIWatch #USPayrollsAndRateDecisionsDriveMacroWeek SUPRA vs NIGHT — Comparative Market Analysis 1H Technical Outlook | 12 November 2026 Which coin has the stronger momentum? Which has better entry potential? Where might the whales be positioning? both coins are showing bullish structures, but they are at different stages of their market movements. SUPRA: Aggressive breakout, strong buying momentum, but significantly overbought. NIGHT: Strong upward movement followed by consolidation, with a healthier RSI but weakening momentum. My initial assessment: SUPRA has stronger immediate momentum, while NIGHT currently offers a more balanced technical setup. 1. Side-by-side comparison Chart time frame, 1H (1H) Price in screenshot, $0.0001450 ($0.04746) 24H change, +14.72%(+10.60%) RSI(6), 86.77 (59.90) RSI(12)82.59 (65.48) RSI(24), 75.40 (65.61) MACD, Bullish (Slightly bearish) Volume trend, Increasing (Declining) Price structure, Breakout (Consolidation) Immediate condition, Overextended (Cooling off) What this comparison tells us SUPRA is winning the momentum battle. Its breakout has stronger volume confirmation, and its MACD remains bullish. However, the extreme RSI readings make chasing the price dangerous. NIGHT is winning the short-term risk/reward setup. Its RSI is healthier, and it is consolidating above important moving averages. However, declining volume and a bearish MACD crossover mean another upward move is not yet confirmed. 2. Whale positioning — Where is the big money? This requires separating actual on-chain evidence from what a candlestick chart suggests. SUPRA: Whale assessment There are three important observations: SUPRA has recorded a sharp price increase accompanied by rising trading volume. CoinGlass reported positive spot net inflows in its November 11 snapshot, although the reported inflow was relatively small. SupraTools provides tracking for large wallet movements, staking, unlocks and exchange transfers. However, I cannot establish from the available evidence that large investors are accumulating SUPRA right now. Positive spot inflows alone do not prove whale buying. Whale interpretation: Possible accumulation, but confirmation is missing. NIGHT: Whale assessment NIGHT presents a more interesting ownership picture. Cardanoscan currently reports: Approximately 127,435 holders. Top 100 holders control approximately 81% of supply. Top 10 holders control approximately 59.2%. 16 wallets are classified as whales, holding approximately 66% of supply. Cardanoscan There is also evidence of significant large-wallet trading. Recent reported transactions include: A purchase of approximately 891,584 NIGHT. A sale of 500,000 NIGHT. Another purchase of approximately 476,202 NIGHT. A sale of approximately 488,139 NIGHT. Super Cardano Whale interpretation: Large holders are active, but their positioning is mixed. The concentration of NIGHT ownership is an important risk. Large holders can influence liquidity and price movements. Important distinction: A large wallet is not automatically a whale accumulating. Some large wallets belong to exchanges, treasury operations, foundations or custodians. My assessment: SUPRA: Momentum-led buying, with whale confirmation still needed. NIGHT: Concentrated ownership, with evidence of substantial buying and selling. Neither chart proves that whales are preparing for another pump. 3. Strengths and weaknesses SUPRA — Supra Strengths Strong bullish breakout. Increasing trading volume. Positive MACD momentum. Strong short-term buying interest. Potential for continuation if resistance breaks. Weaknesses RSI readings are dangerously elevated. Vulnerable to sudden profit-taking. A breakout failure could trigger a sharp retracement. Whale accumulation is not yet independently confirmed. Relatively small market depth can increase volatility. $SUPRAUSDT $NIGHTUSDT


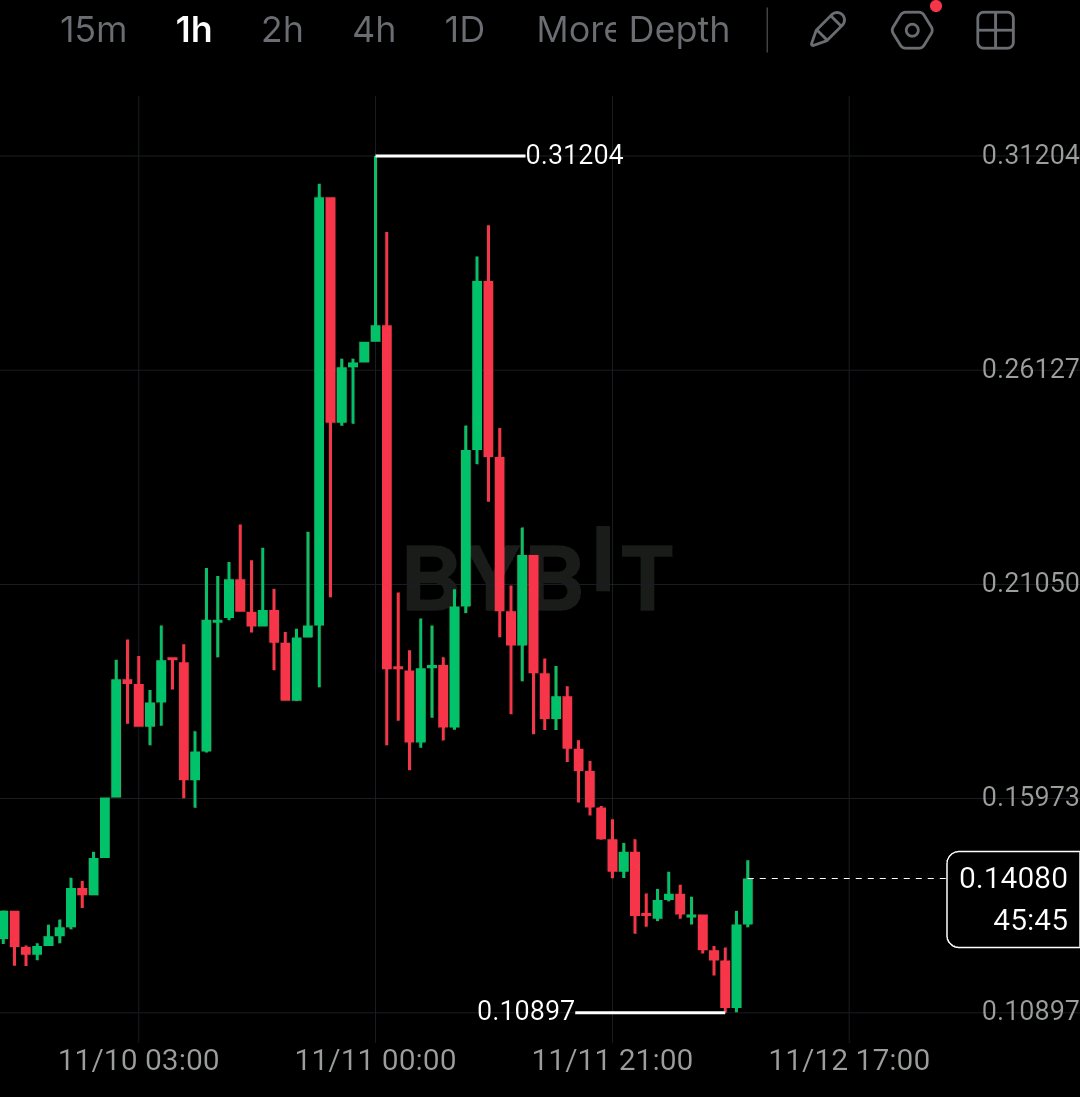
$INITUSDT at $0.1426 after a -54% crash and I am not buying this bounce yet I saw INIT pump straight to $0.39500 and then dump to $0.11046 in the same day. That is not a normal move, that is a pump and dump. Now it is at $0.14264, trying to hold. That bounce looks green, but I have seen this trap before. I am not calling a bottom just because we bounced from $0.11046. For me $0.11046 is the floor that must hold. That is the 24h low. If we lose it with a close below, $0.09623 opens fast. On the upside $0.15883 is the first wall. Break and hold above $0.15883 and $0.18296 opens. My plan is simple. I am not buying $0.1426 in the middle. If we hold $0.11046 and close above $0.15883, I look long toward $0.18296, stop below $0.11046. If $0.11046 breaks, I step aside, short toward $0.09623 only on confirmed close below. Risk 1 to 2% only, 5x to 10x isolated max. This coin just moved -54% in a day, I am keeping size small. Tell me, does $0.11046 hold or does $0.15883 reclaim first? Comment HOLD if $0.11046 holds, BREAK if $0.09623 comes. Tap $INITUSDT to trade this $0.11046 test, trade on this same coin. @BybitX @Bybit Learn @612 Ceros @SignalX @Demon - Trader @RoYoK @IBLOLO #IMPACTbyTrade #USPayrollsAndRateDecisionsDriveMacroWeek #AnthropicIPOTestsTheAIBoom #PiecesOf8 #WSOT2026 #USInflationRunsHotAndRateHikeBetsRise
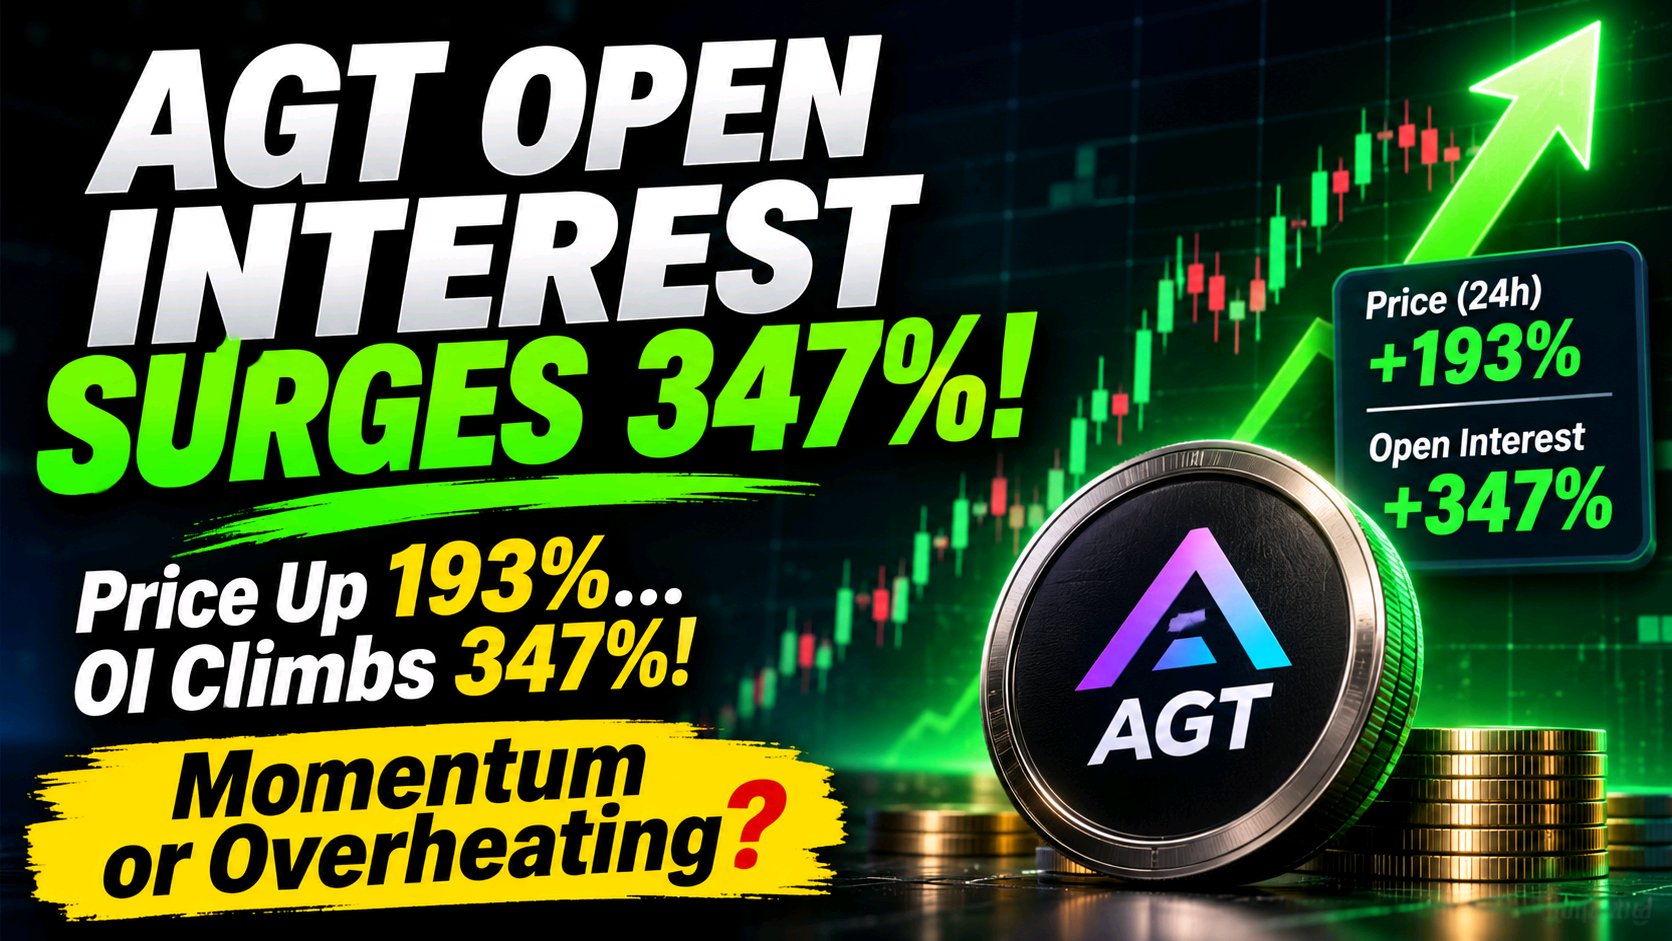
AGTのオープンインタレストが347%急騰!
#BybitAI進化中 $AGTは、レバレッジ取引の活発化に伴い、投機的な注目を大きく集めています。 AGTは24時間で約193%の上昇を記録し、建玉(OI)は347%近く急増して約6,700万ドルに達しました。 **重要なポイント:** 建玉(OI)が価格よりも大幅に速いペースで上昇しています。これは、積極的な新規レバレッジポジションが市場に参入していることを示唆しています。 一方で、約230万ドル規模のショートの強制決済が発生しており、弱気派のトレーダーが大きな圧力にさらされていることがわかります。 **なぜ重要なのか:** 価格とOIの上昇は、市場参加者の拡大を示唆しています。しかし、8時間ごとの資金調達率(ファンディングレート)が0.13%付近まで上昇していることは、ロングポジションが過熱している可能性を示しています。 **注目点:** 出来高を伴って価格が上昇し続ければ、強気モメンタムは維持される可能性があります。しかし、OIが減少する中で価格が反転すれば、ロングポジションの解消(巻き戻し)の合図となるかもしれません。 AGTは持続的なモメンタムを築いているのか、それとも過剰なレバレッジが次なるボラティリティショックの引き金となるのか。 #米国雇用統計と金利決定が主導するマクロ週 #11月米国CPIウォッチ
重要な価格帯
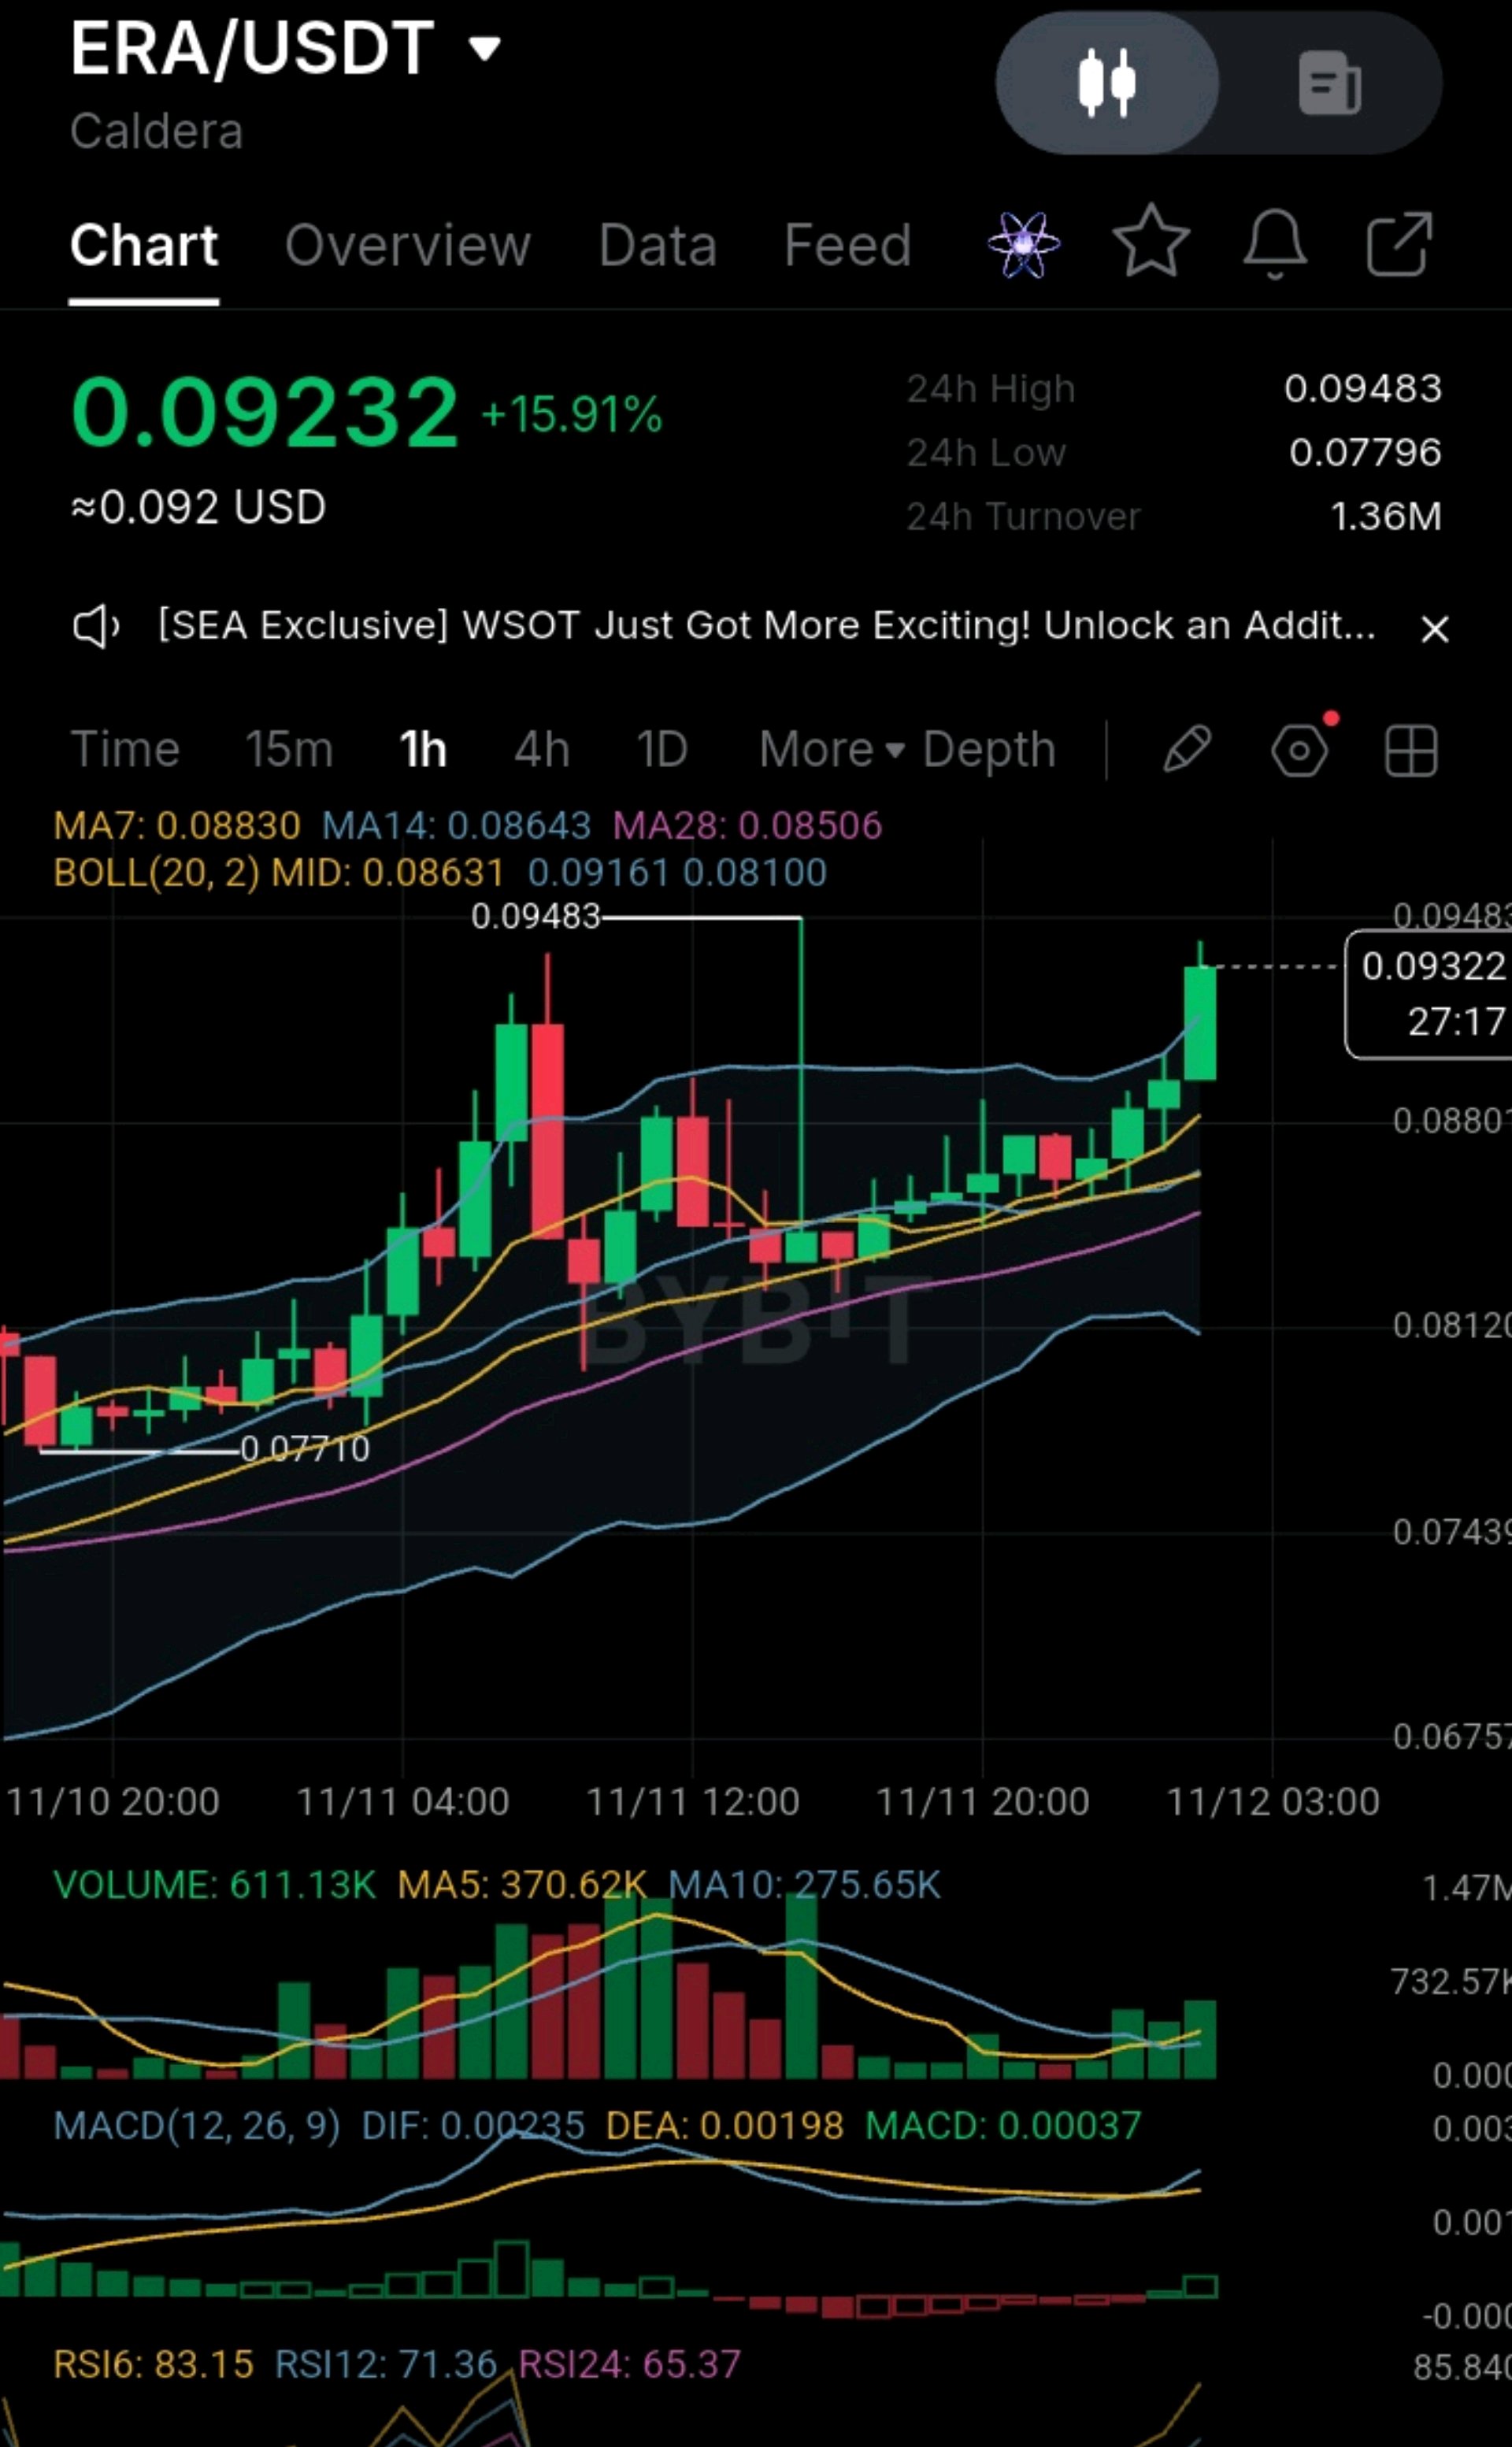
#ByXIMPACT #米国のインフレ率は高止まりし、利上げ観測が高まる #AITechSelloffErases2Point5TrillionFromNasdaq100 #米中間選挙後、ビットコインが2か月ぶりの安値を記録 #米国雇用統計と金利決定が主導するマクロ週 ERAは安値を切り上げるきれいな階段状の動きを経て、24時間高値に再び迫っています。 次の1時間足の終値で、0.0948を突破できるか、それとも2度目の失敗となるかが決まります。 この1時間足チャートを見てください。ERAは0.0771の安値から上昇し、0.09483まで急騰した後、押し目を形成して移動平均線の上を維持し、再び反発しました。 直近の陽線はボリンジャーバンドの上限を突き抜け、以前の高値を試しています。価格は0.0923〜0.0932付近で、その日の上昇率は15.91%です。ローソク足はまだ確定まで約27分あるので、終値で判断しましょう。 強さのポイント: 価格はMA7 (0.08830)、MA14 (0.08643)、MA28 (0.08506) の上にあり、各移動平均線は強気トレンドの順序で重なり、上昇しています。 MACDはゴールデンクロスしたばかりです (DIF 0.00235、DEA 0.00198、ヒストグラム +0.00037)。 出来高もそれを裏付けています。現在のバー(611.13K)はMA5(370.62K)とMA10(275.65K)を大きく上回っています。 これは押し目形成後としては異例の動きであり、ブレイクアウトの試みを後押ししています。 過熱のリスク: RSI6は83.15(RSI12 71.36、RSI24 65.37)となっており、短期的には買われすぎです。 価格はボリンジャーバンドの上限(0.09161)を超え、MA7からも約5%乖離しているため、上昇幅が拡大しすぎています。 0.09483は以前の反落ゾーンであり、ERAは今回で2度目のテストを行っています。 ダブルトップのテストは、強力な出来高を伴わない場合、失敗に終わることが多いです。 売買代金は控えめ(1.36M)なため、反転が急激になる可能性があります。 重要な水準: レジスタンス: 0.09483(24時間高値)、その次は概ね0.0990〜0.1000(キリ番付近の目安であり、強固な水準ではない) サポート: 0.09161(バンド上限)、0.08830(MA7)、0.08643(MA14)、0.08631(BB中央線)、0.08506(MA28)、その次は0.0810および安値0.0771 トレードプラン(例): 推奨エントリー: 0.0885〜0.0905の範囲への押し目買い。MA7や直近の保ち合いの上限付近で、理想的には反発を示すローソク足を確認すること。 損切り: 0.0860。MA14とBB中央線のすぐ下に設定。終値でここを割り込んだらセットアップは無効。 ターゲット1: 0.09483(0.0895エントリーから約1.5R) ターゲット2: 0.0990(約2.7R) ブレイクアウト狙いの代替案: 出来高を伴って0.09483を上抜けて1時間足が確定した場合。損切りは0.0910の下に設定し、損切り幅が広くなるためポジションサイズは小さめに。 ポジションサイズ: 損切り幅に対して口座資金の1〜2%のリスクに抑えること。ターゲット1で一部利益確定し、損切りを建値に移動する。 シナリオが崩れた場合: 0.0860を下回ると、MA28(0.08506)への下落、さらには0.0810(バンド下限)まで下落する可能性がある。そこを割り込むと0.0771の安値が視野に入る。 結論: 出来高とMACDがトレンドと一致しているため、健全なセットアップの一つです。しかし、RSI6が83を超えていることや、以前の高値を再テストしていることを考えると、高値掴みは避け、MA7付近への押し目を待つか、0.09483を出来高を伴って明確に上抜けるのを待つのが得策でしょう。 アクション: 0.0890までの押し目を狙いますか?それとも0.0948の明確な突破を待ちますか?あるいはRSIが落ち着くまで様子見ですか?チャンスを逃さないよう、0.09483と0.0860にアラートを設定しておきましょう。 これは議論のためのテクニカル分析であり、投資助言ではありません。 $ERAUSDT
12月の利上げが再び検討対象に浮上
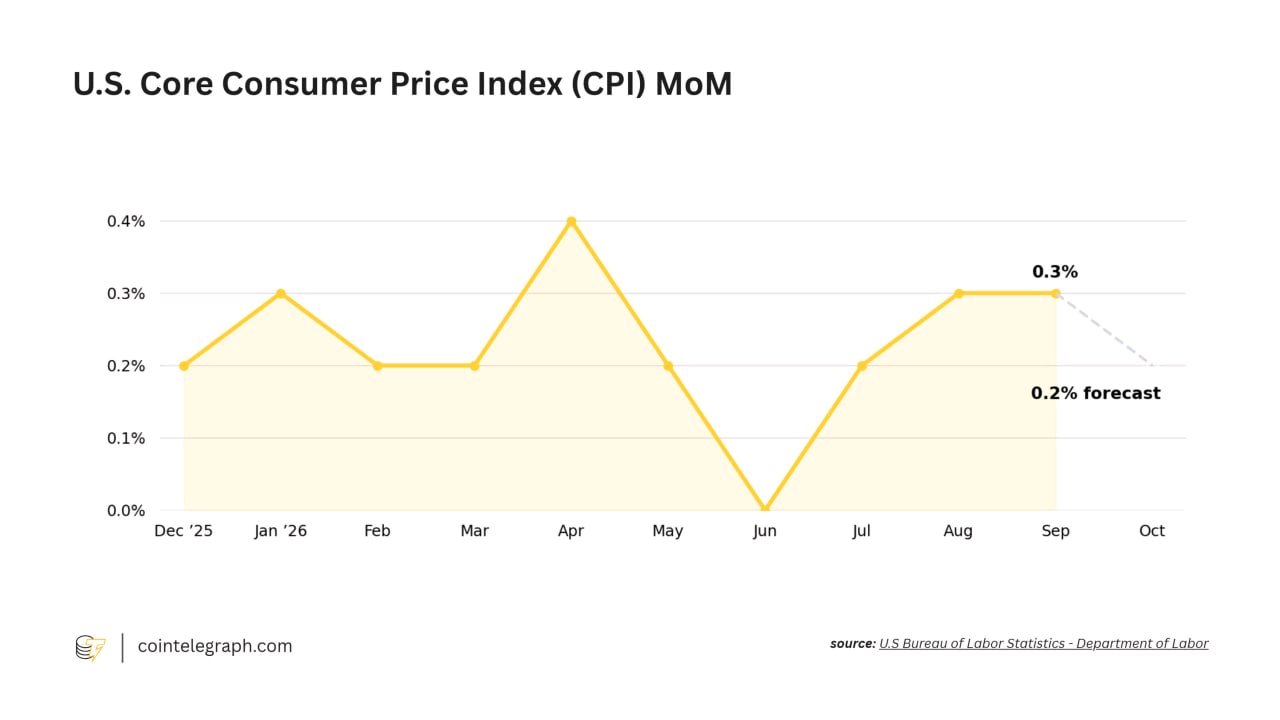
12月はFRBから再び衝撃が走る可能性がある。 ウォラー理事は0.25〜0.50%の利上げの可能性を示唆しており、予想される10月のコアCPI 0.2%がその決定に影響を与える可能性が高い。 $BTCUSDT 市場はすでに予想を織り込んでいるが、インフレデータが今後のシナリオを決定づけるだろう。 たった一つのCPI指標が、リスク資産に大きな影響を与えることになる。 #米国のインフレ率は高止まりし、利上げ観測が高まる #米中間選挙後、ビットコインが2か月ぶりの安値を記録 #11月米国CPIウォッチ #米国雇用統計と金利決定が主導するマクロ週 #原油価格の変動がイランの和平交渉に連動
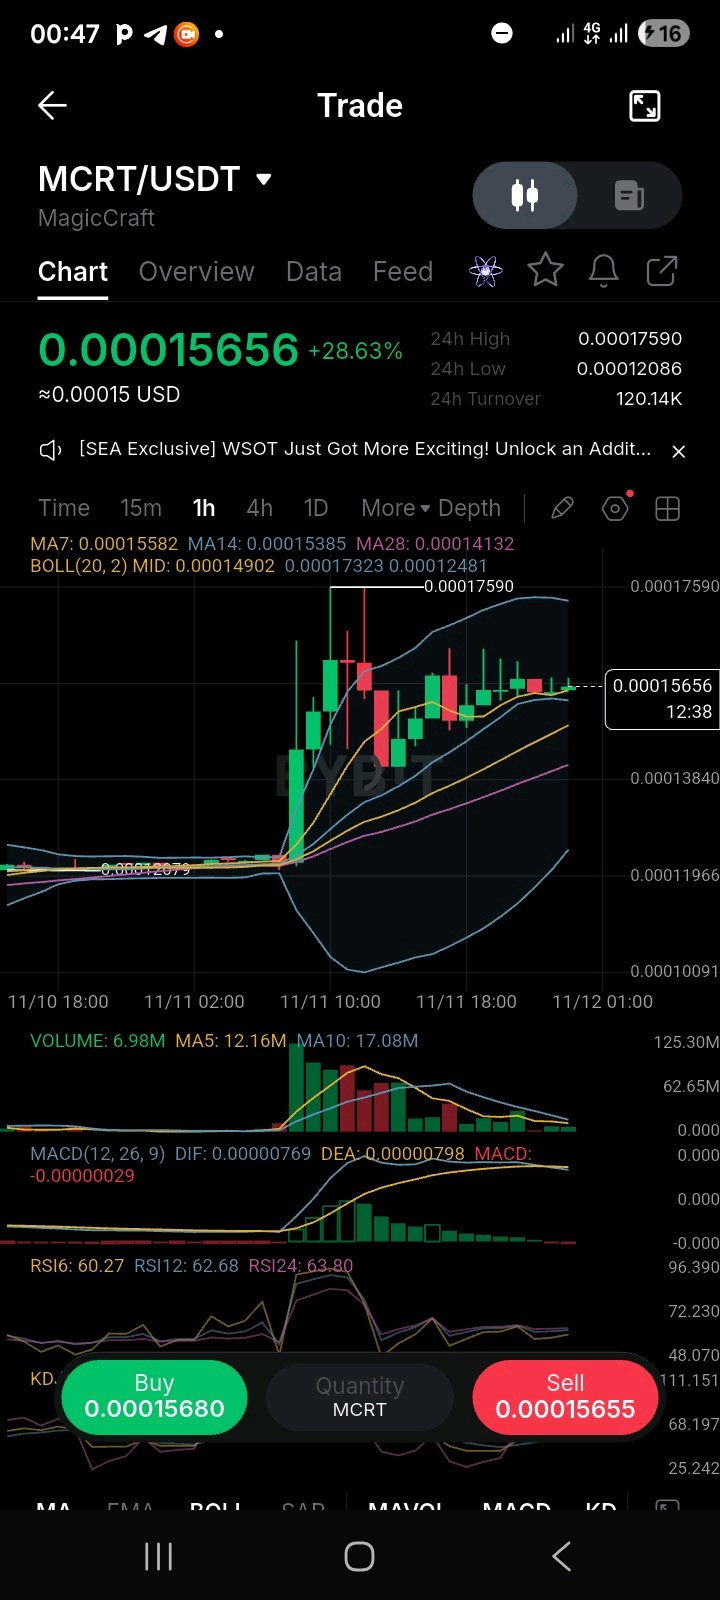
MCRTは爆上げしたね
#IMPACTbyTrade #米国のインフレ率は高止まりし、利上げ観測が高まる #WSOT2026 #米国雇用統計と金利決定が主導するマクロ週 #原油価格の変動がイランの和平交渉に連動 MCRTは急騰後に一服し、現在は24時間高値圏の直下で狭いレンジで推移している。 次の1時間足の終値次第で、これが第2波に向けたフラッグ(旗型)なのか、それとも反落(フェード)なのかが決まるだろう。 この1時間足チャートを見てほしい。MCRTは0.00012付近で数時間横ばいだった後、出来高を伴う大きな陽線で0.00017590の高値まで急騰した。 その後、上値を拒否されて0.00014付近まで押し戻され、現在はMA7/MA14の上で小さなローソク足を形成し、保ち合いとなっている。 価格は0.00015656で、本日は28.63%上昇。現在のローソク足はまだ確定していない(残り12分程度)ため、確定を見て判断すべきだ。 強気材料: 価格はMA7 (0.00015582)、MA14 (0.00015385)、MA28 (0.00014132)、そしてボリンジャーバンド(BB)の中央線 (0.00014902) を上回っている。 調整は秩序立っており、移動平均線を維持している。これは急騰後の値動きとしては建設的だ。 RSIは過熱圏から冷え込み、60〜64(RSI6 60.27、RSI12 62.68、RSI24 63.80)となっているため、チャート形状を崩さずに調整が進んでいる。 警戒すべきリスク: MACDはデッドクロスした。DIF (0.00000769) がDEA (0.00000798) を下回っており、ヒストグラムもわずかにマイナス。モメンタムは弱まっている。 出来高は枯渇気味で、現在は698万。MA5の1216万、MA10の1708万と比較しても少ない。大きな出来高はすべてブレイクアウト時のローソク足に集中していた。 0.00017590の高値は長い上ヒゲで拒否されているため、0.00017〜0.00017590のレンジには売り圧力が存在している。 売買代金は薄く (120.14K)、低価格銘柄での1日28%の上昇はすぐに反転する可能性がある。 主要レベル: レジスタンス: 0.00016500、次いで0.00017323(BB上限)、そして0.00017590(24時間高値) サポート: 0.00015582 (MA7)、0.00015385 (MA14)、0.00014902 (BB中央線)、0.00014132 (MA28)、その次は0.00012079のベースライン トレードプラン(参考): 推奨エントリー: 0.00015200〜0.00015450(MA14付近)への押し目。理想は反発を確認するローソク足が出てから。 ストップロス: 0.00014700。BB中央線のすぐ下。終値ベースでこれを割り込めば、このセットアップは無効となる。 ターゲット1: 0.00016500(0.00015300でエントリーした場合、リスクリワード比は約2.0) ターゲット2: 0.00017323(同 約3.4) ターゲット3: 0.00017590(24時間高値、同 約3.8) ブレイクアウト時の代替案: 出来高の増加を伴って1時間足が0.00017590を上抜けた場合。ストップは0.00016500の下に置く。ブレイクアウト追随はリスクリワードが悪いため、ポジションサイズは小さくすること。 ポジションサイズ: ストップまでの距離に基づき、口座の1〜2%のリスクに抑えること。ターゲット1で一部利食いし、ストップを建値まで引き上げる。 想定外の動き: 0.00014700を割り込んだ場合、MA28 (0.00014132) までの下落を想定すべきだ。そこをも割り込めば、0.00012のベースラインまで全戻しするリスクがある。 結論: チャートの形状は強気で調整も健全だが、モメンタムと出来高が弱まっている。MA14/BB中央線付近での反発、あるいは出来高を伴った0.00017590のブレイクアウトを確認するまでは手を出さない方が賢明だ。 1日で28%も上昇した後での追随買いは、リスクリワードが悪い。チャート上に材料が見当たらないため、まずは上場ニュースや何らかの発表がないか確認した方が良い。 アクション: あなたは0.000153での押し目買いを狙うか、0.0001759のブレイクアウトを待つか、それとも出来高が戻るまで様子見するか?どちらの動きも逃さないよう、0.0001759と0.0001470にアラートを設定しておこう。 これは議論のためのテクニカル分析であり、投資助言ではない。$MCRTUSDT
Strategy社の85万364 BTC:巨額であり、損益分岐点に近い
11月9日のSECへの提出書類によると、Strategy社は現在850,364 BTCを保有しています。これは流通供給量の約4.2%、あるいは2,100万枚の上限に対して約4.05%に相当します(筆者試算)。 見出しの内容は裏付けが取れていますが、いくつかの細かい注釈が必要です。$BTCUSDT 状況を比較してみましょう。BitcoinTreasuriesの11月9日時点のデータでは、BlackRockのIBITが約811,000 BTCを保有する最大のETFですが、その数字は10月26日時点のスナップショットと一致しており、IBITはその後資金流出が続いています。米国政府は約328,000 BTCを保有し、追跡対象の全政府を合わせると約646,000 BTCになります。Strategy社はこれらのいずれをも上回っています。ただし、米国の現物ビットコインETF全体(約130万BTCを保有、純資産959億ドルから筆者試算)には及びません。 私がランキング以上に興味深いと感じているのは、その保有のされ方です。 Strategy社の平均取得単価は75,456ドルです。11月9日から10日にかけてビットコインが74,800ドル近辺で推移していることを考えると、約5億5,000万ドルの含み損を抱えていることになります(筆者試算)。ビットコイン価格が1,000ドル動くごとに、損益は約8億5,000万ドル変動します。CPI発表後の安値である72,800ドル近辺では、含み損は約23億ドルに達していたでしょう。 先週の購入分は1,036 BTC(8,190万ドル相当)で、平均取得単価は79,012ドルでした。これはすでに取得単価を約5%下回っています(筆者試算)。 しかも、この資金はMSTR株の売却によって賄われています。同じ提出書類によると、株式売却益のうち1億8,830万ドルが優先株STRCの買い戻しに充てられました。これは購入したビットコイン額の2.3倍にあたります(筆者試算)。 つまり、最大の保有者といっても、ただ眠らせているわけではありません。資金調達を行い、自社の資本構成を積極的に管理しており、8月3日の提出書類によれば、配当やSTRCの買い戻しのために今年初めにはビットコインを一部売却さえしています。 私の見解:「最大の保有者」という点は事実。しかし「最も安全な保有者」かどうかは別の問題です。 私は3つの点に注目しています。ビットコイン価格対75,456ドルの動向。毎週の購入が株式売却によって継続されるかどうか。そして、STRCの買い戻しがビットコインの購入額を上回り続けるかどうかです。 #BybitAI進化中 #原油価格の変動がイランの和平交渉に連動 #米国雇用統計と金利決定が主導するマクロ週 #AnthropicIPOValuationTest #WSOT2026
🎯 كيف تعمل هذه اللعبة؟
توقع أسعار العملات الرقمية ونتائج الرياضة على اختيارك الرابح (ByPick): توقع مجانًا واربح مكافآت حقيقية. النقاط المجانية (CP): تحصل على نقاط "CP" مجانية عند التسجيل واستخدامها في التوقعات، وهي نقاط لا تحمل أي قيمة نقدية حقيقية ولا يمكن سحبها . · طريقة التوقع: تختار حدثاً معيناً وتضع توقعك (مثلاً: هل سيرتفع سعر عملة معينة؟). إذا كان توقعك صحيحاً، تربح المزيد من النقاط . · الترتيب والجوائز: يتم ترتيب المشاركين بناءً على عدد نقاط CP التي جمعوها خلال "الموسم". في نهاية الموسم، يتم توزيع جوائز حقيقية بالـ USDT على أصحاب المراكز الأعلى في لوحة الصدارة . #WSOT2026 #BybitAIEvolving #كشوف المرتبات الأمريكية وقرارات أسعار الفائدة تحرك الأسبوع الاقتصادي #مراقبة مؤشر أسعار المستهلك الأمريكي لشهر نوفمبر #تقلبات النفط تتبع محادثات السلام الإيرانية

2000 PKR Weekly: SEI, SUI, or DOGE? 🤔
My plan is to invest 2,000 PKR every week into one coin (DCA). Let's compare them based on current data: $SUIUSDT : · Current price is around 257 PKR. · Price is below key moving averages, and momentum is currently with the sellers. · However, major partnerships like Samsung Wallet are happening, which could pay off in the future. $SEIUSDT : · Current price is around 13.5 PKR. · Down 34% in the last 30 days. · One analyst suggests SEI has built a long base and could be preparing for a new rally. DOGE: · Price is around $0.068. · Whales have sold 750 million DOGE since Nov 3rd, putting pressure on the price. · It's a meme coin with no supply cap. My View: If you are looking to invest for the long term (1-2 years), SUI and SEI look like more solid projects. SUI has a strong ecosystem, and SEI might be preparing for a big rally. DOGE carries more risk right now since whales are selling and it lacks utility. My suggestion: Split the 2,000 PKR between SUI and SEI (1,000 each) to manage your risk. Which coin are you investing in? #USInflationRunsHotAndRateHikeBetsRise #BitcoinHitsTwoMonthLowAfterUSMidterms #BybitAIEvolving #OilVolatilityTracksIranPeaceTalks #USPayrollsAndRateDecisionsDriveMacroWeek
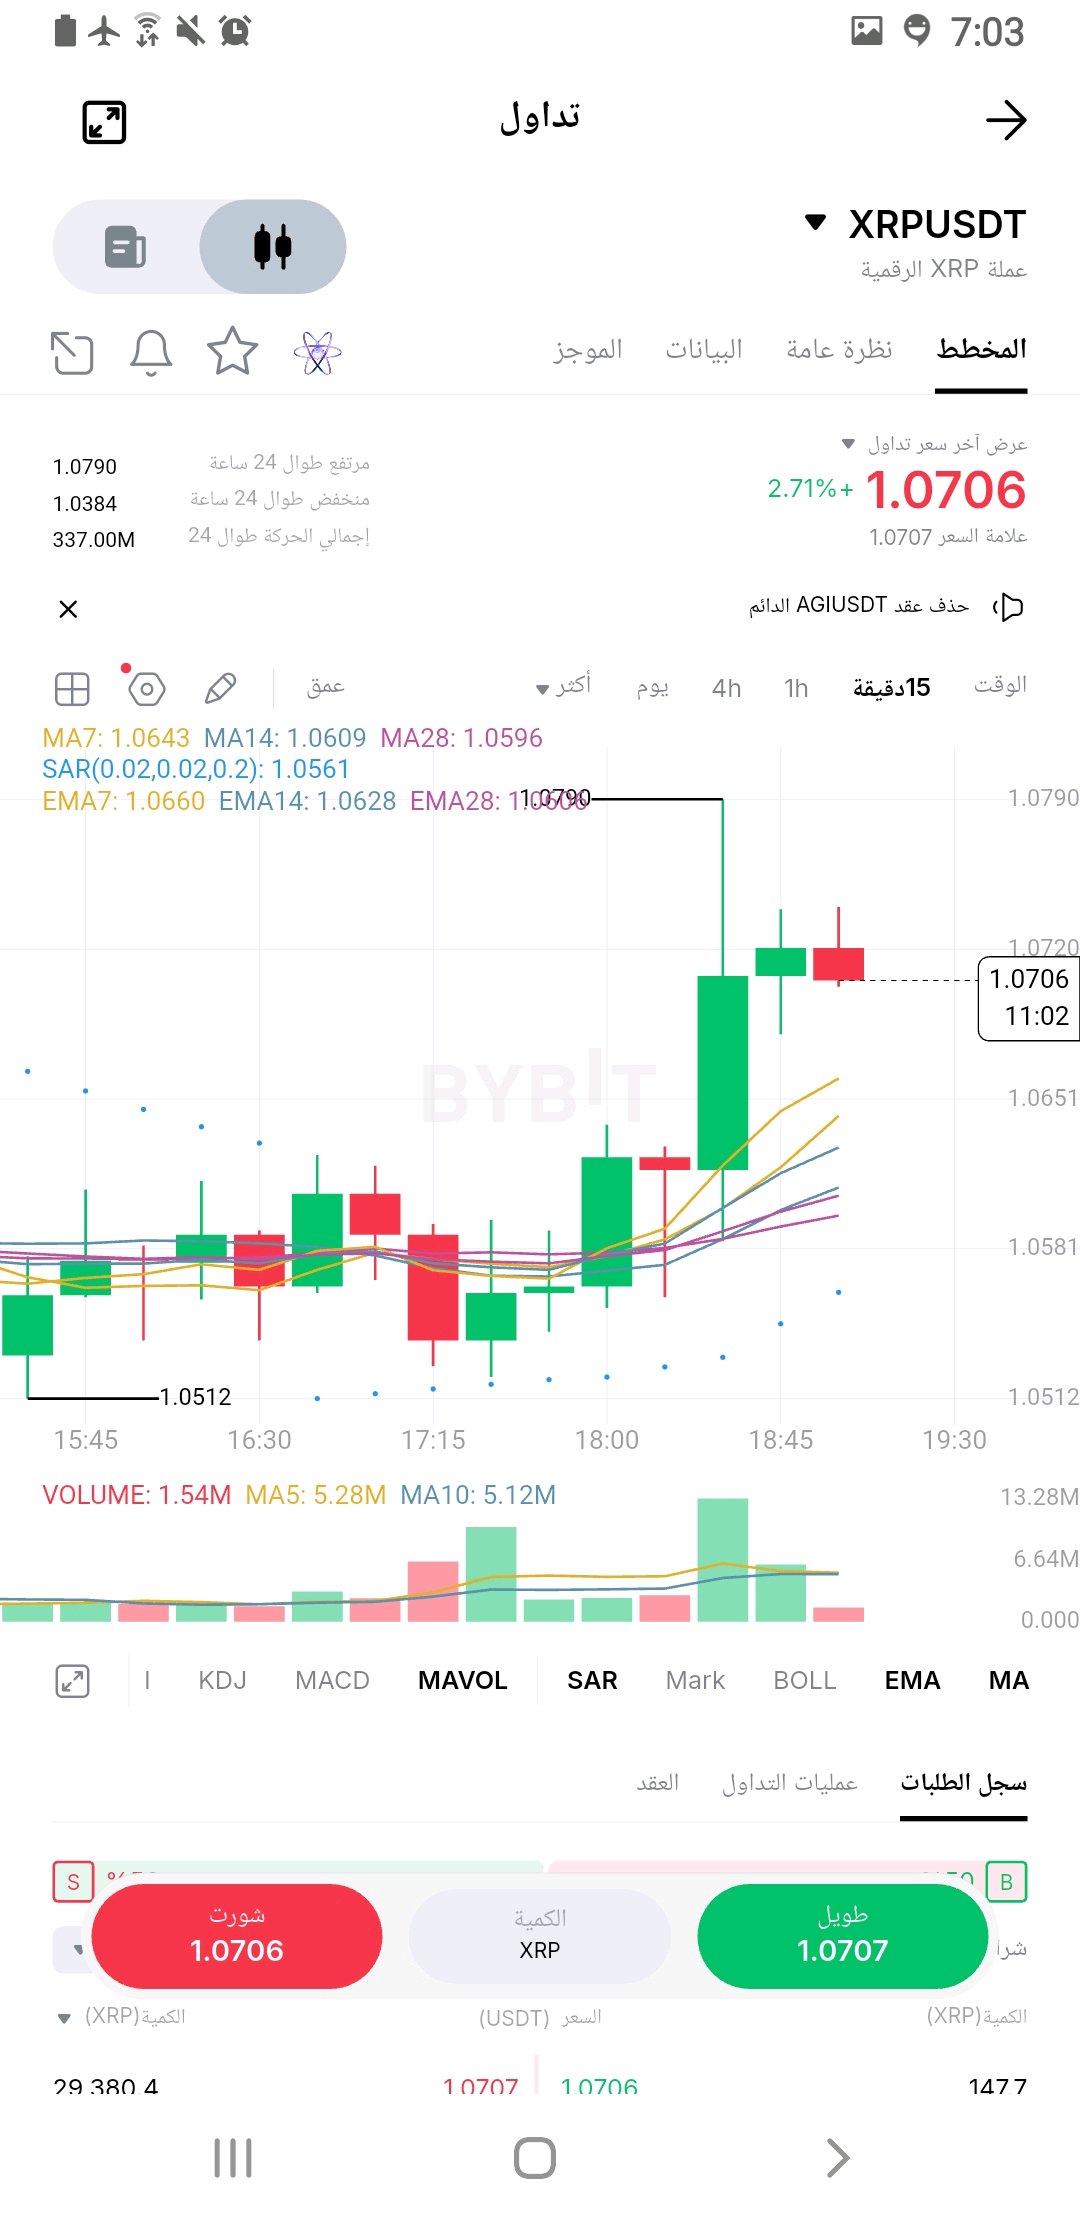
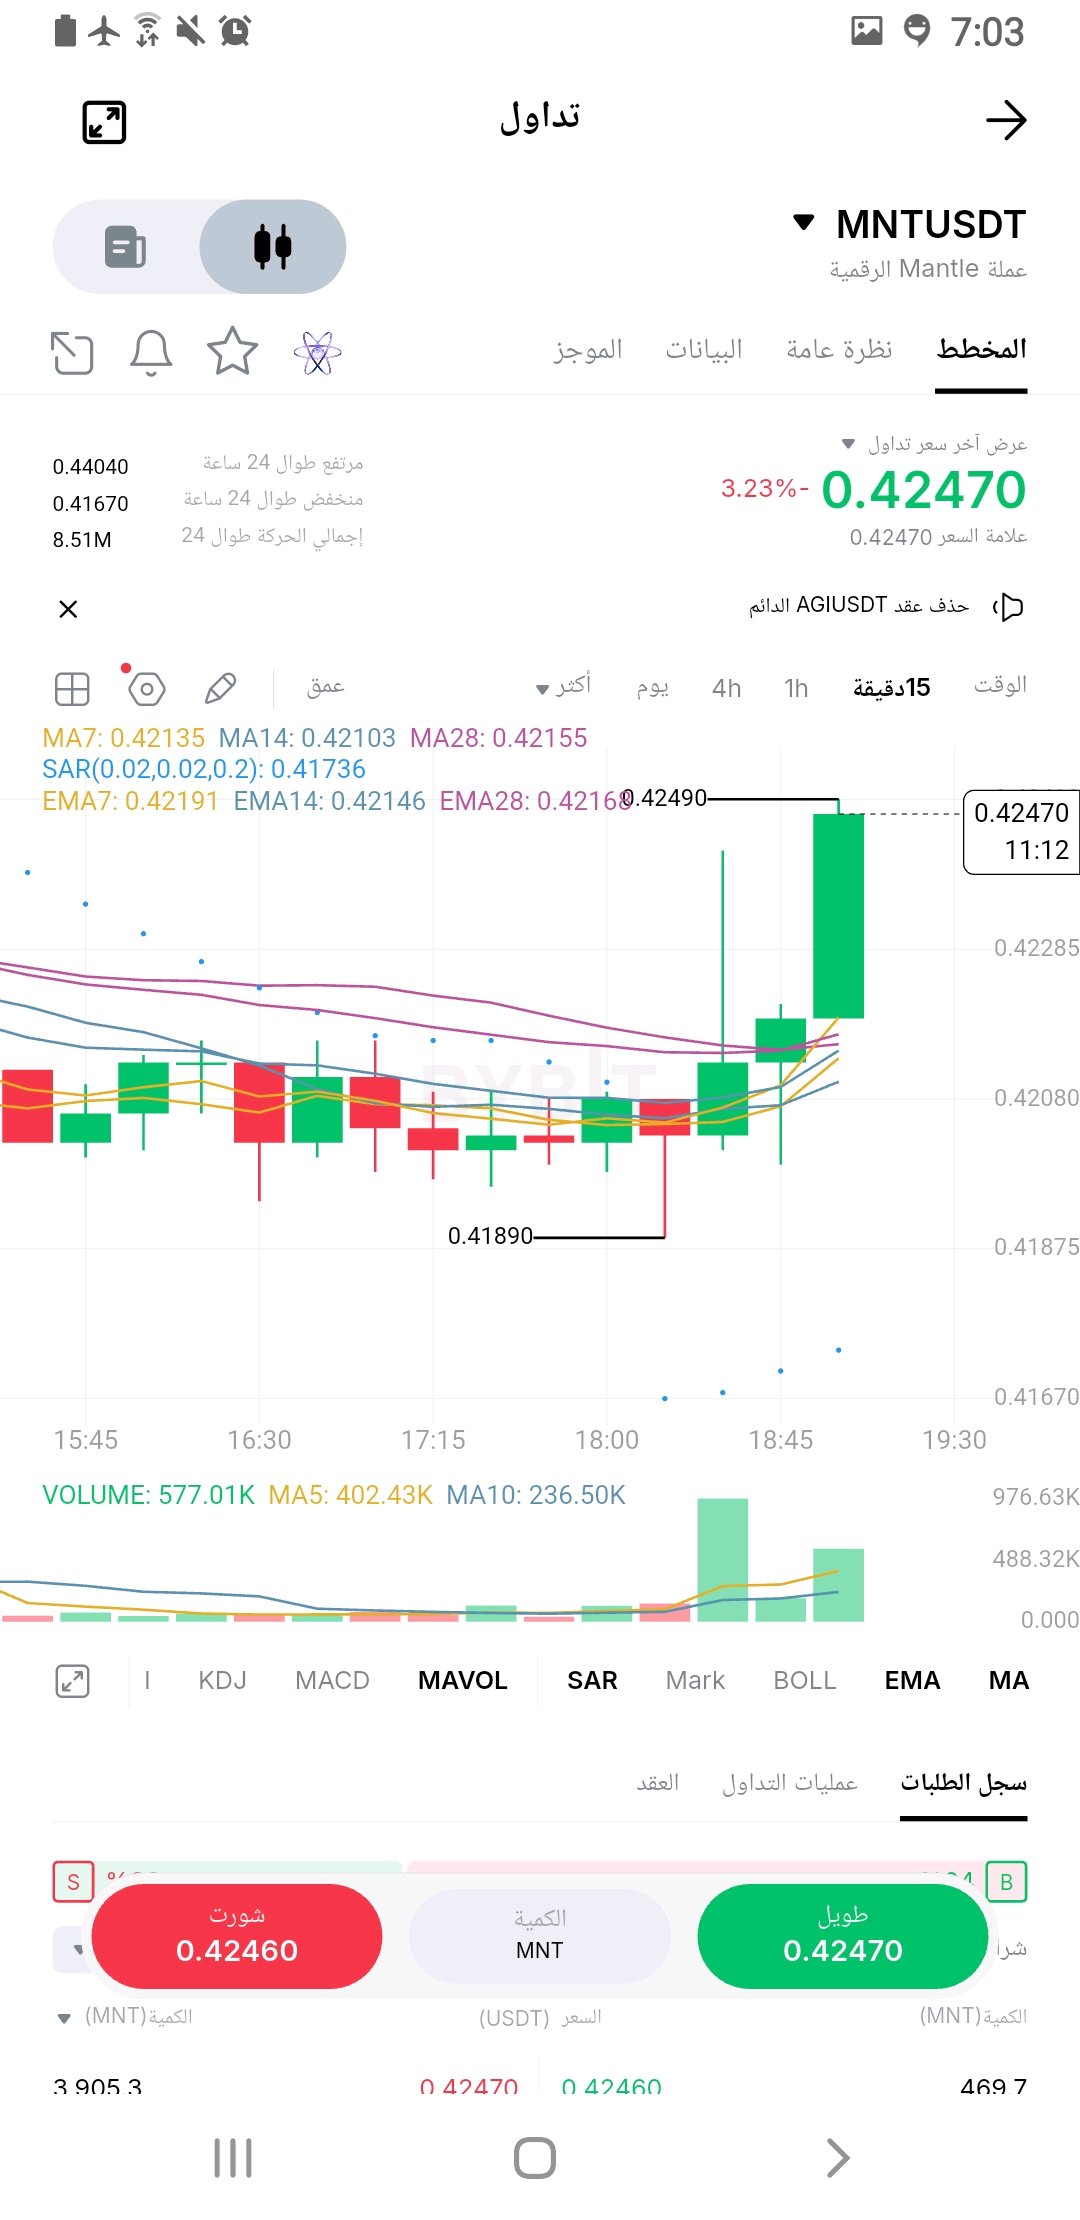
#ByXIMPACT XRP: Shows clear buying power and a tendency to continue the upward trend. MNT: Shows an attempted pullback/reversal from a low, but needs the price to stabilize above the current resistance to confirm the trend change. Trading on the 15-minute timeframe is considered scalping and is risky; it is always preferable to place strict stop-loss orders below the mentioned support levels. Short-term Bullish. · Price Action: We observe a very strong rebound from the local bottom at 1.0512. The price experienced a sudden breakout via a massive green candle that surpassed all moving averages, reaching a high peak of 1.0790 before beginning the current minor correction. · Technical Indicators: · Moving Averages (EMA/MA): The current price is above all moving averages (EMA7, EMA14, EMA28), and the averages have begun to cross positively (Golden Cross), supporting the upside. · Parabolic SAR (Blue Dots): The dots appeared below the candles following the breakout, which is a clear bullish signal. · Trading Volume: There is massive buying liquidity clearly visible in the large green breakout candle. · Key Levels: · Current Resistance: 1.0790 (highest point reached recently). · First Support: The 1.0640 - 1.0660 zone (where short moving averages are concentrated). · Analysis: The coin is in a state of strong positive momentum. The current correction (small red candle) is normal for profit-taking. If the price maintains its position above the 1.0600 level, it is likely to resume its upward movement to retest 1.0790. 📉 Second: Mantle (MNTUSDT) Analysis - Second Image · Current Price: $0.42470 (down -3.23%). · General Trend: Medium-term bearish, with a recent attempt at a rebound. · Price Action: The coin was in a clear downward path, reaching a low at 0.41890. Recently (on the chart), a very strong green candle appeared, breaking upward through the moving averages and reaching the 0.42490 level. · Technical Indicators: · Moving Averages (EMA/MA): The current price has managed to break through the moving averages, marking the first positive sign after the wave of decline. · Parabolic SAR: Blue dots have started appearing below the candles, giving a potential bullish reversal signal. · Trading Volume: We observe a significant increase in trading volumes accompanying the latest green candle, lending credibility to the rebound. · Key Levels: · Near Resistance: 0.42490 (current peak). Breaking this level is necessary for continued upward movement. · Strong Support: 0.41890 (previous low). · Analysis: Although the general trend remains bearish (as shown at the top of the chart with a previous high of 0.44040), the latest green candle is very strong and indicates buying interest at the bottoms. There is a state of anticipation; either the price continues upward to confirm the reversal, or it pulls back downward to retest the support once more. #WSOT2026 #BybitAIEvolving #تقلبات النفط تتبع محادثات السلام الإيرانية #كشوف المرتبات الأمريكية وقرارات أسعار الفائدة تحرك الأسبوع الاقتصادي $XRPUSDT $MNTUSDT
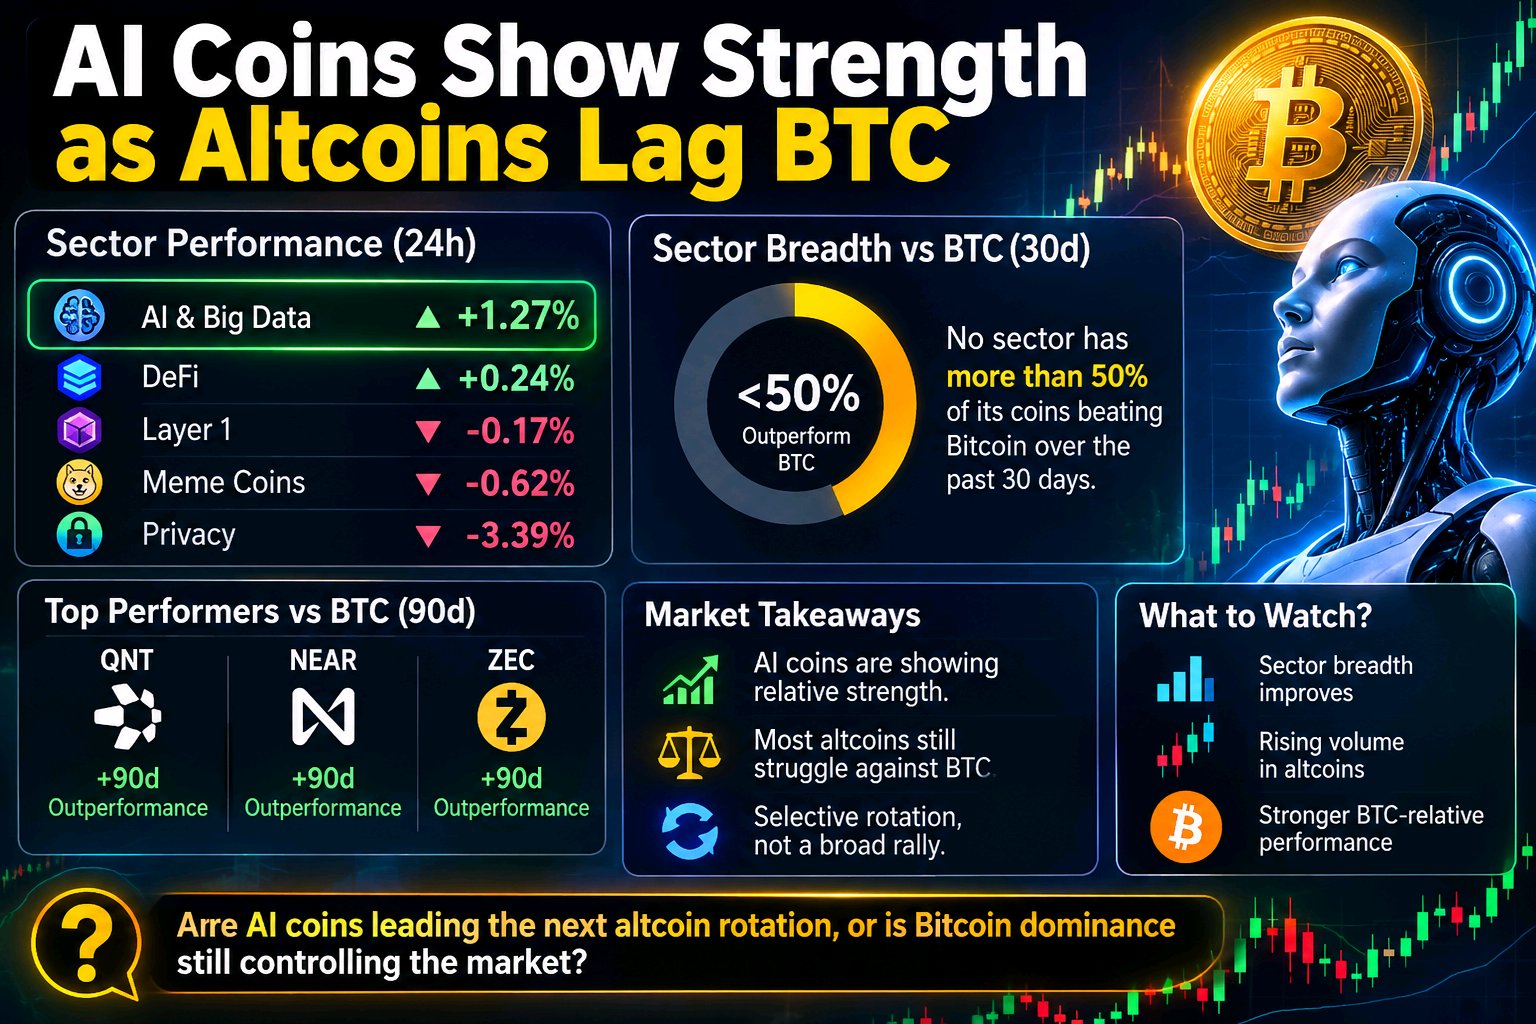
AI Coins Show Strength as Altcoins Lag BTC
$BTCUSDT The altcoin market is showing an interesting split, and smart traders should pay attention. As of November 11, AI & Big Data is showing relative strength, with approximately 1.27% gains over 24 hours. Meanwhile, Privacy coins are facing pressure, declining around 3.39%. **Top performers to watch:** QNT, NEAR and ZEC have demonstrated notable outperformance against Bitcoin over the past 90 days. **The overlooked detail:** Despite individual winners, no tracked altcoin sector currently has more than 50% of its coins outperforming BTC over the 30-day period. This suggests capital is rotating selectively rather than entering the entire altcoin market. If sector breadth improves alongside rising volume and stronger BTC-relative performance, the rotation could become more convincing. **Are AI coins leading the next altcoin rotation, or is Bitcoin dominance still controlling the market?** #BybitAIEvolving #USPayrollsAndRateDecisionsDriveMacroWeek

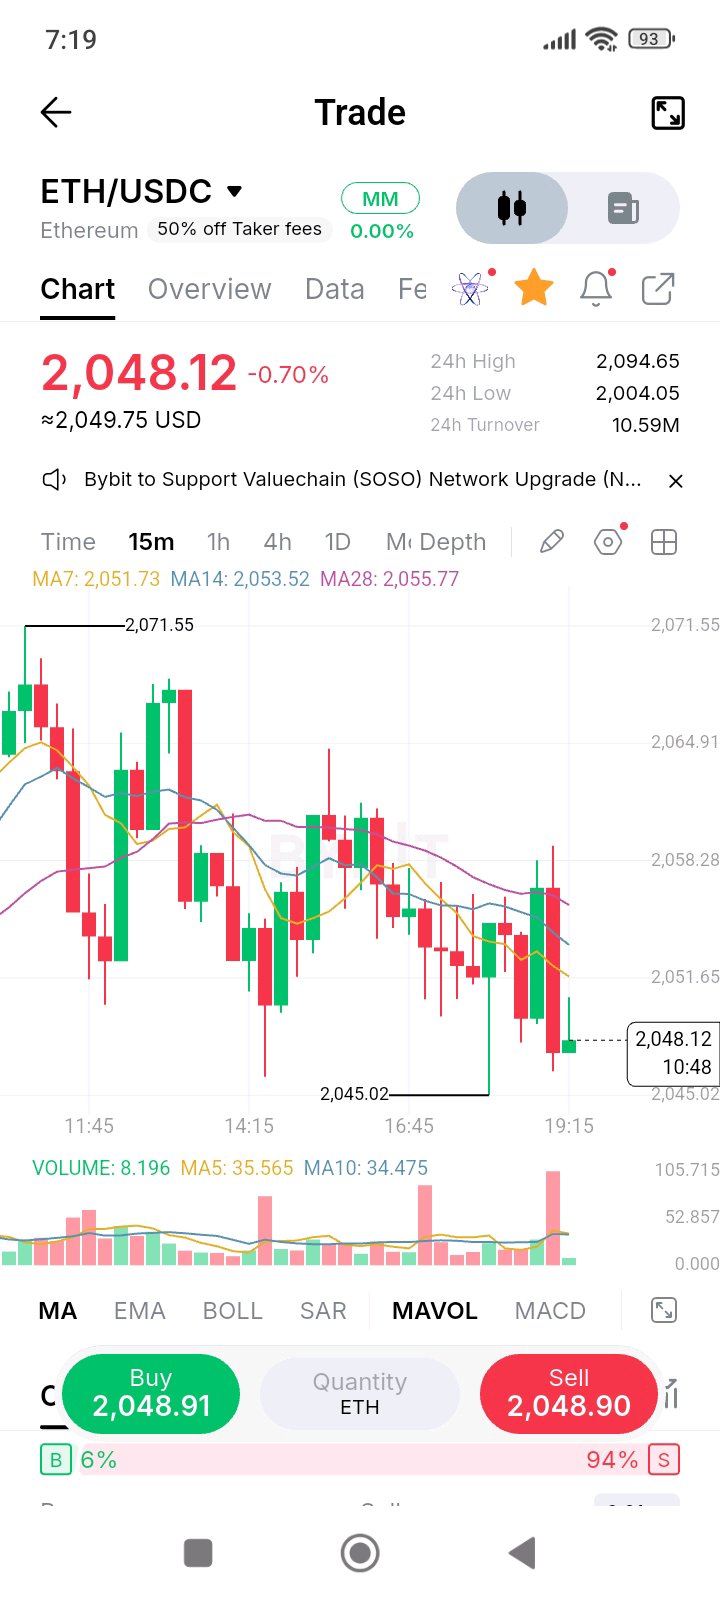
$ETH: Bears Are Pressuring the Market, But
I’ve been watching Ethereum closely, and this latest move is a reminder that the market can turn aggressive when buyers lose control. ETH is trading around $2,048 after struggling to maintain momentum near the $2,071 zone. Now the price is testing an important area where bulls need to show some strength. 📊 The 15-minute chart is currently leaning bearish. ETH is trading below MA7 ($2,051.73), MA14 ($2,053.52), and MA28 ($2,055.77). All three moving averages are sitting overhead, creating resistance for any recovery attempt. The recent low around $2,045.02 is the immediate level I'm watching. If sellers break it decisively, downside pressure could increase. However, a strong bounce followed by a reclaim of $2,055 could change the short-term picture. 🐋 I don't have confirmed whale-flow data here, so I'm watching price and volume rather than guessing what large players are doing. 🎯 Key levels: - Support: $2,045 - Resistance: $2,055 - Breakout: $2,058 - Next target: $2,065 - Major upside level: $2,071 🔥 I'm not interested in blindly chasing a green candle. ETH needs buying strength and volume confirmation before I trust a reversal. I've been following every move with this community, and I'm still watching. Will ETH defend $2,045 and fight back, or are sellers preparing another breakdown? 👀 #BitcoinHitsTwoMonthLowAfterUSMidterms #DeutscheBankLaunchesDigitalAssetCustody #USPayrollsAndRateDecisionsDriveMacroWeek
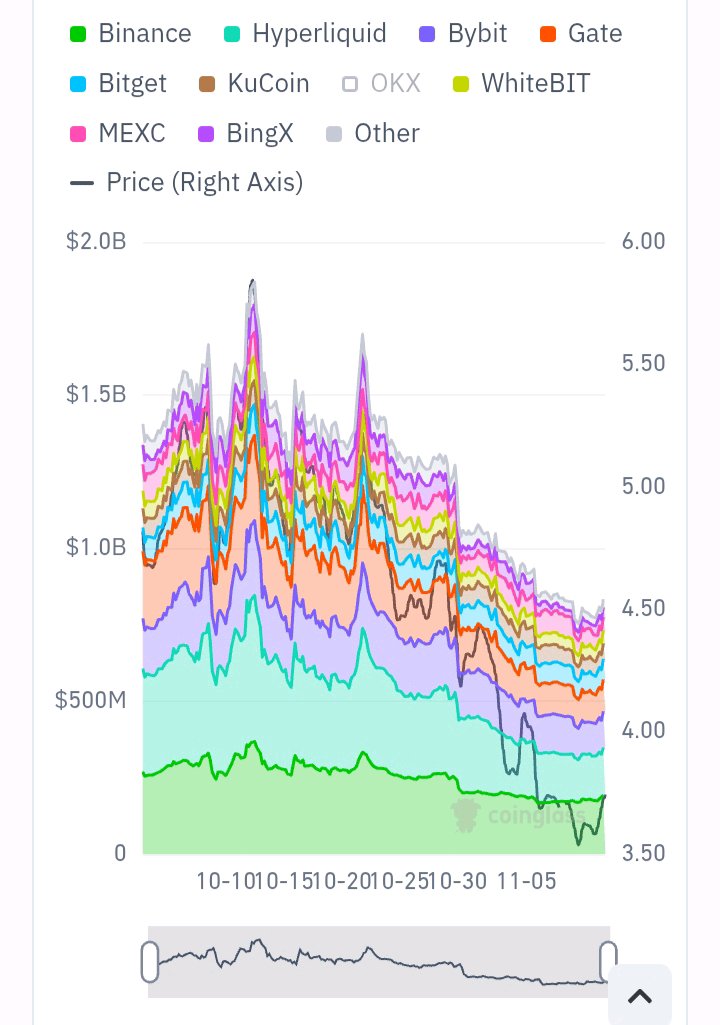
NEARの資金はどこへ行っているの? 🤔
$NEARUSDT NEARの建玉(OI)チャートを見てみましょう: ・OI合計:20億ドル以上から5億ドル〜7億ドルのゾーンへと急落しています。 ・トレンド:全プラットフォームで大幅な減少。大口投資家がポジションを解消しています。 これは何を意味するのか? OIと価格が同時に下落しているということは、NEAR市場からレバレッジが抜けていることを意味します。トレーダーは現在、新たなリスクを回避している状態です。 あなたはどう思いますか?NEARに流動性はいつ戻ってくるでしょうか? #米国のインフレ率は高止まりし、利上げ観測が高まる #BybitAI進化中 #原油価格の変動がイランの和平交渉に連動 #米国雇用統計と金利決定が主導するマクロ週 #米中間選挙後、ビットコインが2か月ぶりの安値を記録 $ETHUSDT

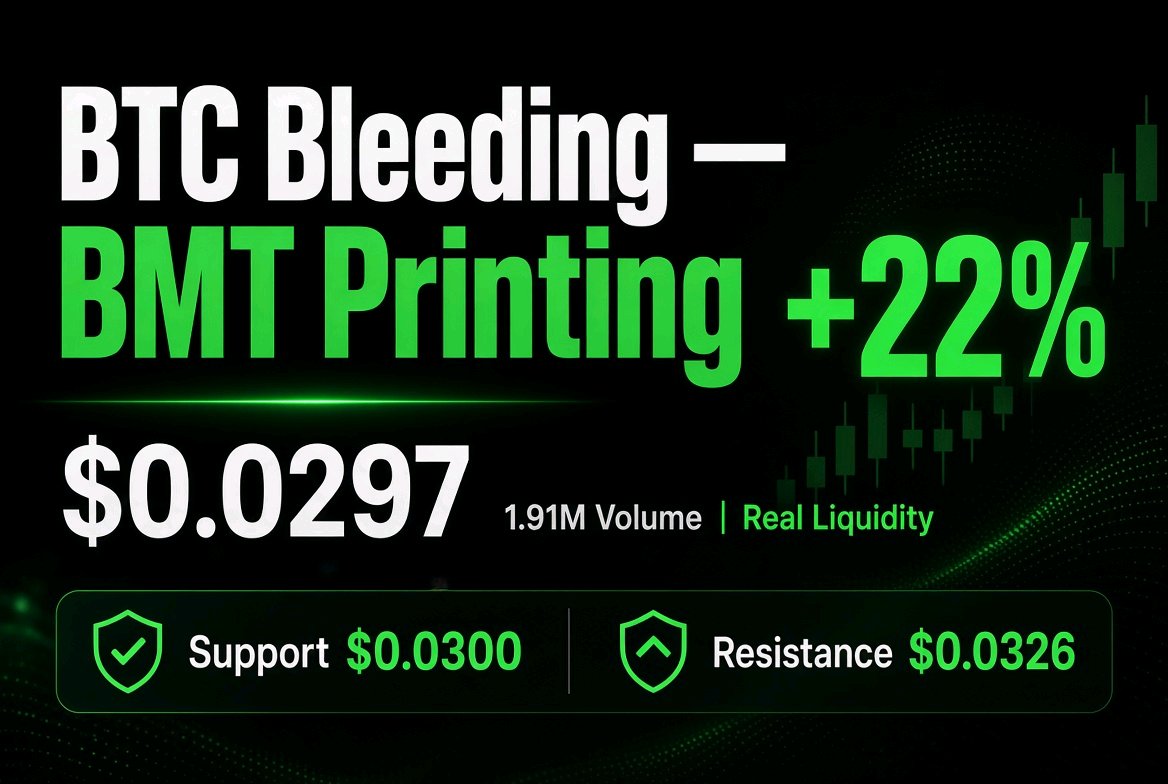
BTC is bleeding, but BMT is printing. 🚀
Here is the setup. ⚡ The whole market is red today. $BTCUSDT is fighting to hold $73,600, and ETH is sitting near $2,058 . But while the majors chop, BMT is quietly building strength on the Bybit board. Why $BMTUSDT ? Look at the data. It is up over 22% to $0.0297, and the turnover is a massive 1.91M. That is real liquidity, not an empty order book pump. On-chain, the top 100 wallets hold around 45% of the supply, and the new Intel Desk launch is adding real utility to the token . The Levels: Resistance sits at $0.0326. A clean break here opens the door for the next leg up. Support is the MA cluster around $0.0300. As long as buyers defend this floor, the structure stays intact . While the market hunts for a bottom, BMT is showing relative strength. Are you watching this one today? 👇 #NovUSCPIWatch #USPayrollsAndRateDecisionsDriveMacroWeek #OilVolatilityTracksIranPeaceTalks #BybitAIEvolving #BOERateDecision

BITCOIN
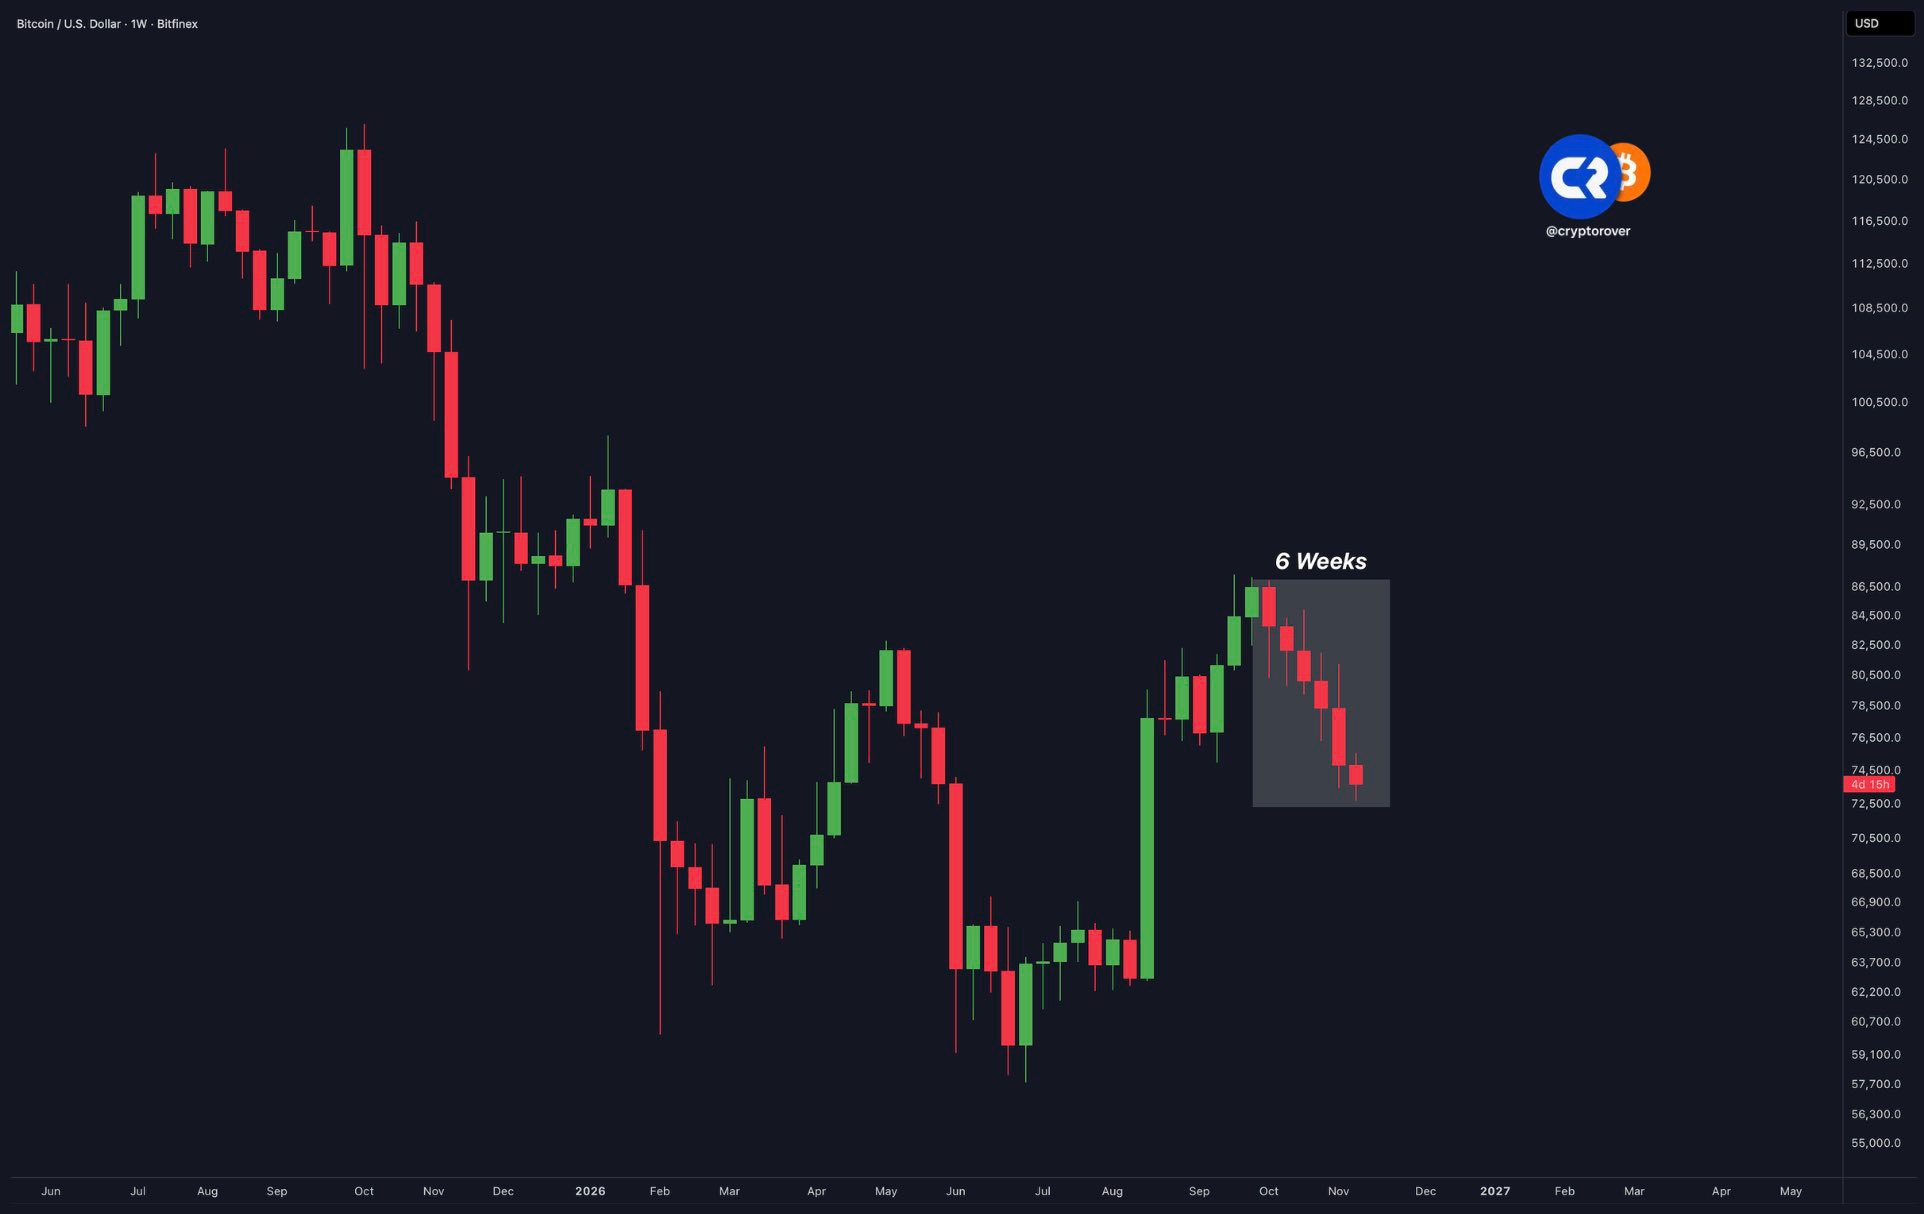
#USPayrollsAndRateDecisionsDriveMacroWeek 🔴 Bitcoin is about to close 6 RED weeks in a row. Bitcoin is experiencing one of the longest losing streaks in its history... Could this mean the longest winning streak in history is coming next? #WSOT2026 #WSOTPicktoEarn10U #OilVolatilityTracksIranPeaceTalks #NovUSCPIWatch
Trading
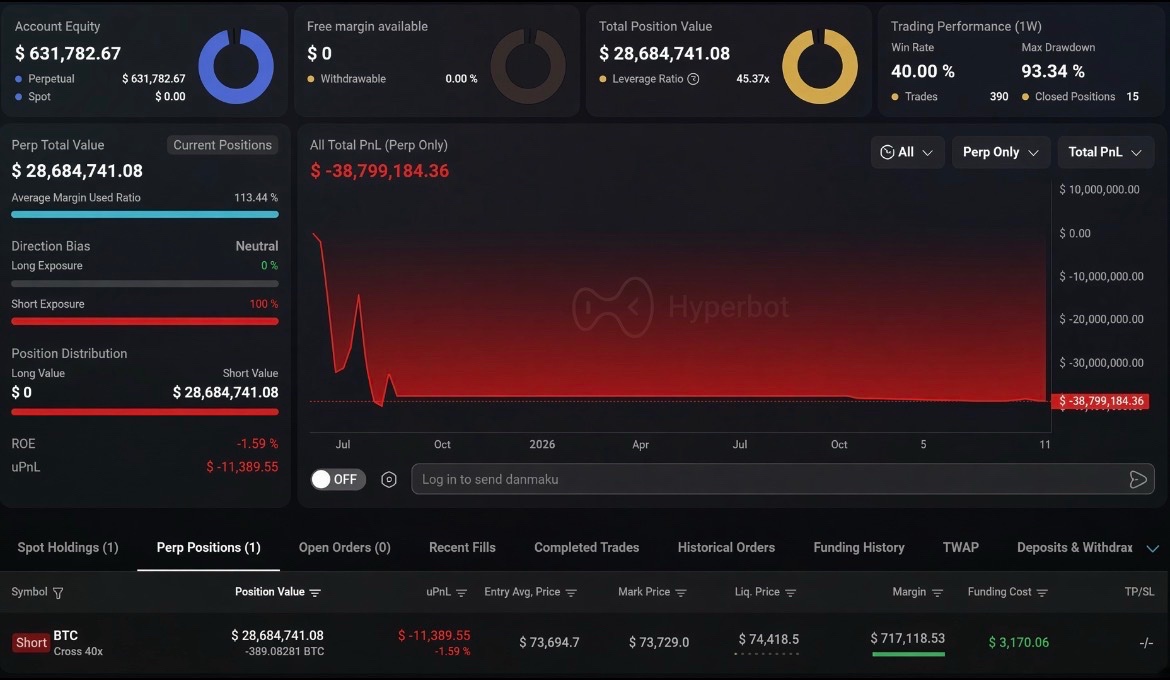
Someone just opened a 40x $BTC short worth ~$30M. His all-time PnL: -$38.8M When people start gambling on the last bit of downside, you know it’s time to go long #WSOT2026 #WSOTPicktoEarn10U #NovUSCPIWatch #USPayrollsAndRateDecisionsDriveMacroWeek #BybitAIEvolving