Las nóminas de EE. UU. y las decisiones sobre tasas impulsan la semana macro
Se espera que el BoE aumente las tasas al 4.00% el 5 de noviembre a las 12:00 UTC. Las nóminas no agrícolas de EE. UU. se publicarán el 6 de noviembre a las 13:30 UTC, con expectativas de 65 mil empleos, un 4.2% de desempleo y un crecimiento salarial mensual (MoM) del +0.3%. Un resultado mejor al esperado en empleos o salarios podría elevar los rendimientos y el dólar, presionando al BTC, al oro y a las acciones de crecimiento; un resultado por debajo de las expectativas podría apoyarlos, a menos que los temores de recesión tomen el control. ¿Qué activo reacciona más?


GOLD Smashed our $3800 target zone🎯
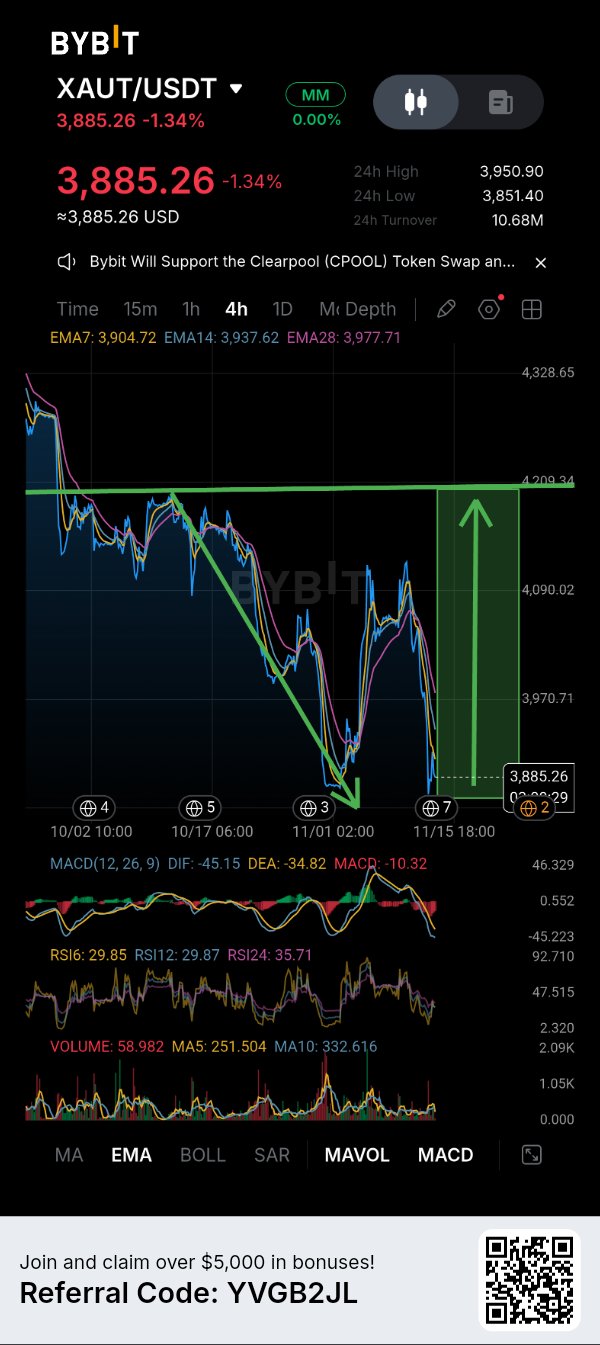
$XAUTUSDT is aproaching an important decision zone, and I think the reaction around $3,850–$3,885 could determine the next meaningful move🤔 4h structure is still bearish. Price is currently trading around $3,885.26, down 1.34%, after another rejection from the higher price region. What concerns me is the EMA structure: EMA7 sits at $3,904.72, EMA14 at $3,937.62, and EMA28 at $3,977.71. All three are above the current price, showing that sellers still have control of the short-term trend. however, I don't want to ignore the momentum situation either. RSI6 and RSI12 are both near 29.85, while RSI24 is around 35.71. This suggests considerable downside pressure and potentially stretched short-term momentum. with DIF at -45.15 and DEA at -34.82. So, although a relief bounce is possible, I would not treat oversold conditions alone as a buy signal my primary area of interest is $3,851–$3,885. The 24H low is already around $3,851.40, making this an important nearby support area to watch. If buyers defend this region, reclaim $3,905 first, and gradually push above $3,938, I would start paying more attention to a potential recovery first important resistance sits around $3,970–$3,978, where the EMA28 also comes into play. A stronger recovery could open the way toward $4,090, followed by the larger resistance area around $4,200 on the other hand, a decisive 4H breakdown below $3,851 would weaken the bullish recovery idea considerably. I would rather wait for a confirmed reclaim and a higher-low structure than attempt to catch a falling market📊 For now, $3,851 is the level I'm watching most closely. XAUT neds to prove that buyers are willing to defend this area before I consider a long position Patience first. Confirmation second. Execution comes last......👍 market is volatile, so you have to manage your own risk✅ #ByXIMPACT #SanDiskAnnounces8For1StockSplit #DeutscheBankLaunchesDigitalAssetCustody #USPayrollsAndRateDecisionsDriveMacroWeek

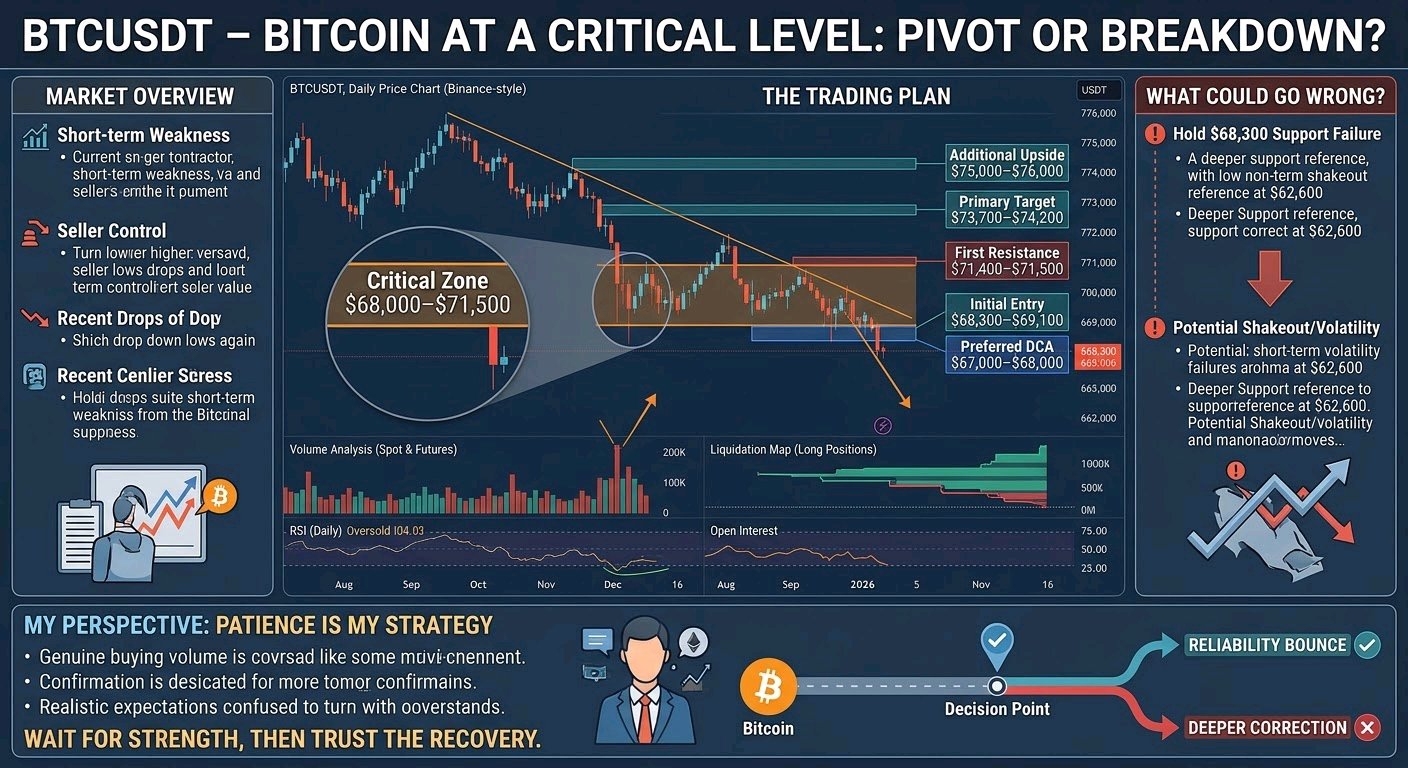
$BTCUSDT – BITCOIN IS AT A CRITICAL LEVEL. I'M WATCHING THE NEXT MOVE CLOSELY. Bitcoin has been under noticeable selling pressure lately, and the price action is getting interesting. After the recent drop, I'm paying close attention to whether buyers are ready to step in or if sellers still have more control. Market Overview Looking at the daily structure, BTC is still showing short-term weakness. Sellers have been pushing the price lower, and buyers haven't yet shown enough strength to confirm a proper recovery. The $68,000–$68,300 area is one zone I'm watching closely. If buyers manage to defend it, we could see a relief bounce. But I don't want to assume the bottom is in just because price has dropped significantly. Volume Analysis Trading activity has picked up during this move, which tells me that market participants are reacting strongly to the current conditions. Liquidations have also added pressure, particularly on leveraged long positions. This can sometimes create opportunities for a recovery, but it doesn't automatically mean the downtrend is over. What I really want to see is genuine buying volume entering the spot market. My Trading Plan I'm not interested in chasing Bitcoin at every small move. I'd rather wait for a clear reaction around important levels. - Initial Entry: $68,300–$69,100, if buyers show confirmation. - Preferred DCA: $67,000–$68,000, only if this area provides a strong reaction. - First Resistance: $71,400–$71,500. - Primary Target: $73,700–$74,200. - Additional Upside: $75,000–$76,000 if bullish momentum improves. A recovery above $71,500 would make the setup more interesting. Until then, I'm keeping my expectations realistic. What Could Go Wrong? The main concern is a failure to hold the $68,300 support area. If sellers push BTC below this level and buyers fail to reclaim it, further downside could follow. In that situation, I'll be watching the broader $62,600 region as a deeper support reference. I also don't want to ignore the possibility of another short-term shakeout. The market is volatile, and entering too early can be costly. My Perspective Personally, I think Bitcoin is approaching an important decision point. The recent selling and liquidation activity have created a market where both sides need to prove themselves. Bears currently have the advantage, but a strong defense of support followed by a move above $71,500 could change the short-term picture. I'm not calling for an immediate rally, and I'm certainly not ruling out another dip. For now, patience is my strategy. I want to see buyers return, volume support the move, and market structure start improving before becoming more aggressive. Bitcoin doesn't need to move today. It needs to show strength before I trust the next recovery. #USPayrollsAndRateDecisionsDriveMacroWeek

Today’s news and market key points
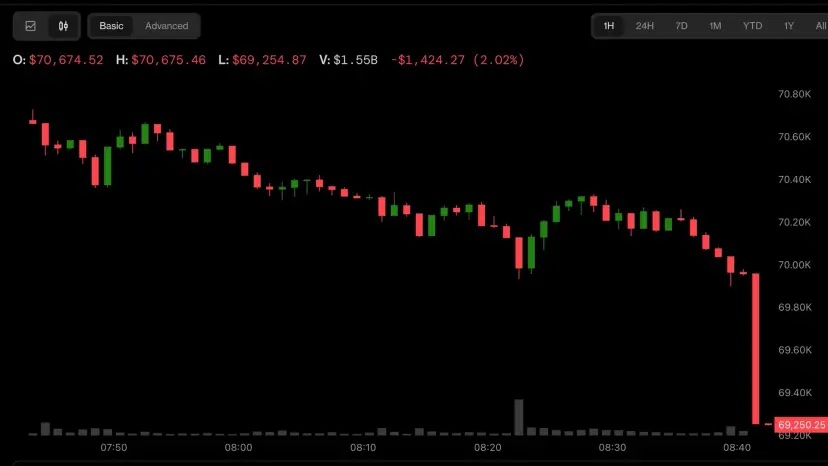
The crypto market selloff gathered pace early Friday. Bitcoin dropped below $70,000 and ether traded below $2,000, triggering large liquidations in futures market. Summary: Bitcoin fell below $70,000 early Friday to its lowest level since Aug. 19, as the Dollar Index held steady at 19-month highs. The sell-off accelerated amid reports of renewed military escalation in the Middle East, including Iran’s claim that it destroyed a U.S. early-warning radar in Bahrain. Exchanges liquidated more than $1.3 billion in cryptocurrency futures positions over 24 hours. The broader market suffered. Ether ETH $1,935.76 , the second-largest token, dropped below $2,000 for the first time since August. XRP (XRP) traded close to the $1 level, while Solana’s SOL traded below $80. Several smaller tokens, such as GT, Stacks, and XMR, were down 7% or more. The selloff gathered pace as the Dollar Index (DXY), which tracks the greenback’s exchange rate against major fiat currencies, traded above 103, its highest since April 2025. The odds that the Federal Reserve will raise interest rates by half a percentage point in December have increased following a hotter-than-expected U.S. consumer price index reading for October released early this week. #WSOT2026 #AnthropicIPOValuationTest #Розпродаж акцій ШІ-технологій знищив 2,5 трильйона доларів з індексу Nasdaq 100 #Звіт із зайнятості в США та рішення щодо ставок формують макротиждень @STRATEGY @

🚨 WHY IS $BTC DUMPING BELOW $69,000?
THE REAL REASONS BEHIND THE NOVEMBER 2026 CRYPTO CRASH Guys... $BTCUSDT has already broken below $70,000 and is now trading around $68,850, down 6.5% in 24 hours. And honestly... this is no longer looking like an ordinary correction. Multiple forces are hitting the market simultaneously: • Institutional ETF outflows • Massive leveraged liquidations • Inflation concerns • Federal Reserve rate expectations • Technology stock weakness • Declining investor risk appetite Let's look at the actual numbers... because the situation is getting more serious. 1. BITCOIN HAS LOST MORE THAN 45% FROM ITS ATH November 13, 2026: • BTC price: approximately $68,850 • 24-hour performance: -6.5% • Previous ATH: approximately $126,198 • Current drawdown: approximately -45.4% • Recent chart high: $87,383 • Decline from that high: approximately 21.2% Bitcoin is now trading significantly below its October 2025 peak, and the selling pressure is accelerating. 2. INSTITUTIONAL MONEY IS LEAVING BITCOIN ETFs U.S. spot Bitcoin ETFs reportedly recorded FIVE consecutive trading days of net outflows. November 5–11: • November 5: -$430.2M • November 6: -$411.9M • November 9: -$201.0M • November 10: -$95.0M • November 11: -$299.8M TOTAL: approximately $1.438 BILLION in net outflows. Another concerning detail... BlackRock's IBIT reportedly recorded approximately $269.7M in outflows on November 11, marking its ninth consecutive outflow session. Its cumulative outflows across those nine sessions reportedly reached approximately $2 BILLION. And guys... this matters. Spot ETFs have become an important institutional access channel for Bitcoin. When ETF redemptions persist, institutional demand is no longer providing the same buying support. 3. NEARLY $681 MILLION IN CRYPTO LIQUIDATIONS According to CoinGlass figures cited in November 13 reports: • Total crypto liquidations: $680.81M • Long liquidations: approximately 88% • Short liquidations: approximately 12% • Bitcoin liquidations: $325.28M • Ethereum liquidations: $106.07M • Traders liquidated: 112,947 • Largest single liquidation: $31.09M Bitcoin accounted for approximately $325M in liquidations, with 95.3% reportedly coming from LONG positions. This is a classic leverage unwind. Falling prices trigger margin calls, exchanges close leveraged positions, forced selling increases, and additional longs become vulnerable. And the cycle continues... The decline is being amplified by forced selling, not just ordinary spot market activity. 4. MACROECONOMIC PRESSURE IS ADDING TO THE SELLING Inflation concerns, uncertainty around future Federal Reserve rate cuts and weakness in technology stocks are making investors more cautious. Bitcoin remains sensitive to changes in liquidity and broader risk appetite. If investors expect interest rates to remain elevated for longer, speculative assets can face additional pressure. But these factors don't prove that every dollar of BTC selling is directly caused by the Fed. 5. THE TECHNICAL STRUCTURE IS STILL BEARISH Now compare all those developments with the actual Bybit chart... BTC is trading below its major daily moving averages: • EMA7: $72,902 • EMA14: $74,909 • EMA28: $77,133 The 4H chart confirms the weakness. • EMA7: $70,888 • EMA14: $72,066 • EMA28: $73,290 Price is below all three, and the market continues forming lower highs and lower lows. Bitcoin has already touched $67,468, before recovering slightly toward $68,850. That recovery alone is NOT enough to confirm a reversal. 6. IS $65,000 THE NEXT TARGET? For me, the important downside levels are: $67,468 → $66,000 → $65,000 If Bitcoin loses $67.4K with sustained selling pressure, a move toward $65K becomes increasingly plausible. But there is also a risk for late SHORT sellers. After such aggressive liquidations, even a temporary recovery can trigger a sharp short squeeze. For a meaningful bullish recovery, BTC needs to reclaim: $70,900–$71,300, followed by $72,600–$73,300. Until that happens, the broader short-term structure remains bearish. Personally, i wouldn't blindly LONG just because Bitcoin has already dropped more than 45% from its ATH. And i wouldn't chase SHORT positions after a massive red candle without waiting for a proper setup either. ETF outflows, leveraged liquidations, macro uncertainty and bearish technicals are all adding pressure at the same time. Bitcoin has already lost $70K. Now the real question is whether buyers can defend $67.4K... or whether $65,000 becomes the next major battleground. #USPayrollsAndRateDecisionsDriveMacroWeek
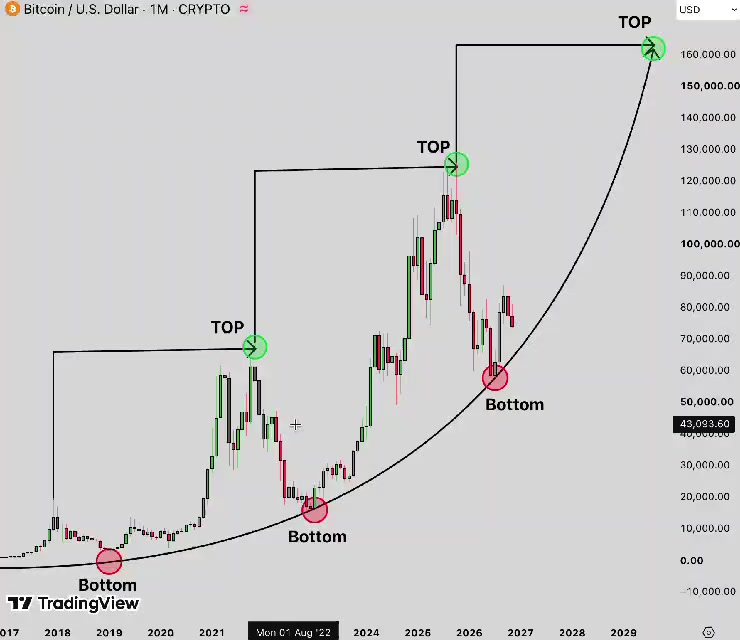

BTC keeps falling
BTC keeps falling below $70 down to $68 lets wait and see what comes next #BitcoinHitsTwoMonthLowAfterUSMidterms #USPayrollsAndRateDecisionsDriveMacroWeek #USInflationRunsHotAndRateHikeBetsRise @BybitX @Sabeer @btcflow @realklyro1 $BTCUSDT $NEARUSDT

HYPE‑USDT Trading & Analytics Brief (For WSOT Disclaimer: This is educational‑market overview only, not financial advice. 📌 About HYPE‑USDT HYPE‑USDT is the main trading pair for Hyperliquid’s native token on Bybit, available for spot and perpetual futures in the WSOT tournament. HYPE powers the Hyperliquid Layer‑1 trading blockchain, used for staking, governance, fee payments, and regular token‑buy‑and‑burn from protocol revenue . 📊 Core HYPE‑USDT Analytics To Watch ‑ On‑chain data: Total burned tokens, whale accumulation, staking ratio, new wallet growth ‑ Market metrics: 24‑h trading volume, open interest, funding rates, key support & resistance zones ‑ Key catalysts: Elysium Layer‑2 updates, institutional partnership news, global crypto market sentiment ‑ Risk note: HYPE has high volatility — price moves fast during WSOT trading rounds 🧩 WSOT Quick‑Check List for HYPE‑USDT 1. First check the overall crypto trend before opening HYPE positions 2. Track volume spikes — these often signal incoming momentum shifts 3. Mark clear support / resistance levels on your daily chart 4. Always set stop‑loss rules to protect squad tournament points ✅ Ready‑to‑Post WSOT Caption “HYPE‑USDT WSOT update! Hyperliquid’s ecosystem keeps expanding, with ongoing token‑burn activity and high trading volume — our squad watches key zones & news triggers closely for set‑ups!” $HYPEUSDT $SPXUSDT #ByXIMPACT #WSOT2026 #PiecesOf8 #NovUSCPIWatch #USPayrollsAndRateDecisionsDriveMacroWeek

Jensen Huang renunció
EL HOMBRE DETRÁS DEL IMPERIO DE IA DE NVIDIA. UNA POSIBLE SALIDA. UN MERCADO AL FILO. La supuesta partida de Jensen Huang podría marcar un momento decisivo para NVIDIA. Se informa que Colette Kress ocupará el puesto de CEO interina, pero el mayor desafío es mantener el impulso detrás de una de las empresas más importantes en la economía de la IA. Una pregunta domina: ¿Es $NVDAXUSDT más grande que Jensen Huang? Wall Street pronto podría descubrirlo. #La venta masiva de acciones tecnológicas borra 2.5 billones del Nasdaq 100 #Las nóminas de EE. UU. y las decisiones sobre tasas impulsan la semana macro #BitcoinAlcanzaMinimoDeDosMesesDespuesDeLasEleccionesDeMedioTerminoEnEEUU #AnthropicIPOValuationTest #LaInflaciónEnEUAseDisparaYLasaApuestasDeAumentoDeTasasSuben


POSICIONAMIENTO DE LAS BALLENAS (versión honesta)
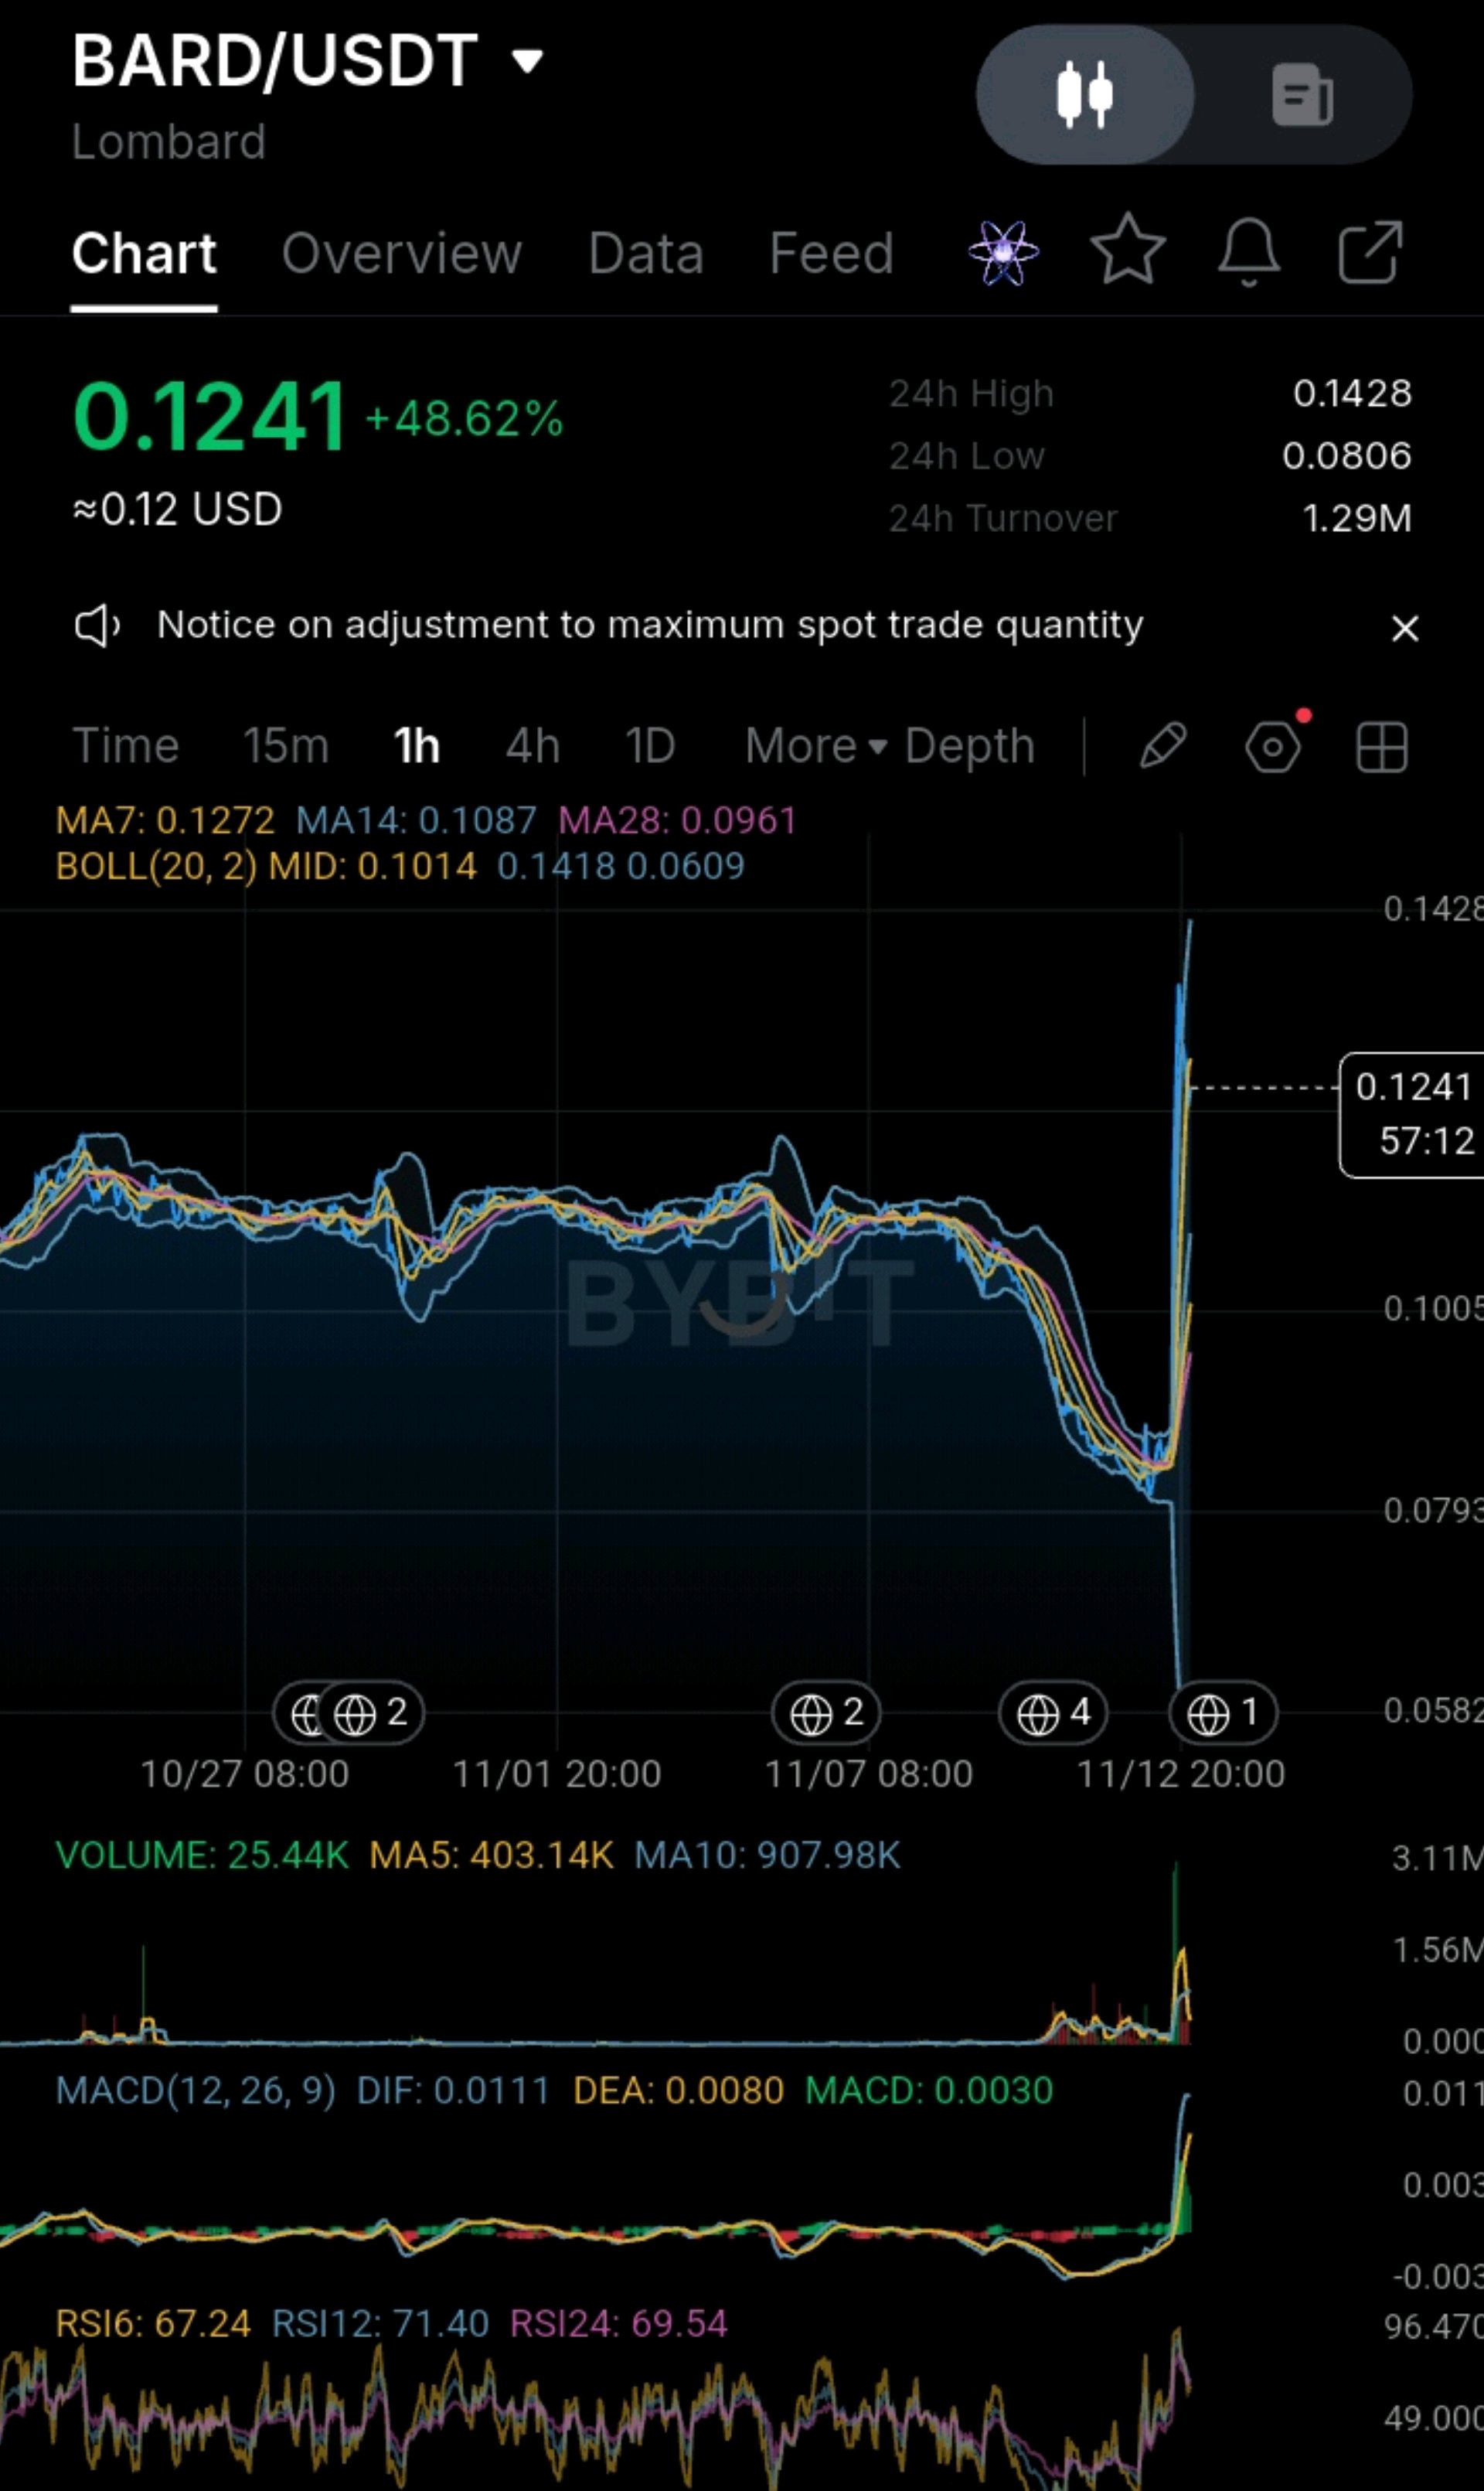
#IMPACTbyTrade #LaInflaciónEnEUAseDisparaYLasaApuestasDeAumentoDeTasasSuben #WSOT2026 #Observación del IPC de EE. UU. de nov. #Las nóminas de EE. UU. y las decisiones sobre tasas impulsan la semana macro 🐋 POSICIONAMIENTO DE LAS BALLENAS (versión honesta) BARD: el principal riesgo relacionado con las ballenas es el suministro programado. Los inversores privados estaban destinados a obtener el 20% del suministro con un periodo de carencia (cliff) de 12 meses y una adquisición gradual (vesting) de 36 meses, y se informó que los desbloqueos para inversores y el equipo se acelerarían a partir de septiembre de 2026. Los grandes desbloqueos pueden generar presión de venta, así que revisa las fechas de desbloqueo actuales. Una instantánea antigua mostraba que el volumen de perpetuos era aproximadamente 14 veces mayor que el spot, lo que sugiere que los traders con apalancamiento impulsan gran parte de la acción, pero esos datos no tienen fecha. KOR: un nuevo listado generalmente significa poseedores iniciales concentrados, un flotante pequeño y mucha especulación. Una instantánea mostró alrededor de $1.1M de interés abierto en perpetuos y una tasa de financiación positiva del 0.0294% cada 8 horas, lo que significa que los largos estaban pagando por mantener, lo cual puede deshacerse rápidamente. Los inversores de la Serie A recaudaron dinero con una valoración de $100M en julio de 2026, por lo que podría haber poseedores iniciales con posiciones grandes y bloqueadas. Eso es un riesgo a verificar, no una conclusión. Usa Arkham y Nansen para las billeteras etiquetadas, la página de poseedores del explorador (Etherscan para BARD, Basescan para KOR), Coinglass para el interés abierto y la financiación, y los documentos de los propios proyectos para las fechas de desbloqueo. 📈 INTERPRETACIÓN TÉCNICA BARD: una ruptura que ha comenzado a retroceder. El precio está por encima de la MA14 pero por debajo de la MA7, el volumen se está desvaneciendo y el RSI está elevado (RSI6 67.24, RSI12 71.40, RSI24 69.54). La resistencia está en 0.1272 (MA7), luego en 0.1418 y 0.1428. El soporte está en 0.1087 (MA14), 0.1014 (media de BB), 0.0961 (MA28), luego en 0.0806. KOR: una tendencia más fuerte que está peligrosamente estirada. La estructura es alcista, pero un RSI6 en 75.45 y una brecha de casi el 50% por encima de la MA14 sugieren tener paciencia. La resistencia está en 0.000629, luego alrededor de 0.000680 (una estimación). El soporte está en 0.000546 (banda superior), alrededor de 0.000528 (la zona de pico anterior), 0.000479 (MA7), luego 0.000403/0.000396 y el mínimo de 0.000301. Cuadro de mando rápido: Tendencia a corto plazo: KOR es más fuerte. BARD ya perdió su MA7. Impulso: ambos tienen cruces de MACD al alza recientes. El volumen de KOR se mantiene mejor y el de BARD se está desvaneciendo rápidamente. Extensión: BARD está menos estirado. KOR está mucho más extendido. Madurez del proyecto: BARD está claramente más establecido. KOR tiene apenas unos días de vida. Riesgo general: el de KOR es mucho mayor, y el de BARD es el excedente de desbloqueos. Mejor zona de entrada: BARD está entre 0.1090-0.1130 (MA14). KOR está entre 0.000480-0.000500 (MA7), que está aproximadamente un 16-19% por debajo del precio actual. 🧭 CONSEJOS PARA PRINCIPIANTES No persigas una vela del +45%. Ambos activos son mejores después de un retroceso que en los máximos. Ten mucho cuidado con los listados nuevos. KOR ya ha caído aproximadamente un 98% desde su máximo del día de cotización, y un rebote dentro de eso no es un cambio de tendencia. Revisa el cronograma de desbloqueos. Los desbloqueos programados pesados, como los de BARD, pueden mantener la presión sobre el precio incluso cuando el gráfico se ve bien. Observa las tasas de financiación. Una tasa de financiación positiva que se mantiene alta, como la de KOR en la instantánea, significa que los largos están sobrecargados y vulnerables. Usa órdenes limitadas en tokens con poca liquidez, ya que los spreads y el deslizamiento (slippage) cuestan dinero real. Establece siempre un stop antes de entrar, y no lo muevas una vez que estés en la operación. Arriesga solo el 1-2% de tu cuenta por operación. Con stops tan amplios, eso significa una posición pequeña. Evita el apalancamiento hasta que seas consistente. 🎯 MI PUNTO DE VISTA En términos de riesgo ajustado, BARD es el mejor candidato: más establecido, menos extendido y con una zona de retroceso clara. Me gustaría ver un rebote en la MA14 o una recuperación de 0.1272 con un volumen creciente. KOR tiene el gráfico más fuerte en este momento, pero es un listado de capitalización minúscula de pocos días que está casi un 50% por encima de sus promedios, así que si operas con él, mantén el tamaño de la posición pequeño y espera un retroceso a la zona de la MA7. Ninguno es para perseguir aquí. Llamado a la acción: ¿Cuál de los dos se mantiene mejor si el mercado se enfría? $BARDUSDT o $KORUSDT? Deja tu elección 👇 y configura alertas en BARD 0.1272 / 0.0990 y KOR 0.000629 / 0.000440, luego cuéntame si estás esperando un retroceso o una ruptura. Este es un análisis técnico para discusión, no un consejo financiero. Los nuevos listados y los tokens de pequeña capitalización son altamente volátiles y puedes perder toda tu inversión, así que usa tus propios límites de riesgo y utiliza siempre un stop. Las cifras de capitalización de mercado y desbloqueos provienen de sitios de datos que no siempre coinciden y no siempre están actualizadas, así que verifícalas en tiempo real antes de confiar en ellas. Cuéntame en los comentarios qué sitio de datos usas para investigar. $BTCUSDT $KORUSDT

Necesito una chica de Estados Unidos o Europa
#ShowMyRWATrades #USInflationRunsHotAndRateHikeBetsRise @usayouths #SanDiskAnnounces8For1StockSplit @AMERICA #Las nóminas de EE. UU. y las decisiones sobre tasas impulsan la semana macro tel#2348137826026 ¿puedes ser mi novia? ese es mi watsap relación #Las nóminas de EE. UU. y las decisiones sobre tasas impulsan la semana macro
i need a girl from USA or Europe
#ShowMyRWATrades #USInflationRunsHotAndRateHikeBetsRise @usayouths #SanDiskAnnounces8For1StockSplit @AMERICA #USPayrollsAndRateDecisionsDriveMacroWeek phne#2348137826026 $BTCUSDT @miami @NEWYORKSTOCKEXCHANGE
i need a girl from USA or Europe
#ShowMyRWATrades #USInflationRunsHotAndRateHikeBetsRise @usayouths #SanDiskAnnounces8For1StockSplit @AMERICA #USPayrollsAndRateDecisionsDriveMacroWeek phne#2348137826026 $BTCUSDT @miami @NEWYORKSTOCKEXCHANGE


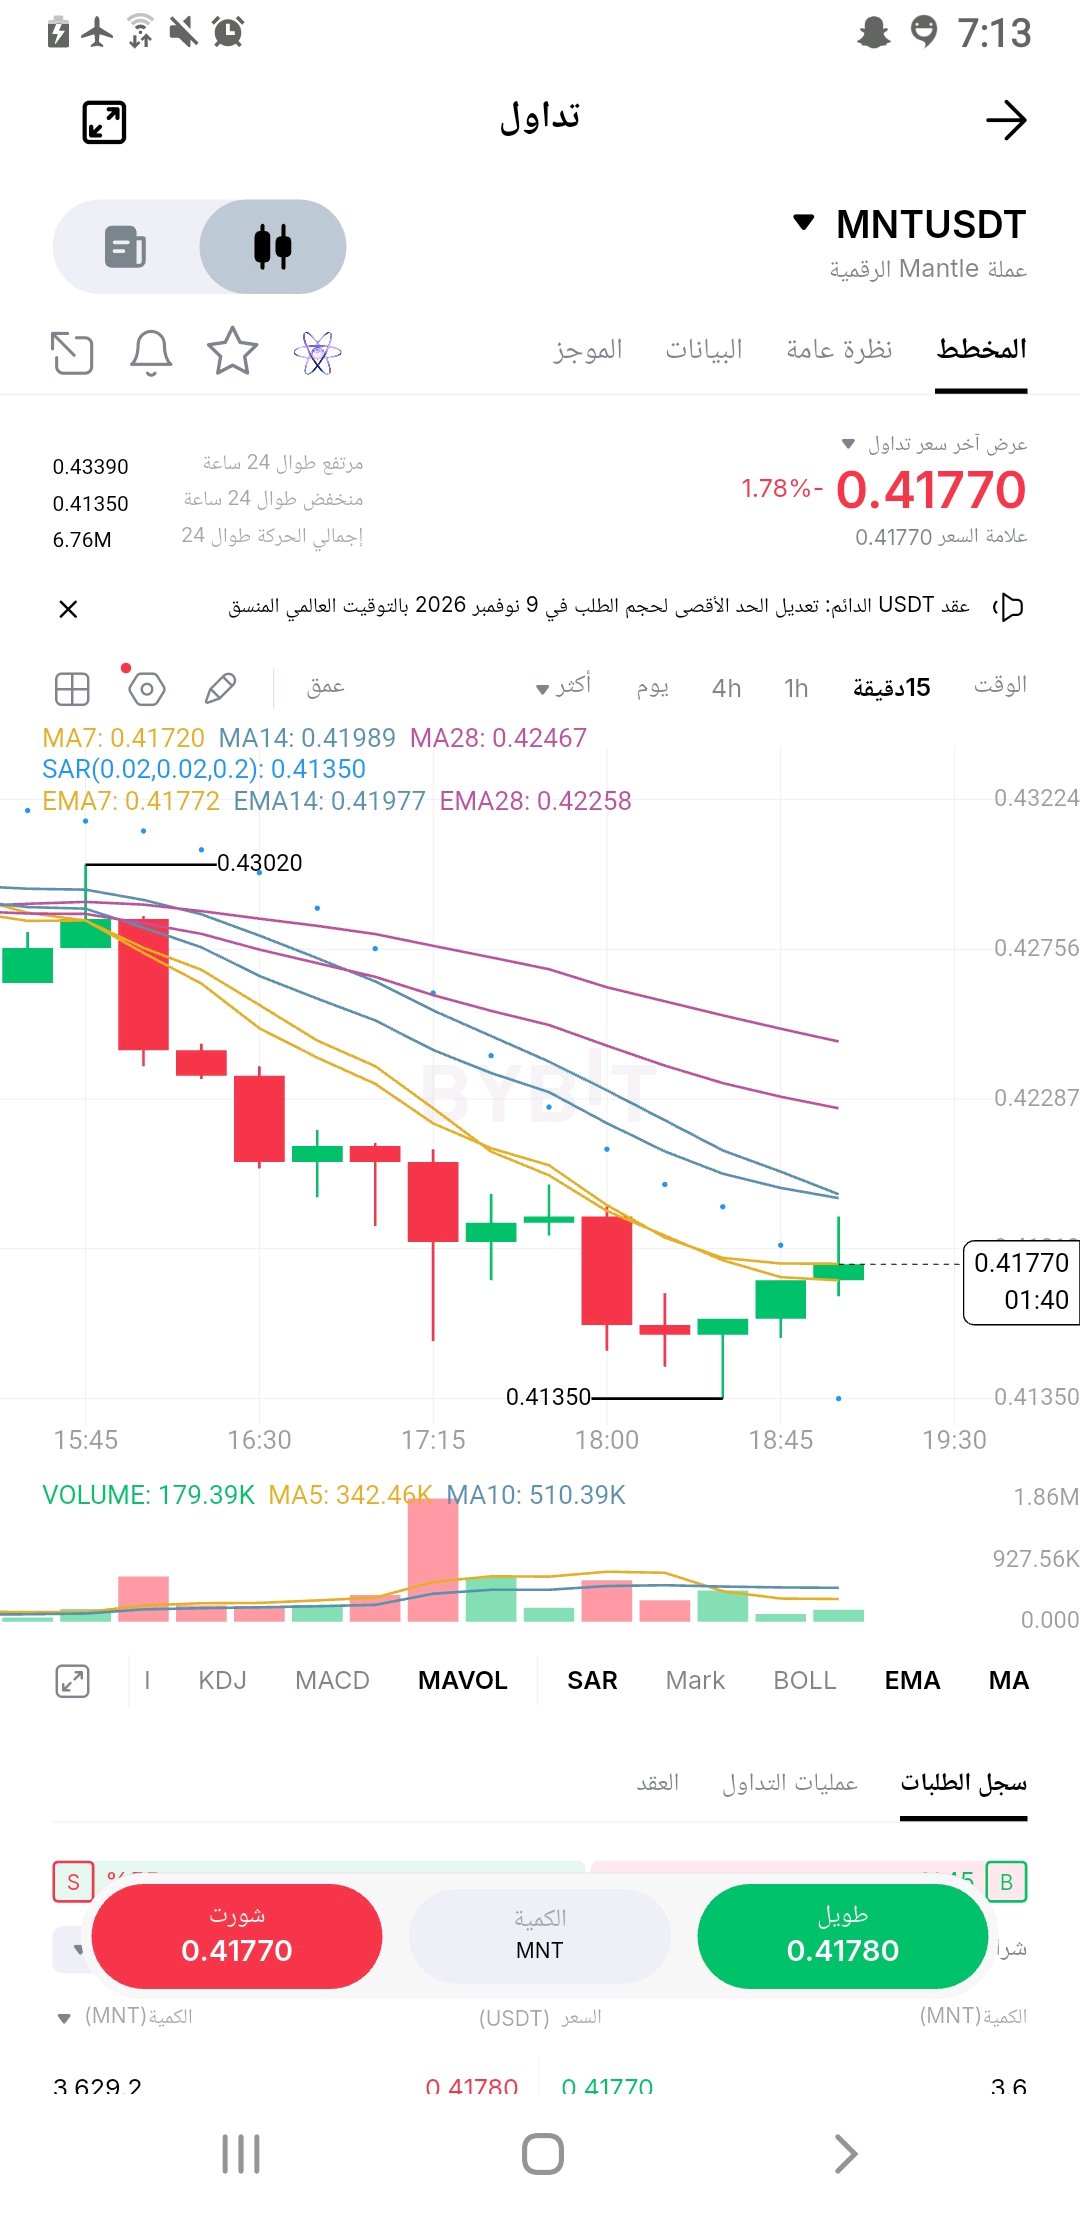
🚨 MNT is poised for a strong move! Has the bullish bounce begun? 🔥 💎 MNT/USDT | 15-minute timeframe 💰 Current price: $0.4177 🟢 Entry zone: $0.4170 – $0.4190 🚀 Bullish confirmation: Breakout above $0.4200 🎯 TP1: $0.4225 🎯 TP2: $0.4245 🎯 TP3: $0.4280 🛑 Stop loss: $0.4130 📊 A bounce from the $0.41350 support is underway as the price attempts to regain momentum, but the trend still needs confirmation with a break above the $0.4200 resistance. 🔥 All eyes are on MNT... Will we witness a new surge? #MNT #Crypto #Bybit #Trading #Altcoins ⚠️ Technical analysis is not a guarantee of profit. Risk management is key. #WSOT2026 #ارتفاع التضخم الأمريكي وزيادة الرهانات على رفع أسعار الفائدة #كشوف المرتبات الأمريكية وقرارات أسعار الفائدة تحرك الأسبوع الاقتصادي #مراقبة مؤشر أسعار المستهلك الأمريكي لشهر نوفمبر $MNTUSDT #ByXIMPACT $SUIUSDT @ByX

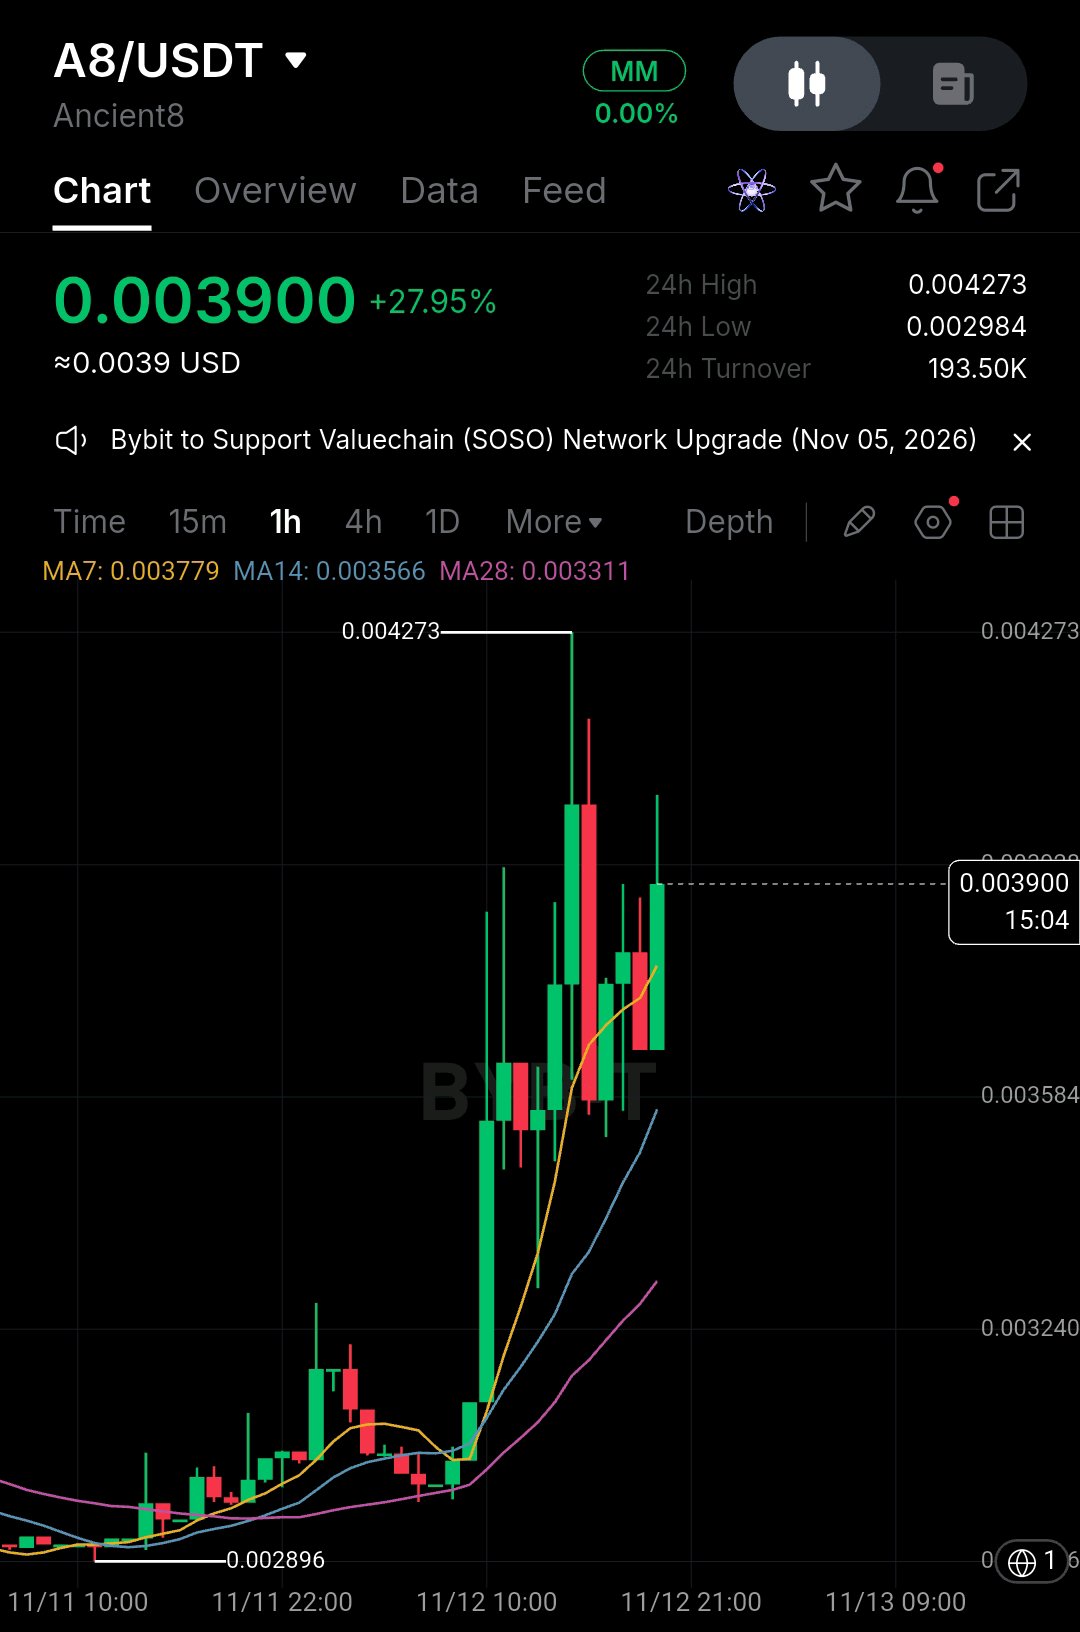
$A8 IS SHOWING STRONG MOMENTUM — BUYERS ARE TAKING CONTROL. 🚀 Ancient8 ($A8) is up nearly 28% in the last 24 hours, with price trading around $0.00390 after a strong breakout on the 1H timeframe. The chart is showing a clear shift in momentum. Price is holding above the 7, 14 and 28-period moving averages, suggesting buyers are maintaining short-term control. The key level I'm watching is $0.00427, the recent swing high. A clean breakout and sustained close above this resistance could open the door for another upside extension. On the downside, $0.00378 is the first level to watch, followed by the $0.00358 support zone. Momentum is strong, but after such a sharp move, some consolidation or a healthy pullback would not be surprising. I'm watching for confirmation rather than chasing the green candles. $A8 | Patience over FOMO. $A8USDT #WSOT2026 #USPayrollsAndRateDecisionsDriveMacroWeek #NovUSCPIWatch #PiecesOf8 #USInflationRunsHotAndRateHikeBetsRise
The 1H chart just gave us a textbook capitulation candle. $AAVEUSDT Price absolutely nuked down to $110.45, sweeping the lows and triggering panic stops. But look at that immediate rejection—we are already back at $112.57. The bears overplayed their hand, and the MACD is already showing hidden bullish divergence. The bounce is loading. Here is the Trade Setup: 🎯 EP (Entry Point): $112.57 (Current Market Price) · We are buying the immediate rejection of the sweep. 🛑 SL (Stop Loss): $109.50 · Strict risk management. If we lose the $110.45 wick low, the setup is invalidated, and the dump continues. No holding and hoping. 💰 TP (Take Profit): · TP1: $116.39 (Local resistance / reclaiming the breakdown level) · TP2: $124.00 (Major liquidity grab above / previous structural supply zone) The Numbers: · Risk: ~2.7% (Downside) · Reward: ~10.1% (Upside to TP2) · R:R Ratio: 3.7 : 1 The trend is heavy, but the selling is exhausted. We play the bounce, take the liquidity, and protect the capital. Let's ride the relief rally. 🚀 #ByXIMPACT #WSOT2026 #USInflationRunsHotAndRateHikeBetsRise #USPayrollsAndRateDecisionsDriveMacroWeek #DeutscheBankLaunchesDigitalAssetCustody $AAVEUSDC

🚨 BREAKING: MAJOR SHAKE-UP AT NVIDIA!
Jensen Huang has reportedly resigned as NVIDIA CEO and board member, effective immediately, with CFO Colette Kress stepping in as interim CEO. If confirmed, this would mark one of the biggest leadership changes in the AI and semiconductor industry. With NVIDIA at the center of the global AI boom, the market will be watching closely for what comes next. A new chapter for NVIDIA begins. 👀 #USPayrollsAndRateDecisionsDriveMacroWeek #WSOT2026 #USInflationRunsHotAndRateHikeBetsRise



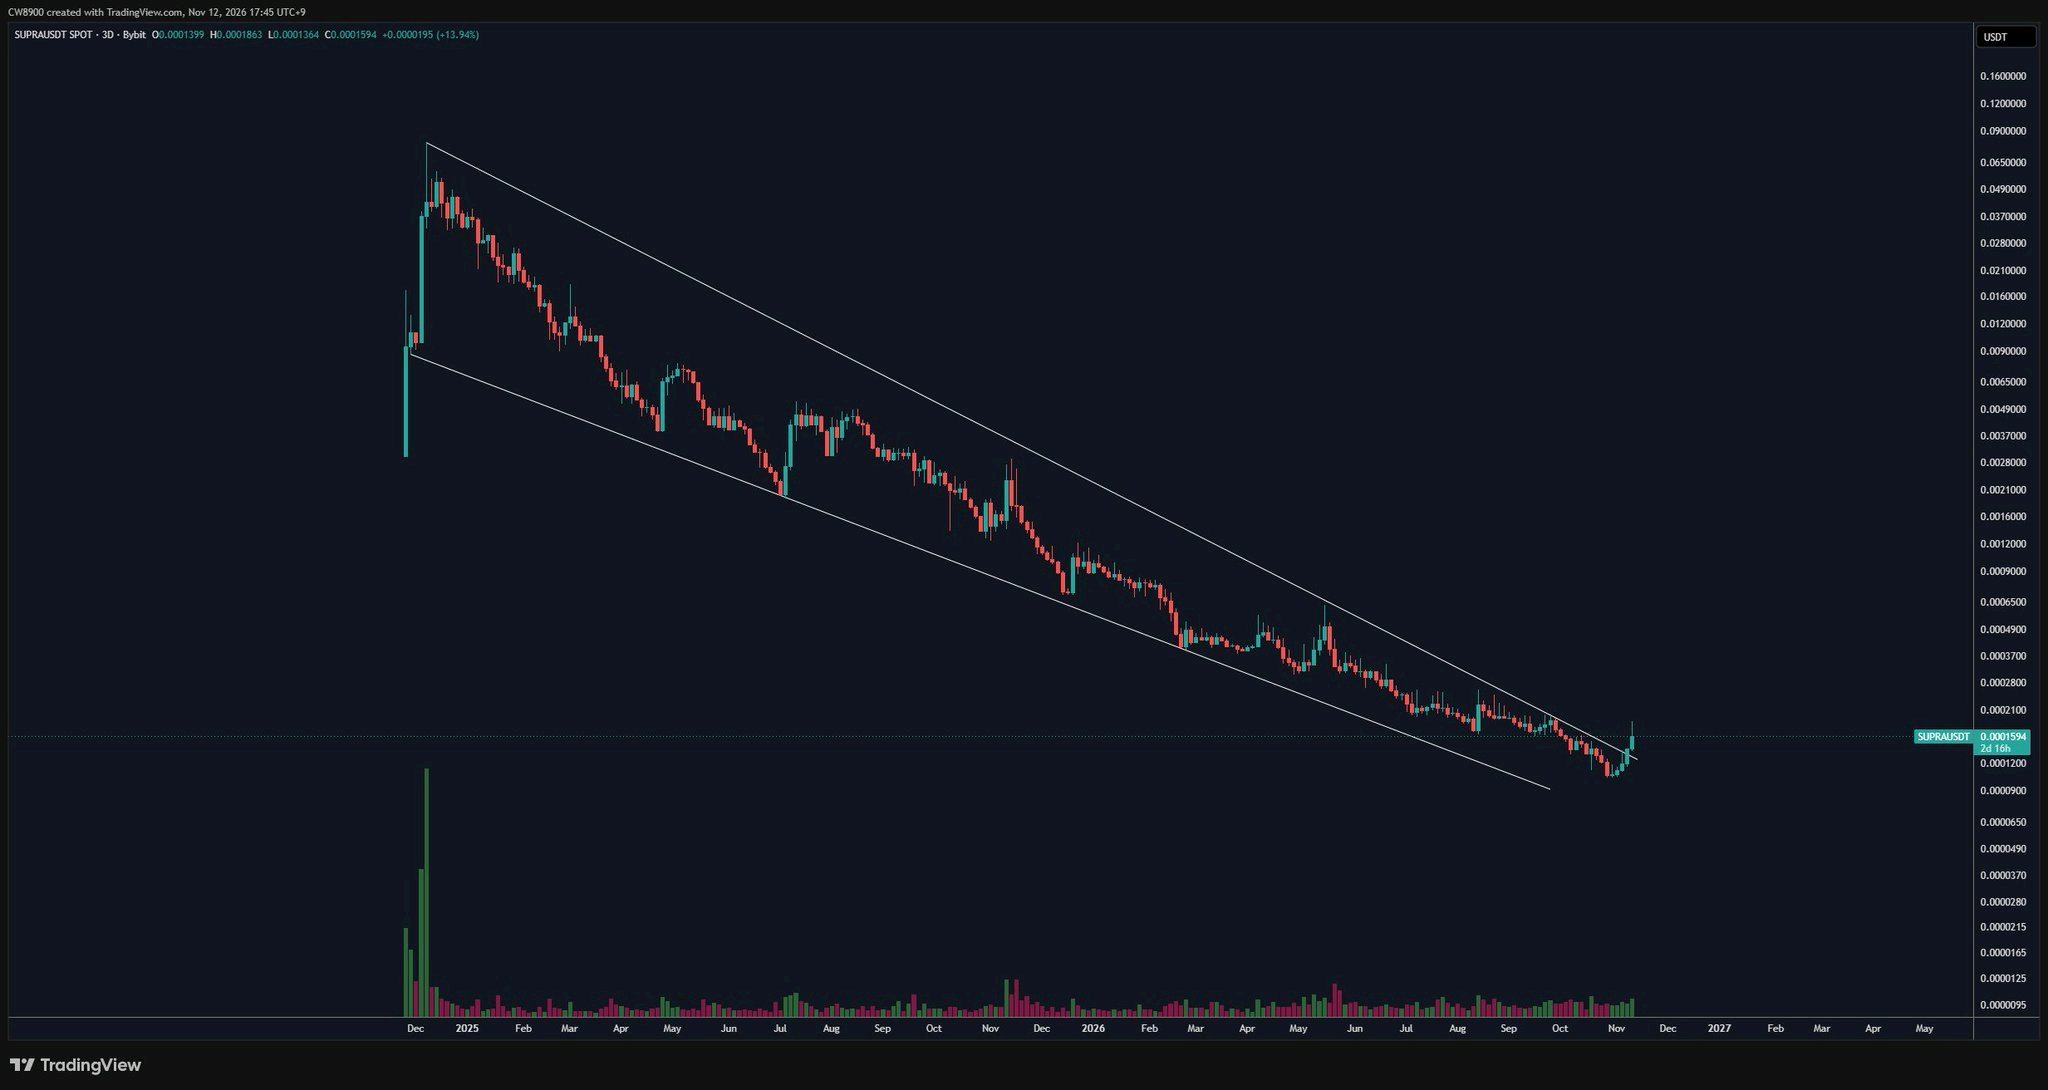
$SUPRAUSDT has broken out of a massive falling wedge pattern. The downtrend has ended, and an uptrend is beginning. #USPayrollsAndRateDecisionsDriveMacroWeek #NovUSCPIWatch #DeutscheBankLaunchesDigitalAssetCustody #AITechSelloffErases2Point5TrillionFromNasdaq100 #PiecesOf8
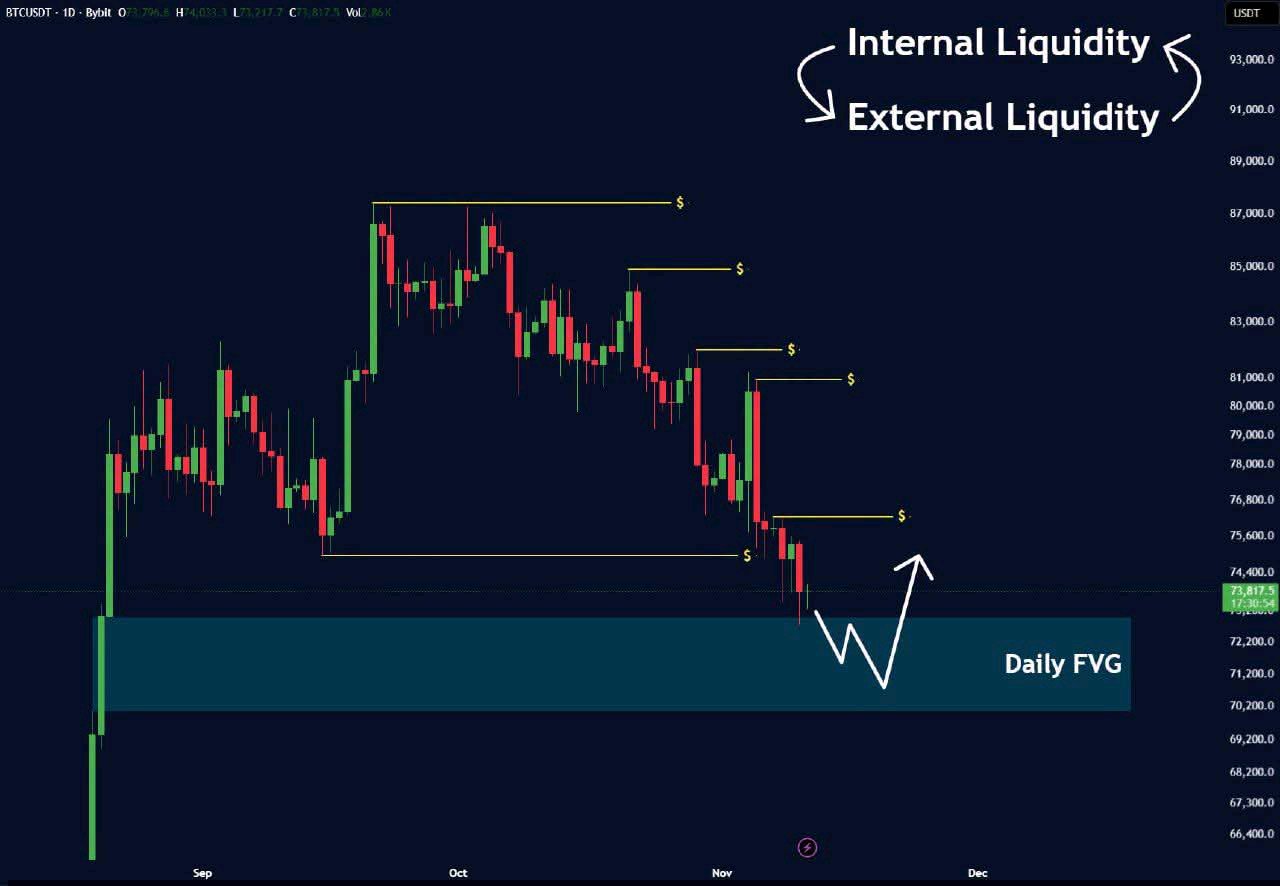
BTC has approached the Daily FVG around $70K–$73K. 👀 Could this be where we see a bounce from? What's your take for today? 🔥 #USInflationRunsHotAndRateHikeBetsRise #AnthropicIPOTestsTheAIBoom #SanDiskAnnounces8For1StockSplit #PiecesOf8 #USPayrollsAndRateDecisionsDriveMacroWeek $BTCUSDT

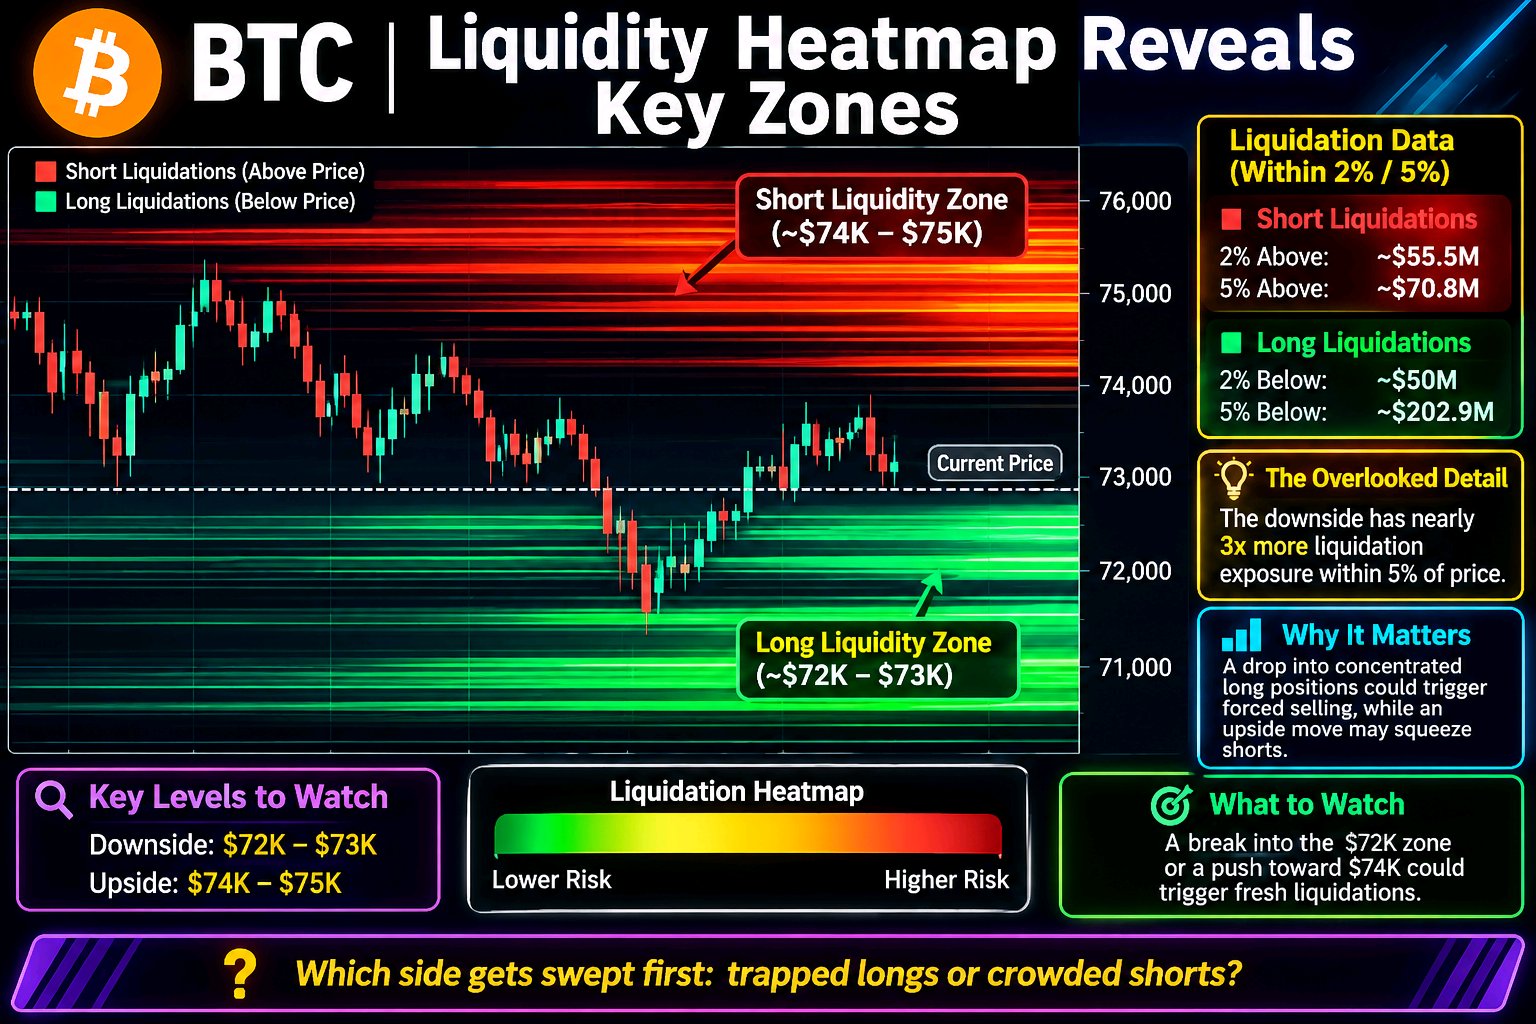
BTC Liquidity Clusters Reveal Two Key Zones
$BTCUSDT Bitcoin is approaching a liquidity battle on both sides, but the downside carries a much larger pool of potential liquidations. Market Observation — November 12 Around 05:26 UTC, BTC liquidation data showed: - Long liquidations within 2% below price: approximately $50M. - Short liquidations within 2% above price: approximately $55.5M. - Long liquidations within 5% below: approximately $202.9M. - Short liquidations within 5% above: approximately $70.8M. The Overlooked Detail The downside has nearly three times the estimated liquidation exposure within 5% of price. Why It Matters A drop into concentrated long positions could trigger forced selling and accelerate volatility. Meanwhile, an upside move could squeeze shorts near current levels. What to Watch Watch the $72K–$73K downside area and nearby $74K–$75K upside liquidity. These are estimated liquidation zones, not guaranteed price targets. Which side gets swept first: trapped longs or crowded shorts? #NovUSCPIWatch #AnthropicIPOTestsTheAIBoom #USPayrollsAndRateDecisionsDriveMacroWeek

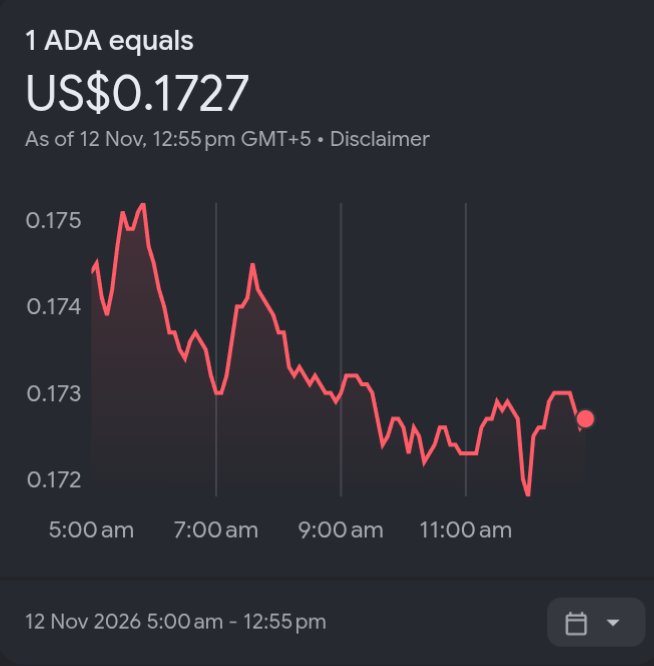
CARDANO (ADA) LATEST MARKET UPDATE 🚨
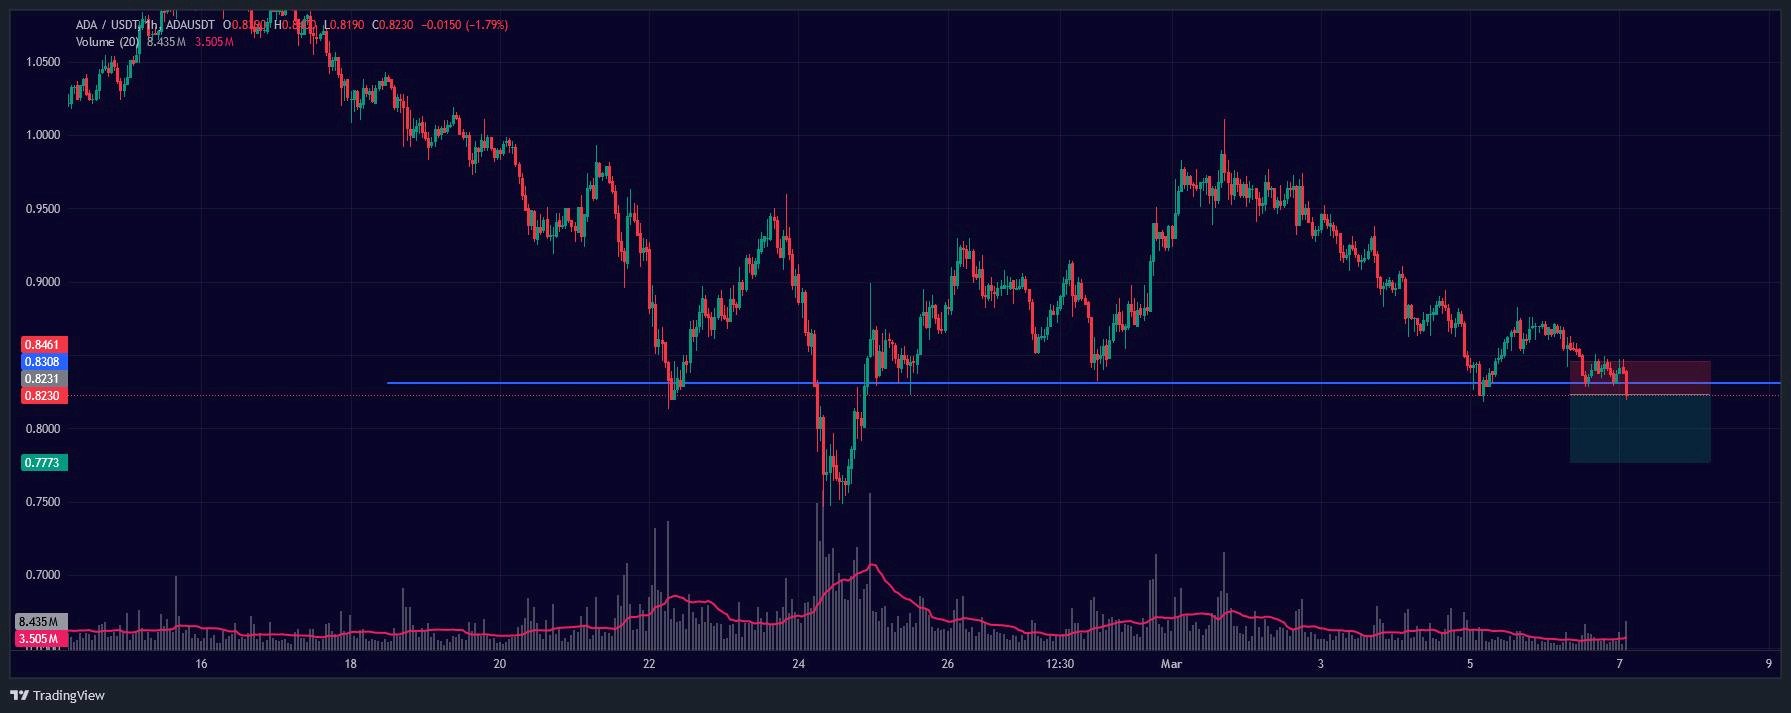
$ADAUSDT CARDANO (ADA) MARKET ANALYSIS | NOVEMBER 12, 2026 Cardano is currently trading around $0.1742, with sellers maintaining pressure on the daily timeframe. 📊 Technical Overview: • Current Price: $0.1742 • Resistance 1: $0.1782 • Resistance 2: $0.1827 • Support 1: $0.1706 • Support 2: $0.1648 📈 Bullish Scenario: A strong breakout above $0.1782 could push ADA towards $0.1827. 📉 Bearish Scenario: A breakdown below $0.1706 could bring further downside towards $0.1648. Market Sentiment: Bearish in the short term. RSI indicates weak momentum, so traders should watch for confirmation before entering positions. 🎯 My Strategy: Watch key support and resistance levels. Avoid chasing sudden price movements. What is your prediction for ADA? 🚀 BULLISH or 🔻 BEARISH? #USPayrollsAndRateDecisionsDriveMacroWeek #NovUSCPIWatch #AnthropicIPOTestsTheAIBoom #OilVolatilityTracksIranPeaceTalks #PiecesOf8 #ADA #Cardano #CryptoAnalysis #BinanceSquare #CryptoTrading


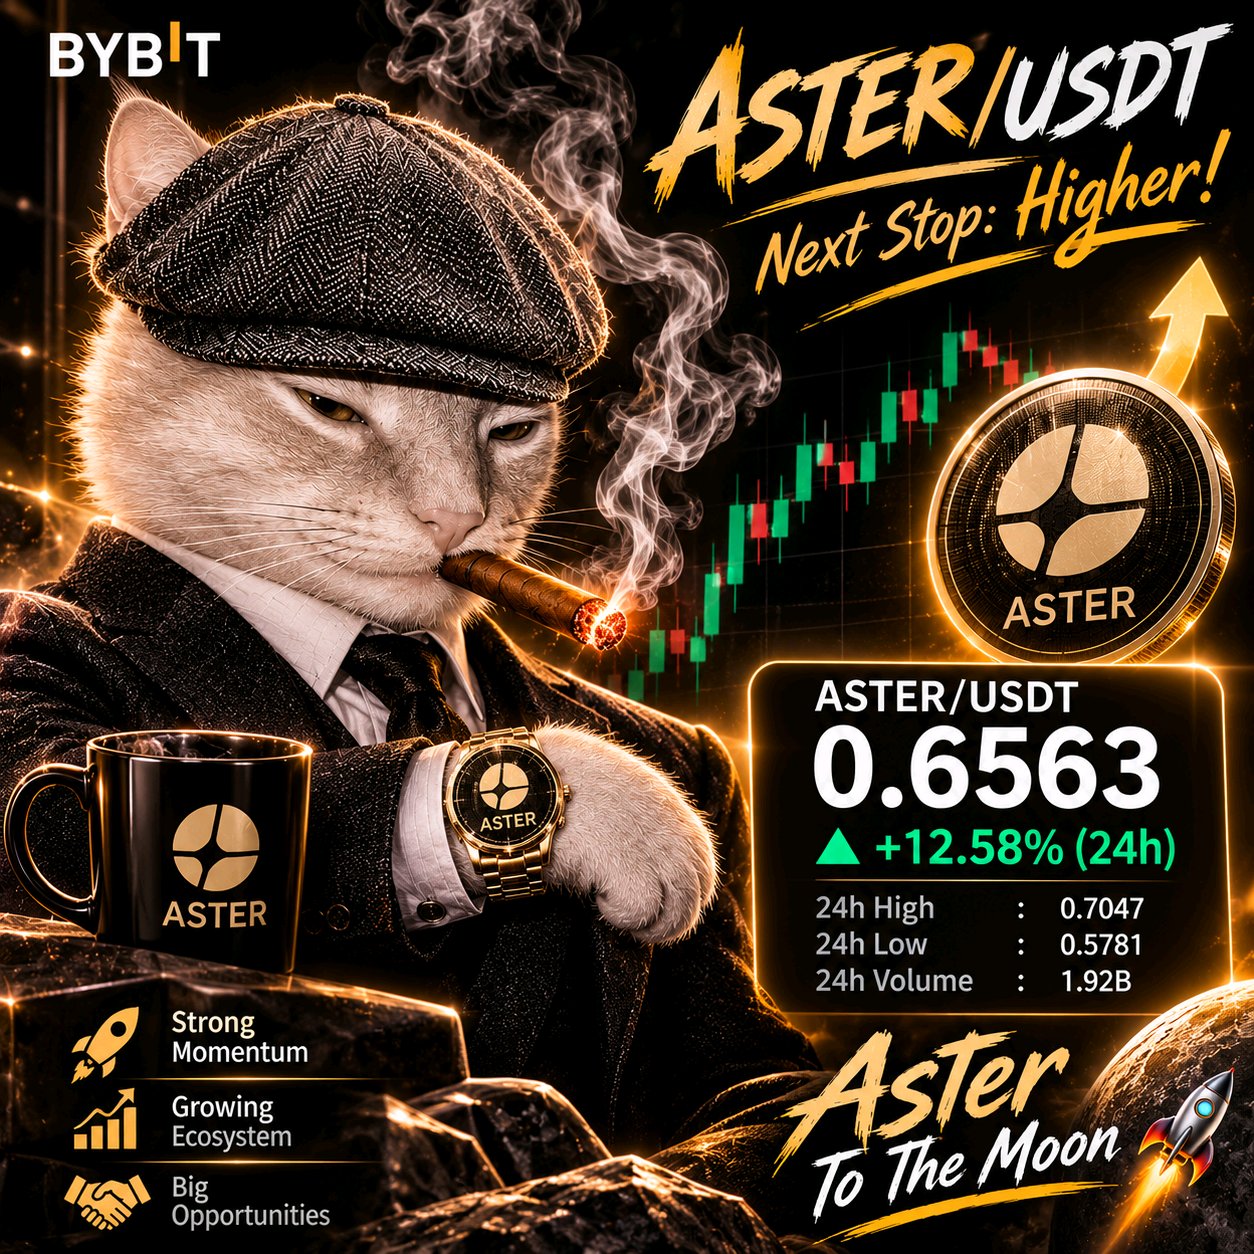
🥷$ASTER:BEYOND PRICE ACTION
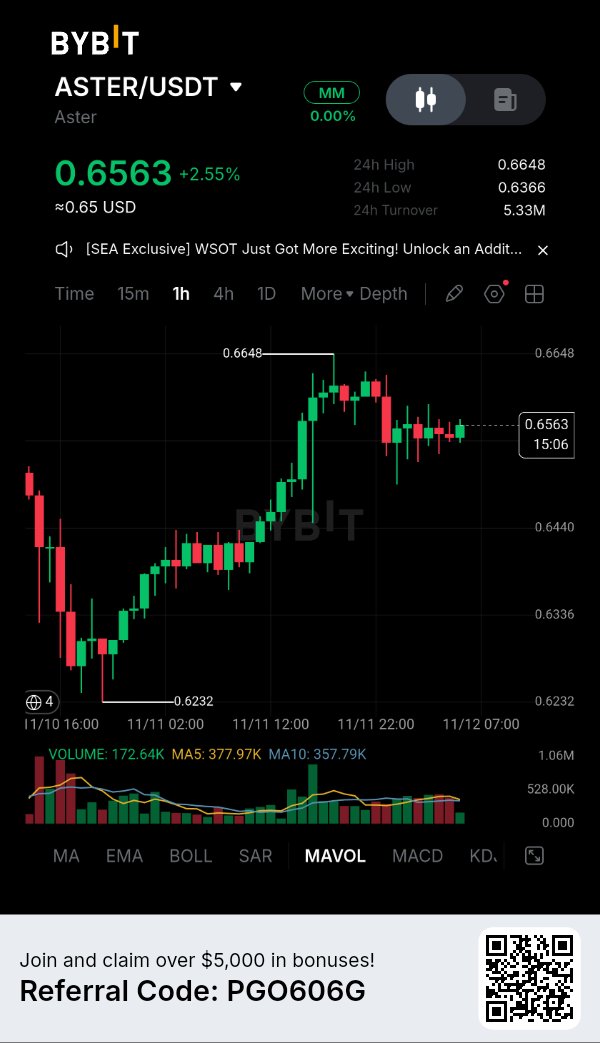
Aster is attracting attention, but the real opportunity may lie beyond short-term price movements. The project recently reported $35 billion in cumulative taker volume through its USD1 RWA Boost program after 10 epochs. This highlights significant trading activity, although volume should not be confused with revenue or net capital inflows. Sotwe Market overview — November 12: ASTER price: approximately $0.6548 24H change: +2.39% 24H range: $0.6362–$0.6643 Open interest: approximately $368.47M What I'm watching: The $0.6362 area is an important short-term reference. A confirmed breakout above $0.6643 could strengthen bullish momentum, with $0.68 as the next area to monitor. However, failure to hold support could expose ASTER to renewed selling pressure. Fundamentally, Aster's combination of perpetual trading, RWA exposure, multi-chain infrastructure and fee-linked buybacks makes it an interesting DeFi ecosystem to follow. Its long-term success will depend on sustainable adoption, real revenue and token utility. DefiLlama +1 My perspective: I'm interested in ASTER's ability to transform trading activity into sustainable ecosystem growth. A price rally is temporary; real utility is what deserves long-term attention. 💬 Do you believe ASTER has the potential to become a major player in DeFi? $ASTERUSDT #ByXIMPACT #USInflationRunsHotAndRateHikeBetsRise #USPayrollsAndRateDecisionsDriveMacroWeek #OilVolatilityTracksIranPeaceTalks #AnthropicIPOTestsTheAIBoom

THANKS TO MY BYBIT FAMILY
💙 BYBIT FAMILY — STRONGER TOGETHER, GROWING TOGETHER! 🚀 Every great journey becomes special because of the people who walk alongside us. My Bybit family, you are more than followers; you are a community built on support, trust, friendship, and shared dreams. I truly appreciate every like, comment, repost, and encouraging word. Your love and support motivate me to keep creating, learning, sharing, and growing every single day. The digital world is full of opportunities, but the real achievement is building genuine connections with amazing people. Let's continue supporting one another, celebrating every milestone, and making this journey unforgettable. Thank you, Bybit family, for being part of my journey. ❤️ Together we grow, together we shine! #Bybit #BybitFamily #CryptoCommunity #TogetherWeGrow #PiecesOf8 #DeutscheBankLaunchesDigitalAssetCustody #NovUSCPIWatch #AnthropicIPOTestsTheAIBoom #USPayrollsAndRateDecisionsDriveMacroWeek $NEARUSDT $ETHUSDT


🚨 BITCOIN UNDER SELLING PRESSURE — WHAT'S NEXT?
Bitcoin traders need to stay alert. When the market turns red, panic is not a strategy. What I'm Watching: 1. Selling pressure and lower highs 2. Key support levels 2. Trading volume and breakout confirmation Bullish Scenario: If buyers regain control and BTC breaks above resistance, a recovery could develop. Bearish Scenario: If support breaks with strong selling volume, further downside may follow. My approach is simple: Wait for confirmation instead of chasing market movements. Remember, protecting capital is just as important as finding opportunities. What do you think? Is Bitcoin preparing for a recovery or another correction? $BTCUSDT $SOLUSDT #BitcoinHitsTwoMonthLowAfterUSMidterms #USPayrollsAndRateDecisionsDriveMacroWeek #AITechSelloffErases2Point5TrillionFromNasdaq100


La apuesta de 1 millón de dólares de Adam Back necesita un ciclo diferente
Esta semana en CNBC, Adam Back dijo que Bitcoin aún está en una etapa temprana de su ciclo, y él apuesta personalmente a que superará el millón de dólares antes de que termine el ciclo. Él sitúa esto en 2028. La cita que circula dice "más tarde en 2028", pero la cobertura que encontré solo dice "para 2028".$BTCUSDT No es una predicción nueva. Él mencionó la cifra de 500,000 a 1 millón de dólares para 2028 en la Conferencia de Bitcoin en abril, y nuevamente con Cointelegraph en junio, argumentando que la demanda minorista y de los ETF de hoy podría ser suficiente por sí sola. Su lógica: la mayor parte de la adopción de Bitcoin, estima que alrededor del 95%, aún está por llegar, y los grandes fondos de jubilación y de inversión realmente aún no han llegado. Él lo llama una apuesta personal, no una garantía. Así que hice los cálculos. Desde aproximadamente 73,000 a 74,000 dólares alrededor del 10 al 11 de noviembre, 1 millón de dólares significa aproximadamente de 13.5 a 13.7 veces el precio actual (según mis cálculos). Para llegar ahí a finales de 2028, Bitcoin tendría que crecer a una tasa compuesta de aproximadamente 240% a 290% anual, dependiendo de si "más tarde en 2028" significa diciembre u octubre (según mis cálculos). A ese precio, toda la red valdría alrededor de 20 billones de dólares, con cerca de 20.1 millones de monedas (según mi estimación). La parte en la que sigo pensando es el momento. Cada uno de los últimos cuatro picos ocurrió de 12 a 18 meses después de un halving, y un mercado bajista siguió cada vez: - Noviembre de 2013: alrededor de 12 meses después del halving de 2012 - Diciembre de 2017: alrededor de 17 meses después del de 2016 - Noviembre de 2021: alrededor de 18 meses después del de 2020 - Octubre de 2025, alrededor de 126,000 dólares: alrededor de 17 a 18 meses después de abril de 2024 Esas fechas coinciden en varios rastreadores de ciclos (CoinGecko cubre los primeros tres), aunque los días exactos varían según el exchange. El mínimo de junio fue de aproximadamente 58,000 a 59,000 dólares. Para llegar a 1 millón de dólares en 2028, el verdadero pico de este ciclo tiene que llegar más tarde de lo que lo hicieron los últimos cuatro. Strategy, una empresa que vende exposición a Bitcoin, dijo el 29 de octubre que ve el comienzo del próximo mercado alcista. En contraparte, los ETF al contado de EE. UU. tienen un saldo negativo de alrededor de 1.1 mil millones de dólares para 2026 hasta el 9 de noviembre, y Bitcoin cayó por debajo de su promedio de 50 semanas en el cierre semanal del 8 de noviembre. Mi opinión: 1 millón de dólares para 2028 es una afirmación mucho mayor que "etapas tempranas". Estoy observando un punto de control. Que Bitcoin vuelva a estar por encima de los 126,000 dólares en algún momento de 2027 sería un aumento de aproximadamente +70% a +73% desde aquí (según mis cálculos). Si todavía está por debajo de eso a finales de 2027, 1 millón de dólares en 2028 necesitaría al menos multiplicar su valor unas 8 veces en un solo año, y más si es menor. #La volatilidad del petróleo sigue las conversaciones de paz con Irán #Las nóminas de EE. UU. y las decisiones sobre tasas impulsan la semana macro #AnthropicIPOValuationTest #8voAniversarioBybit #Observación del IPC de EE. UU. de nov.

MY CRYPTO JOURNEY
My Crypto Journey — 3 Years of Hope, Losses and Learning* Three years ago, I was jobless. No income. No source. Life felt stuck. Then crypto found me. Crypto did not make me rich. It gave me something bigger — hope. It gave me a reason to wake up, to learn, to try again when everything felt closed. I started with Creator Pad campaigns and social media campaigns. I learned posting, engaging, building, and staying consistent. In trading, yes, I faced big losses. Losses that hurt and cannot be cured. But campaign rewards helped me survive, stay alive in this market, and keep going. My experience in crypto is not bad. It taught me patience, discipline, and reality. There is so much to learn about trading, about market, about myself. Now I want one thing more — friends. Because in this digital world, without friends, you are nothing. With friends, every loss becomes a lesson, and every win becomes a celebration. If you are on this journey, let's connect and grow together. #PiecesOf8 #AnthropicIPOTestsTheAIBoom #USPayrollsAndRateDecisionsDriveMacroWeek #NovUSCPIWatch #DeutscheBankLaunchesDigitalAssetCustody $BTCUSDT $NEARUSDT

SUPRA vs NIGHT
#IMPACTbyTrade #WSOT2026 #AITechSelloffErases2Point5TrillionFromNasdaq100 #NovUSCPIWatch #USPayrollsAndRateDecisionsDriveMacroWeek SUPRA vs NIGHT — Comparative Market Analysis 1H Technical Outlook | 12 November 2026 Which coin has the stronger momentum? Which has better entry potential? Where might the whales be positioning? both coins are showing bullish structures, but they are at different stages of their market movements. SUPRA: Aggressive breakout, strong buying momentum, but significantly overbought. NIGHT: Strong upward movement followed by consolidation, with a healthier RSI but weakening momentum. My initial assessment: SUPRA has stronger immediate momentum, while NIGHT currently offers a more balanced technical setup. 1. Side-by-side comparison Chart time frame, 1H (1H) Price in screenshot, $0.0001450 ($0.04746) 24H change, +14.72%(+10.60%) RSI(6), 86.77 (59.90) RSI(12)82.59 (65.48) RSI(24), 75.40 (65.61) MACD, Bullish (Slightly bearish) Volume trend, Increasing (Declining) Price structure, Breakout (Consolidation) Immediate condition, Overextended (Cooling off) What this comparison tells us SUPRA is winning the momentum battle. Its breakout has stronger volume confirmation, and its MACD remains bullish. However, the extreme RSI readings make chasing the price dangerous. NIGHT is winning the short-term risk/reward setup. Its RSI is healthier, and it is consolidating above important moving averages. However, declining volume and a bearish MACD crossover mean another upward move is not yet confirmed. 2. Whale positioning — Where is the big money? This requires separating actual on-chain evidence from what a candlestick chart suggests. SUPRA: Whale assessment There are three important observations: SUPRA has recorded a sharp price increase accompanied by rising trading volume. CoinGlass reported positive spot net inflows in its November 11 snapshot, although the reported inflow was relatively small. SupraTools provides tracking for large wallet movements, staking, unlocks and exchange transfers. However, I cannot establish from the available evidence that large investors are accumulating SUPRA right now. Positive spot inflows alone do not prove whale buying. Whale interpretation: Possible accumulation, but confirmation is missing. NIGHT: Whale assessment NIGHT presents a more interesting ownership picture. Cardanoscan currently reports: Approximately 127,435 holders. Top 100 holders control approximately 81% of supply. Top 10 holders control approximately 59.2%. 16 wallets are classified as whales, holding approximately 66% of supply. Cardanoscan There is also evidence of significant large-wallet trading. Recent reported transactions include: A purchase of approximately 891,584 NIGHT. A sale of 500,000 NIGHT. Another purchase of approximately 476,202 NIGHT. A sale of approximately 488,139 NIGHT. Super Cardano Whale interpretation: Large holders are active, but their positioning is mixed. The concentration of NIGHT ownership is an important risk. Large holders can influence liquidity and price movements. Important distinction: A large wallet is not automatically a whale accumulating. Some large wallets belong to exchanges, treasury operations, foundations or custodians. My assessment: SUPRA: Momentum-led buying, with whale confirmation still needed. NIGHT: Concentrated ownership, with evidence of substantial buying and selling. Neither chart proves that whales are preparing for another pump. 3. Strengths and weaknesses SUPRA — Supra Strengths Strong bullish breakout. Increasing trading volume. Positive MACD momentum. Strong short-term buying interest. Potential for continuation if resistance breaks. Weaknesses RSI readings are dangerously elevated. Vulnerable to sudden profit-taking. A breakout failure could trigger a sharp retracement. Whale accumulation is not yet independently confirmed. Relatively small market depth can increase volatility. $SUPRAUSDT $NIGHTUSDT


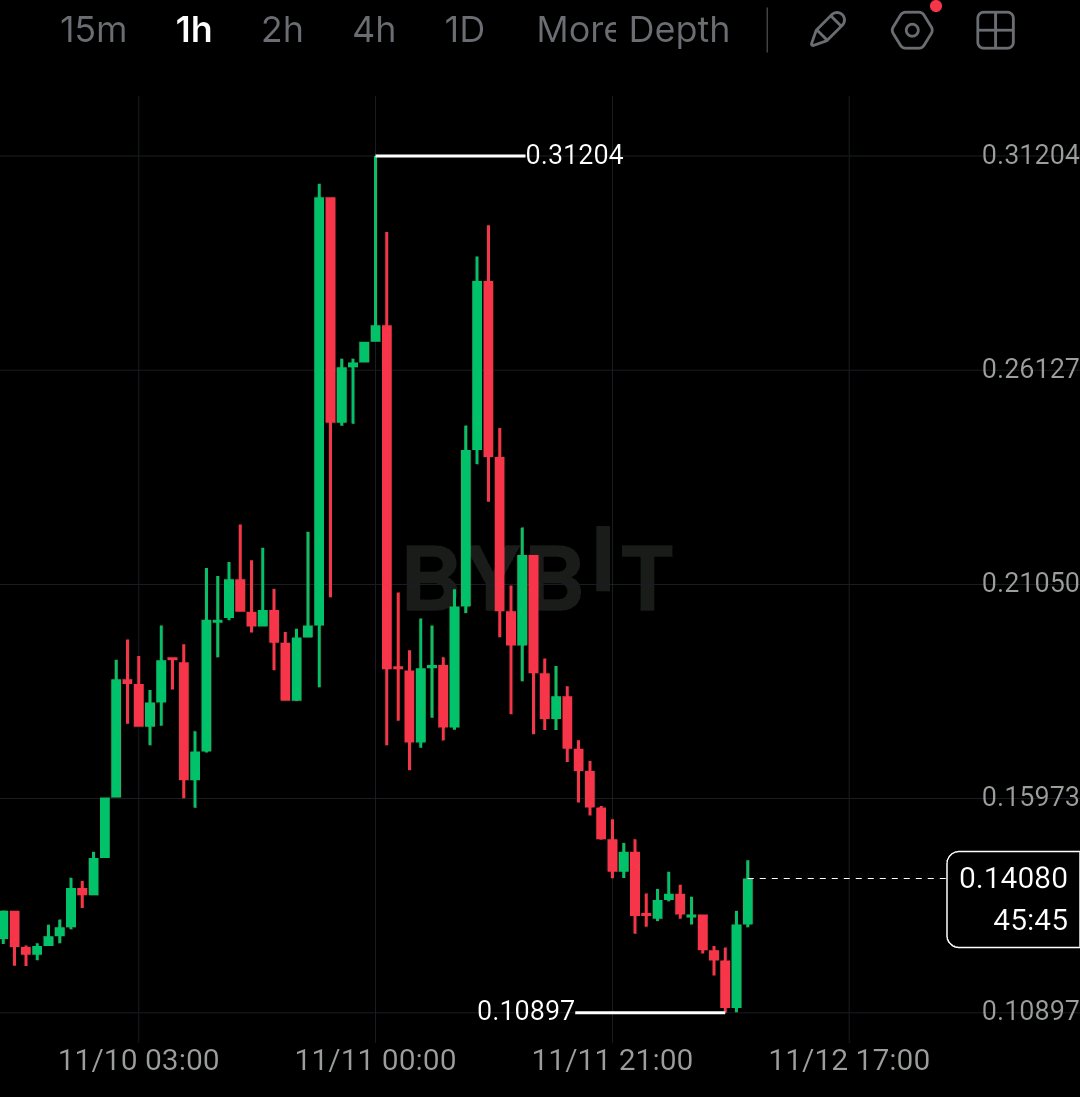
$INITUSDT at $0.1426 after a -54% crash and I am not buying this bounce yet I saw INIT pump straight to $0.39500 and then dump to $0.11046 in the same day. That is not a normal move, that is a pump and dump. Now it is at $0.14264, trying to hold. That bounce looks green, but I have seen this trap before. I am not calling a bottom just because we bounced from $0.11046. For me $0.11046 is the floor that must hold. That is the 24h low. If we lose it with a close below, $0.09623 opens fast. On the upside $0.15883 is the first wall. Break and hold above $0.15883 and $0.18296 opens. My plan is simple. I am not buying $0.1426 in the middle. If we hold $0.11046 and close above $0.15883, I look long toward $0.18296, stop below $0.11046. If $0.11046 breaks, I step aside, short toward $0.09623 only on confirmed close below. Risk 1 to 2% only, 5x to 10x isolated max. This coin just moved -54% in a day, I am keeping size small. Tell me, does $0.11046 hold or does $0.15883 reclaim first? Comment HOLD if $0.11046 holds, BREAK if $0.09623 comes. Tap $INITUSDT to trade this $0.11046 test, trade on this same coin. @BybitX @Bybit Learn @612 Ceros @SignalX @Demon - Trader @RoYoK @IBLOLO #IMPACTbyTrade #USPayrollsAndRateDecisionsDriveMacroWeek #AnthropicIPOTestsTheAIBoom #PiecesOf8 #WSOT2026 #USInflationRunsHotAndRateHikeBetsRise
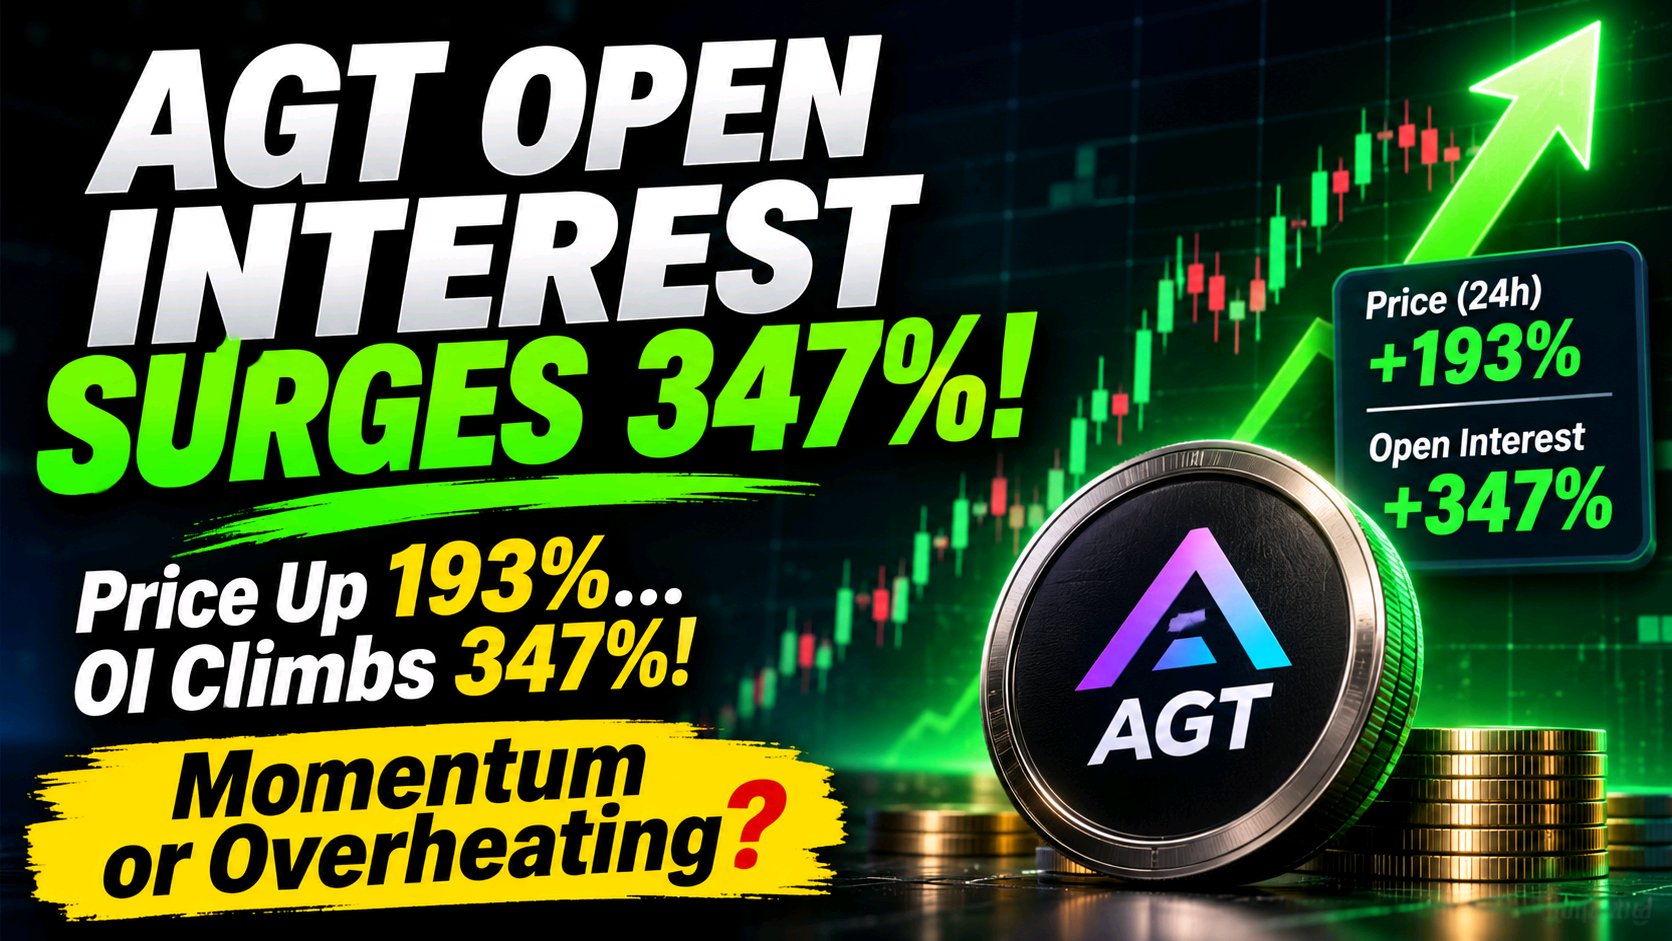
¡El interés abierto de AGT se dispara un 347%!
#BybitIAEvolucionando $AGT está atrayendo una atención especulativa masiva a medida que la actividad de trading apalancado se acelera. AGT ha registrado un aumento de precio aproximado del 193% en 24 horas, mientras que el Interés Abierto (Open Interest) ha subido casi un 347%, alcanzando alrededor de 67 millones de dólares. **El detalle clave:** El Interés Abierto está aumentando significativamente más rápido que el precio. Esto sugiere que están entrando al mercado nuevas posiciones apalancadas agresivas. Mientras tanto, aproximadamente 2.3 millones de dólares en liquidaciones de posiciones en corto indican que los traders bajistas han enfrentado una presión sustancial. **Por qué es importante:** El aumento del precio junto con el aumento del OI señala una participación de mercado en expansión. Sin embargo, una tasa de financiación elevada cercana al 0.13% cada 8 horas sugiere que las posiciones largas podrían estar saturándose. **Qué observar:** Si el precio continúa subiendo con un volumen fuerte, el impulso alcista podría mantenerse intacto. Pero una reversión del precio junto con una disminución del OI podría señalar el cierre de posiciones largas. ¿Está AGT construyendo un impulso sostenible o el apalancamiento excesivo está preparando el próximo shock de volatilidad? #Las nóminas de EE. UU. y las decisiones sobre tasas impulsan la semana macro #Observación del IPC de EE. UU. de nov.
Niveles clave
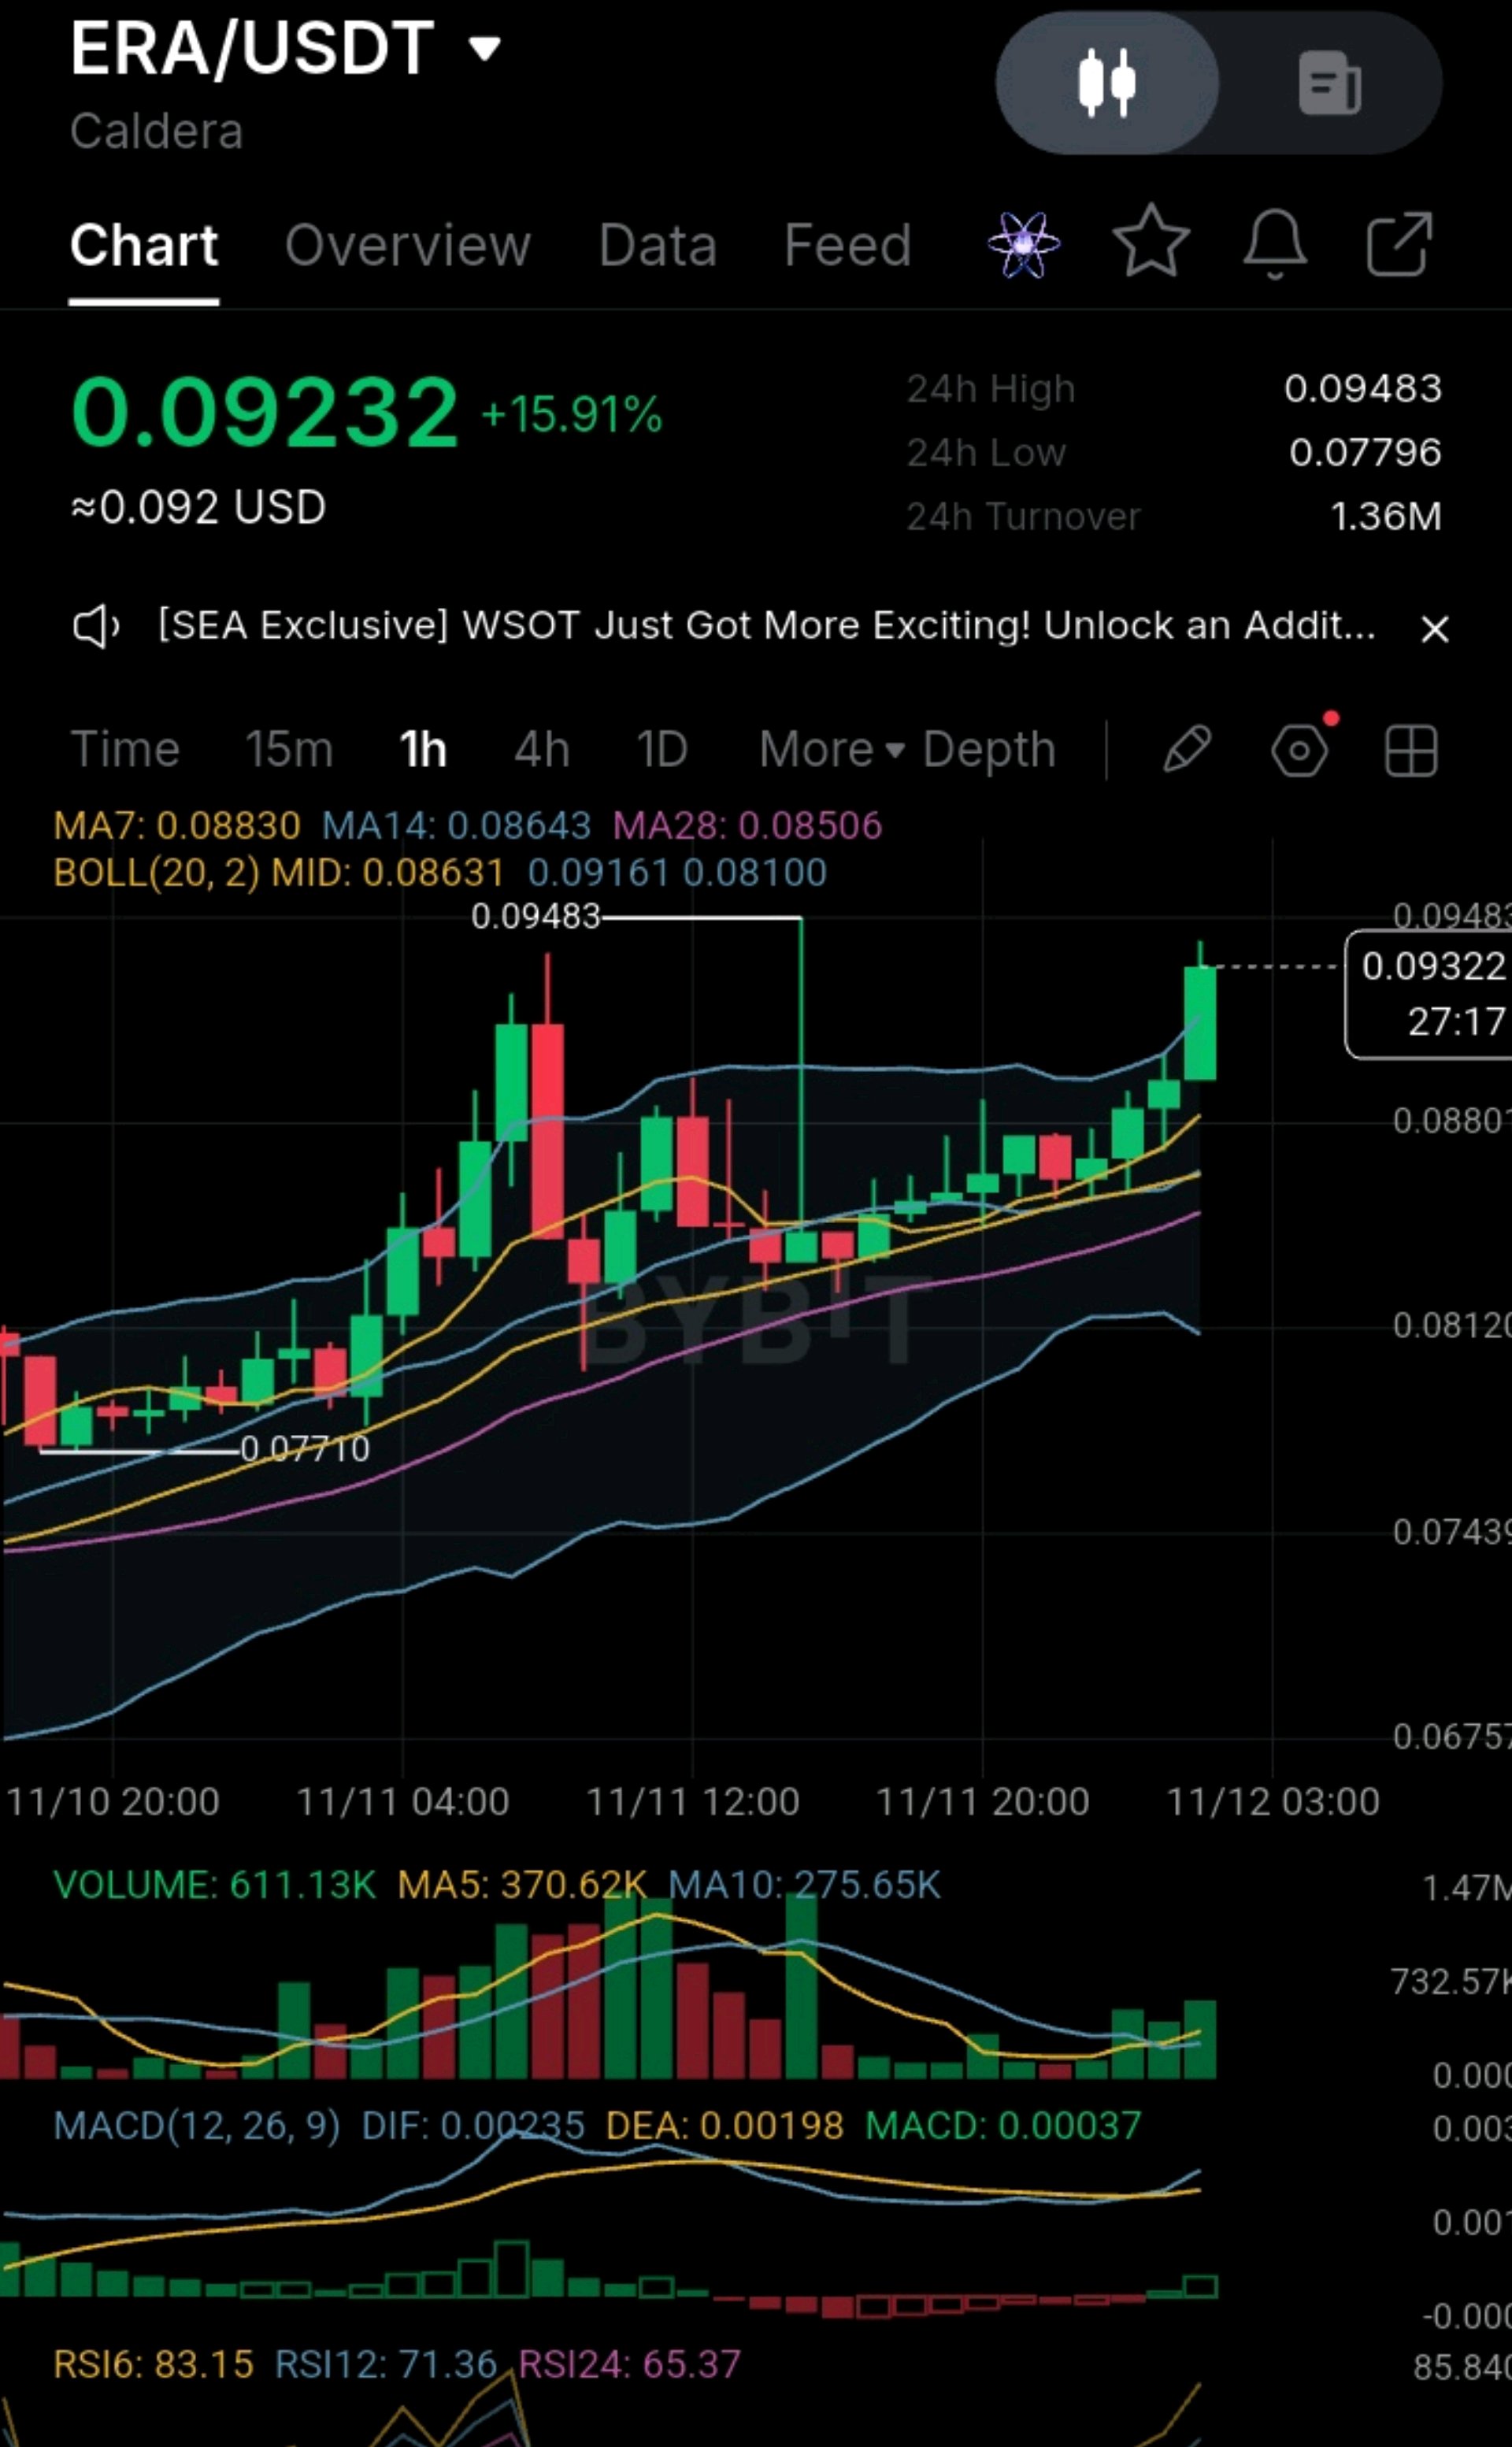
#ByXIMPACT #LaInflaciónEnEUAseDisparaYLasaApuestasDeAumentoDeTasasSuben #La venta masiva de acciones tecnológicas borra 2.5 billones del Nasdaq 100 #BitcoinAlcanzaMinimoDeDosMesesDespuesDeLasEleccionesDeMedioTerminoEnEEUU #Las nóminas de EE. UU. y las decisiones sobre tasas impulsan la semana macro ERA está presionando de nuevo hacia su máximo de 24 horas después de una limpia escalera de mínimos más altos. Los siguientes cierres de hora decidirán si rompe al alza o si falla en 0.0948 por segunda vez. Miren este gráfico de 1 hora. ERA subió desde el mínimo de 0.0771, tuvo un pico hasta 0.09483, retrocedió y se mantuvo por encima de las medias móviles, para luego repuntar de nuevo. La última vela verde está empujando a través de la Banda de Bollinger superior y probando el máximo anterior. El precio está alrededor de 0.0923 a 0.0932, subiendo un 15.91% en el día, y la vela sigue abierta con unos 27 minutos restantes, así que hay que juzgarla al cierre. La fuerza: El precio está por encima de la MA7 (0.08830), MA14 (0.08643) y MA28 (0.08506), y las medias móviles están apiladas en orden alcista y subiendo. El MACD acaba de cruzar al alza (DIF 0.00235 contra DEA 0.00198, histograma +0.00037). El volumen lo está confirmando: la barra actual (611.13K) está muy por encima de la MA5 (370.62K) y la MA10 (275.65K). Eso es inusual después de un retroceso y favorece el intento de ruptura. Riesgo de agotamiento: El RSI6 está en 83.15 (RSI12 71.36, RSI24 65.37), por lo que a corto plazo está sobrecomprado. El precio está por encima de la Banda de Bollinger superior (0.09161) y a cerca de un 5% por encima de la MA7, así que el movimiento está extendido. 0.09483 es una zona de rechazo anterior, y ERA la está probando por segunda vez. Las pruebas dobles a menudo fallan sin un volumen fuerte. El volumen de negociación es modesto (1.36M), así que las reversiones pueden ser bruscas. Niveles clave: Resistencia: 0.09483 (máximo de 24h), luego aproximadamente 0.0990-0.1000 (un estimado cerca del número redondo, no un nivel rígido) Soporte: 0.09161 (banda superior), 0.08830 (MA7), 0.08643 (MA14), 0.08631 (media de BB), 0.08506 (MA28), luego 0.0810 y el mínimo de 0.0771 Plan de trading (ilustrativo): Entrada preferida: un retroceso hacia 0.0885-0.0905, cerca de la MA7 y la parte superior de la consolidación reciente, idealmente con una vela de rebote. Stop loss: 0.0860, justo por debajo de la MA14 y la línea media de BB. Una ruptura al cierre por debajo invalida la configuración. Objetivo 1: 0.09483, alrededor de 1.5R desde una entrada en 0.0895. Objetivo 2: 0.0990, alrededor de 2.7R. Alternativa de ruptura: un cierre horario por encima de 0.09483 con volumen creciente, con un stop por debajo de 0.0910 y un tamaño de posición más pequeño, ya que el stop queda lejos de una entrada de ruptura. Tamaño de posición: arriesga solo 1-2% de tu cuenta en la distancia del stop. Toma ganancias parciales en el Objetivo 1 y mueve el stop al punto de equilibrio (breakeven). Si sale mal: por debajo de 0.0860, espera una caída hasta la MA28 (0.08506), luego 0.0810 (la banda inferior), y una ruptura de eso pondría en juego el mínimo de 0.0771. Veredicto: esta es una de las configuraciones más saludables porque el volumen y el MACD están de acuerdo con la tendencia. Pero con el RSI6 por encima de 83 y una nueva prueba de un máximo anterior, preferiría esperar un retroceso a la zona de la MA7, o una ruptura de volumen confirmada por encima de 0.09483, en lugar de comprar en los máximos. Llamado a la acción: ¿Estás comprando la caída a 0.0890, esperando una ruptura confirmada de 0.0948, o manteniéndote fuera hasta que el RSI se enfríe? Establece alertas en 0.09483 y 0.0860 para que no te pierdas ninguno de los dos movimientos. Esto es análisis técnico para discusión, no es asesoramiento financiero. $ERAUSDT
El aumento de las tasas en diciembre vuelve a estar sobre la mesa
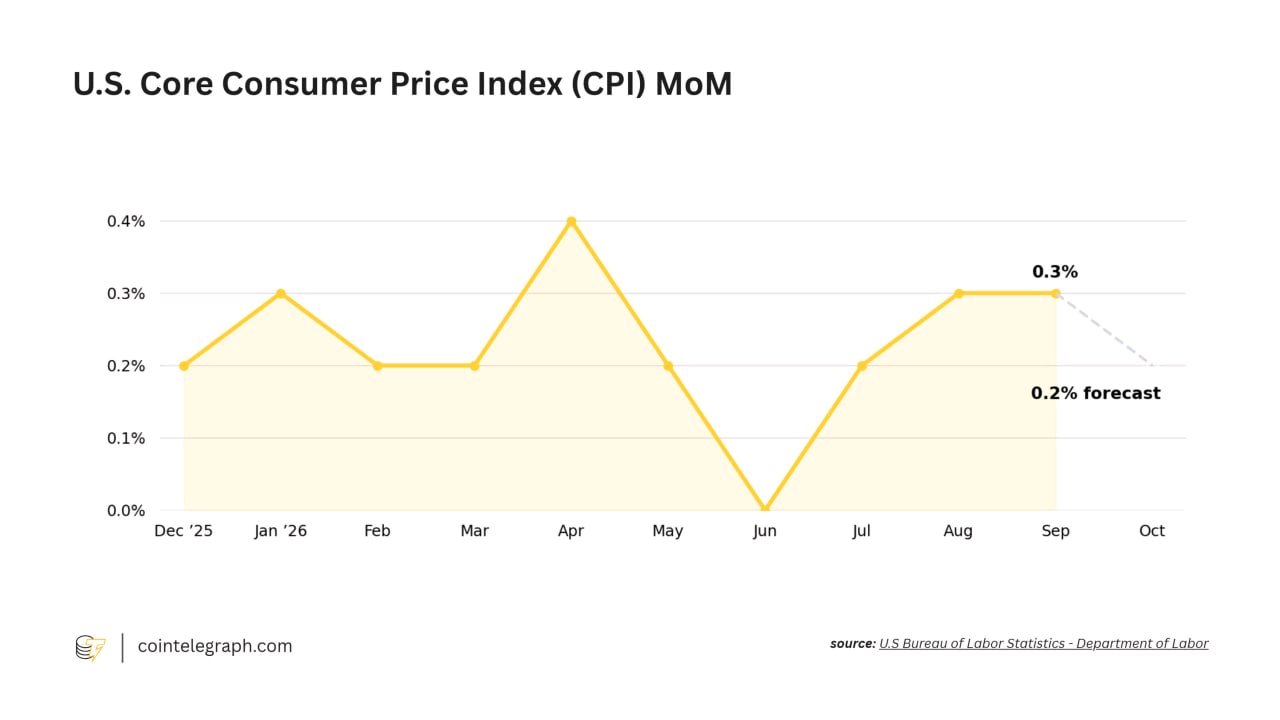
Diciembre podría traer otra sorpresa de la Fed. Waller señala un posible aumento de tasas de 25–50 puntos base, con una inflación subyacente (Core CPI) de octubre esperada en 0.2%, lo cual probablemente influirá en la decisión. $BTCUSDT Los mercados están descontando las expectativas, pero los datos de inflación determinarán la narrativa. Un solo reporte de IPC. Grandes implicaciones para los activos de riesgo. #LaInflaciónEnEUAseDisparaYLasaApuestasDeAumentoDeTasasSuben #BitcoinAlcanzaMinimoDeDosMesesDespuesDeLasEleccionesDeMedioTerminoEnEEUU #Observación del IPC de EE. UU. de nov. #Las nóminas de EE. UU. y las decisiones sobre tasas impulsan la semana macro #La volatilidad del petróleo sigue las conversaciones de paz con Irán
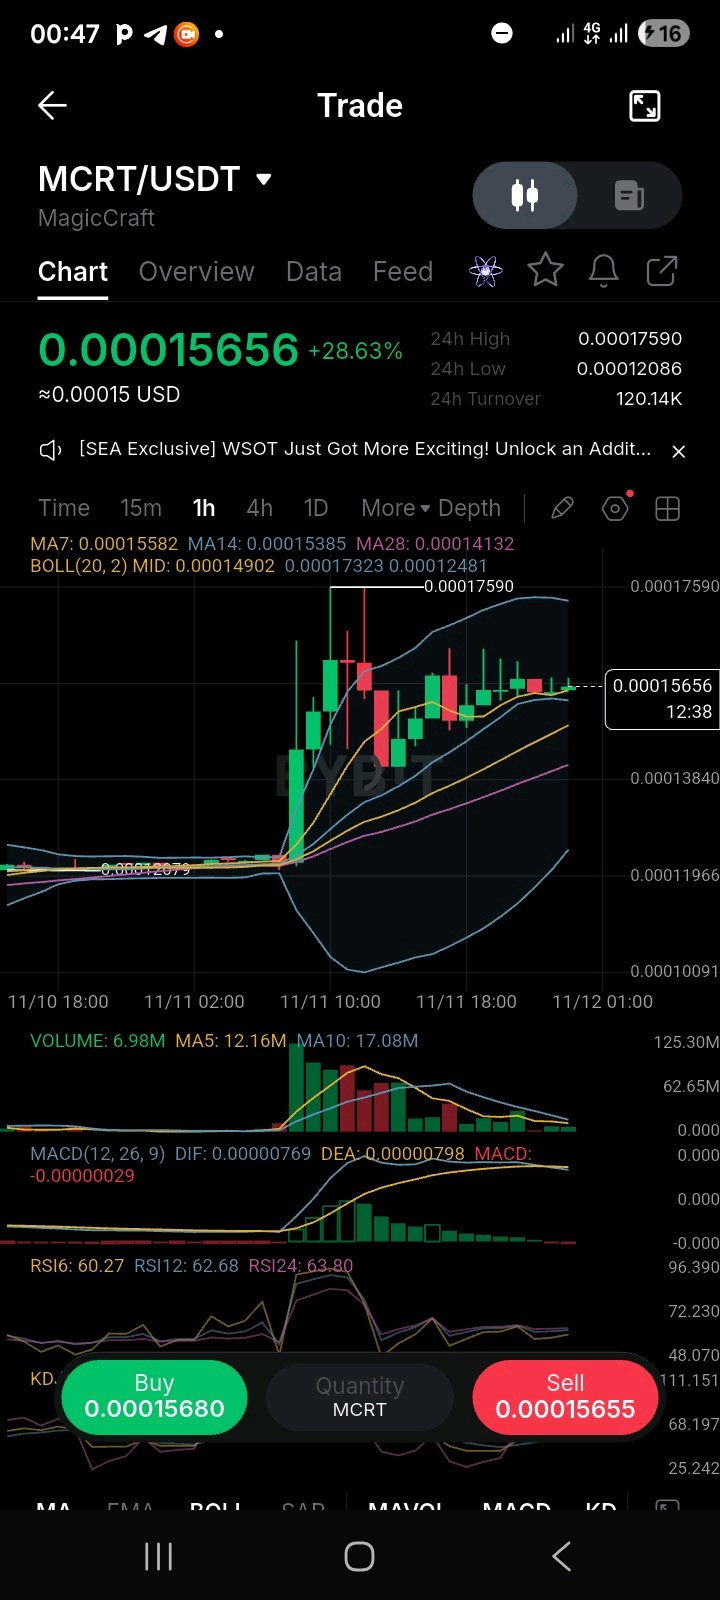
MCRT subió con todo
#IMPACTbyTrade #LaInflaciónEnEUAseDisparaYLasaApuestasDeAumentoDeTasasSuben #WSOT2026 #Las nóminas de EE. UU. y las decisiones sobre tasas impulsan la semana macro #La volatilidad del petróleo sigue las conversaciones de paz con Irán MCRT subió con fuerza, se enfrió y ahora se está comprimiendo en un rango estrecho por debajo de su máximo de 24 horas. Los siguientes cierres horarios decidirán si esto es una bandera antes de un segundo impulso o un desvanecimiento. Mira esta gráfica de 1 hora. MCRT se mantuvo plano alrededor de 0.00012 durante horas, luego explotó con una vela de gran volumen hasta un máximo de 0.00017590. Fue rechazado, retrocedió hacia 0.00014 y desde entonces se ha consolidado en velas pequeñas justo sobre la MA7/MA14. El precio está en 0.00015656, con una subida del 28.63% en el día, y la vela actual sigue abierta (quedan unos 12 minutos), así que hay que juzgarla al cierre. La Fuerza: El precio está por encima de la MA7 (0.00015582), MA14 (0.00015385) y MA28 (0.00014132), y por encima de la línea media de las Bandas de Bollinger (0.00014902). El retroceso fue ordenado y se mantuvo en las medias móviles, lo cual es constructivo después de un movimiento vertical. El RSI se ha enfriado desde niveles extremos a 60-64 (RSI6 60.27, RSI12 62.68, RSI24 63.80), por lo que el movimiento se ha reseteado sin romper la estructura. El Riesgo de Agotamiento: El MACD ha cruzado a la baja: el DIF (0.00000769) está por debajo de la DEA (0.00000798), con un histograma ligeramente negativo. El momentum se está desvaneciendo. El volumen se está secando: 6.98M ahora frente a una MA5 de 12.16M y una MA10 de 17.08M. El gran volumen estuvo todo en las velas de ruptura. El máximo de 0.00017590 fue rechazado con una mecha larga, por lo que los vendedores están activos en 0.00017-0.00017590. El volumen de negociación (turnover) es bajo (120.14K), y un día de +28% en un token de micro-precio puede revertirse rápido. Niveles clave: Resistencia: 0.00016500, luego 0.00017323 (banda superior), luego 0.00017590 (máximo de 24h) Soporte: 0.00015582 (MA7), 0.00015385 (MA14), 0.00014902 (media BB), 0.00014132 (MA28), luego la base en 0.00012079 Plan de Trading (ilustrativo): Entrada preferida: un retroceso hacia 0.00015200-0.00015450 (área de MA14), idealmente con una vela de rebote. Stop loss: 0.00014700, justo por debajo de la línea media de las Bandas de Bollinger. Un cierre por debajo invalida la configuración. Objetivo 1: 0.00016500, alrededor de 2.0R desde una entrada en 0.00015300. Objetivo 2: 0.00017323, alrededor de 3.4R. Objetivo 3: 0.00017590 (máximo de 24h), alrededor de 3.8R. Alternativa de ruptura: un cierre horario por encima de 0.00017590 con volumen creciente, con un stop por debajo de 0.00016500 y un tamaño de posición menor, ya que perseguir una ruptura tiene peor relación riesgo/beneficio. Tamaño de posición: arriesga solo 1-2% de tu cuenta según la distancia del stop. Toma ganancias parciales en el Objetivo 1 y mueve el stop al punto de equilibrio (breakeven). Si sale mal: por debajo de 0.00014700, espera un deslizamiento hacia la MA28 (0.00014132), y por debajo de eso, todo el movimiento correría el riesgo de devolver gran parte de las ganancias hacia la base de 0.00012. Veredicto: la estructura es alcista y la consolidación es saludable, pero el momentum y el volumen se están desvaneciendo. Yo buscaría un rebote en la zona de la MA14/media BB o una ruptura con volumen por encima de 0.00017590 antes de confiar. Después de un día de +28%, perseguirlo aquí es una mala relación riesgo/beneficio. No veo un catalizador de noticias en la gráfica, así que revisa primero si hay listados o anuncios. Llamado a la acción: ¿Estás comprando el retroceso a 0.000153, esperando una ruptura confirmada de 0.0001759, o manteniéndote fuera hasta que regrese el volumen? Configura alertas en 0.0001759 y 0.0001470 para que no te pierdas ninguno de los dos movimientos. Esto es análisis técnico para discusión, no es asesoramiento financiero. $MCRTUSDT
Los 850,364 BTC de Strategy: una cifra enorme y cerca del punto de equilibrio
Strategy tiene ahora 850,364 BTC, según su informe de la SEC del 9 de noviembre. Eso es aproximadamente el 4.2% del suministro en circulación, o alrededor del 4.05% del límite de 21 millones (mis cálculos). El titular es correcto, con algo de letra pequeña.$BTCUSDT Cómo se compara. IBIT de BlackRock es el ETF más grande con unos 811,000 BTC según la instantánea de BitcoinTreasuries del 9 de noviembre, pero ese número coincide con una instantánea del 26 de octubre, e IBIT ha tenido salidas desde entonces. El gobierno de EE. UU. tiene alrededor de 328,000, y todos los gobiernos rastreados juntos unos 646,000. Strategy supera a cada uno de ellos. No supera a todos los ETFs spot de EE. UU. juntos, que tienen aproximadamente 1.3 millones de BTC (mis cálculos, basados en $95.9 mil millones en activos netos). Lo que encuentro más interesante que el ranking es cómo se mantiene. El costo promedio de Strategy es de $75,456. Con Bitcoin cerca de $74,800 al 9 y 10 de noviembre, está aproximadamente $550 millones abajo (mis cálculos). Cada movimiento de $1,000 en Bitcoin cambia eso en unos $850 millones. En el mínimo post-IPC cerca de $72,800, la pérdida en papel sería de unos $2.3 mil millones. La compra de la semana pasada fue de 1,036 BTC por $81.9 millones, a un promedio de $79,012. Eso ya está alrededor de un 5% por debajo del costo (mis cálculos). Y fue financiado mediante la venta de acciones de MSTR. En el mismo informe, $188.3 millones de las ganancias de la venta de acciones se destinaron a recomprar STRC, sus acciones preferentes. Eso es 2.3 veces el bitcoin que compró (mis cálculos). Así que el mayor poseedor no es un acaparador pasivo. Está financiado, gestiona activamente su propia estructura de capital, y vendió algo de bitcoin a principios de este año para financiar dividendos y recompras de STRC, según su informe del 3 de agosto. Mi opinión: "mayor poseedor" es cierto. "Poseedor más seguro" es una pregunta aparte. Estoy observando tres cosas. Bitcoin frente a $75,456. Si las compras semanales siguen viniendo de ventas de acciones. Y si las recompras de STRC siguen superando las compras de bitcoin. #BybitIAEvolucionando #La volatilidad del petróleo sigue las conversaciones de paz con Irán #Las nóminas de EE. UU. y las decisiones sobre tasas impulsan la semana macro #AnthropicIPOValuationTest #WSOT2026

🎯 كيف تعمل هذه اللعبة؟
توقع أسعار العملات الرقمية ونتائج الرياضة على اختيارك الرابح (ByPick): توقع مجانًا واربح مكافآت حقيقية. النقاط المجانية (CP): تحصل على نقاط "CP" مجانية عند التسجيل واستخدامها في التوقعات، وهي نقاط لا تحمل أي قيمة نقدية حقيقية ولا يمكن سحبها . · طريقة التوقع: تختار حدثاً معيناً وتضع توقعك (مثلاً: هل سيرتفع سعر عملة معينة؟). إذا كان توقعك صحيحاً، تربح المزيد من النقاط . · الترتيب والجوائز: يتم ترتيب المشاركين بناءً على عدد نقاط CP التي جمعوها خلال "الموسم". في نهاية الموسم، يتم توزيع جوائز حقيقية بالـ USDT على أصحاب المراكز الأعلى في لوحة الصدارة . #WSOT2026 #BybitAIEvolving #كشوف المرتبات الأمريكية وقرارات أسعار الفائدة تحرك الأسبوع الاقتصادي #مراقبة مؤشر أسعار المستهلك الأمريكي لشهر نوفمبر #تقلبات النفط تتبع محادثات السلام الإيرانية

2000 PKR Weekly: SEI, SUI, or DOGE? 🤔
My plan is to invest 2,000 PKR every week into one coin (DCA). Let's compare them based on current data: $SUIUSDT : · Current price is around 257 PKR. · Price is below key moving averages, and momentum is currently with the sellers. · However, major partnerships like Samsung Wallet are happening, which could pay off in the future. $SEIUSDT : · Current price is around 13.5 PKR. · Down 34% in the last 30 days. · One analyst suggests SEI has built a long base and could be preparing for a new rally. DOGE: · Price is around $0.068. · Whales have sold 750 million DOGE since Nov 3rd, putting pressure on the price. · It's a meme coin with no supply cap. My View: If you are looking to invest for the long term (1-2 years), SUI and SEI look like more solid projects. SUI has a strong ecosystem, and SEI might be preparing for a big rally. DOGE carries more risk right now since whales are selling and it lacks utility. My suggestion: Split the 2,000 PKR between SUI and SEI (1,000 each) to manage your risk. Which coin are you investing in? #USInflationRunsHotAndRateHikeBetsRise #BitcoinHitsTwoMonthLowAfterUSMidterms #BybitAIEvolving #OilVolatilityTracksIranPeaceTalks #USPayrollsAndRateDecisionsDriveMacroWeek
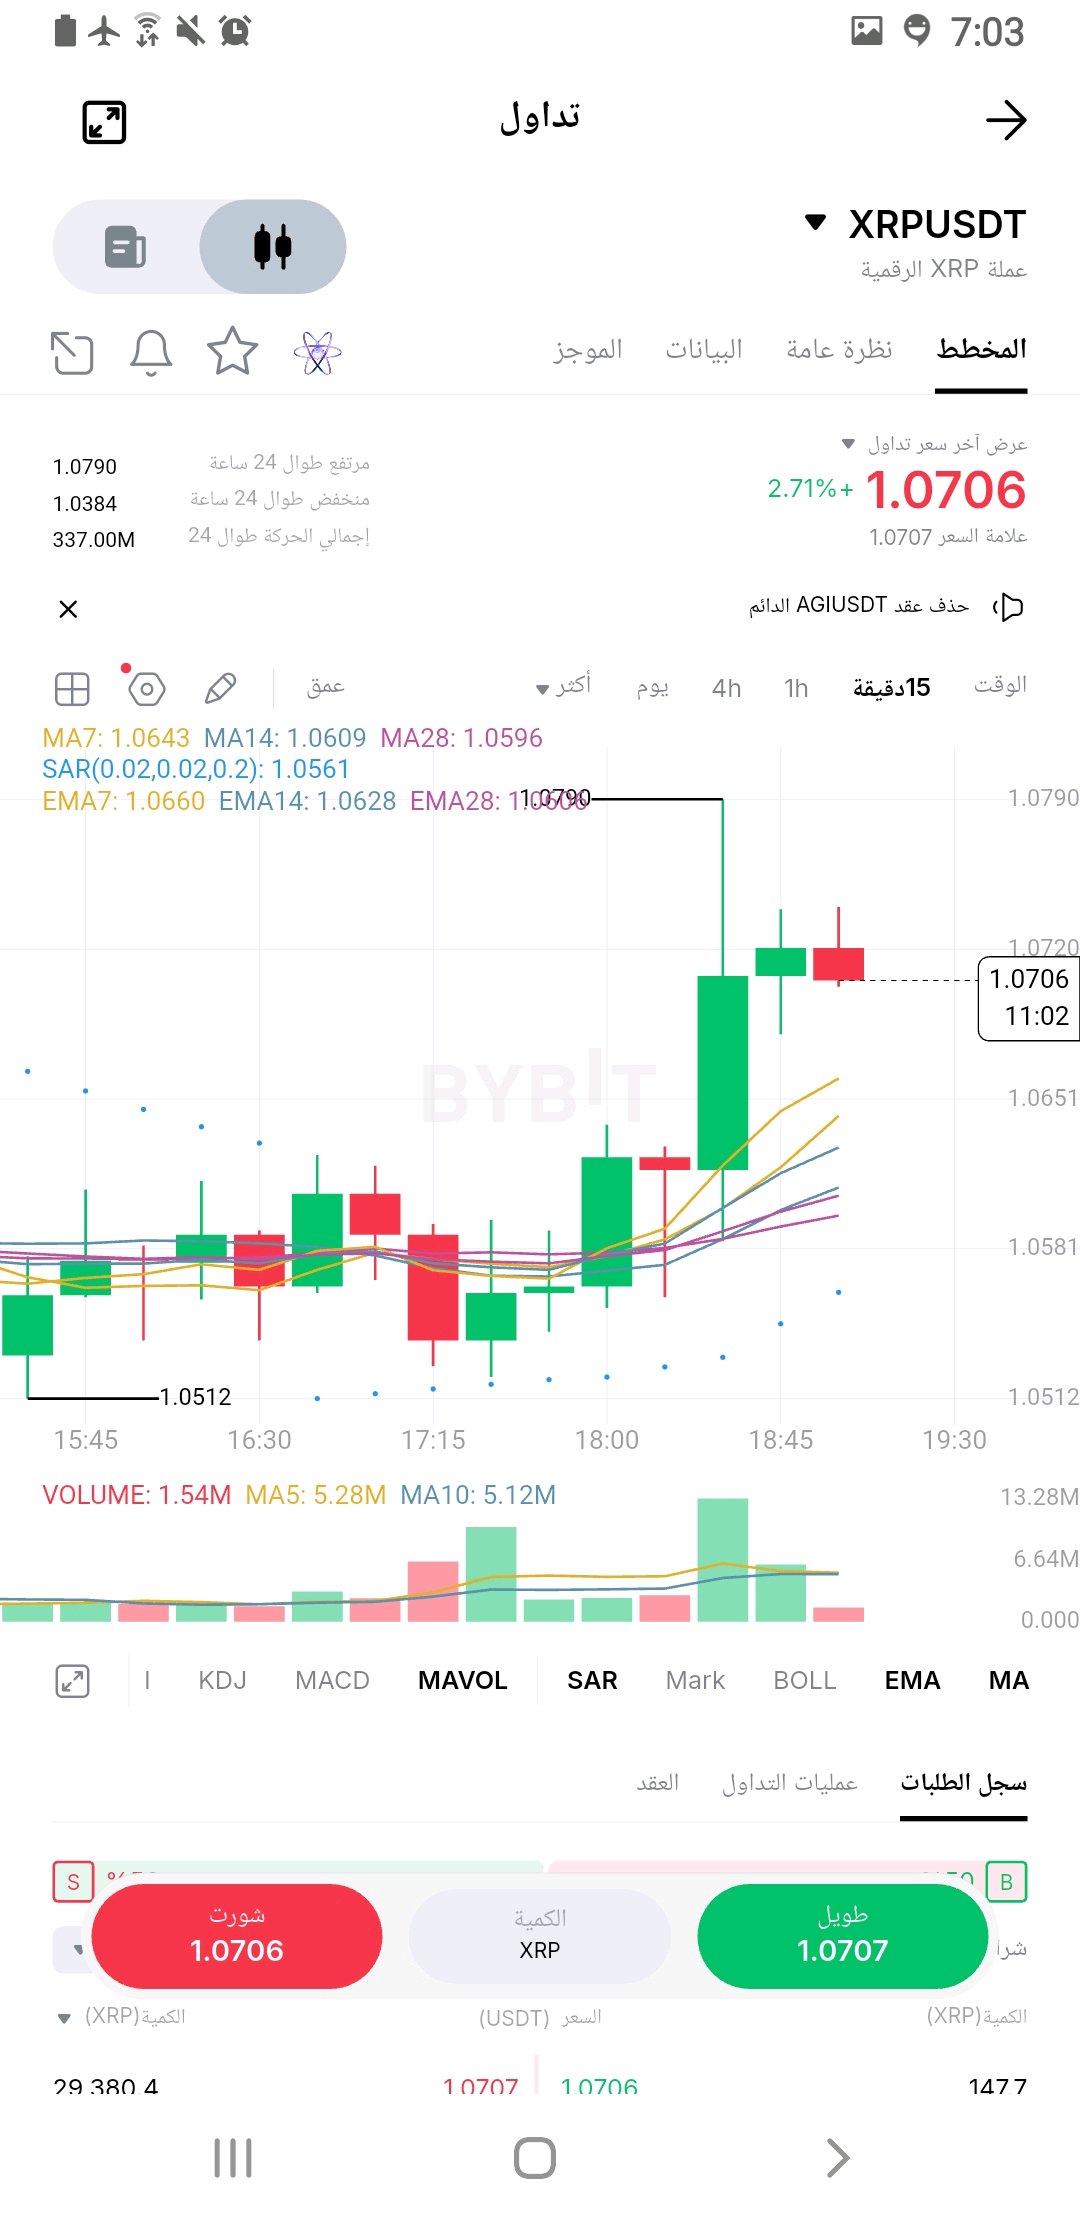
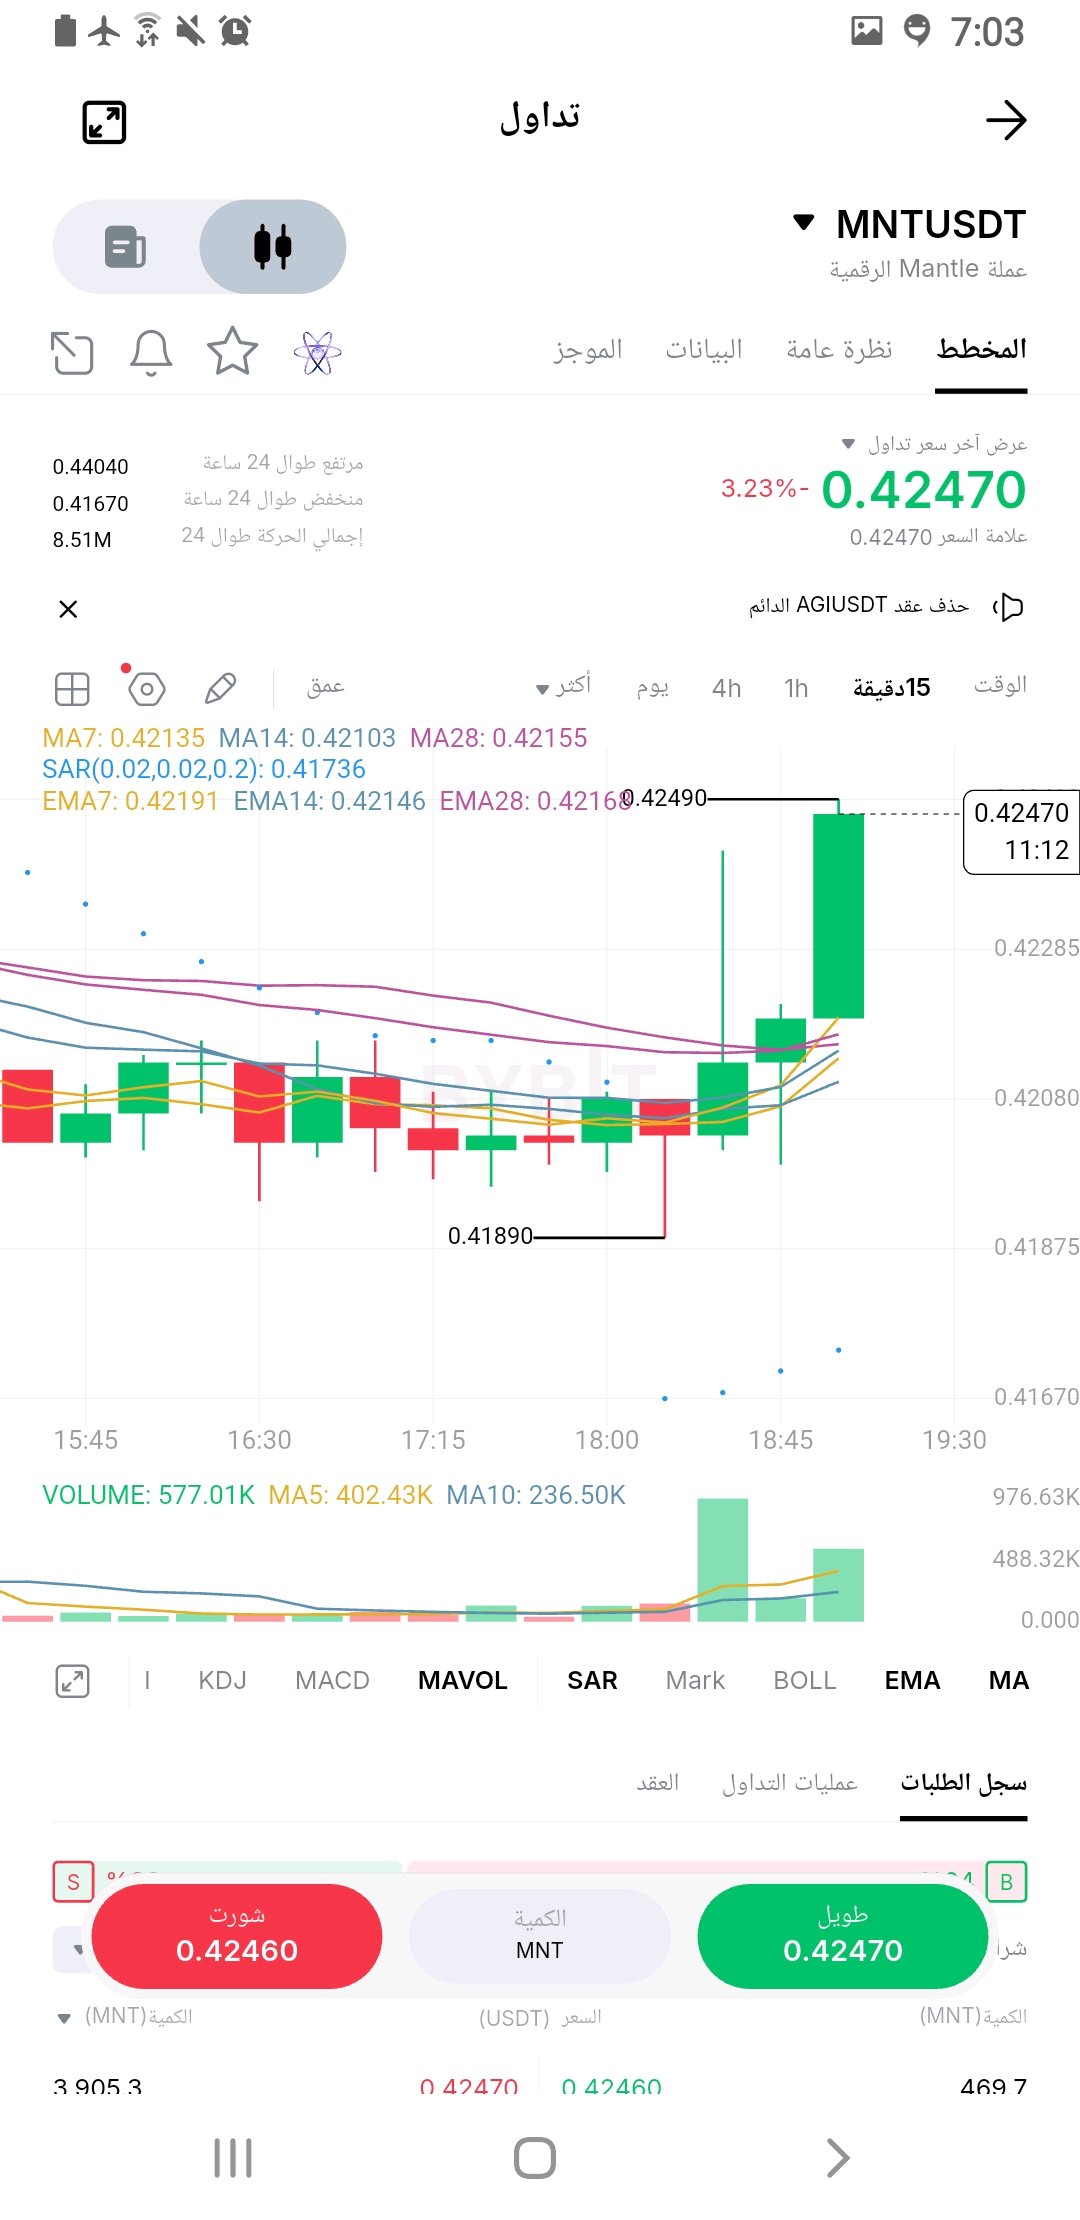
#ByXIMPACT XRP: Shows clear buying power and a tendency to continue the upward trend. MNT: Shows an attempted pullback/reversal from a low, but needs the price to stabilize above the current resistance to confirm the trend change. Trading on the 15-minute timeframe is considered scalping and is risky; it is always preferable to place strict stop-loss orders below the mentioned support levels. Short-term Bullish. · Price Action: We observe a very strong rebound from the local bottom at 1.0512. The price experienced a sudden breakout via a massive green candle that surpassed all moving averages, reaching a high peak of 1.0790 before beginning the current minor correction. · Technical Indicators: · Moving Averages (EMA/MA): The current price is above all moving averages (EMA7, EMA14, EMA28), and the averages have begun to cross positively (Golden Cross), supporting the upside. · Parabolic SAR (Blue Dots): The dots appeared below the candles following the breakout, which is a clear bullish signal. · Trading Volume: There is massive buying liquidity clearly visible in the large green breakout candle. · Key Levels: · Current Resistance: 1.0790 (highest point reached recently). · First Support: The 1.0640 - 1.0660 zone (where short moving averages are concentrated). · Analysis: The coin is in a state of strong positive momentum. The current correction (small red candle) is normal for profit-taking. If the price maintains its position above the 1.0600 level, it is likely to resume its upward movement to retest 1.0790. 📉 Second: Mantle (MNTUSDT) Analysis - Second Image · Current Price: $0.42470 (down -3.23%). · General Trend: Medium-term bearish, with a recent attempt at a rebound. · Price Action: The coin was in a clear downward path, reaching a low at 0.41890. Recently (on the chart), a very strong green candle appeared, breaking upward through the moving averages and reaching the 0.42490 level. · Technical Indicators: · Moving Averages (EMA/MA): The current price has managed to break through the moving averages, marking the first positive sign after the wave of decline. · Parabolic SAR: Blue dots have started appearing below the candles, giving a potential bullish reversal signal. · Trading Volume: We observe a significant increase in trading volumes accompanying the latest green candle, lending credibility to the rebound. · Key Levels: · Near Resistance: 0.42490 (current peak). Breaking this level is necessary for continued upward movement. · Strong Support: 0.41890 (previous low). · Analysis: Although the general trend remains bearish (as shown at the top of the chart with a previous high of 0.44040), the latest green candle is very strong and indicates buying interest at the bottoms. There is a state of anticipation; either the price continues upward to confirm the reversal, or it pulls back downward to retest the support once more. #WSOT2026 #BybitAIEvolving #تقلبات النفط تتبع محادثات السلام الإيرانية #كشوف المرتبات الأمريكية وقرارات أسعار الفائدة تحرك الأسبوع الاقتصادي $XRPUSDT $MNTUSDT
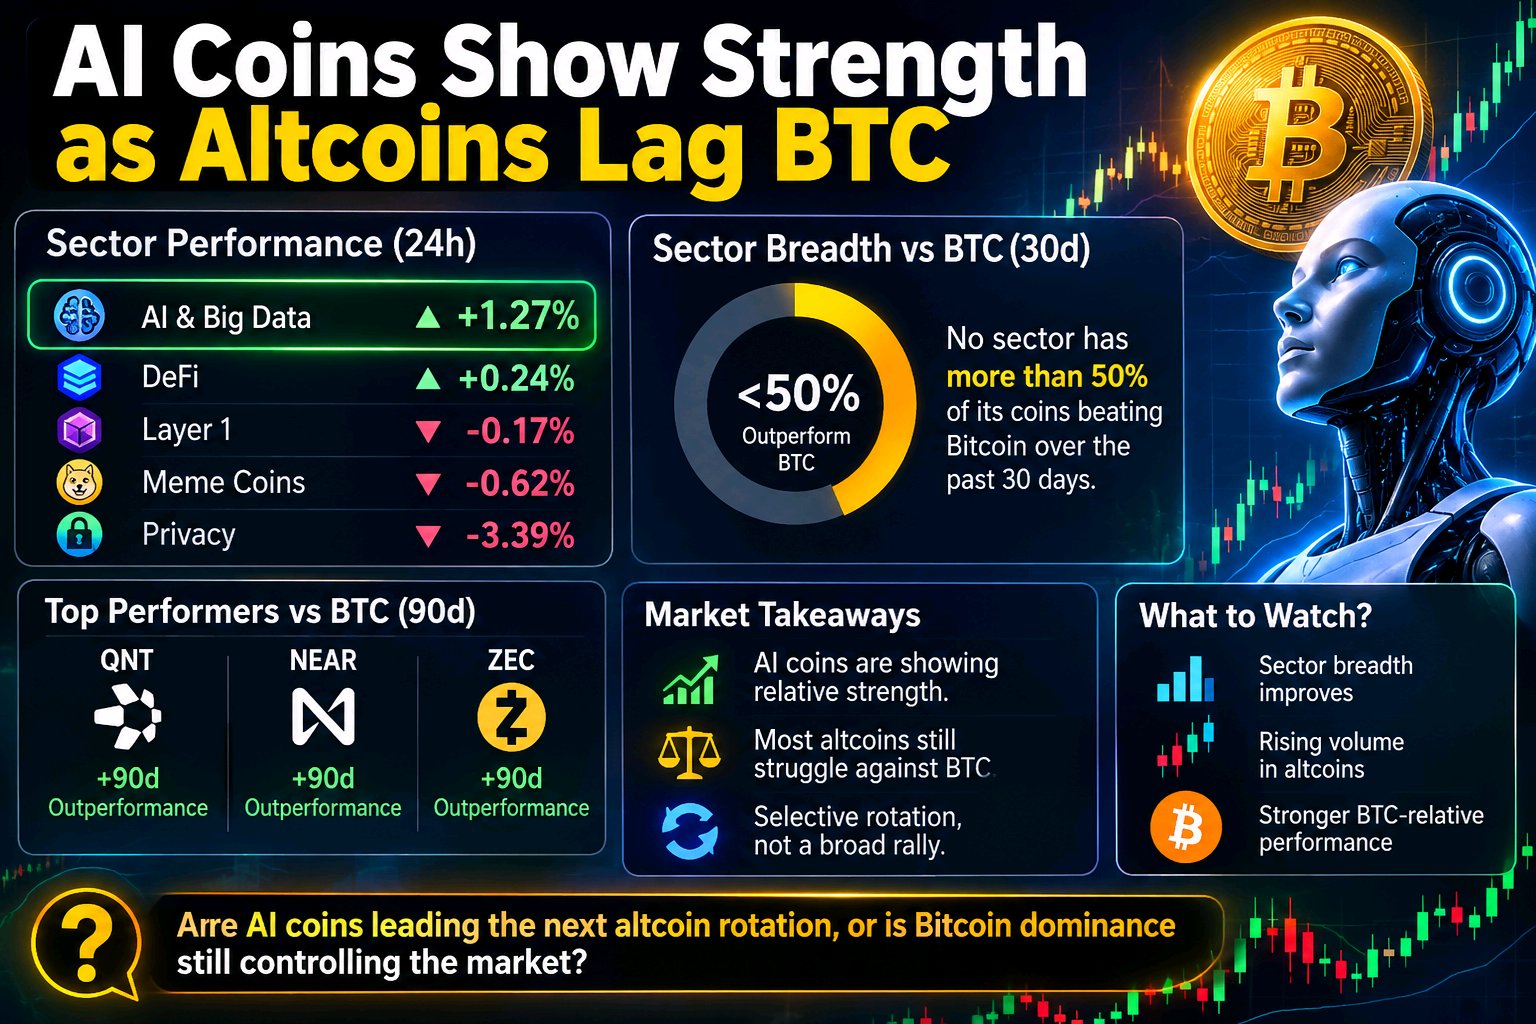
AI Coins Show Strength as Altcoins Lag BTC
$BTCUSDT The altcoin market is showing an interesting split, and smart traders should pay attention. As of November 11, AI & Big Data is showing relative strength, with approximately 1.27% gains over 24 hours. Meanwhile, Privacy coins are facing pressure, declining around 3.39%. **Top performers to watch:** QNT, NEAR and ZEC have demonstrated notable outperformance against Bitcoin over the past 90 days. **The overlooked detail:** Despite individual winners, no tracked altcoin sector currently has more than 50% of its coins outperforming BTC over the 30-day period. This suggests capital is rotating selectively rather than entering the entire altcoin market. If sector breadth improves alongside rising volume and stronger BTC-relative performance, the rotation could become more convincing. **Are AI coins leading the next altcoin rotation, or is Bitcoin dominance still controlling the market?** #BybitAIEvolving #USPayrollsAndRateDecisionsDriveMacroWeek

$ETH: Bears Are Pressuring the Market, But
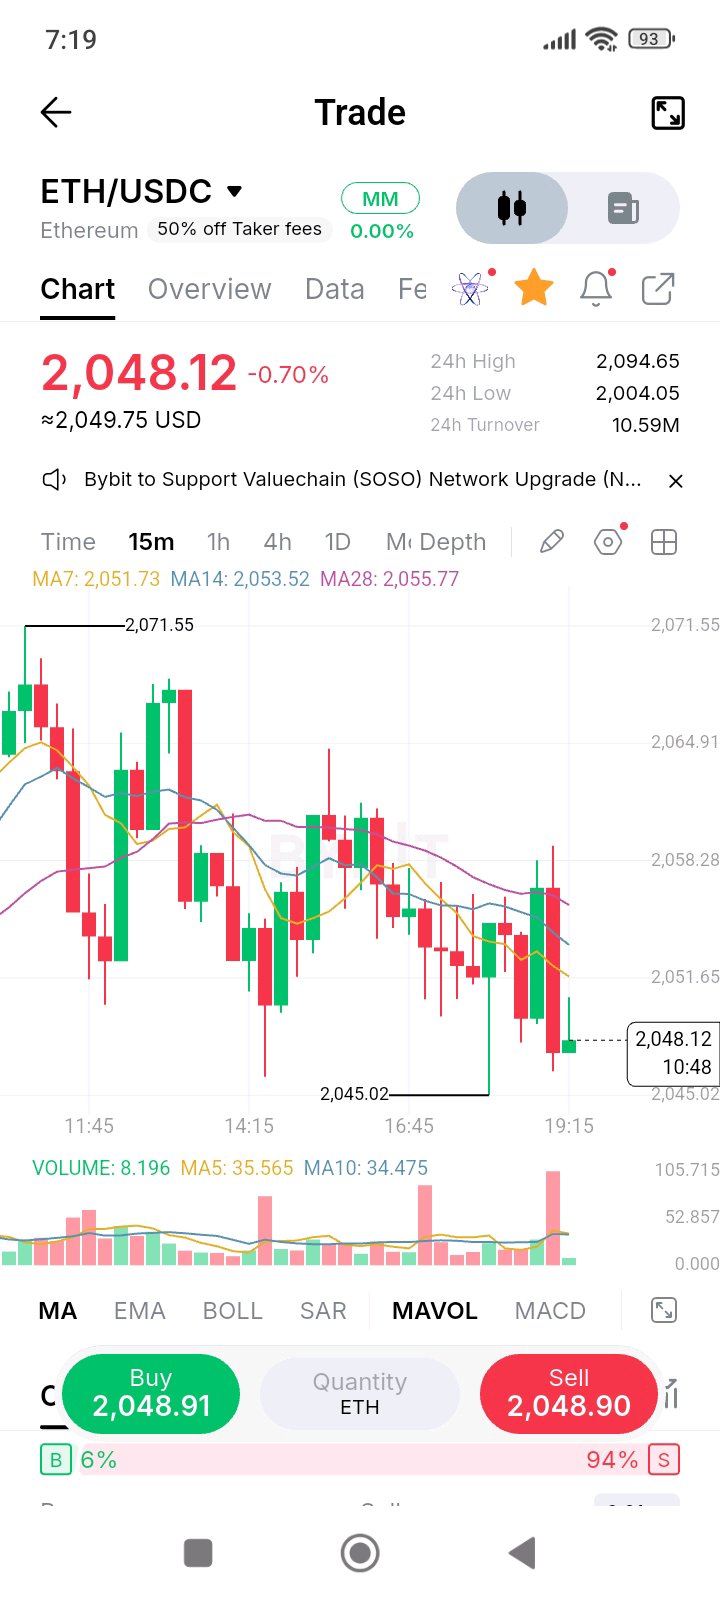
I’ve been watching Ethereum closely, and this latest move is a reminder that the market can turn aggressive when buyers lose control. ETH is trading around $2,048 after struggling to maintain momentum near the $2,071 zone. Now the price is testing an important area where bulls need to show some strength. 📊 The 15-minute chart is currently leaning bearish. ETH is trading below MA7 ($2,051.73), MA14 ($2,053.52), and MA28 ($2,055.77). All three moving averages are sitting overhead, creating resistance for any recovery attempt. The recent low around $2,045.02 is the immediate level I'm watching. If sellers break it decisively, downside pressure could increase. However, a strong bounce followed by a reclaim of $2,055 could change the short-term picture. 🐋 I don't have confirmed whale-flow data here, so I'm watching price and volume rather than guessing what large players are doing. 🎯 Key levels: - Support: $2,045 - Resistance: $2,055 - Breakout: $2,058 - Next target: $2,065 - Major upside level: $2,071 🔥 I'm not interested in blindly chasing a green candle. ETH needs buying strength and volume confirmation before I trust a reversal. I've been following every move with this community, and I'm still watching. Will ETH defend $2,045 and fight back, or are sellers preparing another breakdown? 👀 #BitcoinHitsTwoMonthLowAfterUSMidterms #DeutscheBankLaunchesDigitalAssetCustody #USPayrollsAndRateDecisionsDriveMacroWeek
Where is NEAR's money going? 🤔
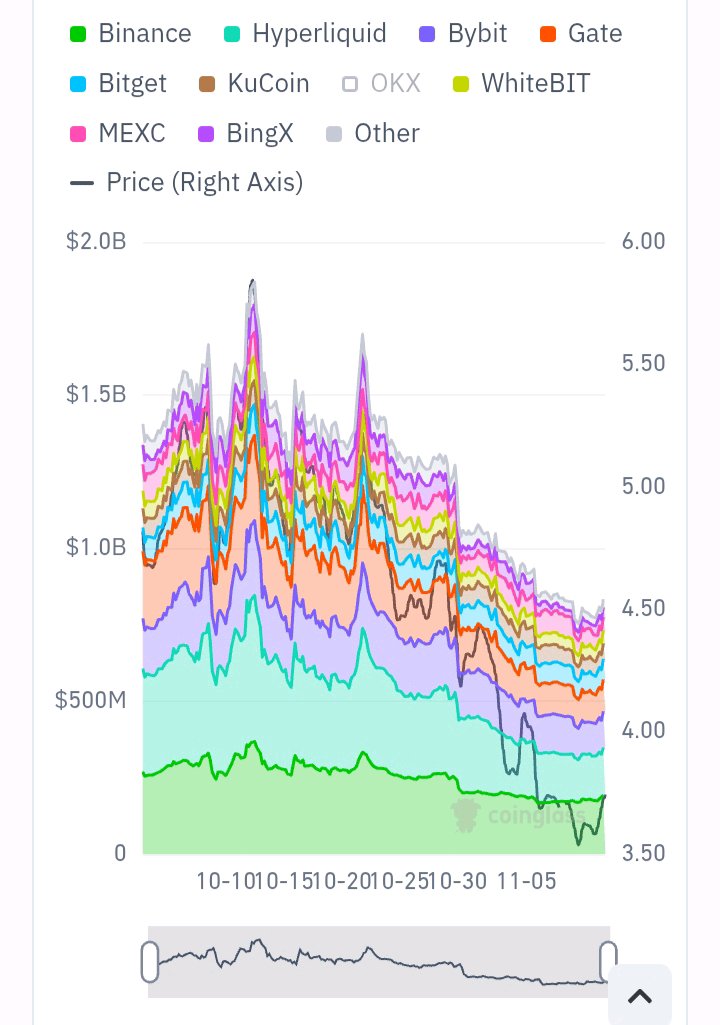
$NEARUSDT Look at this Open Interest (OI) chart for NEAR: · Total OI: Dropped heavily from over $2.0B to the $500M-$700M zone. · The Trend: A massive decline across all platforms. Big players are closing their positions. What does this mean? When OI and Price drop together, it means leverage is leaving the NEAR market. Traders are avoiding new risk right now. What do you think? When will liquidity return to NEAR? #USInflationRunsHotAndRateHikeBetsRise #BybitAIEvolving #OilVolatilityTracksIranPeaceTalks #USPayrollsAndRateDecisionsDriveMacroWeek #BitcoinHitsTwoMonthLowAfterUSMidterms $ETHUSDT

BTC is bleeding, but BMT is printing. 🚀
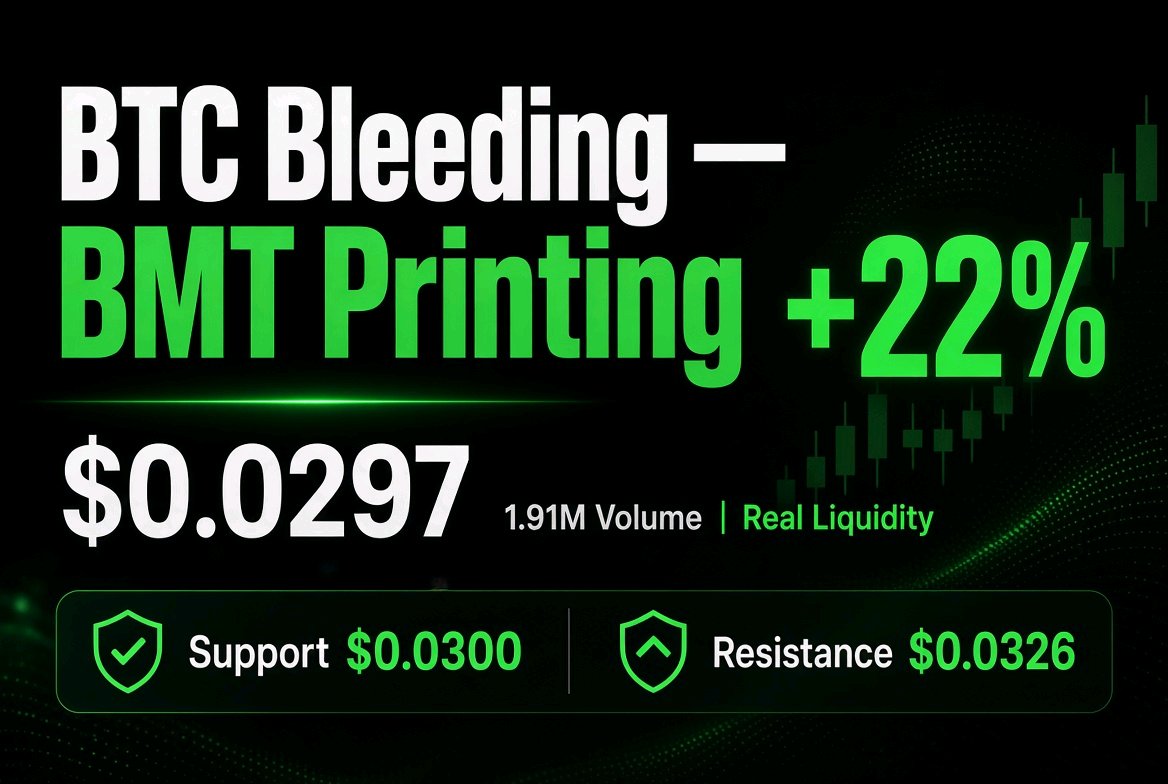
Here is the setup. ⚡ The whole market is red today. $BTCUSDT is fighting to hold $73,600, and ETH is sitting near $2,058 . But while the majors chop, BMT is quietly building strength on the Bybit board. Why $BMTUSDT ? Look at the data. It is up over 22% to $0.0297, and the turnover is a massive 1.91M. That is real liquidity, not an empty order book pump. On-chain, the top 100 wallets hold around 45% of the supply, and the new Intel Desk launch is adding real utility to the token . The Levels: Resistance sits at $0.0326. A clean break here opens the door for the next leg up. Support is the MA cluster around $0.0300. As long as buyers defend this floor, the structure stays intact . While the market hunts for a bottom, BMT is showing relative strength. Are you watching this one today? 👇 #NovUSCPIWatch #USPayrollsAndRateDecisionsDriveMacroWeek #OilVolatilityTracksIranPeaceTalks #BybitAIEvolving #BOERateDecision

BITCOIN
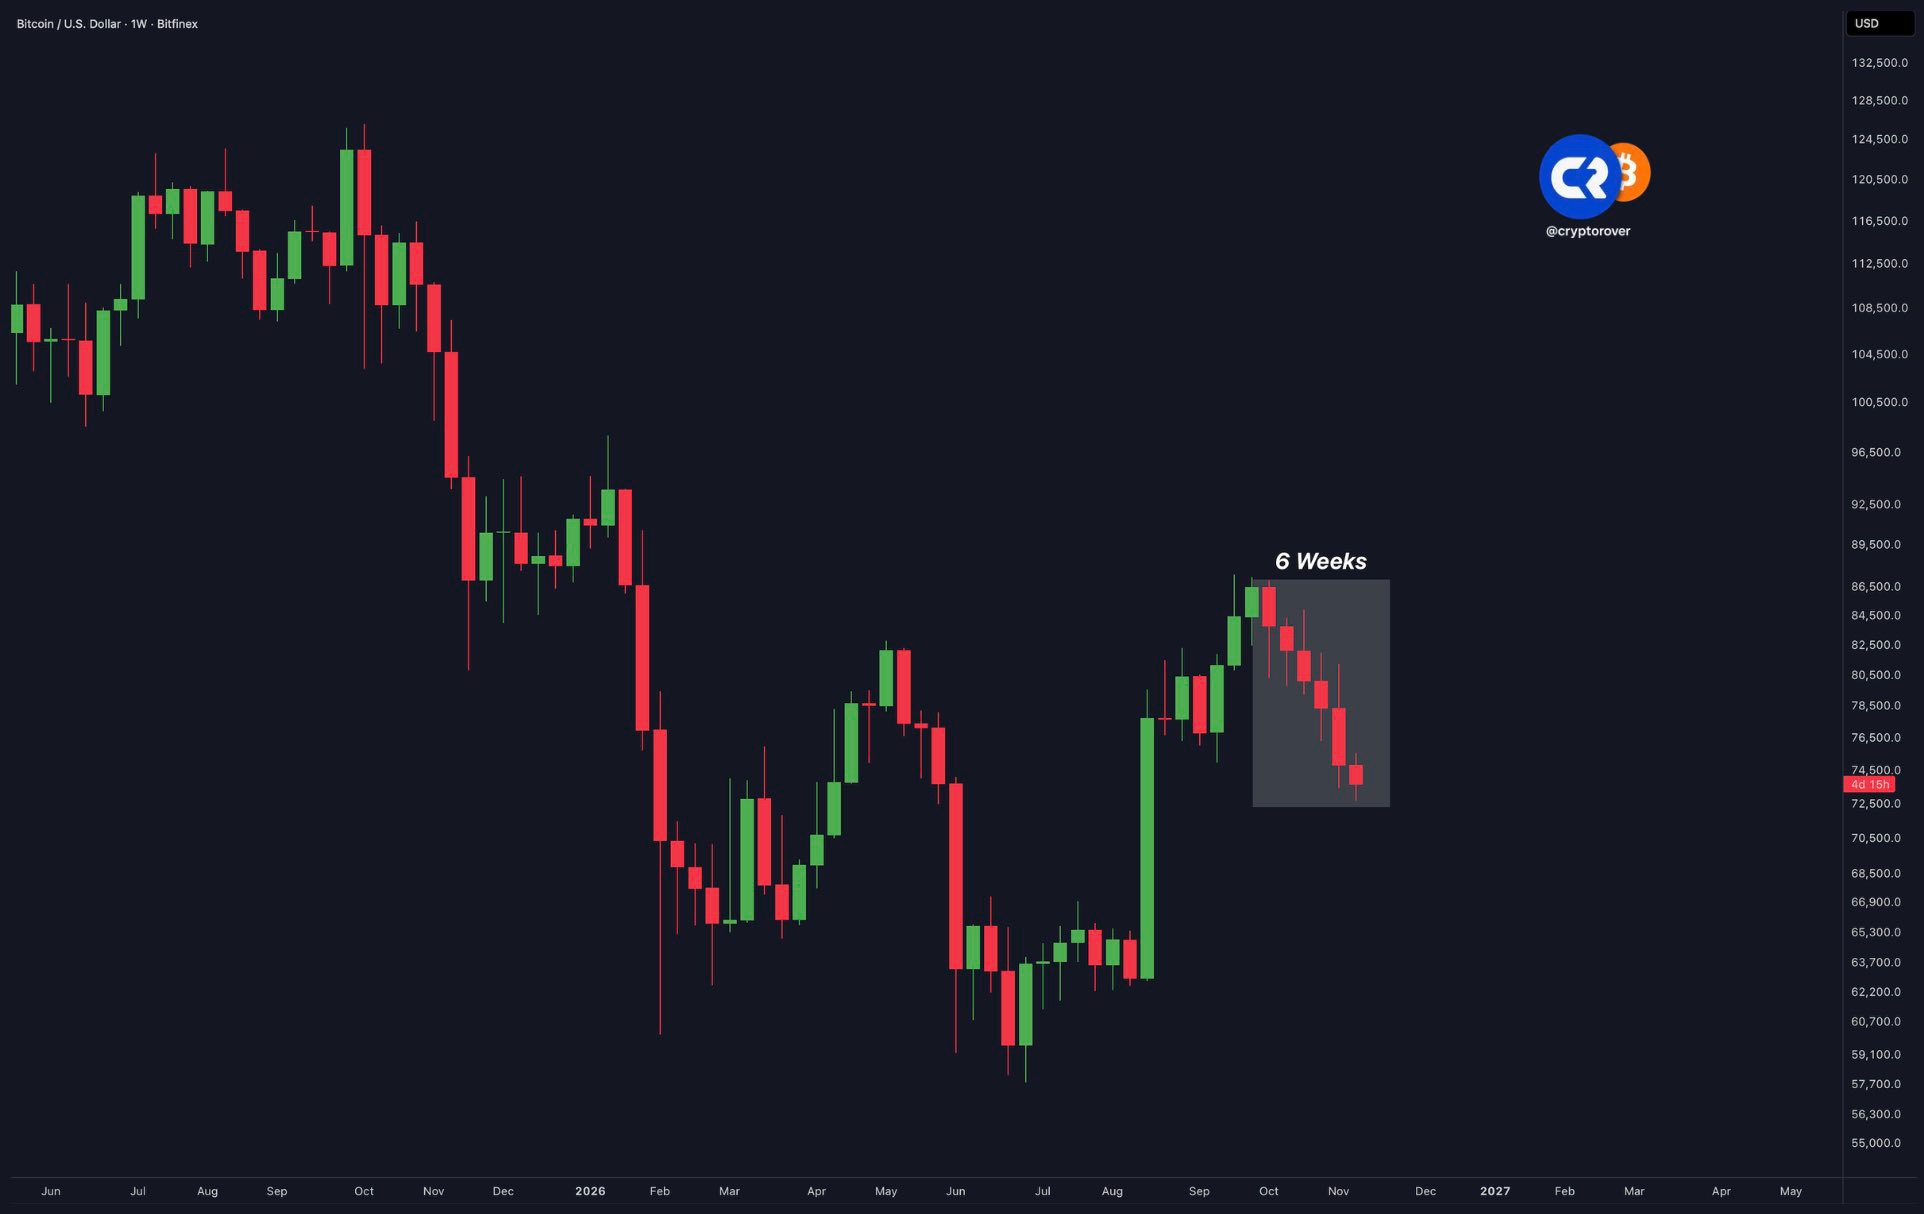
#USPayrollsAndRateDecisionsDriveMacroWeek 🔴 Bitcoin is about to close 6 RED weeks in a row. Bitcoin is experiencing one of the longest losing streaks in its history... Could this mean the longest winning streak in history is coming next? #WSOT2026 #WSOTPicktoEarn10U #OilVolatilityTracksIranPeaceTalks #NovUSCPIWatch
Trading
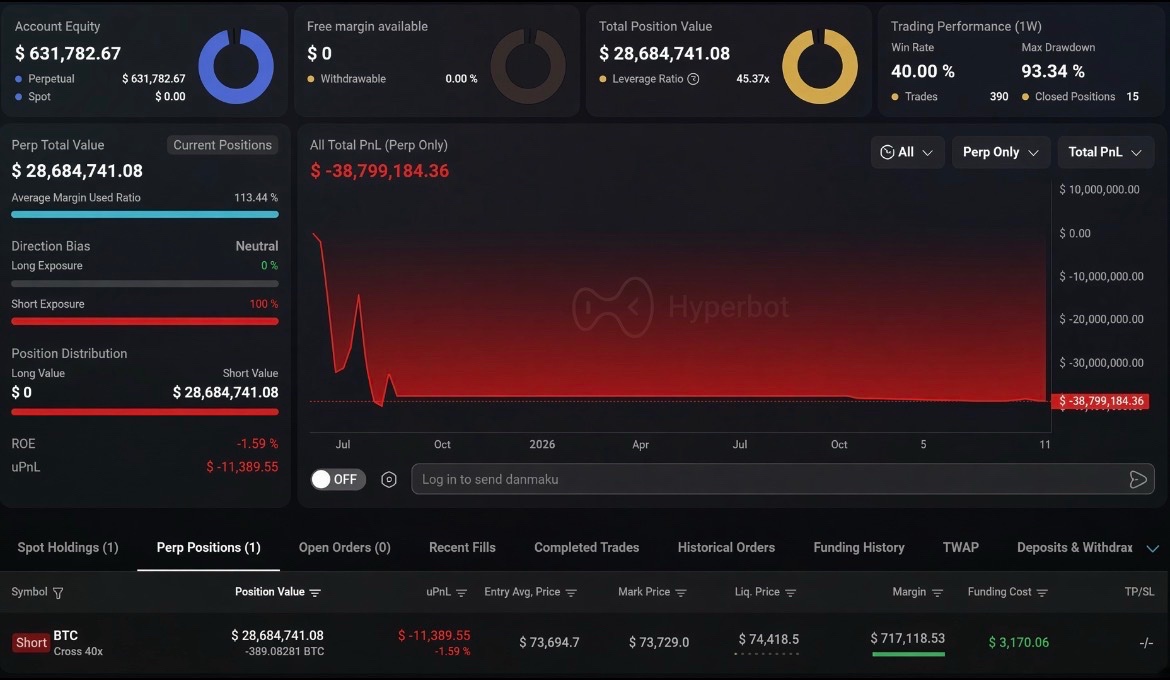
Someone just opened a 40x $BTC short worth ~$30M. His all-time PnL: -$38.8M When people start gambling on the last bit of downside, you know it’s time to go long #WSOT2026 #WSOTPicktoEarn10U #NovUSCPIWatch #USPayrollsAndRateDecisionsDriveMacroWeek #BybitAIEvolving