Seguridad en Blockchain
Aprende cómo proteger tus criptoactivos con hábitos prácticos de seguridad: activa la autenticación de dos factores, usa contraseñas únicas, habilita listas blancas de direcciones de retiro y códigos antifishing, revisa regularmente las aprobaciones de tu billetera, evita enlaces y firmas desconocidas y guarda tus inversiones a largo plazo en una billetera segura. Mantente atento a hacks, estafas y transacciones no autorizadas.

🔐 Secure Your Crypto!
We spend hours analyzing charts and finding opportunities, but how often do we protect what we already own? One careless click can cost everything. Here are 6 essential security habits: 🔸 Enable 2FA for extra protection. 🔸 Use strong, unique passwords. 🔸 Activate withdrawal whitelists. 🔸 Set up anti-phishing codes. 🔸 Review wallet approvals regularly. 🔸 Store long-term assets in secure wallets. Remember, protecting your crypto is just as important as growing it. Protect your assets before chasing profits. 🔐 What's your most important crypto security habit? #BlockchainSecurity $BTCUSDT $XRPUSDT



World Liberty Financial is turning to token buybacks after a difficult period for its governance token. The announcement arrived as $WLFIUSDT faced renewed selling pressure following the US midterm elections, exposing how closely the project's market sentiment remains connected to political developments. But a buyback announcement alone cannot reverse a prolonged decline. Investors still need to know how much capital will enter the market, how purchases will be executed and whether the programme creates lasting demand. On November 6, World Liberty Financial announced that it was launching a buyback programme funded through an initial allocation that may include fees generated from reserves backing its USD1 stablecoin and other sources. The stated objective is to encourage governance participation and increase the voting power of long-term holders. The project also described buybacks as an ongoing part of its strategy, with the pace and scale depending on ecosystem growth and participation. The missing details are important. World Liberty has not disclosed the initial funding allocation, a purchase schedule or a specific amount of WLFI it intends to acquire. Without those figures, the market cannot estimate the programme's potential buying pressure. There is also a distinction between buying tokens and burning them. A purchase does not automatically remove tokens from circulation; that depends on what happens to the acquired supply afterwards. WLFI's market performance explains why the announcement attracted attention. Reuters reported on November 6 that the token had fallen approximately 10% following the election results and more than 60% since the beginning of 2026. Around 32% of its maximum supply of 100 billion tokens was reportedly in circulation. This means future supply releases remain relevant even if the buyback programme creates additional demand. The proposed funding source introduces another variable. If income from USD1 reserves contributes meaningfully to purchases, the relationship between stablecoin adoption and WLFI demand becomes more direct. Greater USD1 activity could potentially generate more revenue for the programme. However, the company has not disclosed how much of the funding will come from reserve income, so the scale of that relationship remains uncertain. Governance is equally important. WLFI voting power is linked to token holdings, meaning buybacks could increase the relative influence of holders who retain their tokens. That may encourage longer-term participation, but it also raises questions about how concentrated voting power could become. The programme should therefore be assessed not only by its effect on price, but also by its transparency and impact on governance. For WLFI, the next meaningful evidence will be actual on-chain purchases, disclosed funding and clear reporting on the treatment of acquired tokens. Until those details emerge, the announcement is a proposed source of support rather than proof that selling pressure has been absorbed. Key questions: 1. Can WLFI buybacks create sustained demand after a decline of more than 60%? 2. Will USD1 reserve income provide meaningful and consistent funding? 3. Could concentrating voting power among long-term holders weaken governance participation? #BlockchainSecurity

Greece Approves New Crypto Tax Rules for Investors
Crypto regulations in Europe keep moving forward. Greece's parliament has officially approved a new crypto tax framework. Now, if you trade crypto or earn income through DeFi in Greece, you need to understand the new tax rules. Let's break down what is happening. 10% Tax on Crypto Gains Greece has approved a 10% tax on cryptocurrency investment gains. But there is some relief for smaller investors. Annual crypto gains of up to €500 will remain tax-free. This means that if you make profits from crypto investments, you will need to consider this exemption when calculating your taxes. 15% Tax on DeFi Income There is also an important update for DeFi users. Income earned through staking, crypto lending and liquidity pools will face a 15% tax. This means that taxes will not only apply to trading profits but also to income earned by using crypto assets on DeFi platforms. Investors will need to include this extra cost when calculating their actual returns. 12 Months to Declare Previous Gains There is some relief for investors here. People who have not declared their previous crypto gains will get 12 months to report eligible past gains. Those who declare within this period may avoid late-filing penalties and interest, subject to the applicable conditions. What About Crypto-to-Crypto Swaps? There is still one important question that needs a clear answer. If an investor converts Bitcoin into Ethereum or swaps one cryptocurrency for another, how will the tax apply to that transaction? We will have to wait for the final implementation guidelines to understand this properly. My Take Greece's decision shows that crypto regulations in Europe are getting closer to traditional financial rules. Investors will now need to look beyond entry prices, exit prices and trading fees. Tax rules are also becoming an important part of managing a crypto portfolio. But the real test will be how these rules are implemented. It will be interesting to see how the new framework affects crypto investors and DeFi users. What do you think? Will taxing crypto profits make the market more regulated, or could it push investors away from crypto trading and DeFi? #ByXIMPACT #WSOT2026 #BybitAIEvolving #BlockchainSecurity


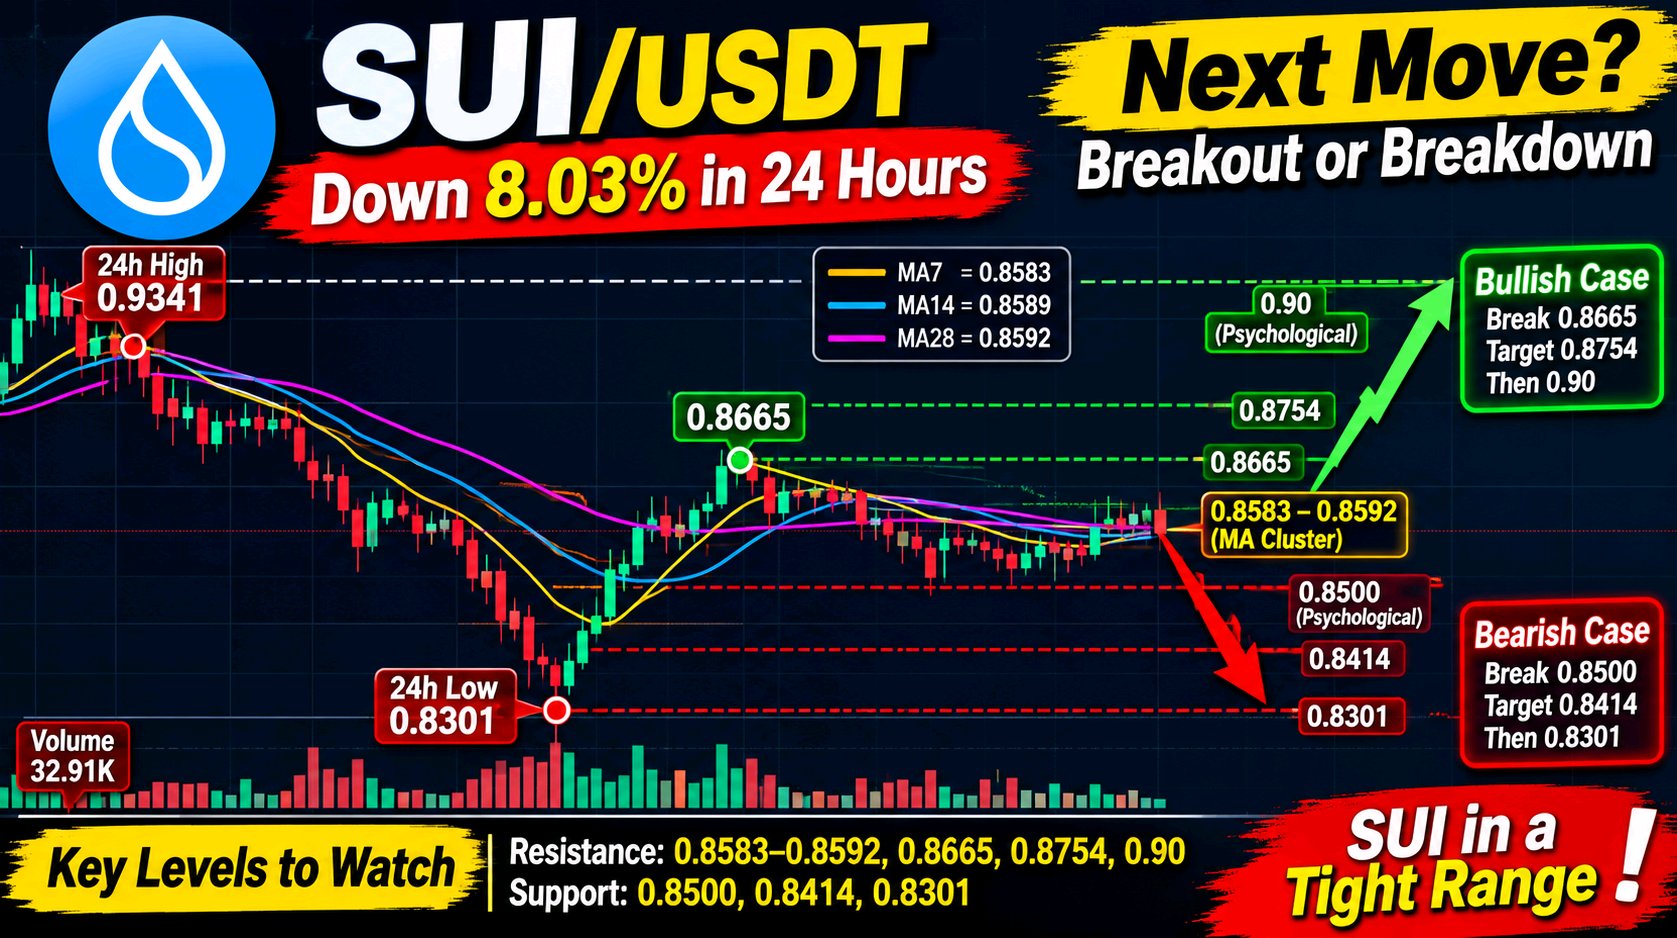
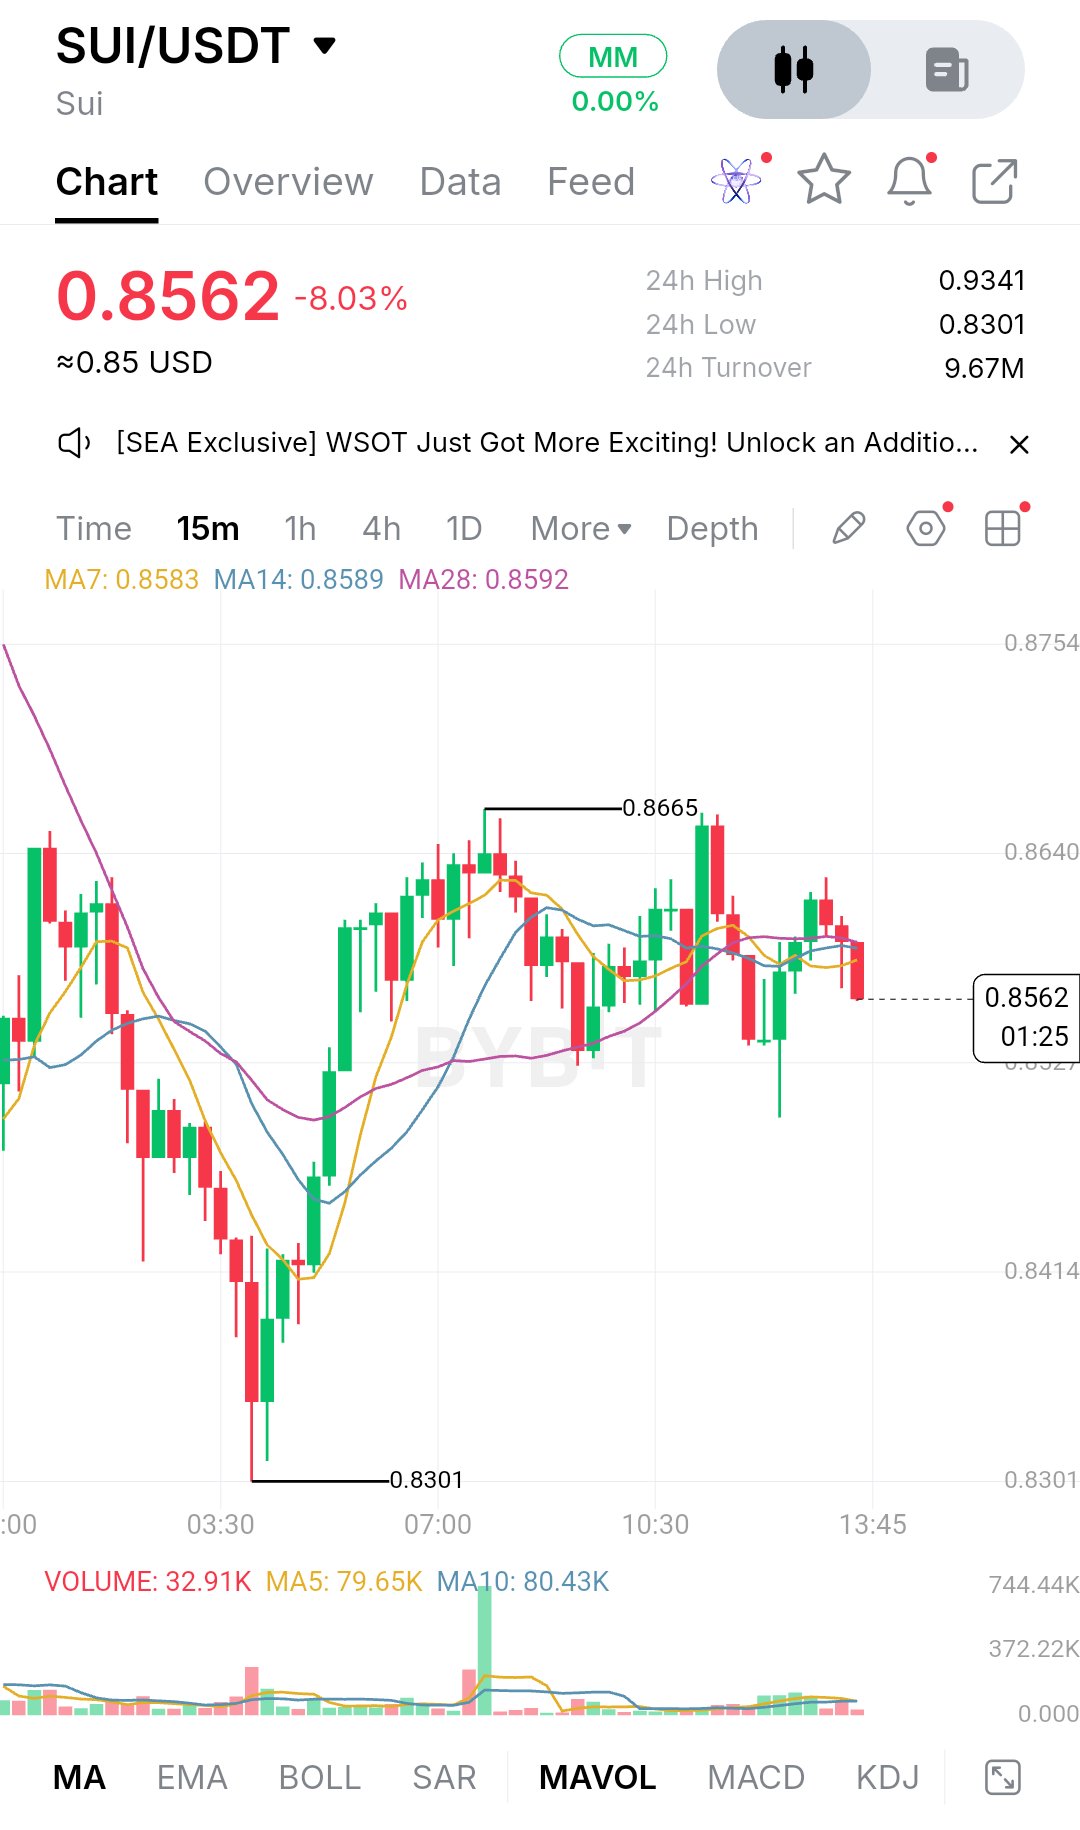
$SUIUSDT is trading at 0.8562, down 8.03% over the last 24 hours. The day began with buyers pushing price as high as 0.9341, but that strength didn't hold, and sellers took control from there. The slide ended at 0.8301, which is where the real damage stopped. That low was marked by a long wick, a sign that dip buyers showed up aggressively once price got there. Since then the chart has told a more cautious story. Price bounced hard from 0.8301, climbed back to a local high of 0.8665 around 07:15, and has spent the hours since moving sideways with a slightly heavier tone. The recovery was clean, but it never turned into a full reversal. Rallies keep stalling in the same area, and each push up is being sold into. The structure right now is a tight range sitting inside a larger downtrend. After a fast flush and a sharp rebound, the market is digesting. The candles are getting smaller, wicks are showing up on both sides, and price keeps rotating around the same band. That is classic consolidation, but the direction of the earlier move matters. Until buyers prove otherwise, this reads more like a pause than a bottom. On the moving averages, MA7 sits at 0.8583, MA14 at 0.8589 and MA28 at 0.8592, all bunched together right above the current price. When they compress like this, it usually means momentum has gone flat. Price is now trading slightly under all three, which turns that cluster into overhead resistance rather than support. The most recent candles are red and closing below the group, so short-term control leans toward sellers for the moment. Volume adds some context. The biggest spike of the session came during the push toward 0.8665, which is where buyers made their strongest attempt and where sellers answered. Since then activity has dried up. The latest volume reading is 32.91K against MA5 at 79.65K and MA10 at 80.43K, so current participation is well below recent averages. Low volume in a range tells you neither side is convinced, and it often comes before a larger move once one side commits. The first support to watch is the 0.8500 area, a round number sitting just below current price, and the level most likely to be tested next if sellers keep pressing. Below that, the 0.8414 zone on the chart's price axis is the next reference point. The big one is 0.8301, the session low and the spot where the rebound began. If price comes back there and holds again, buyers will have defended it twice, which strengthens the range. A clean break below with strong volume would be a different story. It would erase the entire recovery and open the door to fresh lows, because there is no obvious structure beneath it on this chart. On the upside, the immediate resistance is the moving average cluster around 0.8583 to 0.8592. Above that sits 0.8640, a level the chart has reacted to before, followed by the swing high at 0.8665. A move through that high would be the first real sign of strength. Beyond it, 0.8754 is the top of the visible range and the next logical target, and the 0.90 psychological zone sits higher still, with the 24-hour high of 0.9341 as the major ceiling for the day. For the bullish case, buyers first need to reclaim the moving average cluster and hold above it on closing candles. After that, they need to take out 0.8665 with rising volume, not the thin participation we have now. If that happens, 0.8754 becomes a realistic next stop, and a sustained hold above it would put 0.90 back in play. The key is follow-through. A breakout on weak volume has a much higher chance of fading. The bearish case is simpler. If price keeps getting rejected under 0.8590 and prints lower highs, sellers stay in control. That likely brings 0.8500 into play first, then 0.8414. If those give way, a retest of 0.8301 becomes likely, and a close below it would confirm that the earlier bounce was just a relief move inside a larger decline. Key price levels: - Resistance: 0.8583 to 0.8592 (MA cluster), 0.8640, 0.8665 (swing high), 0.8754, 0.90 (psychological), 0.9341 (24h high) - Support: 0.8500 (psychological), 0.8414, 0.8301 (24h low) - Current price: 0.8562 Overall, SUI is sitting in a compressed range after a sharp drop and a strong bounce, with price pinned just beneath a flat cluster of moving averages and volume fading. That combination usually does not last long. The next meaningful move will likely come from either a volume-backed break above 0.8665 or a decisive loss of 0.8500 and then 0.8301. Rather than guessing direction, it makes more sense to watch how price reacts at those edges, because the quality of that reaction will say a lot about whether the next expansion is a recovery or a continuation lower. This is not financial advice, so manage your risk accordingly. #BlockchainSecurity $ETHUSDT

Binance and CZ have subpoenaed Kevin O'Leary in the ongoing $1.76 billion FTX lawsuit. ₿ $BTC The legal battle centres on a 2021 deal in which FTX repurchased Binance's ownership stake. Bankruptcy administrators allege that the transaction was funded using misappropriated customer assets. Binance and CZ have denied wrongdoing and attempted to dismiss the lawsuit, arguing that responsibility for FTX's collapse lies with Sam Bankman-Fried. A US bankruptcy judge ruled in July that the $1.76 billion recovery claim could proceed, keeping the dispute alive. $BTCUSDT #USPayrollsAndRateDecisionsDriveMacroWeek #BlockchainSecurity #BybitAIEvolving #OilVolatilityTracksIranPeaceTalks #ByXIMPACT



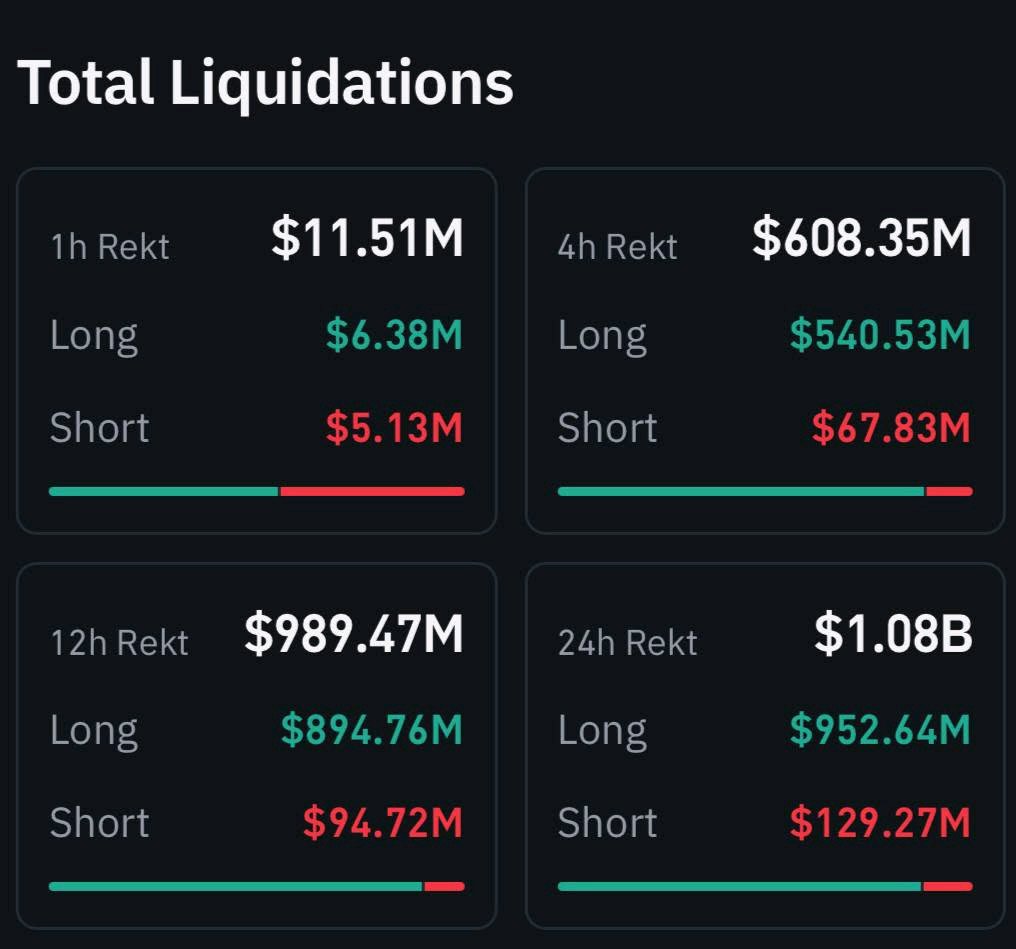
What on earth is happening in the financial markets right now ? honestly, this is becoming one of the most difficult periods to navigate, not just for stock investors but for crypto traders as well. The combination of political uncertainty, Trump's influence over government decisions, shifting economic expectations and growing market anxiety is creating an environment where confidence can disappear incredibly fast. And the consequences are showing up everywhere. Stocks and Crypto Are Feeling the Pressure what concerns me most is how quickly sentiment has changed. Investors who were comfortable holding risk asets are suddenly becoming more defensive. When uncertainty increases around government policy, trade decisions, economic direction, and interest rates, traditional markets can react aggressively. The stock market is particularly sensitive to these developments because large companies depend on stable economic conditions, predictable policies, and investor confidence. But crypto is not isolated from that environment. Bitcoin and the broader cryptocurrency market are still heavily influenced by global liquidity and overall risk appetite. When investors start reducing exposure to risky assets, crypto often feels the pressure alongside technology stocks and other growth-oriented investments. That is why we can see selling pressure across multiple markets at the same time. $1 BILLION+ LIQUIDATIONS. That's Not Something to Ignore. 🔴 The liquidation figure makes the situation even more concerning. When more than $1 billion in leveraged positions gets liquidated, it shows how dangerous excessive leverage can become during sudden market movements. Long positions can get wiped out when prices fall sharply. Then, if the market rebounds aggressively, overleveraged short positions can become the next targets. This creates a chain reaction. price drops trigger liquidations, liquidations add further selling pressure, and panic encourages more traders to exit their positions. Before long, the market can move much further than many participants expected. However, I would separate forced liquidations from genuine long-term selling. They are not necessarily the same thing. What Am I Watching Now? I am not interested in blindly buying every dip, but I am also not convinced that every sharp correction means the entire market cycle is finished. My focus is on three things. First, whether Bitcoin can establish a meaningful support zone instead of continuing to print lower lows. Second, whether traditional stock markets can regain stability. A sustained recovery in risk sentiment could help crypto as well. Third, whether liquidation pressure starts cooling down. Until excessive leverage is cleared, sudden volatility can remain a serious problem. for now, capital preservation matters more to me than trying to catch every falling candle. I would rather miss the first part of a recovery than enter too early and get caught in another liquidation wave. My Personal Trading Strategy I am keeping my leverage low, avoiding emotional entries, and watching important support and resistance levels before making decisions. If the market stabilizes, I will look for confirmation before considering new positions. If selling pressure continues, I am comfortable staying patient and keeping some capital available for better opportunities. One thing is certain: political headlines can change market sentiment quickly, but price action still needs to confirm the direction. This is a market where risk management is not optional. what do you think is driving this situation more right now: Trump's political influence, macroeconomic uncertainty, institutional selling, or excessive leverage across the financial markets? Are we looking at a temporary liquidity shock, or could this be the beginning of a much deeper correction? Let's hear your thoughts. #BlockchainSecurity #Oracle20BFundingPlanTestsTheAITrade #AnthropicIPOTestsTheAIBoom #BOERateDecision #BybitAIEvolving $BTCUSDT $ETHUSDT


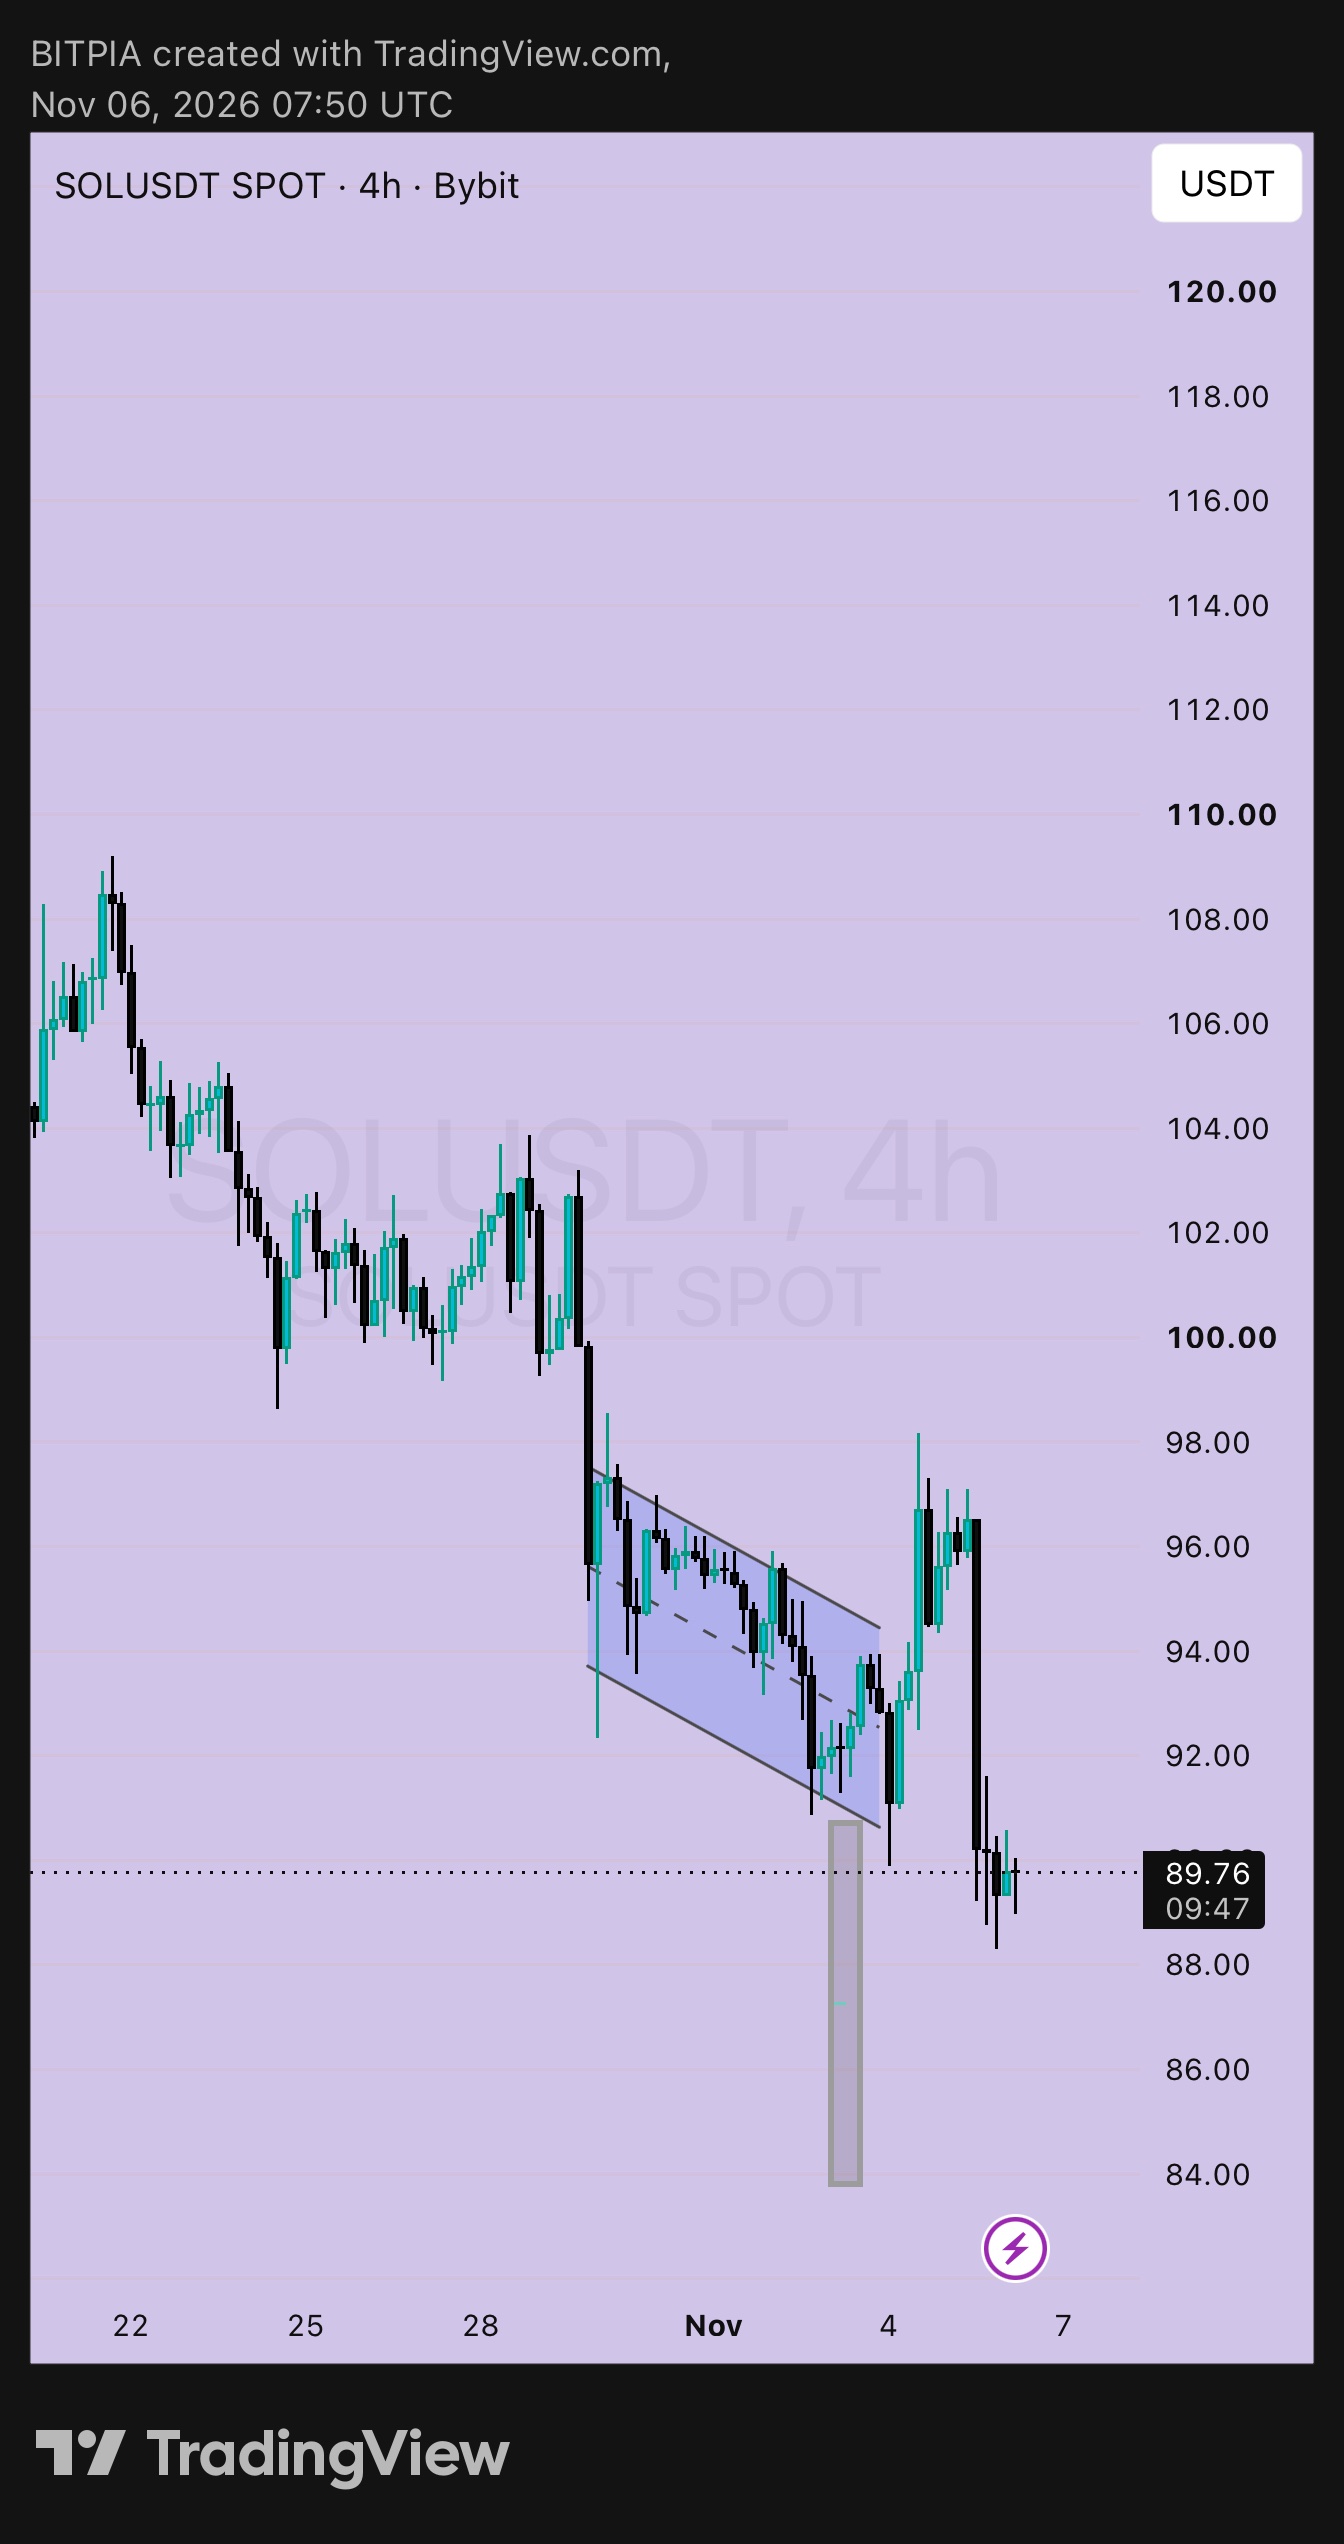
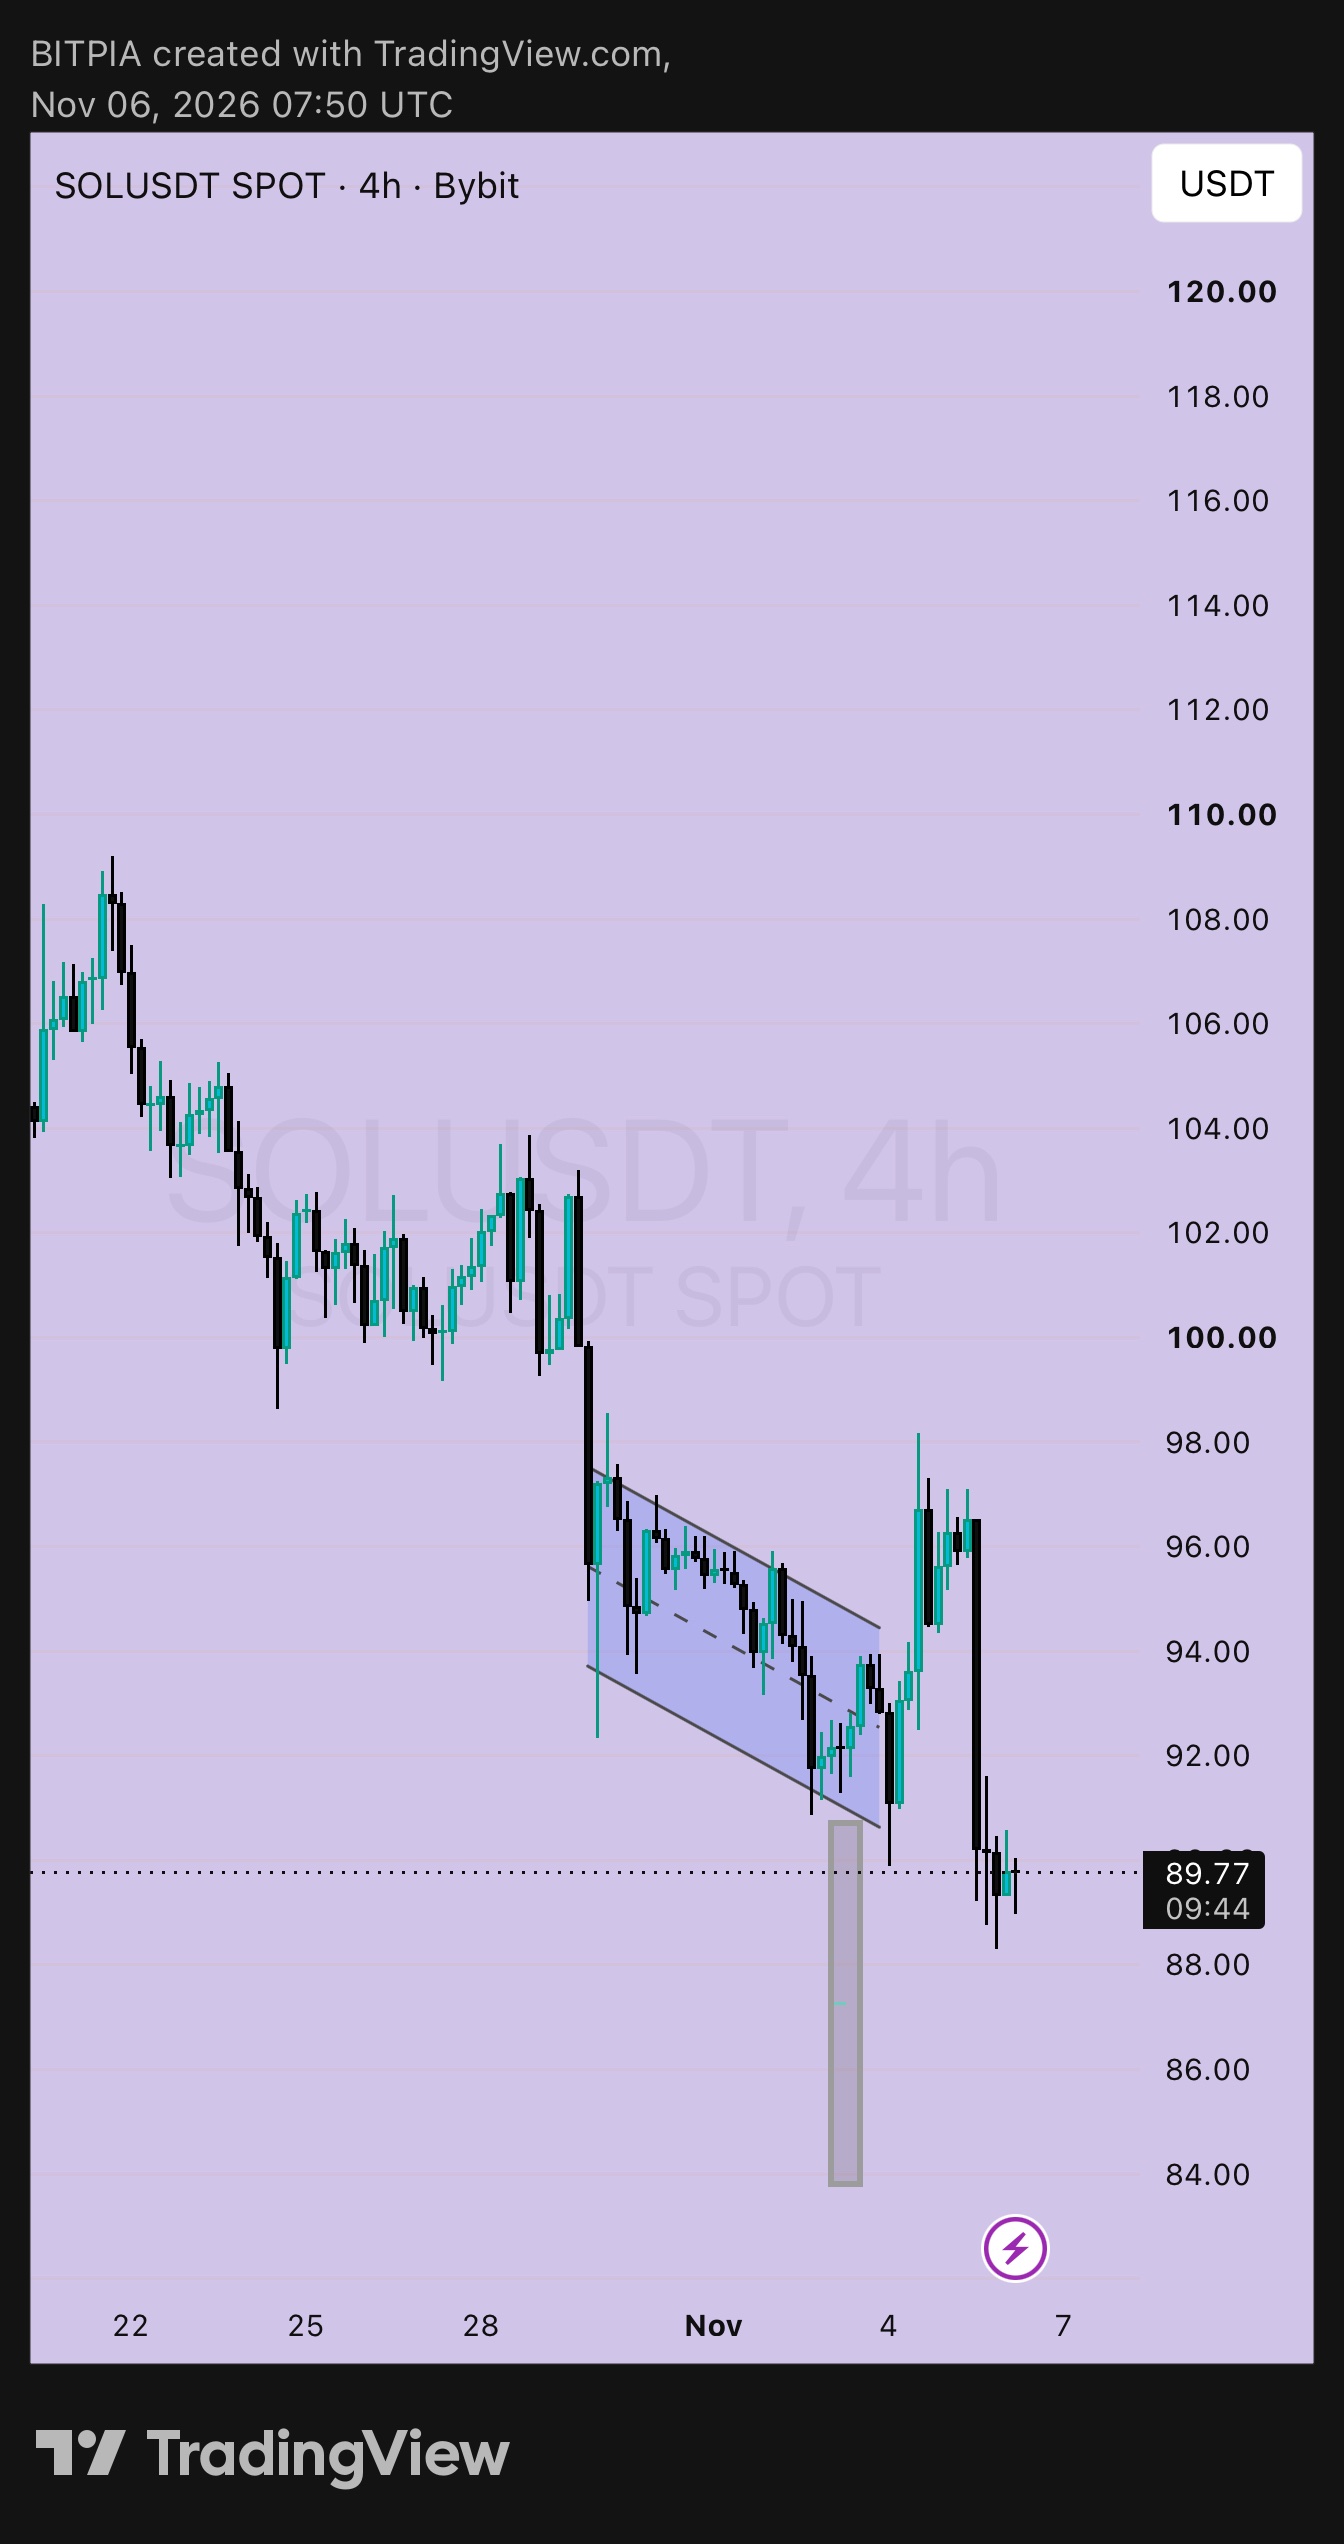
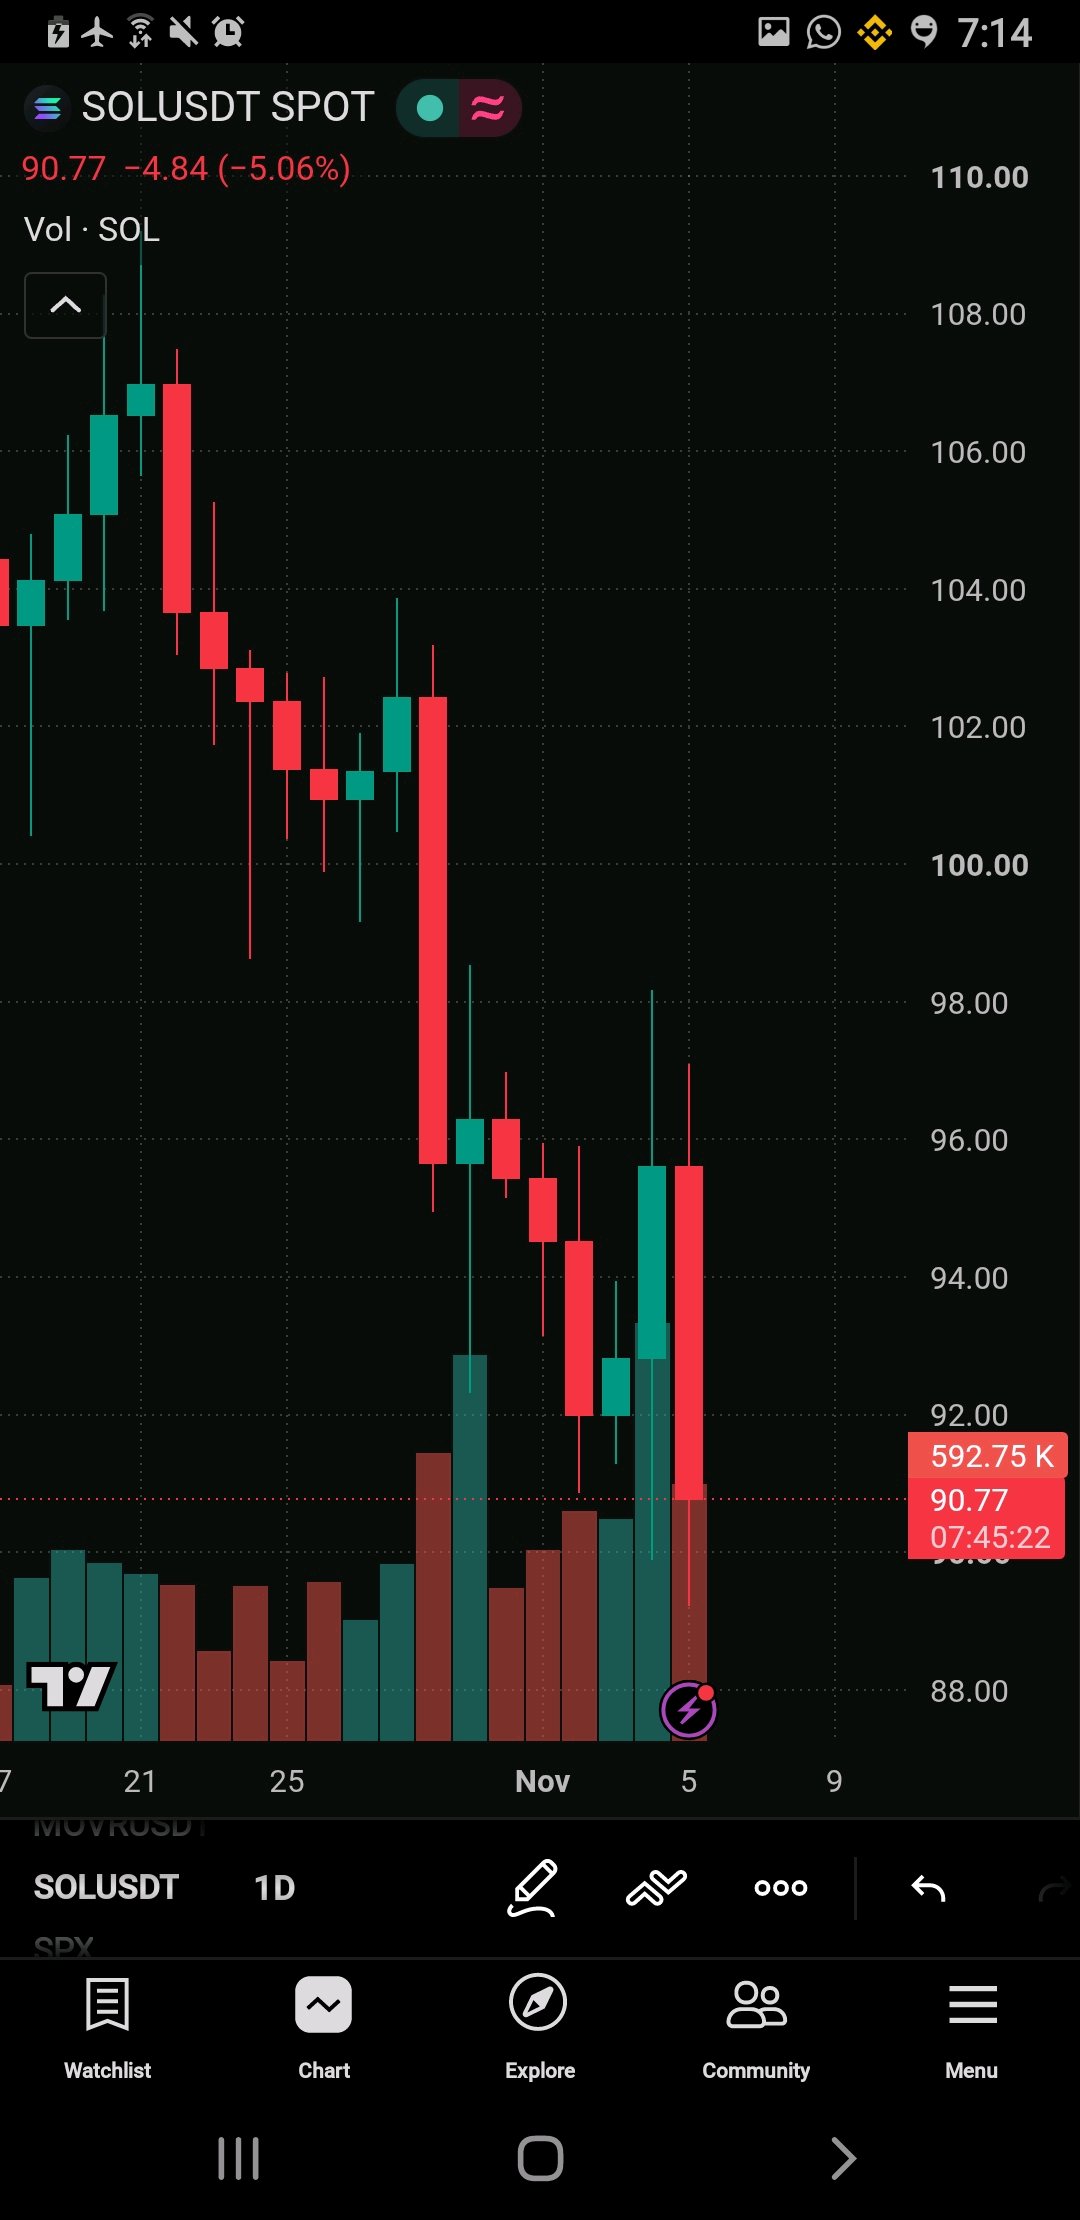
SOL 4h: both sides of the trade
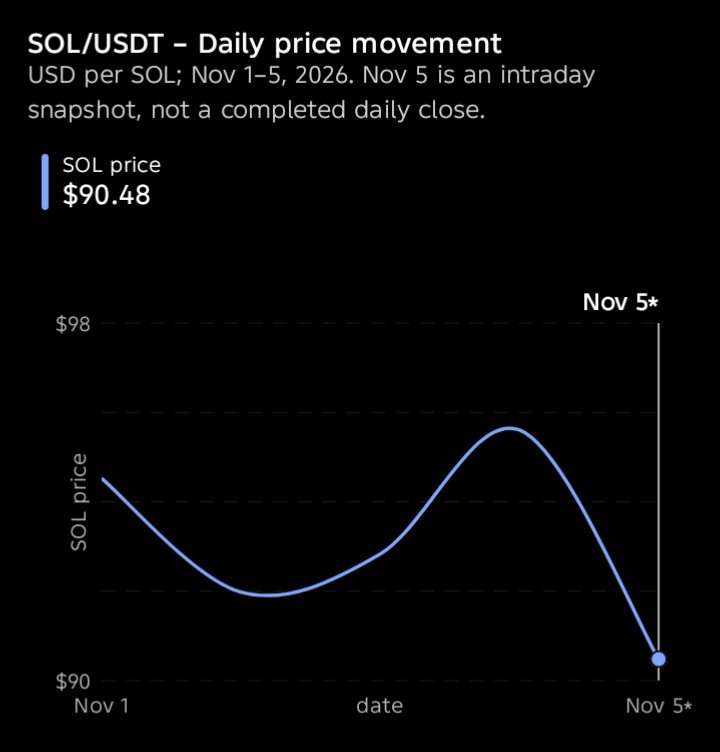
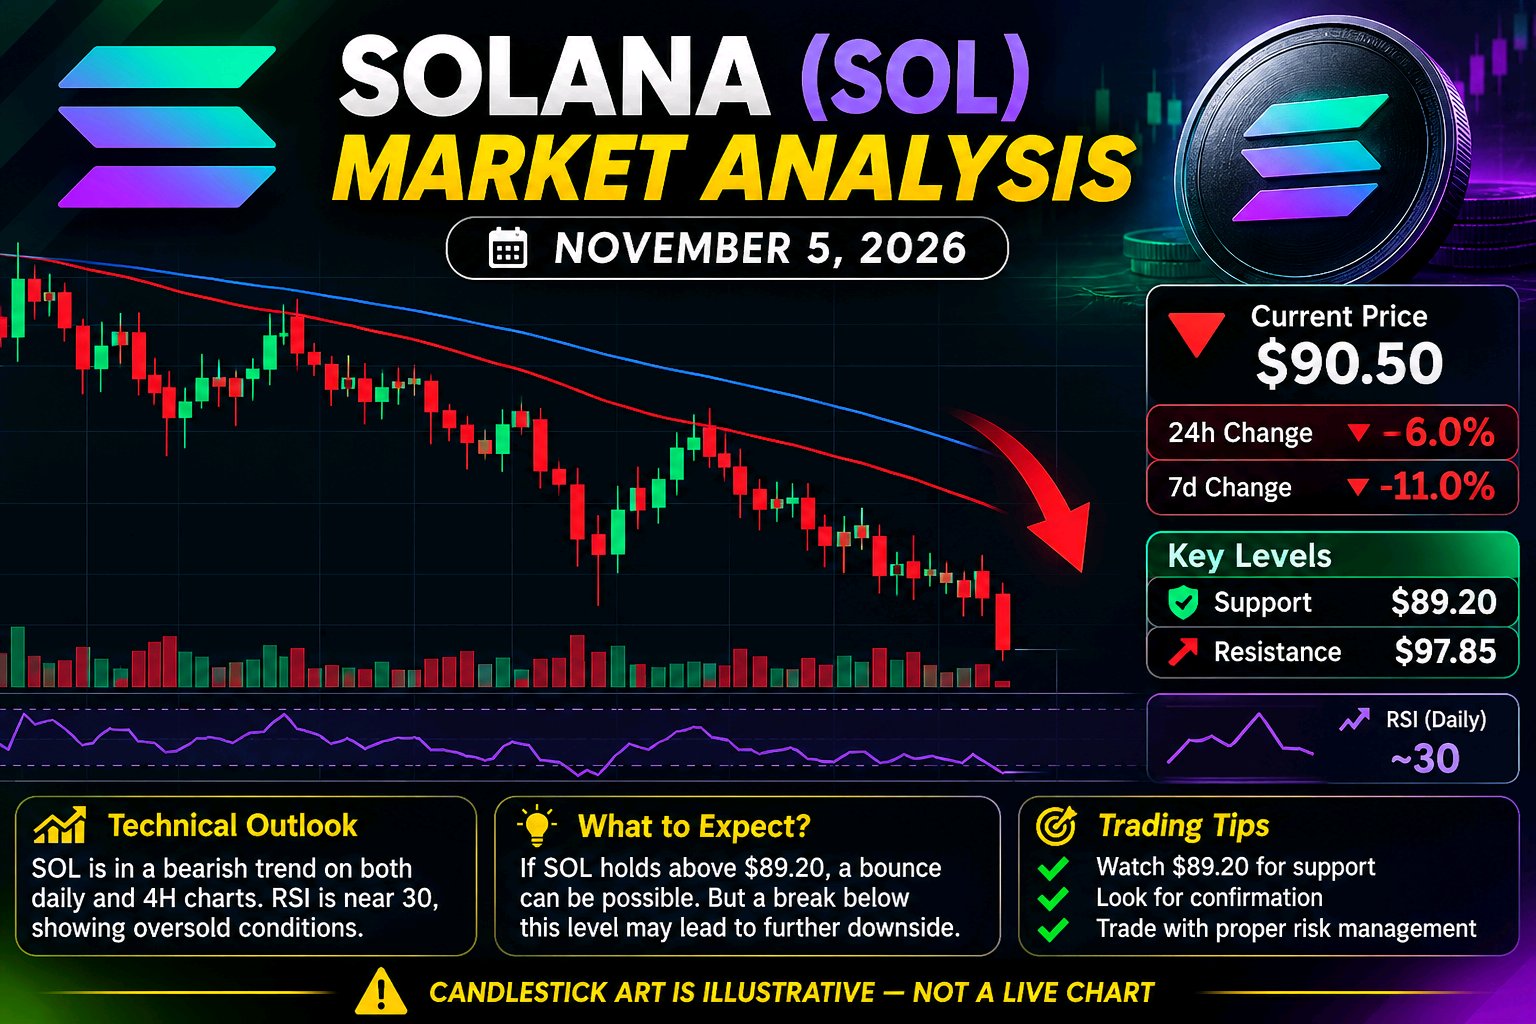
$SOLUSDT is at 89.77. The flag I've been tracking broke lower, price bounced to about 98, and then it rolled back under the old flag low near 90.5. The measured move from the flag points to roughly 84, which is the grey box on my chart. So I'm looking at this from both directions. ➤ What I see ▸ The bounce to 98 failed and sellers took back control ▸ Price is now below the flag, and the 90.5 area has flipped from support to resistance ▸ The wick low near 88.5 is the first level to watch ➤ Side 1: short on a retest ▸ Entry: around 91.5, if price retests the flag low and gets rejected ▸ Stop-loss: above 94.0 ▸ Risk per unit: 2.5 ▸ Targets: 86 (+5.5, about 2.2R) and 84 (+7.5, about 3R) ➤ Side 2: long near the target zone ▸ Entry: around 85, only if price reaches the 84 to 86 area and buyers show up ▸ Stop-loss: below 82.5 ▸ Risk per unit: 2.5 ▸ Targets: 90.5 (+5.5, about 2.2R) and 94.5 (+9.5, about 3.8R) ➤ What I'm not doing Not opening anything at 89.77. That's the middle of nowhere, with no level close enough for a tight stop. ➤ What changes my view A 4h close back above 94.5, the top of the old flag, tells me the breakdown failed and sellers lost control. I'd drop the short idea and look at 98 again. Both ideas depend on the levels holding, so keep size small and leverage low if you use perps. Not financial advice. Do your own research and only risk what you can afford to lose. #ByXIMPACT #WSOT2026 #BlockchainSecurity

$PIEVERSEUSDT is showing an unusual kind of strength: it is moving against the broader market instead of simply following Bitcoin's direction. In the November 6 market snapshot, PIEVERSE gained around 7% while BTC dropped 5.37% and ETH lost 7.34%. That relative strength is worth watching, but the question is whether real spot demand is supporting it. The derivatives picture deserves attention. Open interest is around $46.4M, while 24-hour futures turnover reached approximately $50.8M against just $9.1M in spot volume. This suggests speculative positioning is playing a much bigger role than spot activity. It can accelerate a breakout, but it can also make a reversal sharper. My technical focus is the $1.19–$1.34 range. The $1.19 area is the first important defense, while $1.31 is the reclaim level that could improve the short-term structure. A sustained move above $1.34 would open the way toward $1.445. On the downside, losing $1.19 puts the $1.16 support area back in focus. There is another factor traders should not ignore: 33.4 million PIEVERSE tokens are scheduled to unlock on November 14. That represents approximately 3.3% of total supply. Not every unlocked token will be sold, but the market will need enough genuine demand to absorb the additional supply. Pieverse has a real infrastructure angle through agent-native payments, verifiable receipts and compliance-focused transactions. Its token also has governance, staking and fee-discount utilities. However, product adoption only becomes a strong token catalyst when it translates into measurable token demand. I would avoid chasing momentum before seeing how price reacts around the reclaim zone. If $1.19 holds and $1.31 is recovered, the bullish case improves. If support breaks, the setup changes. Is PIEVERSE's relative strength evidence of genuine accumulation, or is leveraged trading creating a rally that could struggle when the unlock approaches? #WSOT2026 #BlockchainSecurity

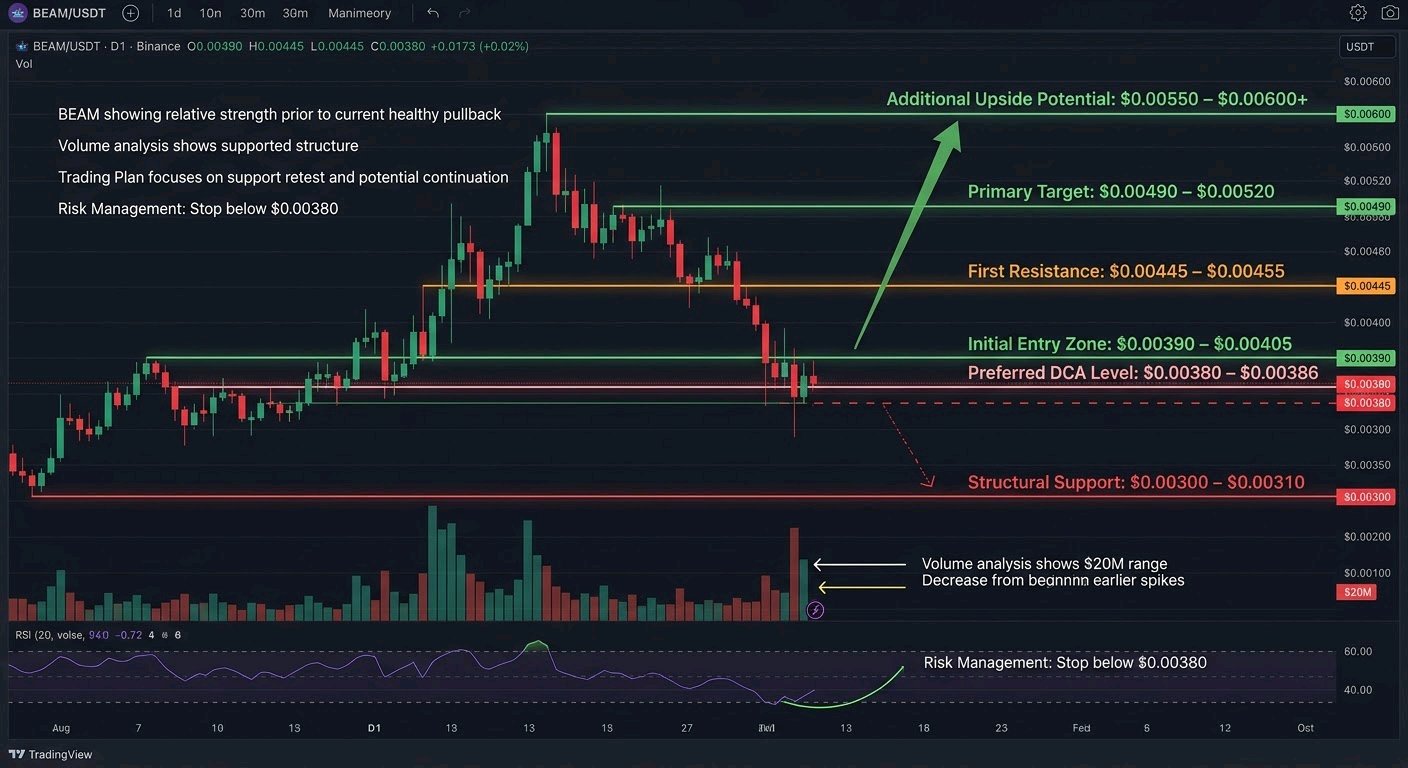
$BEAMUSDT - STRONG RELATIVE STRENGTH EARLIER THIS WEEK, NOW PULLING BACK HARD. I’M WATCHING THE $0.0038–$0.0039 ZONE CLOSELY FOR THE NEXT MOVE.** Beam has been one of the clearer relative-strength names in the gaming/GameFi sector over the past month. While large parts of the market chopped or sold off, BEAM pushed a multi-week uptrend, broke higher on elevated participation late October, and briefly extended toward the $0.006 area. That move has now given back a good portion of the recent gains. Price is currently trading near $0.00395–$0.0040 after a roughly 15% decline over the last 24 hours, with the 24h range stretching from roughly $0.00394 to $0.00479. On the higher timeframes the structure still looks constructive. The broader uptrend from the June lows remains intact, price is holding above several key moving averages on the daily, and the October breakout that flipped prior resistance into potential support is still in play. What we’re seeing now is a classic post-impulse pullback after an overextended push. Relative strength versus Bitcoin over the last 30 days has been notable, even if the last day or two has shown some mean-reversion. **Volume Analysis** 24-hour volume is running in the $20M range across major venues (spot + perps). That is still elevated compared with quieter periods earlier in the month, though it has cooled from the extreme spikes seen during the late-October breakout. The volume profile of the recent advance was healthy — participation expanded as price moved higher. The current pullback has not yet shown the kind of aggressive high-volume selling that would signal a full trend reversal. I’m treating the volume as still supportive of the larger structure rather than a distribution event, provided the key demand zones hold. **My Trading Plan** I’m treating this as a potential continuation setup after the pullback, not a fresh breakout chase. - **Initial Entry Zone**: $0.00390 – $0.00405 (current area and slight dips). This is where I’m looking for the first signs of buyers stepping back in after the recent flush. - **Preferred DCA Level**: $0.00380 – $0.00386. This zone has acted as short-term support recently and aligns with prior structure and order-block type demand from the impulse move. A controlled fill here improves the overall risk-reward. - **First Resistance**: $0.00445 – $0.00455. This is the immediate area price needs to reclaim and hold to signal the pullback is likely complete. - **Primary Target**: $0.00490 – $0.00520. A clean move back through this zone would put the recent local highs back in play. - **Additional Upside Potential**: $0.00550 – $0.00600+ if momentum returns and the broader market cooperates. These levels were tested during the late-October spike and remain logical extensions of the current structure. Confirmation for me is a higher low forming on the 4H/ daily combined with a reclaim of the $0.00445 area on rising volume. Without that, I stay patient and size smaller. **What Could Go Wrong?** The biggest risk is that this pullback deepens into a larger correction. A decisive break and daily close below $0.00380 would weaken the short-term bullish structure and open the door toward the $0.00340 – $0.00350 demand zone that launched the latest leg higher. Below that, the next meaningful structural support sits closer to the $0.00300–$0.00310 region. If volume expands sharply on the downside while the broader market remains soft, the relative-strength story can fade quickly. I’m also watching for any sustained weakness in the gaming sector as a whole. A failure to hold the $0.00380 area on volume would invalidate the immediate long setup for me and force a reassessment of the higher-timeframe structure. **My Perspective** Beam remains interesting because it has shown genuine relative strength inside a still-fragile altcoin environment. The multi-month uptrend, the clean breakout structure, and the fact that it held up better than many peers during recent market stress keep it on my radar. The current pullback looks like healthy digestion after a sharp run rather than the start of a major top — at least as long as the $0.00380–$0.00390 zone continues to attract buyers. I’m watching two things next: whether buyers defend the current support cluster with improving volume, and whether price can reclaim $0.00445 without heavy selling on the attempts. If those conditions develop, I’m expecting a continuation move that retests the recent highs and potentially extends further. If support fails cleanly, I’ll step aside and wait for a clearer higher-low structure to form lower. No guarantees in this market — just levels, structure, and risk management. BEAM is still one of the names I’m actively tracking for a potential next leg higher once this pullback stabilizes. #ByXIMPACT #WSOT2026 #BlockchainSecurity

$SOL | A strong ecosystem doesn't guarantee a strong price. Market confirmation still matters. Solana is trading around $89 after losing the $92 support zone during the latest market sell-off. Despite continued activity across its DeFi, meme-coin and trading ecosystems, SOL still needs to demonstrate that buyers are willing to defend current levels. Here's what traders should watch: • $89: Immediate price zone to monitor. • $85–$87: Key potential support area. • $92.30: Important resistance to reclaim. • $98: Next upside target if bullish momentum strengthens. A sustained move above $92.30, supported by stronger spot volume, could improve the short-term structure and open the door towards $98. However, continued rejection below resistance could leave SOL vulnerable to further downside. My take: Solana's ecosystem growth is worth watching, but network activity and token price performance are two different things. Traders should focus on demand, volume and confirmation before anticipating a recovery. Strong fundamentals matter. Price confirmation matters too. #Solana #SOL #Bybit #DeFi #CryptoTrading #BlockchainSecurity #MidtermsMarketWatch
$DOGE | Community strength can attract attention, but only buying pressure can sustain a rally. Dogecoin is facing renewed selling pressure, trading around $0.072–$0.073 after losing the $0.0724 support level. Despite continued speculative interest, price action suggests sellers still have the upper hand. Here's what traders should watch: • $0.0710: Immediate support to defend. • $0.0702: Next potential downside level. • $0.0770: Key resistance and recovery level. A sustained reclaim of $0.0770, backed by stronger spot volume, could signal a shift in short-term momentum. However, a confirmed breakdown below $0.0710 would increase downside risk and strengthen the bearish outlook. My take: DOGE needs genuine demand to support a recovery. Traders should monitor volume, Bitcoin's stability and reactions around key levels before positioning for the next move. Meme momentum is powerful, but market structure still matters. #Dogecoin #DOGE #Bybit #Memecoins #CryptoTrading #BlockchainSecurity #MidtermsMarketWatch
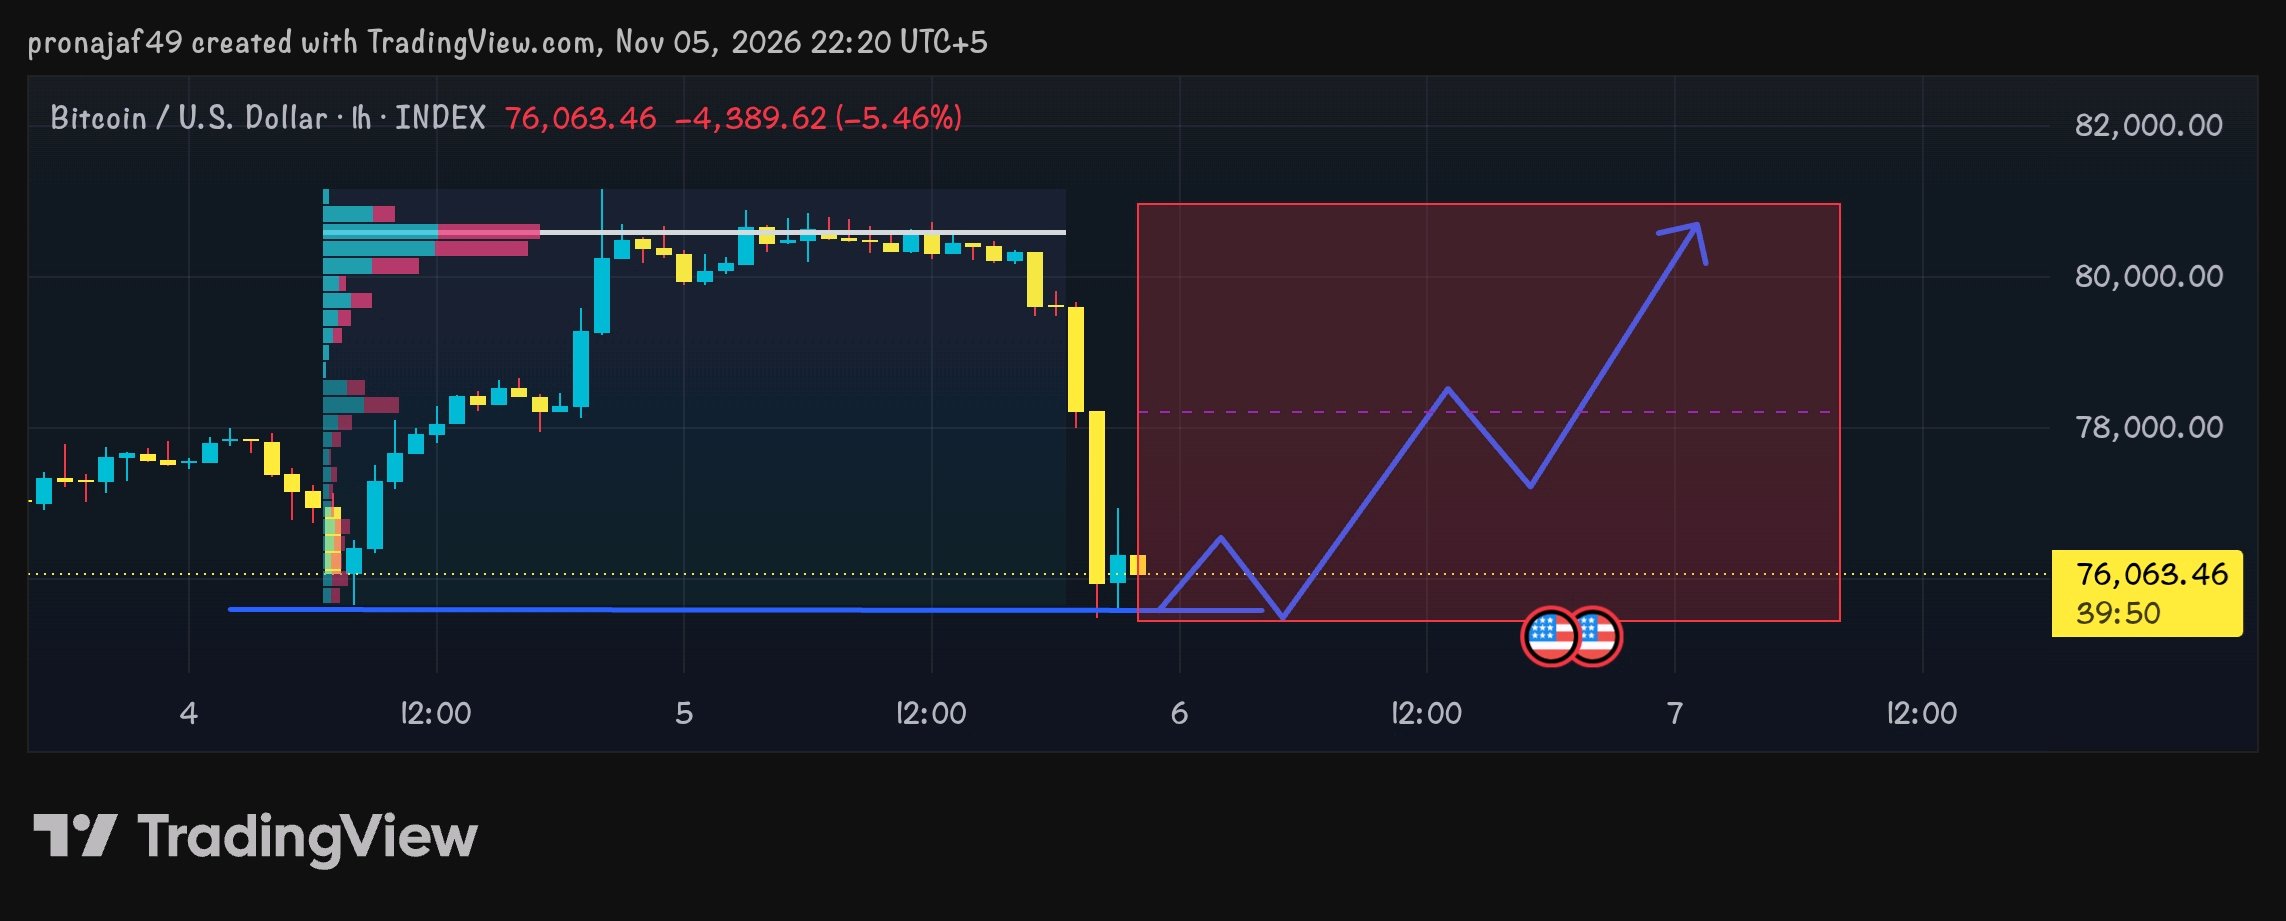
$BTC | Bitcoin is at a critical point. The next move needs confirmation, not speculation. Bitcoin is facing renewed selling pressure around $76,000 after losing a key support zone. Buyers now need to demonstrate strength to prevent further downside. Here's what traders should watch: • $74,900–$75,000: Key support zone to defend. • $73,300: Next potential downside target if selling pressure increases. • $76,600: Immediate resistance and first recovery level. • $78,000: Major reclaim level that could strengthen bullish momentum. The current market structure remains weak, with buyers yet to establish convincing control. My take: A sustained reclaim of $76,600, supported by strong spot volume, could improve Bitcoin's short-term outlook. Until then, patience, risk management and capital preservation should remain priorities. In this market, confirmation matters more than prediction. #Bitcoin #BTC #Bybit #CryptoTrading #MarketAnalysis #BlockchainSecurity #WSOTPicktoEarn10U

ETHEREUM LATEST MARKET UPDATE
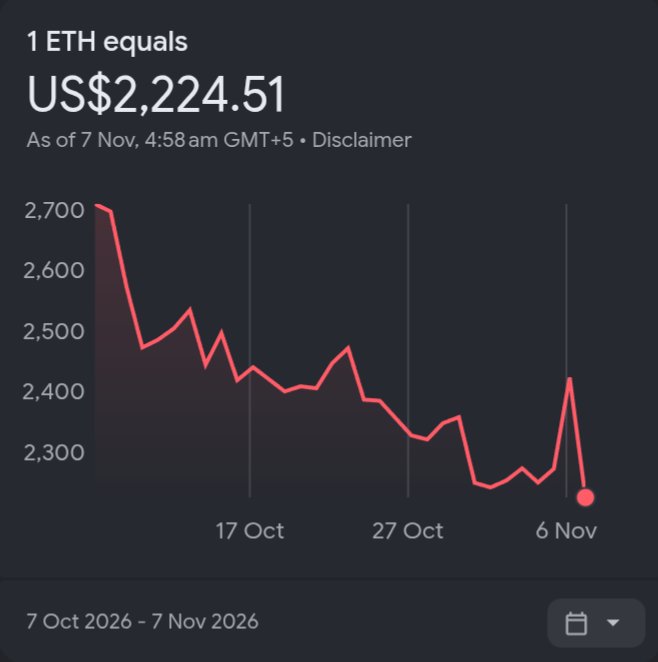
$ETHUSDT ETHEREUM MARKET ANALYSIS | 6 NOVEMBER 2026 💰 ETH Price: $2,236 📉 24H Change: -7.78% 📊 Technical Overview Ethereum is showing signs of a short-term recovery on the 4H chart, while the daily trend remains bearish. Traders should watch key support and resistance levels before entering the market. 🟢 SUPPORT LEVELS - $2,227 - $2,217 - $2,206 🔴 RESISTANCE LEVELS - $2,279 – $2,289 - $2,321 – $2,330 - $2,390 – $2,400 📈 BULLISH SCENARIO If ETH breaks above $2,289 with strong volume, the next targets could be $2,321, $2,330 and $2,400. 📉 BEARISH SCENARIO If ETH loses the $2,217 support level, further downside towards $2,206 could be possible. 🎯 TRADING STRATEGY - Entry: Wait for breakout confirmation. - Stop Loss: Below confirmed support. - Targets: $2,289 / $2,330 / $2,400. 🔥 FINAL VERDICT Ethereum is attempting a short-term recovery, but the overall daily trend remains bearish. A confirmed breakout above resistance is needed before expecting a stronger bullish move. ⚠️ Trade carefully and always manage your risk. #WSOT2026 #USPayrollsAndRateDecisionsDriveMacroWeek #BybitAIEvolving #BlockchainSecurity #OilVolatilityTracksIranPeaceTalks $DOGEUSDT #Ethereum #ETH #ETHUSDT #CryptoAnalysis #BinanceSquare #CryptoTrading #TechnicalAnalysis

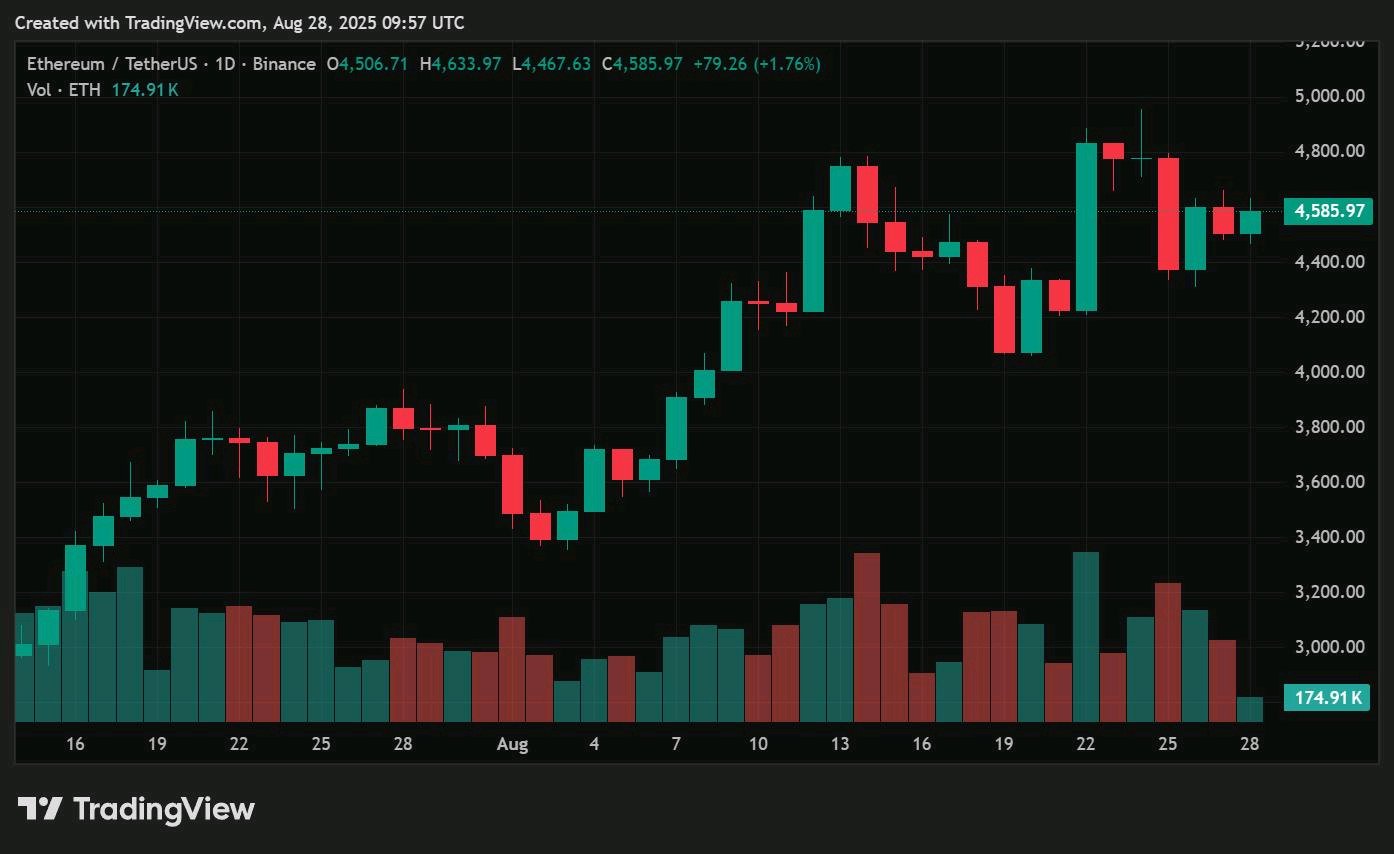

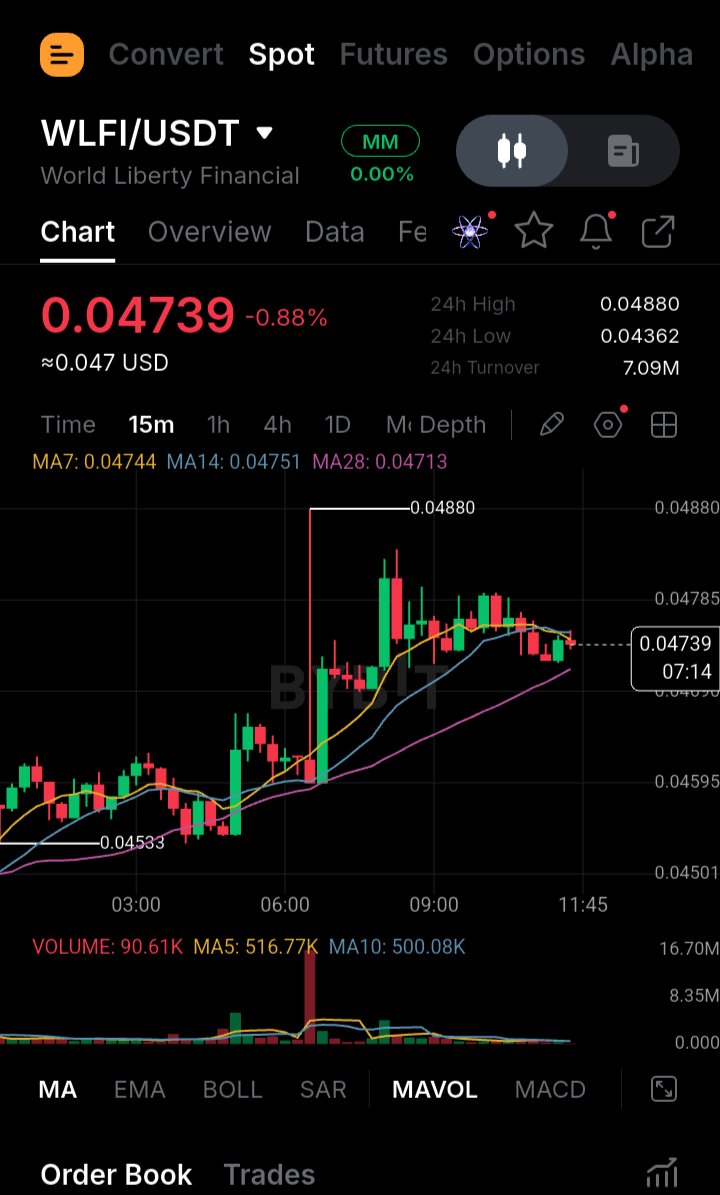
$WLFI Shows Signs of Recovery After a Healthy Pullback WLFI experienced a controlled retracement while maintaining its overall market structure. Buyers are gradually returning, suggesting that bullish momentum may be rebuilding. The key factor now is whether price can maintain support and attract sustained buying pressure. A strong move above nearby resistance could strengthen the recovery, while losing support may lead to another downside test. Key figures $0.0472–$0.0473 — Important short-term price zone $0.0465 — Critical support to monitor #BybitAIEvolving #BlockchainSecurity $WLFIUSDT


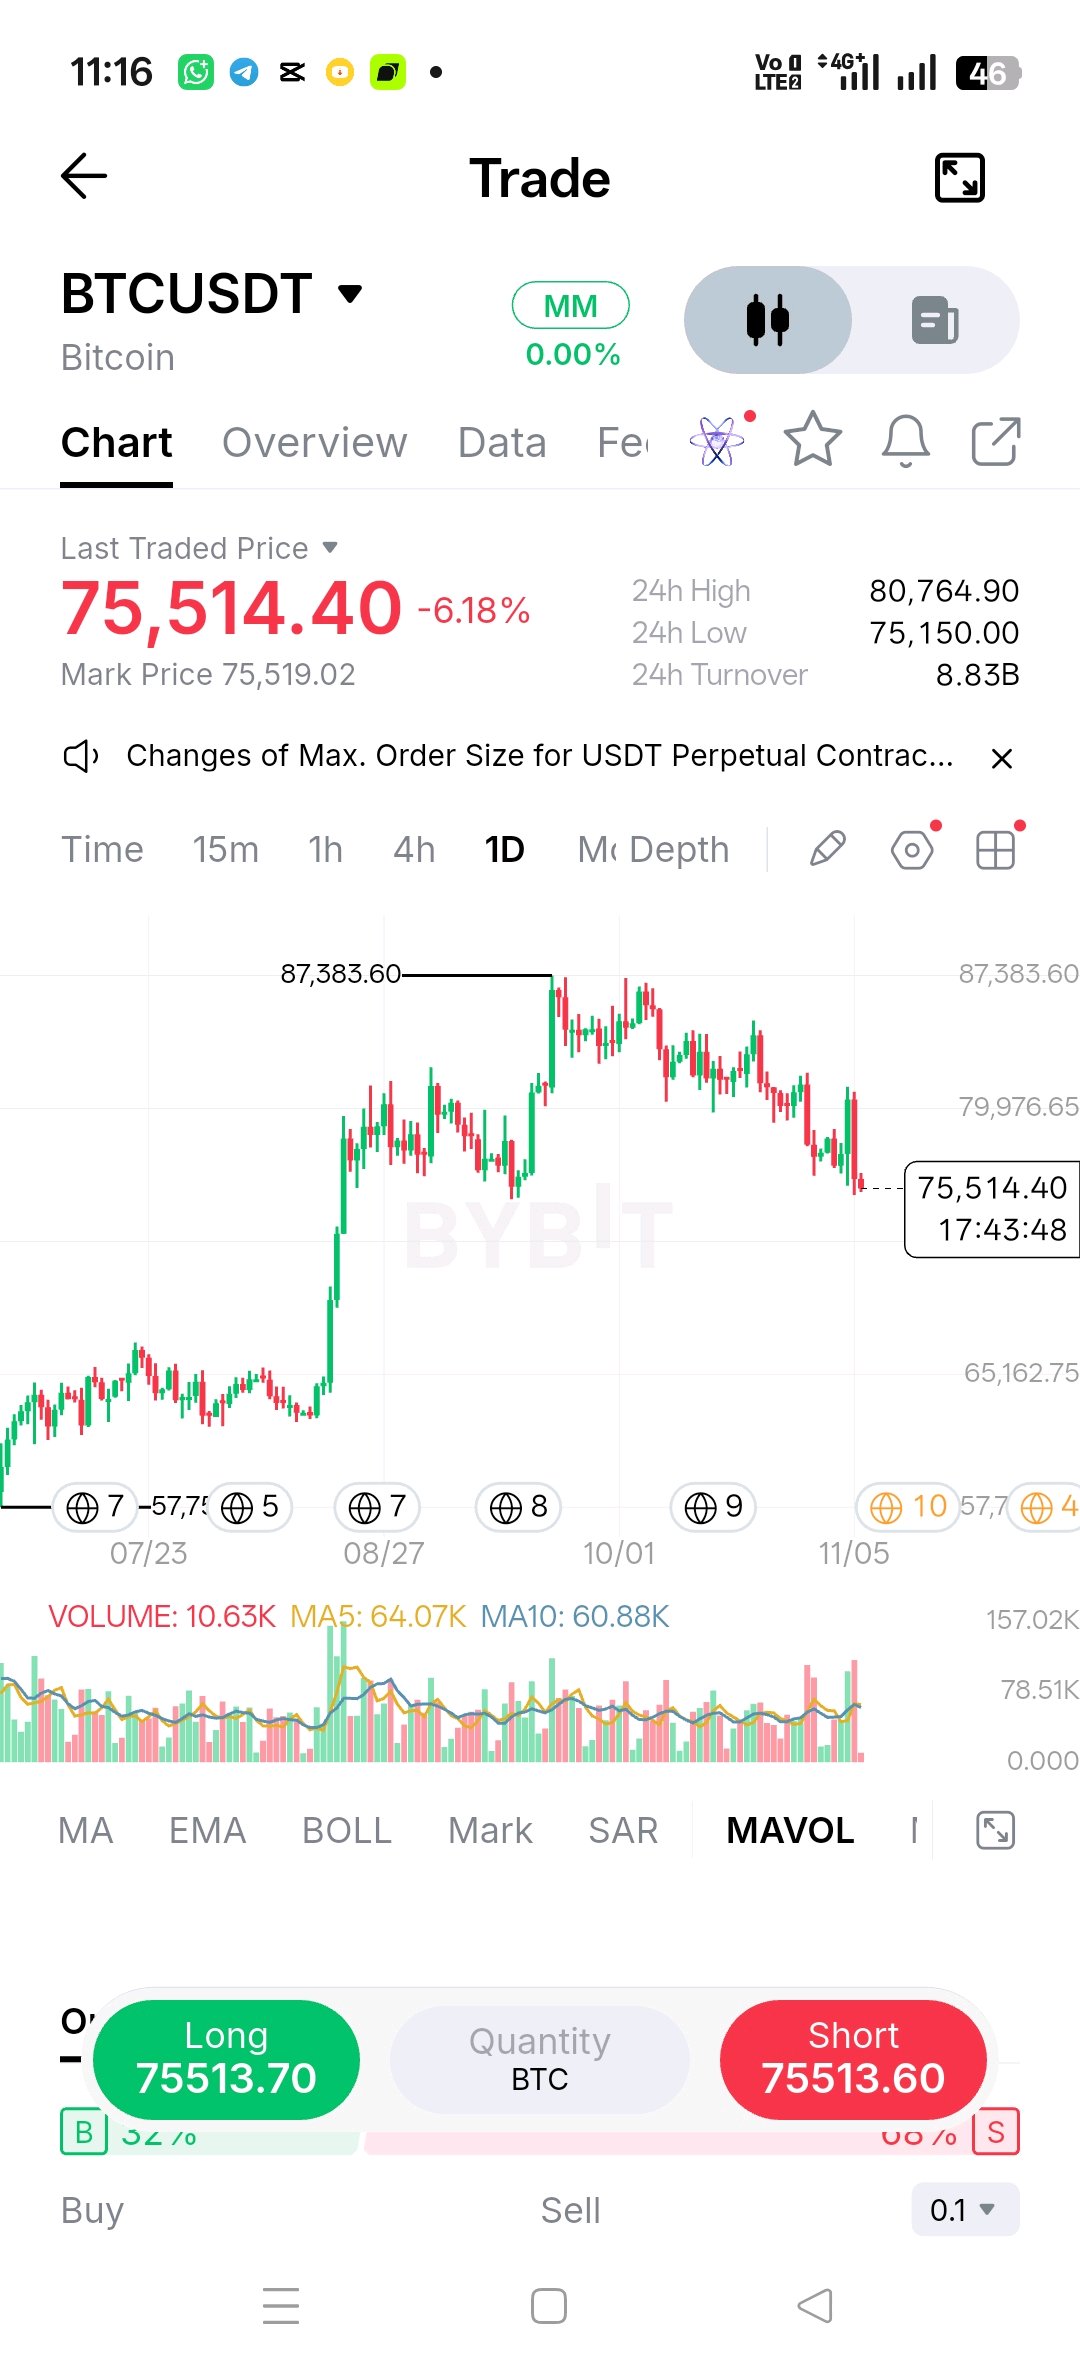
BTC Pullback: 75K Support in Focus
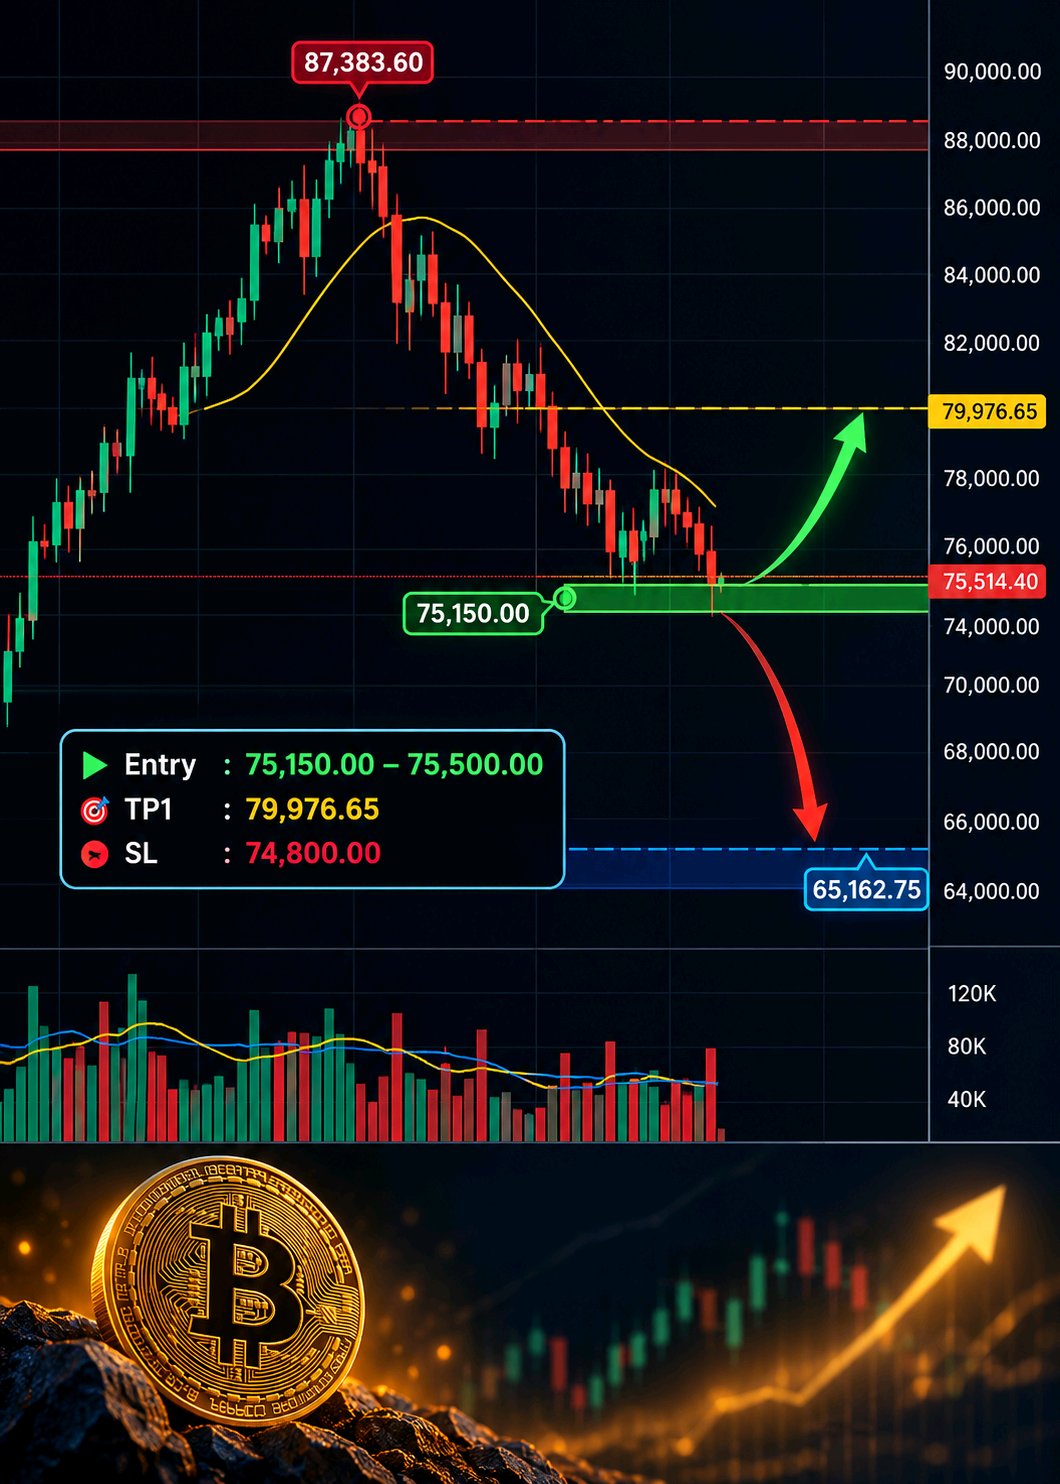
$BTCUSDT The daily chart for BTCUSDT shows a notable shift in momentum, with the price currently trading at 75,514.40, down -6.18% over the last 24 hours. The price is currently sitting near the lower end of the recent daily range, testing immediate support. 📊 Market Structure: Looking at the visible daily timeframe, the market structure previously established a strong upward trend, printing a clear local peak at 87,383.60. Since that high, the structure has shifted into a corrective phase, characterized by a series of lower highs and lower lows. · Immediate Support: The current area is critical, with the 24h low sitting at 75,150.00 acting as immediate visible support. · Resistance: The nearest visible intermediate resistance is around the 79,976.65 level, while the major structure resistance remains the peak at 87,383.60. · Volume: The visible MAVOL indicator shows current volume (10.63K) is significantly lower than the moving averages (MA5 at 64.07K, MA10 at 60.88K), suggesting a pause or exhaustion in the current downward movement for this specific candle. · Deeper Support: If the current level fails, the next visible historical consolidation support zone on the chart is located around the 65,162.75 area. 🎯 Potential Setup: Based purely on the current price testing a visible support level (24h low), here is a potential reactive scenario: · Entry: 75,150.00 - 75,500.00 zone (current price area). · TP1: 79,976.65 (visible intermediate resistance). · TP2: Not clearly defined on this timeframe without a confirmed change in market structure; focus on taking partials at TP1. · SL / Invalidation: 74,800.00 (A decisive daily close below the 24h low of 75,150.00). ⚠️ Confirmation: For this scenario to gain validity, we would want to see the current daily candle close above the 75,514.40 level, ideally with a long lower wick, indicating buyers are stepping in. Furthermore, a bullish bounce should be accompanied by an increase in trading volume to confirm the support. ❌ Invalidation: This setup is invalidated if the price breaks down and closes decisively below the 75,150.00 (24h low) mark. A sustained break below this level would confirm the continuation of the downward structure, potentially opening the door for a deeper retracement toward the 65K zone. 🧠 Risk Note: We are currently in a short-term downward structure. Counter-trend longs at support levels carry higher risk. Always use strict stop-losses to protect your capital, manage your position sizing appropriately, and do not over-leverage. #IMPACTbyTrade $XAUTUSDT #BlockchainSecurity #Oracle20BFundingPlanTestsTheAITrade
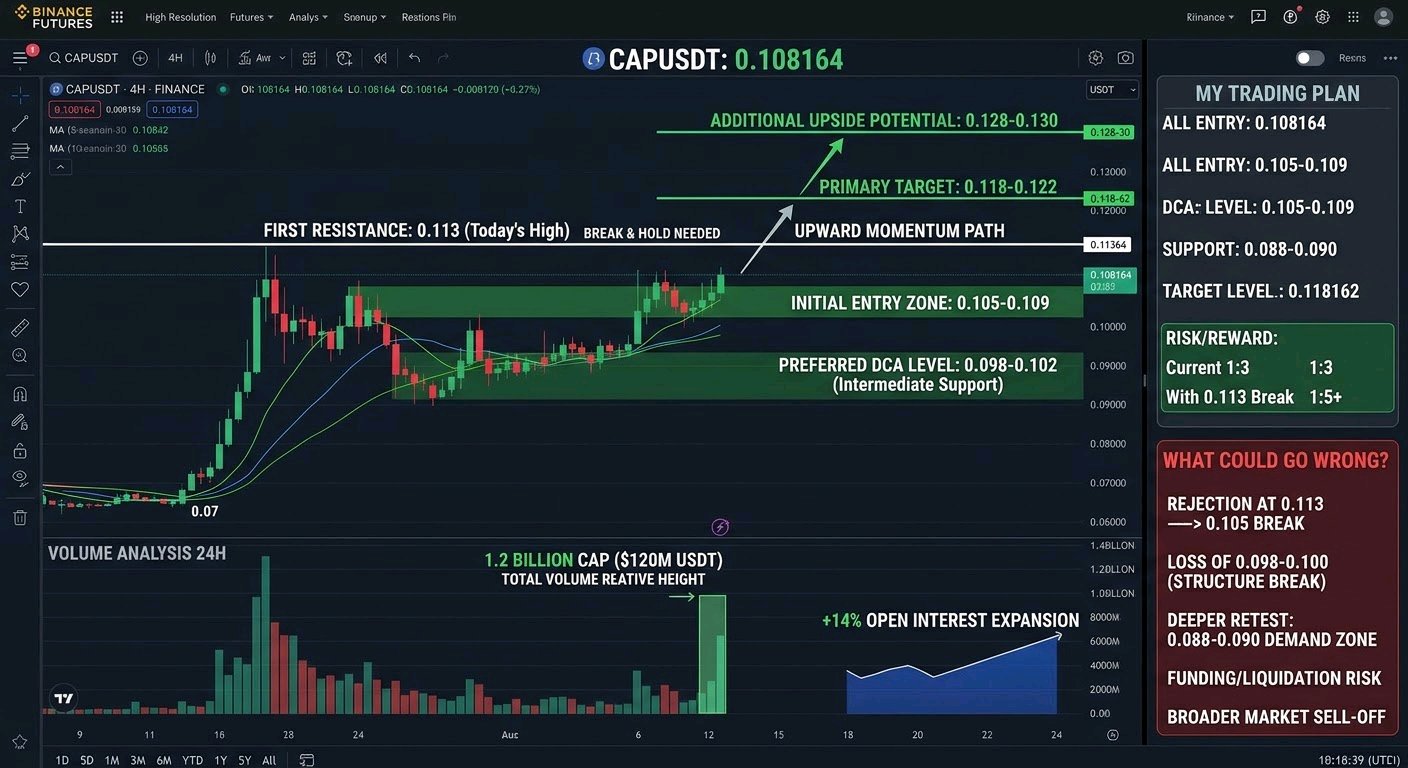
$CAPUSDT USDT - VOLUME STAYS ELEVATED AND PRICE IS HOLDING NEAR THE HIGHS, I’M WATCHING FOR A CLEAN BREAK ABOVE 0.113 CAP continues to show relative strength against the broader market. While majors have been choppy, this one has pushed higher over the past 24 hours and is currently trading near 0.108–0.109 after tagging a high of 0.11291. The daily structure improved after the strong recovery from the 0.07 region earlier in the week, and price is sitting comfortably above the short-term moving averages. The key question now is whether buyers can force a sustained move through the recent high. Volume Analysis 24-hour volume remains solid at roughly 1.2 billion CAP and over $120 million in USDT notional on Binance futures. Open interest has expanded in the process, and funding has stayed positive. This level of participation supports the recent advance rather than painting it as a thin, low-conviction move. As long as volume holds up on any push higher, the odds of continuation improve. My Trading Plan I’m approaching this from a momentum-and-structure perspective with clear levels. Initial entry zone: 0.105–0.109 (current area or shallow dips that hold the higher-low structure) Preferred DCA level: 0.097–0.102 (near the zone that marked the recent acceleration and intermediate support) First resistance: 0.112–0.113 (today’s high — a decisive break and hold here would open the next leg) Primary target: 0.118–0.122 (prior swing high region) Additional upside potential: 0.128–0.130 if momentum and volume expand after the breakout Confirmation for me would be a clean close above 0.113 accompanied by steady volume, followed by a successful retest that turns the level into support. What Could Go Wrong? After a multi-day run, a rejection at 0.112–0.113 is always possible. A drop back below 0.105 would weaken the short-term bullish structure and increase the chance of a deeper pullback. Losing the 0.097–0.100 area would put the recent higher lows at risk and likely send price toward the 0.088–0.090 demand zone. Elevated funding and rising open interest also mean any downside move can accelerate through liquidations. A broader market sell-off would add further pressure regardless of CAP’s relative strength . My Perspective CAP is interesting right now because the volume and open-interest growth have accompanied the price advance, and the market structure has shifted higher after the sharp recovery. The current action near the recent highs matters because a successful break could open room toward the previous swing highs, while a failure would simply reset the short-term picture. Continuation still looks more likely than an immediate deep correction as long as 0.105 holds and participation remains healthy, but I am treating any extension with defined risk. I’m watching the reaction at 0.113 closely and will adjust if the structure breaks. Overall the setup remains constructive while staying realistic about the risk of a healthy pullback. #ByXIMPACT #BlockchainSecurity #WSOT2026
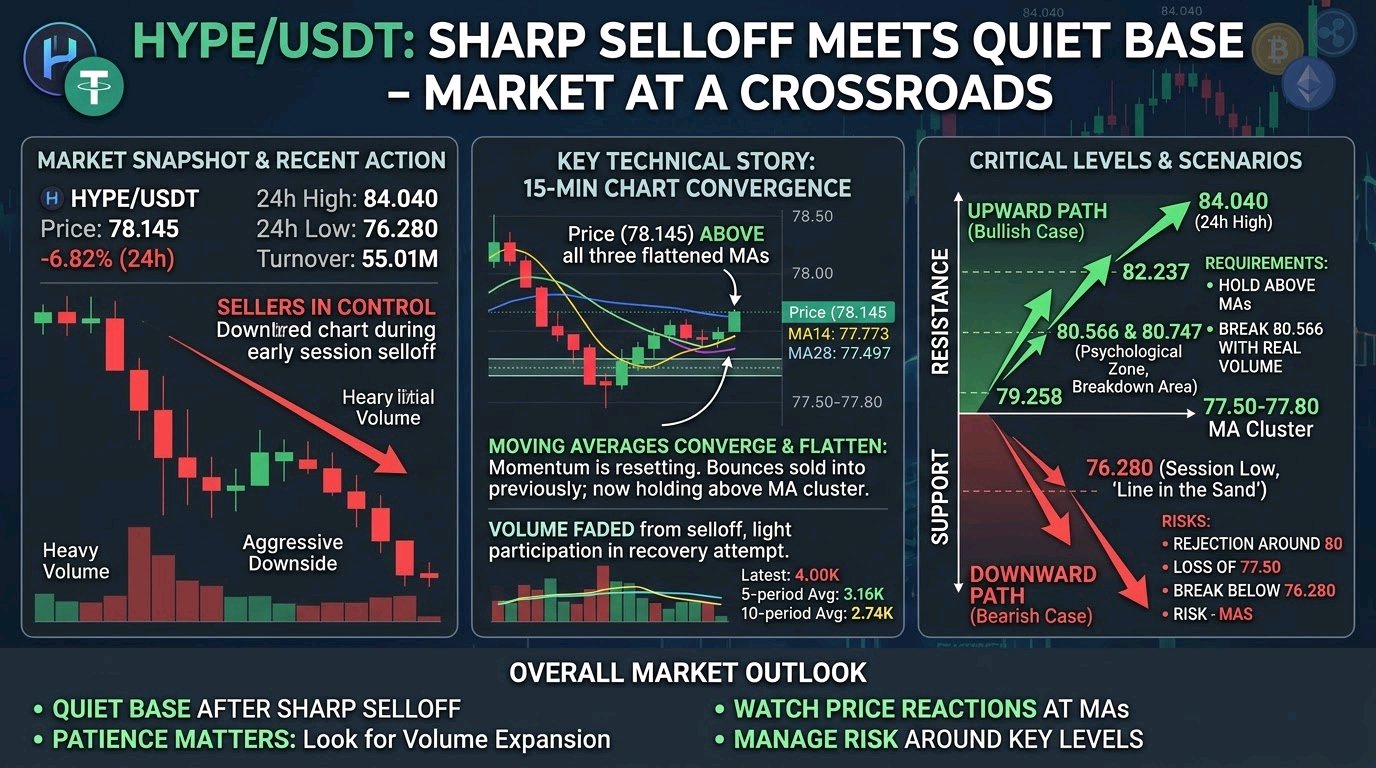
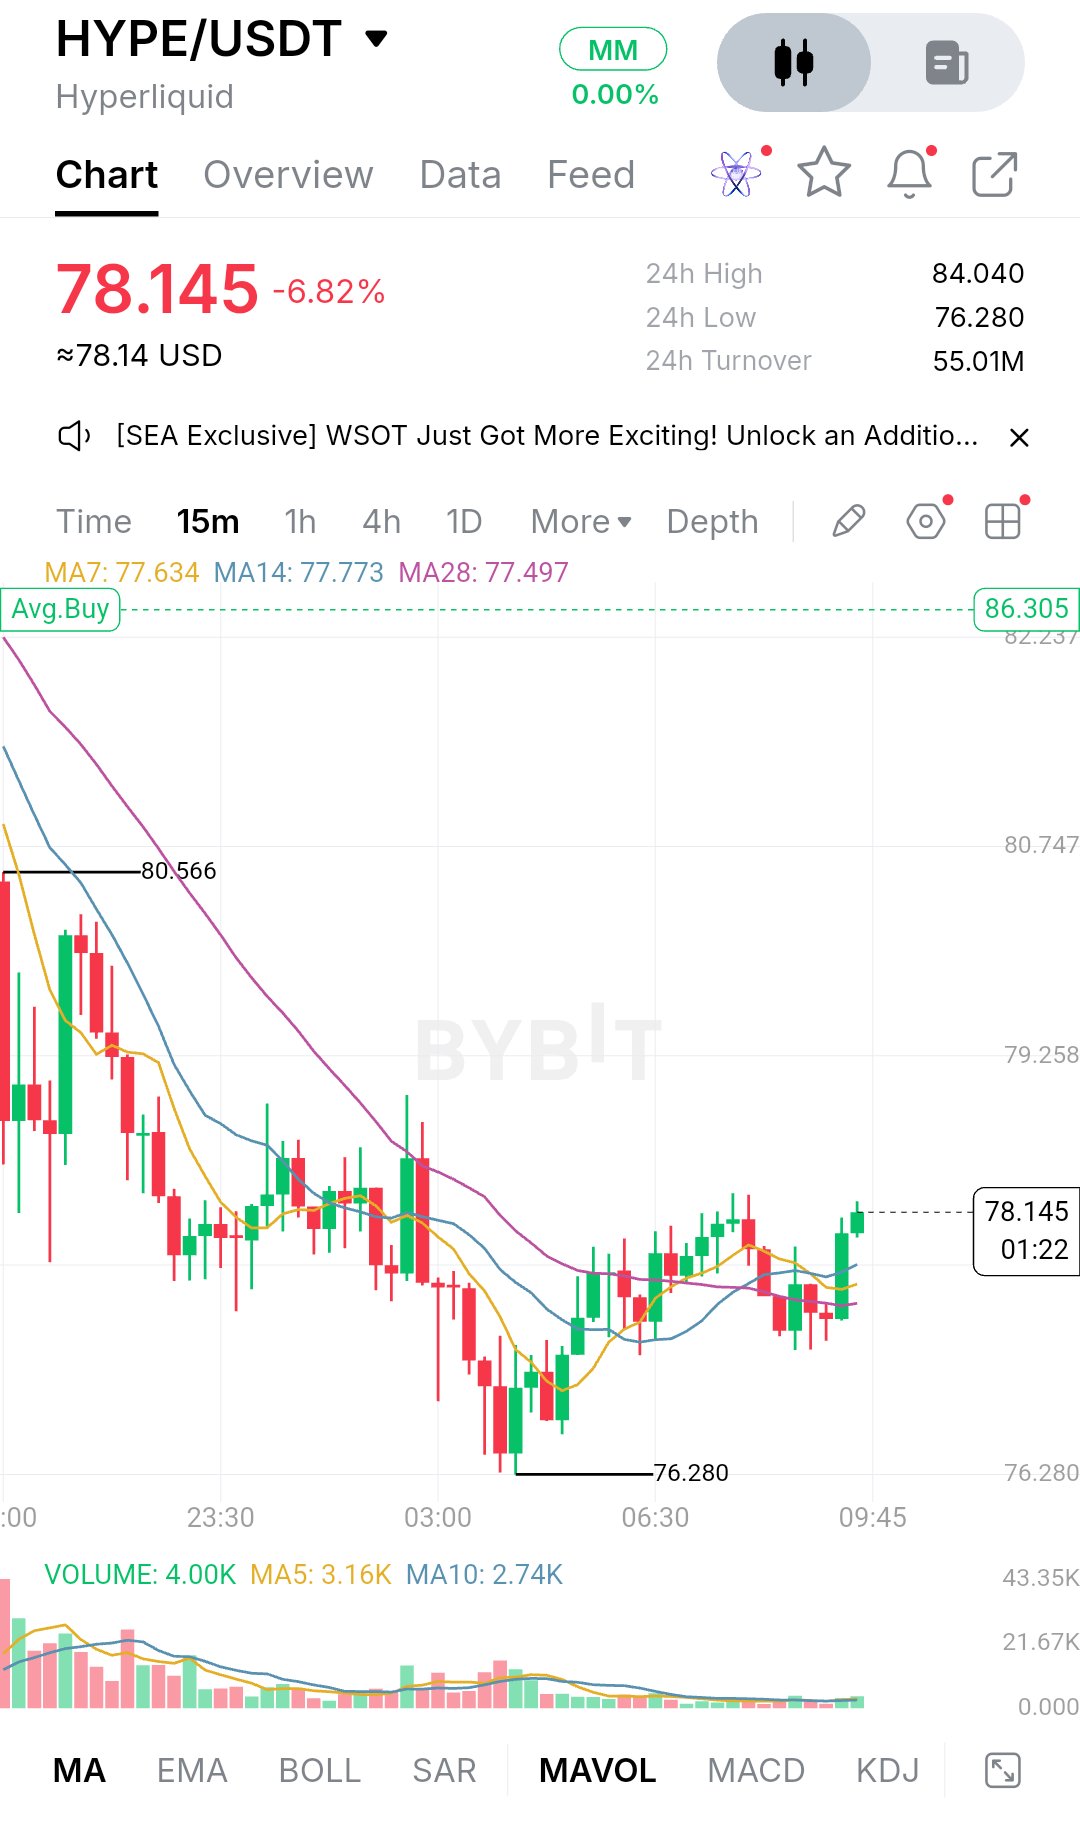
$HYPEUSDT se cotiza a 78.145, con una caída del 6.82% en las últimas 24 horas, y el movimiento cuenta una historia clara. El máximo de 24 horas se sitúa en 84.040, y a partir de ahí los vendedores tomaron el control y empujaron el precio constantemente hacia abajo hasta encontrar un suelo en 76.280. La venta fue intensa al principio, con grandes velas rojas y el mayor volumen de la sesión, y cada rebote en el camino fue aprovechado por los vendedores. El volumen de negociación ronda los 55.01M, así que fue un movimiento real, no una deriva ligera. Desde ese mínimo, el carácter del gráfico ha cambiado. El precio tocó fondo alrededor de 76.280, rebotó y ha pasado las últimas horas moviéndose de lado a ligeramente al alza, con velas superpuestas y sin nada de la agresiva tendencia bajista que vimos antes. Esto parece una base o un intento de recuperación temprana más que un cambio de tendencia. Los vendedores claramente han perdido algo de urgencia, pero los compradores aún no han tomado el mando. En el gráfico de 15 minutos, las medias móviles son la historia principal. La MA7 está en 77.634, la MA14 en 77.773 y la MA28 en 77.497, todas agrupadas justo debajo del precio actual. Después de una larga tendencia bajista en la que estaban apiladas muy por encima del precio e inclinadas hacia abajo, ahora se han aplanado y convergido. Eso es usualmente cómo se ve un mercado cuando el impulso se está reseteando. El precio ha vuelto a subir por encima de las tres, y las últimas velas verdes se están manteniendo por encima de ellas, lo cual es una señal pequeña pero real de mejora. El volumen es la parte con la que tendría cuidado. Ha disminuido mucho desde la venta masiva, con la última lectura en 4.00K frente a un promedio de 5 períodos de 3.16K y un promedio de 10 períodos de 2.74K. El ligero repunte es alentador, pero sigue estando muy tranquilo en comparación con el inicio de la sesión. La recuperación hasta ahora está ocurriendo con una participación ligera, lo que significa que no ha sido totalmente probada. Como soporte, la primera área es la zona de 77.50 a 77.80, donde están agrupadas las tres medias móviles. Si el precio retrocede y se mantiene ahí, mostraría que los compradores están defendiendo la nueva base. Por debajo de eso, la verdadera línea en la arena es 76.280, el mínimo de la sesión. Ese nivel ha sido probado y se ha mantenido una vez, y es donde los vendedores se quedaron sin fuerza. Una ruptura clara por debajo pondría en duda toda la recuperación y podría abrir la puerta a un movimiento más profundo, ya que no hay una estructura visible por debajo en este gráfico para frenar las cosas. Al alza, la resistencia más cercana es 79.258, seguida de 80.566, que fue un máximo previo y se alinea estrechamente con el nivel de 80.747 en la escala de precios. Esa área de 80 a 81 es un número redondo psicológico y una antigua zona de ruptura, por lo que esperaría que los vendedores aparecieran allí. Por encima, 82.237 es la siguiente marca, y el máximo de 24h en 84.040 es el objetivo mayor si el impulso realmente aumenta. El caso alcista es sencillo. Los compradores necesitan mantener el precio por encima del grupo de medias móviles, superar los 79.258 y luego cerrar por encima de 80.566 con volumen real detrás. Si eso sucede, un movimiento hacia 82.237 se vuelve realista, y sería posible una nueva prueba de 84.040 si la fuerza continúa. La clave es que el volumen aumente en la ruptura, no solo que el precio suba a la deriva. El caso bajista es que el precio se estanque por debajo de 79.258 o sea rechazado alrededor de 80, y luego pierda las medias móviles de nuevo. Eso convertiría este rebote en un simple rally de alivio dentro de una tendencia bajista. Una pérdida de 77.50 volvería a centrar la atención en 76.280, y una ruptura por debajo confirmaría que los vendedores siguen en control. Niveles de precio clave: - Resistencia: 79.258, 80.566, 80.747, 82.237, 84.040 - Precio actual: 78.145 - Soporte: 77.80 a 77.50 (grupo de MA), 76.280 (mínimo de la sesión) En general, HYPE ha pasado de una fuerte venta masiva a una base tranquila, y esa es la fase donde la paciencia importa más. La próxima expansión real probablemente vendrá ya sea por una ruptura respaldada por volumen por encima de 80.566 o por una ruptura de 76.280. Hasta que ocurra una de esas dos cosas, el mercado está mayormente decidiendo la dirección, así que observaría cómo reacciona el precio en las medias móviles y si el volumen comienza a aumentar, en lugar de perseguir las pequeñas velas intermedias. Nada de esto es una garantía, y los traders deben gestionar el riesgo alrededor de estos niveles. $BTCUSDT #Seguridad en Blockchain
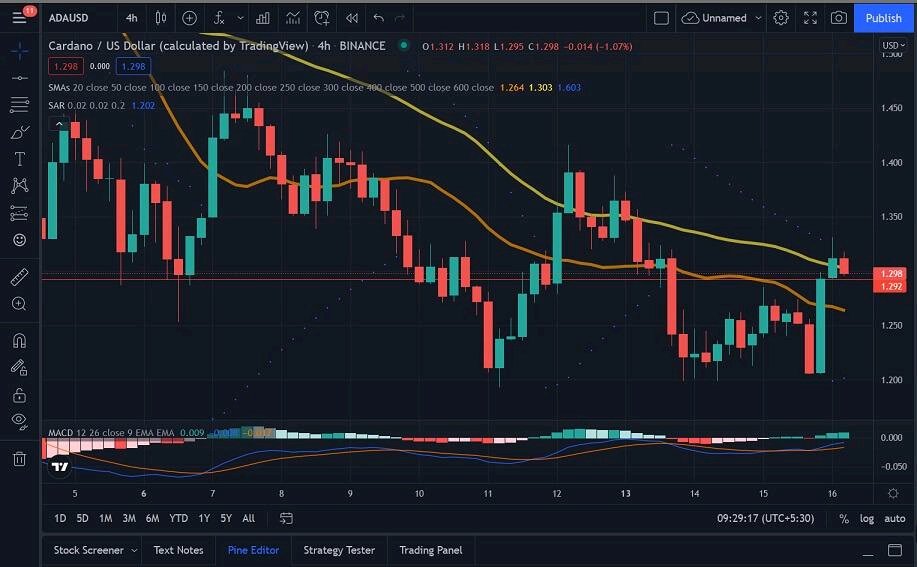
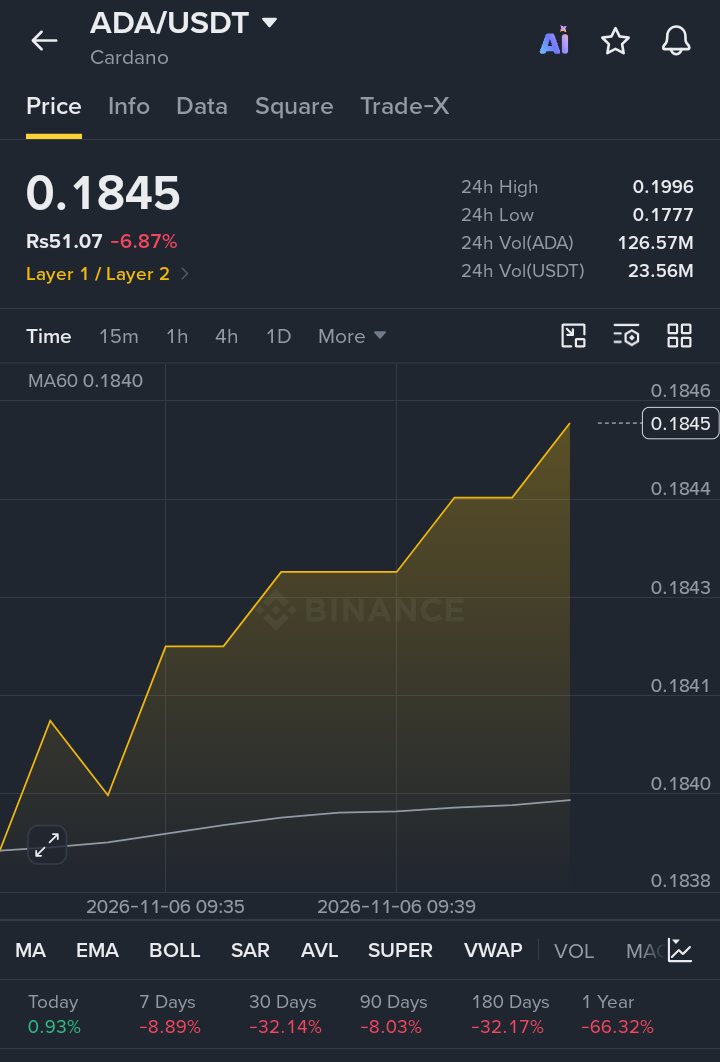
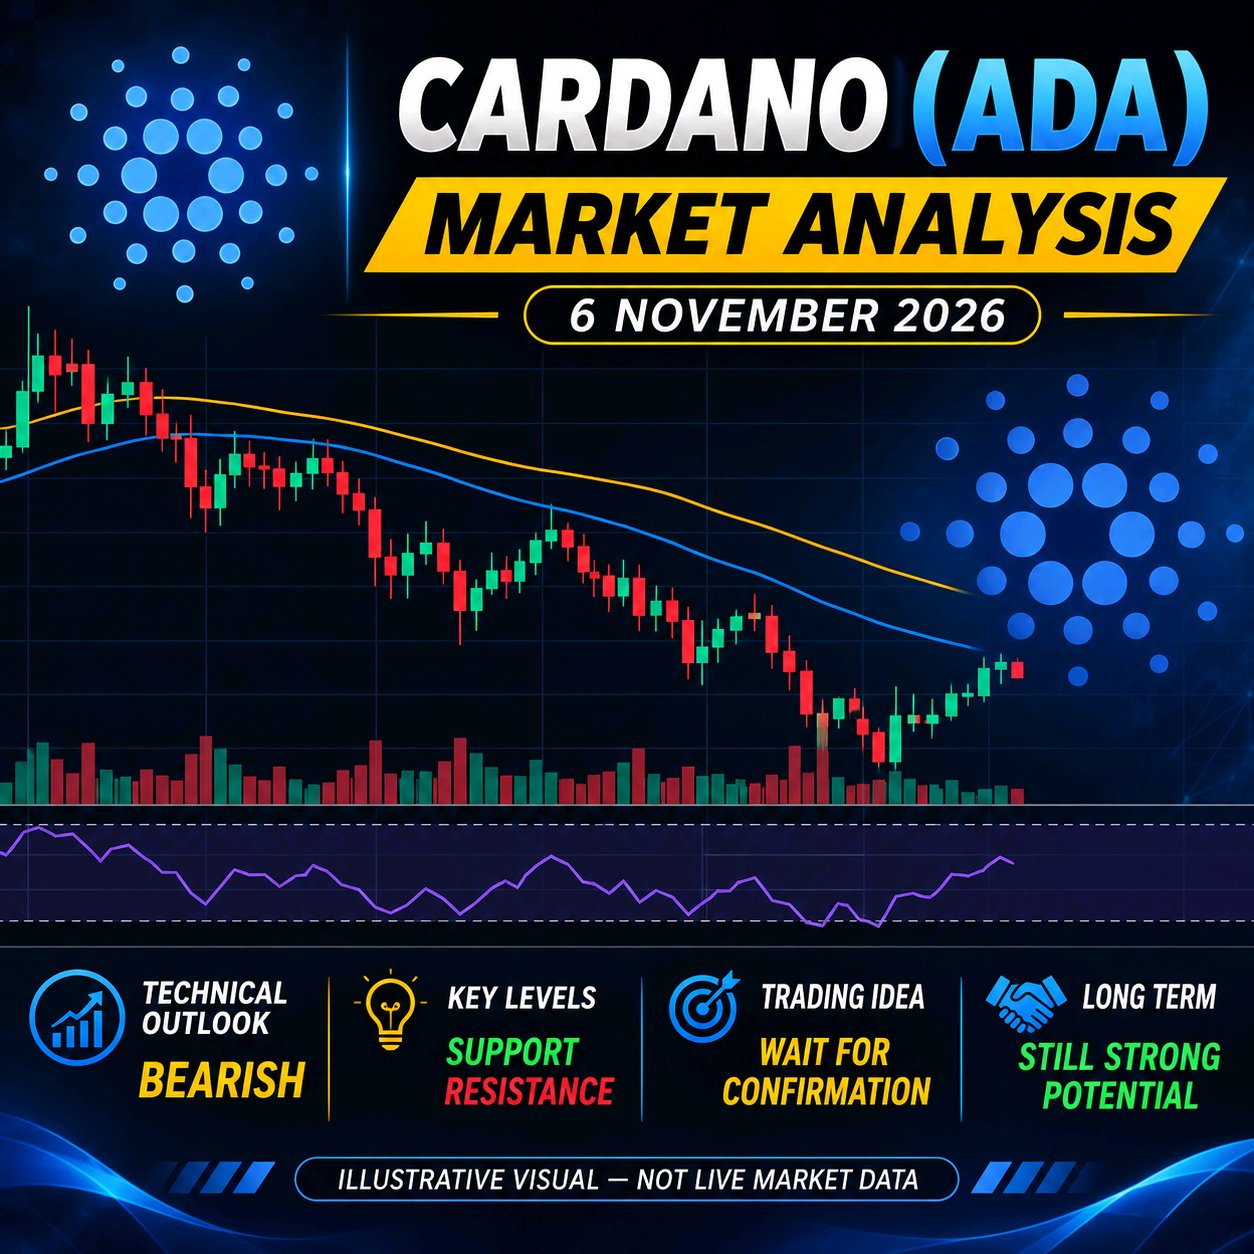
🚨 CARDANO (ADA) PRICE ANALYSIS
$ADAUSDT PRICE ANALYSIS — NOVEMBER 6, 2026 🔹 Current Price: Around $0.181–$0.185 🔹 Market Trend: Bearish 🔹 Daily RSI: Around 31–32 🔹 Market Momentum: Weak 🔹 Trading Sentiment: Sellers currently dominate. 📉 TECHNICAL ANALYSIS Cardano is facing strong selling pressure. ADA is trading below its major moving averages, indicating that the broader trend remains bearish. RSI is approaching oversold territory, which means a short-term recovery could happen, but buyers need to confirm their strength. 🔻 SUPPORT LEVELS • $0.1766 • $0.1738 • $0.1712 🚀 RESISTANCE LEVELS • $0.1885 • $0.1930 • $0.1957 📊 BULLISH SCENARIO If ADA reclaims $0.1885 with strong buying volume, the next potential targets are $0.1930 and $0.1957. 📉 BEARISH SCENARIO If ADA breaks below $0.1766, further downside towards $0.1738 and $0.1712 becomes possible. 🎯 TRADING STRATEGY Avoid rushing into long positions. Wait for a confirmed breakout, stronger volume and RSI recovery before considering a bullish entry. 🔥 FINAL VERDICT ADA remains bearish in the short term. However, oversold conditions could create a temporary relief bounce. Trade carefully and always manage your risk. #ADA #Cardano #CryptoAnalysis #BinanceSquare #Altcoins #CryptoTrading #BlockchainSecurity #MidtermsMarketWatch #USPayrollsAndRateDecisionsDriveMacroWeek #WSOTPicktoEarn10U #WSOT2026
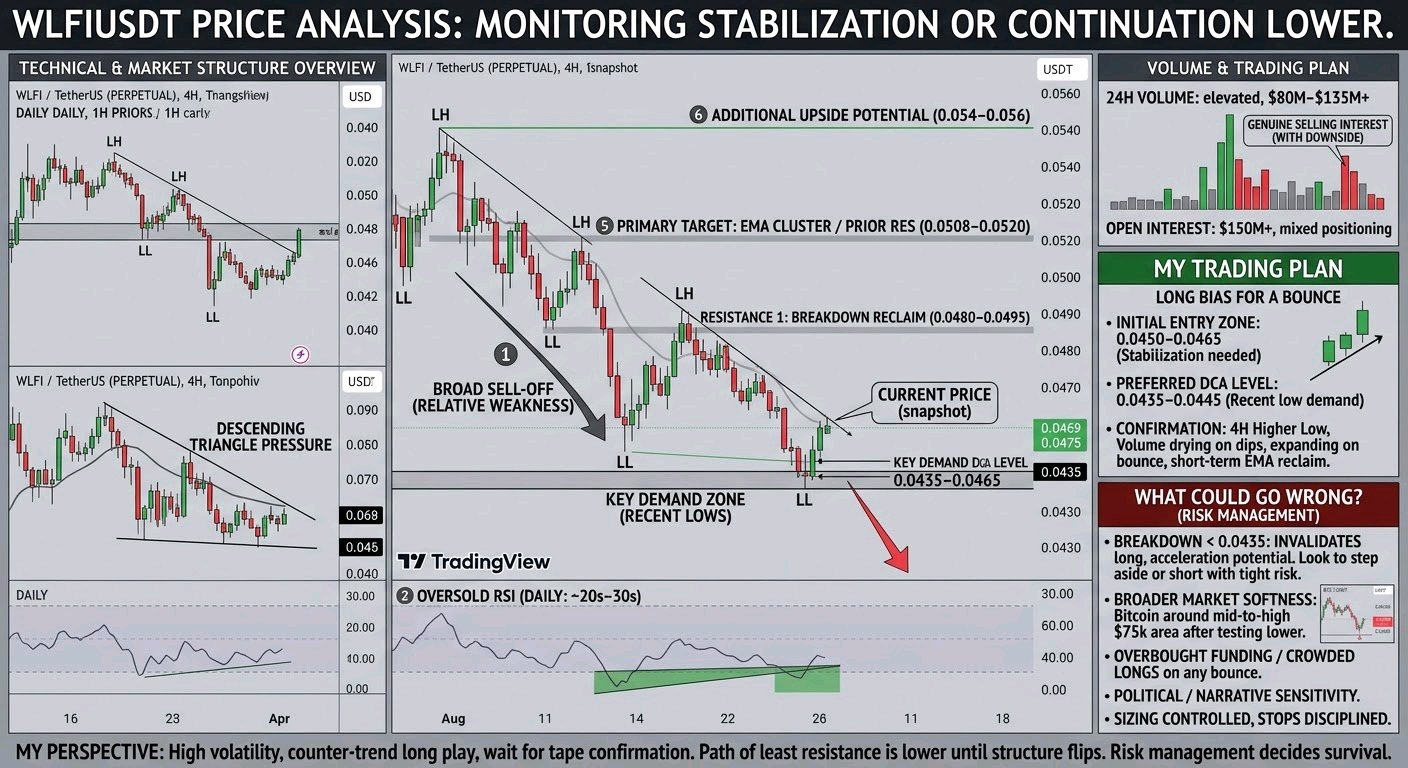
$WLFIUSDT USDT - EL PRECIO ESTÁ CERCA DE LOS MÍNIMOS RECIENTES DESPUÉS DE LA VENTA MASIVA, Y ESTOY ATENTO A UNA ESTABILIZACIÓN O A UNA CONTINUACIÓN A LA BAJA.** WLFI ha estado bajo una presión clara. Aunque Bitcoin también ha retrocedido bruscamente en las últimas sesiones (operando alrededor del área media-alta de los $75k después de probar niveles más bajos), WLFI ha mostrado una debilidad relativa, marcando nuevos mínimos de varias semanas o recientes cerca de la región de $0.0435–$0.046 y actualmente oscilando alrededor de $0.0469–$0.0475 dependiendo de la instantánea exacta. Los marcos de tiempo más altos siguen siendo bajistas: las tendencias diarias y de 4 horas son a la baja, con el precio por debajo de las EMA clave y el RSI en el gráfico diario situándose en territorio de sobreventa (de niveles bajos de 20 a mediados de 30 según las fuentes). La estructura muestra máximos más bajos y mínimos más bajos, con un tipo de presión de triángulo descendente visible en el gráfico diario en algunos análisis. En los marcos de tiempo más cortos hay algo de acción mixta e intentos ocasionales de rebote, pero la estructura general del mercado todavía favorece a los vendedores hasta que se demuestre lo contrario. El rango reciente de 24 horas ha visto máximos cerca de $0.0488–$0.0508 y mínimos alrededor de $0.0435–$0.0464. **Análisis de Volumen** El volumen de 24 horas se mantiene elevado en el rango de $80M–$135M según los informes (con algunos picos más altos), lo que lo sitúa activamente entre los pares de mediana capitalización. Esta es una participación sólida en relación con la capitalización de mercado (alrededor de $1.5B). El volumen ha acompañado los movimientos a la baja, lo que normalmente respalda la continuación o al menos muestra un interés de venta genuino en lugar de una deriva silenciosa a la baja. El interés abierto elevado en los futuros (a menudo de más de $150M) y el posicionamiento mixto de largos/cortos añaden actividad a la cinta. Una mayor participación como esta a menudo significa que el movimiento tiene convicción detrás, ya sea que eso conduzca a una caída más profunda o a un rebote de reversión a la media; eso es lo que estoy rastreando a continuación. **Mi Plan de Trading** Estoy tratando esto como un activo de alta volatilidad que puede moverse rápido en cualquier dirección desde condiciones de sobreventa, así que mantengo el tamaño controlado y los niveles claros. - **Zona de Entrada Inicial (sesgo largo para un rebote):** Buscando cerca de los niveles actuales o una caída hacia el área de $0.0450–$0.0465 si se estabiliza con mínimos más altos en el gráfico de 1h/4h. - **Nivel de DCA Preferido:** Más profundo en la zona de $0.0435–$0.0445 (mínimo reciente / área de demanda). Mantenerse y recuperar este nivel mejoraría el riesgo/recompensa para un largo contra tendencia. - **Primera Resistencia:** $0.0480–$0.0495. Aquí es donde se encuentran las rupturas anteriores y la oferta a corto plazo. Una ruptura limpia y mantenerse por encima sería la primera señal real de fortaleza. - **Objetivo Principal:** Región de $0.0508–$0.0520 (resistencia anterior / clúster de EMA). - **Potencial Adicional al Alza:** Si el momentum aumenta, el área de $0.054–$0.056 se vuelve interesante, pero eso requiere un cambio claro en la estructura primero. La confirmación para el lado largo sería la formación de un mínimo más alto en el gráfico de 4h con el volumen disminuyendo en las caídas y expandiéndose en el rebote, además de una recuperación de las EMA a corto plazo. No estoy forzando entradas; estoy esperando a que la acción del precio muestre que los compradores están interviniendo con convicción. **¿Qué podría salir mal?** El mercado en general está débil y WLFI se ha quedado rezagado. Una ruptura por debajo del mínimo reciente cerca de $0.0435 con un volumen en expansión abriría la puerta a un soporte más profundo y potencialmente aceleraría la tendencia bajista. En ese caso, la configuración para cualquier rebote largo queda invalidada, y me haría a un lado o consideraría el lado corto solo con un riesgo ajustado. Existe demanda más profunda en niveles inferiores, pero perseguir sin estructura es una forma rápida de ser liquidado. Los fondos sobrecomprados o los largos abarrotados en cualquier rebote también podrían revertirse rápidamente. La sensibilidad política o narrativa en torno a este token puede amplificar los movimientos en cualquier dirección, así que mantengo la disciplina con los stops. **Mi Perspectiva** WLFI es interesante en este momento precisamente porque ha sido vendido con fuerza hasta territorio de sobreventa mientras el volumen se mantiene activo. Esa combinación a menudo produce un rebote de alivio agudo o una limpieza final antes de que los grandes jugadores decidan la siguiente dirección. La estructura de marco temporal más alto sigue siendo bajista, por lo que cualquier largo es una operación contra tendencia hasta que veamos una ruptura clara de la tendencia bajista y la recuperación de la resistencia. Estoy observando de cerca la zona de demanda de $0.0435–$0.0465 para ver la reacción, y la resistencia de $0.048–$0.050 para ver si hay rechazo o aceptación. Expectativa general: es probable que haya más volatilidad cerca de estos mínimos. Una estabilización y un movimiento de regreso hacia los $0.050+ es posible si los compradores defienden, pero el camino de menor resistencia sigue siendo a la baja hasta que la estructura cambie. Estoy siendo paciente, operando con tamaños pequeños y dejando que el mercado confirme antes de comprometer capital. Este es el tipo de configuración donde la gestión de riesgos decide quién sobrevive al próximo movimiento. #IMPACTbyTrade #Seguridad en Blockchain #WSOT2026
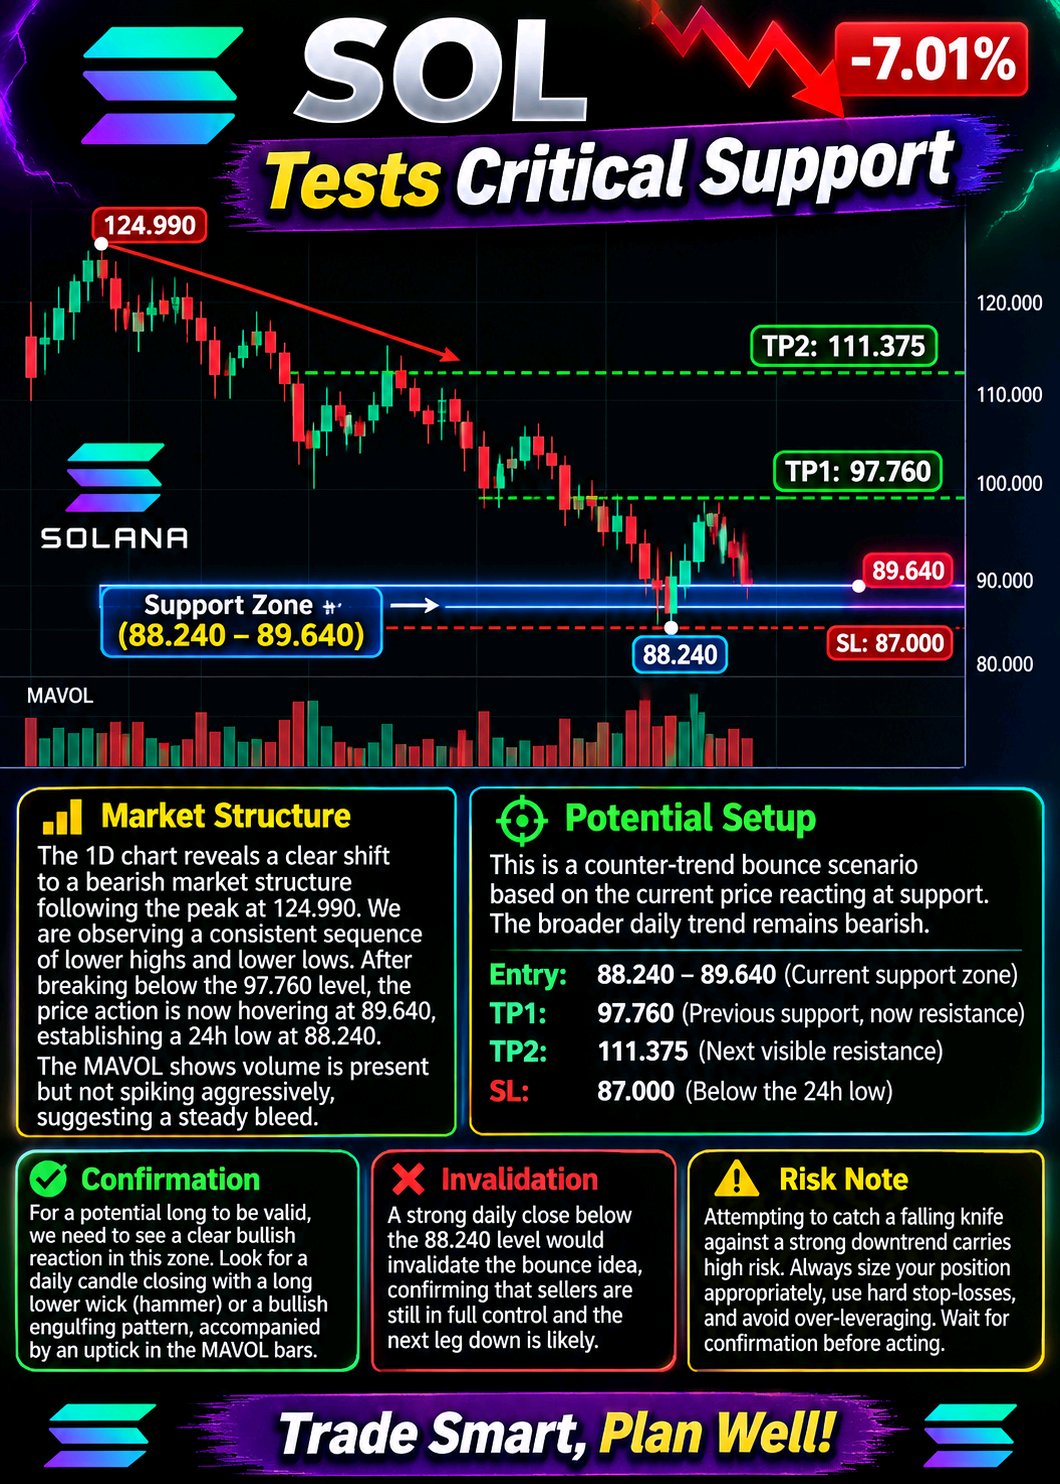
🔥 SOL Tests Critical Support
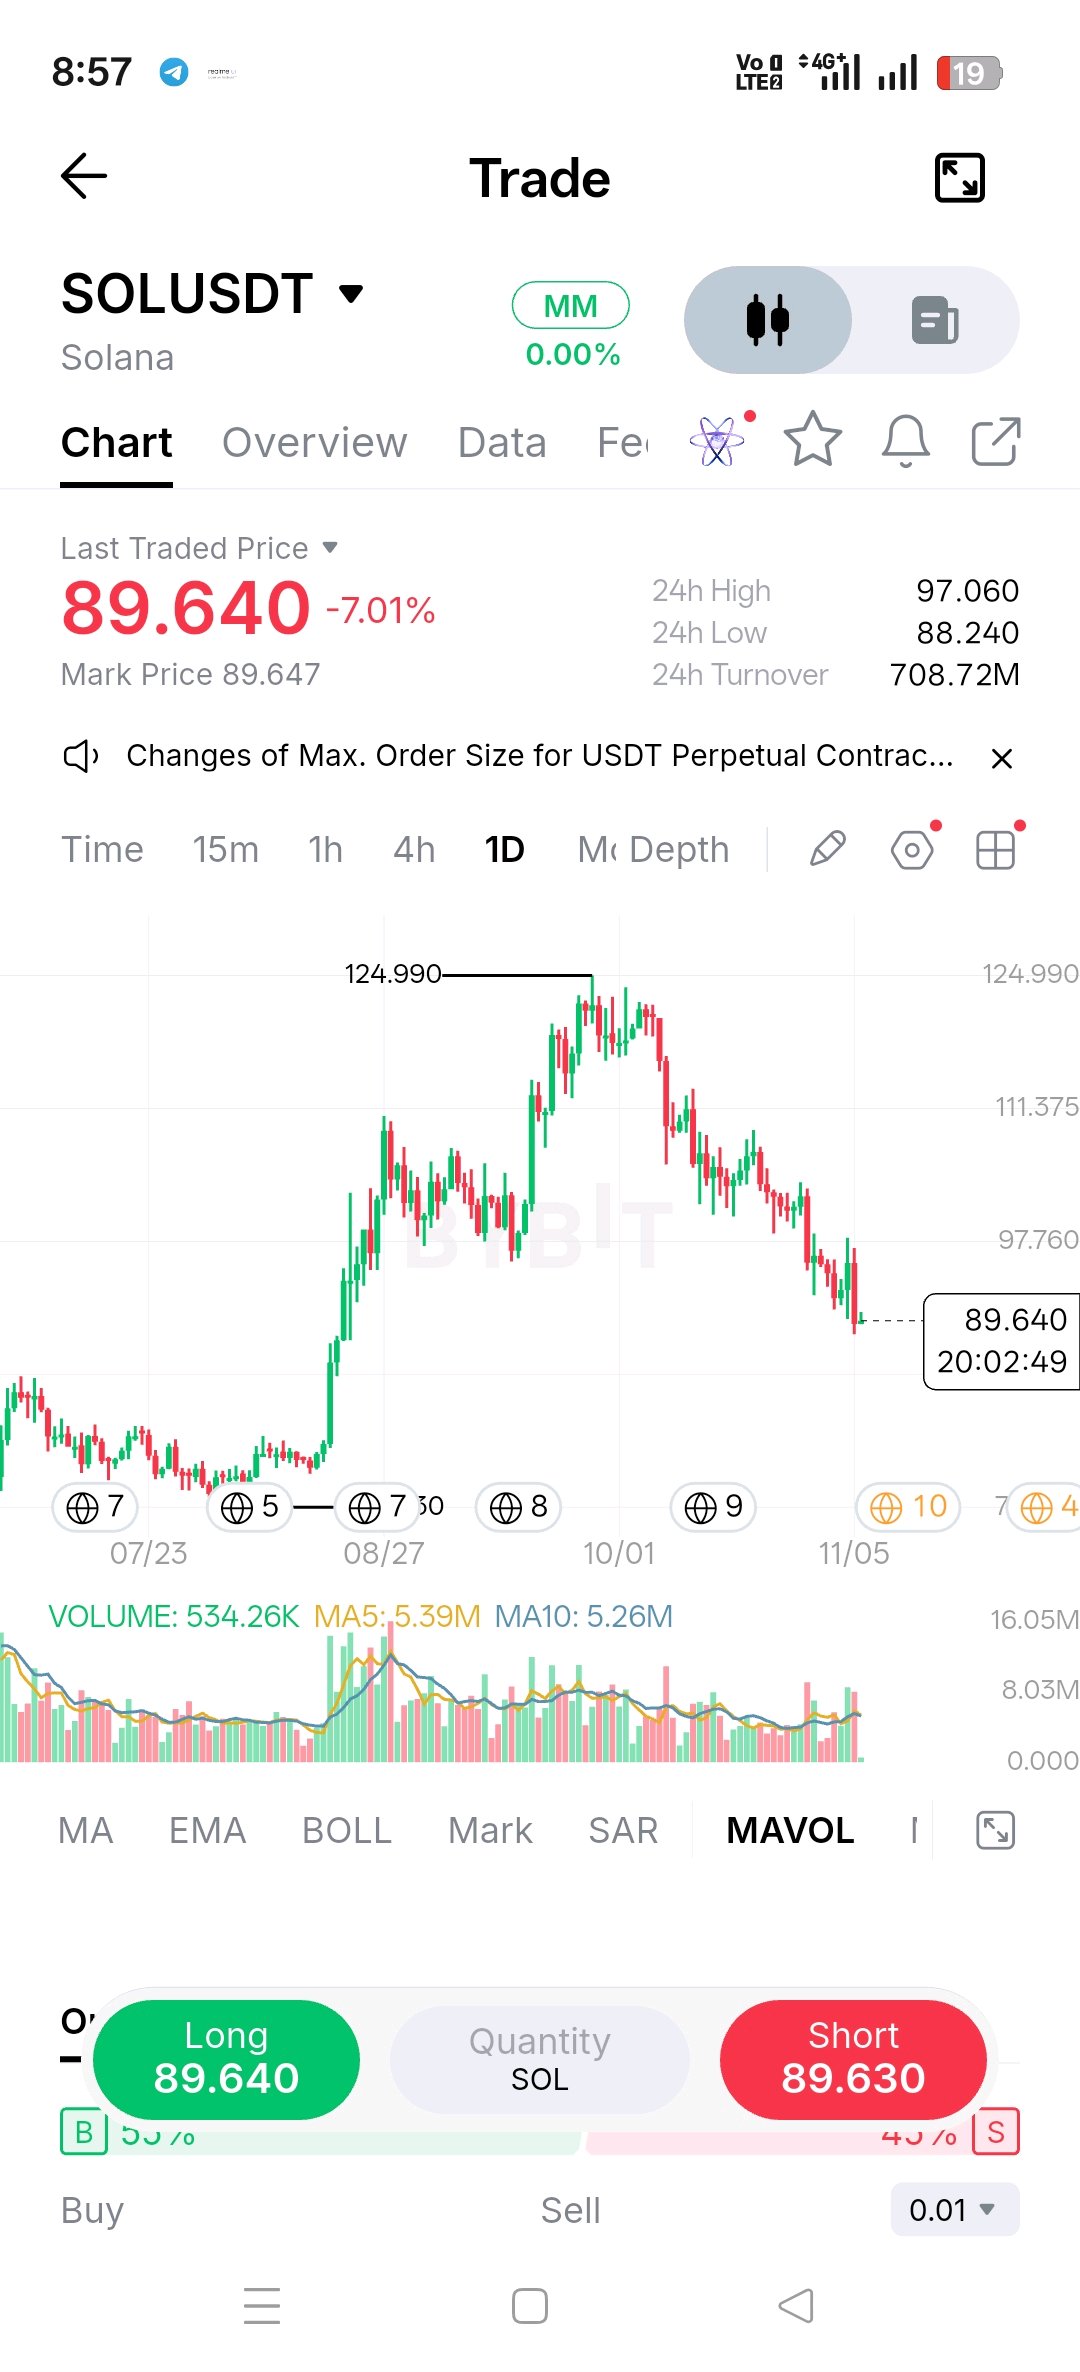
Solana is currently experiencing heavy selling pressure, printing a notable red daily candle with a -7.01% change. Price has retraced significantly from its recent highs and is now testing a critical lower boundary. 📊 Market Structure: The 1D chart reveals a clear shift to a bearish market structure following the peak at 124.990. We are observing a consistent sequence of lower highs and lower lows. After breaking below the 97.760 level, the price action is now hovering at 89.640, establishing a 24h low at 88.240. The MAVOL indicator shows volume is present but not spiking aggressively, suggesting a steady bleed rather than a capitulation event. The current zone aligns with consolidation levels seen back in early August. 🎯 Potential Setup: This is a counter-trend bounce scenario based on the current price reacting to support. The broader daily trend remains bearish. Entry: 88.240 - 89.640 (Current support zone) TP1: 97.760 (Previous support, now potential resistance) TP2: 111.375 (Next visible structural resistance) SL / Invalidation: 87.000 (Below the current 24h low to allow for slight volatility) ⚠️ Confirmation: For a potential long to be valid, we need to see a clear bullish reaction in this zone. Look for a daily candle closing with a long lower wick (hammer) or a bullish engulfing pattern, accompanied by an uptick in the MAVOL bars. ❌ Invalidation: A strong daily close below the 88.240 level would invalidate the bounce idea, confirming that sellers are still in full control and the next leg down is likely. 🧠 Risk Note: Attempting to catch a falling knife against a strong downtrend carries high risk. Always size your position appropriately, use hard stop-losses, and avoid over-leveraging. Wait for confirmation before acting. #ByXIMPACT $BTCUSDT #BlockchainSecurity #WSOTPicktoEarn10U
₿ BITCOIN (BTC) ÚLTIMO ANÁLISIS DE MERCADO
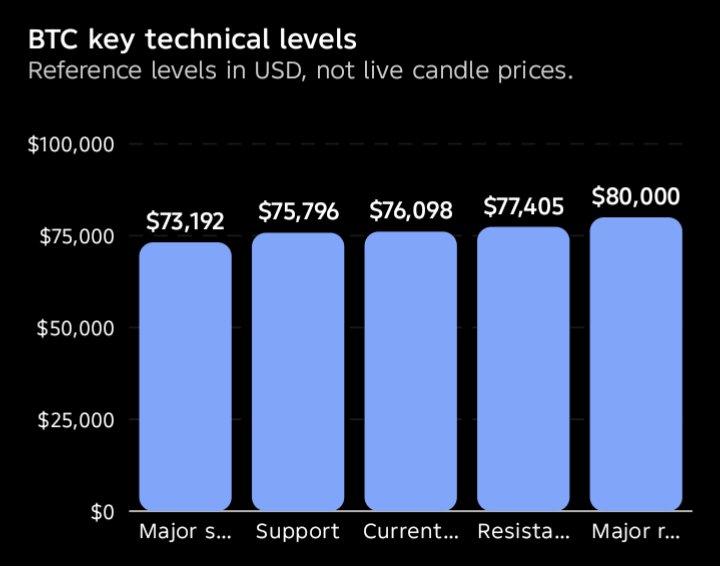
$BTCUSDT última actualización 📅 6 de noviembre de 2026 💰 Precio actual: Aproximadamente $76,098 📊 PANORAMA DEL MERCADO Bitcoin muestra presión bajista a corto plazo tras haber tenido dificultades para mantener su reciente recuperación. Los compradores intentan defender la zona de soporte de $75,796, mientras que los vendedores permanecen activos alrededor de los $77,405. 🔍 NIVELES TÉCNICOS CLAVE 🟢 Soporte 1: $75,796 🟢 Soporte principal: $73,192 🔴 Resistencia 1: $77,405 🔴 Resistencia principal: $80,000 📉 INDICADORES TÉCNICOS • RSI (14): Alrededor de 39 • Impulso a corto plazo: Bajista • Estructura del mercado: Débil • Presión de compra: Necesita confirmación 🚀 ESCENARIO ALCISTA Si BTC rompe por encima de los $77,405 y confirma la ruptura con un volumen fuerte, el próximo objetivo potencial es $80,000. 🐻 ESCENARIO BAJISTA Si Bitcoin pierde los $75,796, la presión de venta podría aumentar, impulsando potencialmente a BTC hacia los $73,192. 🎯 MI PERSPECTIVA DE MERCADO Bitcoin se encuentra actualmente en una zona crítica. Los traders deben vigilar de cerca el soporte de $75,796 y la resistencia de $77,405 antes de entrar en cualquier posición. ⚠️ Utilice siempre una gestión de riesgos adecuada. Evite el trading emocional y el apalancamiento excesivo. #Seguridad en Blockchain #BybitIAEvolucionando #Oracle20BPlanDeFinanciamientoPruebasElComercioIA #Las nóminas de EE. UU. y las decisiones sobre tasas impulsan la semana macro #Bitcoin #BTC #AnalisisCrypto #Binance #TradingCrypto #BTCUSDT
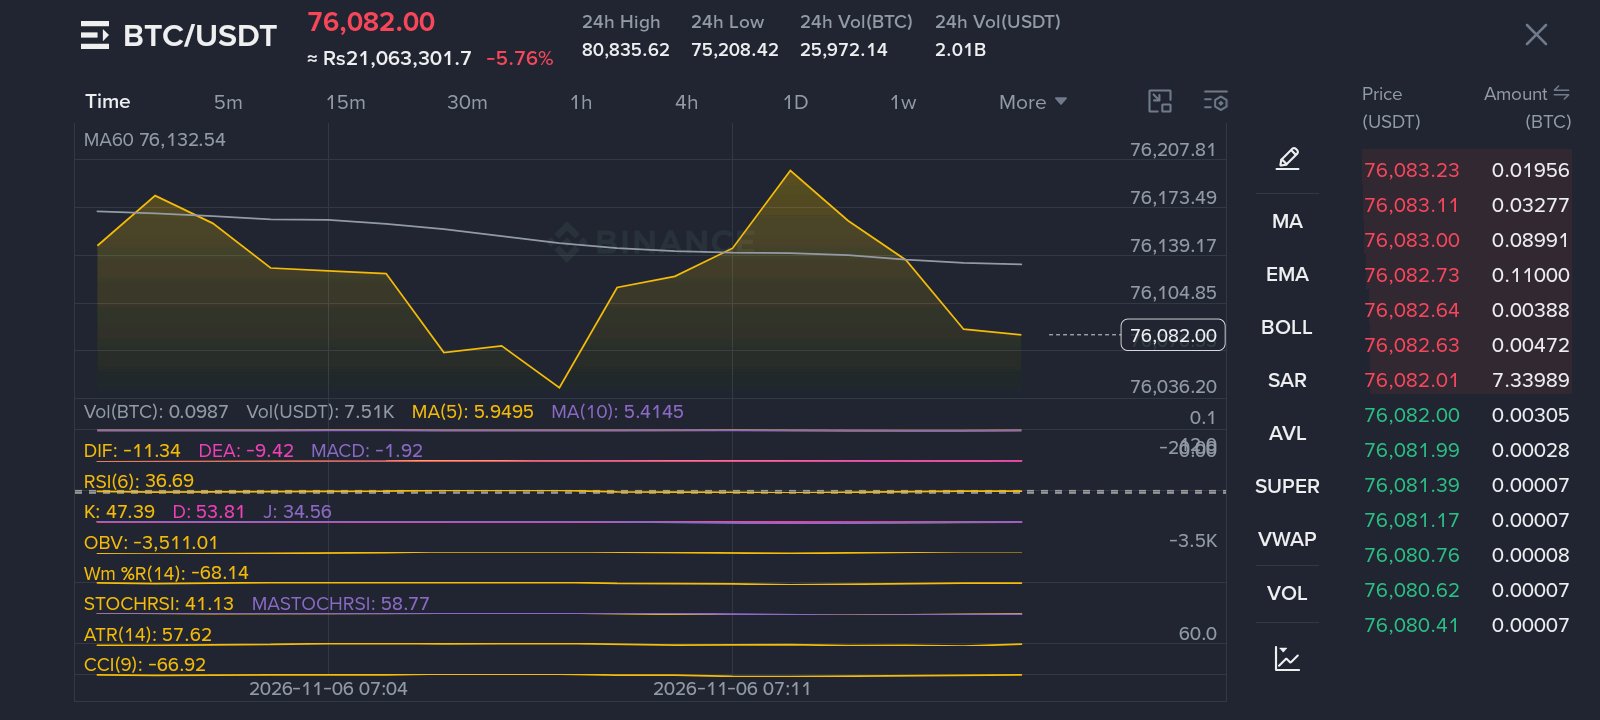
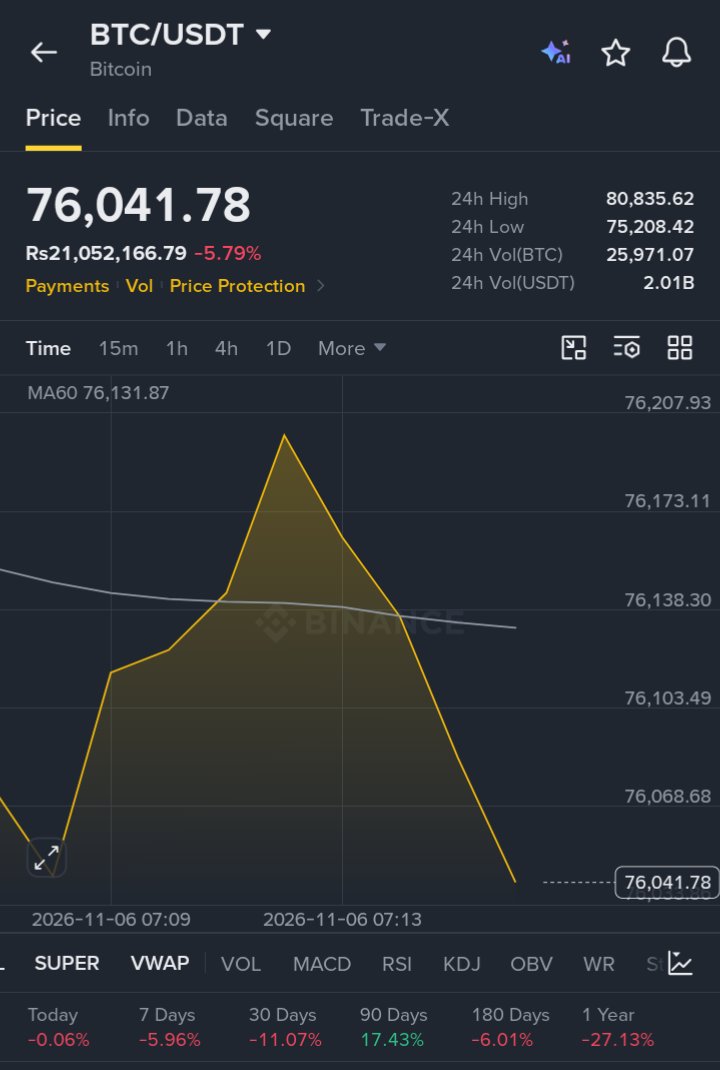

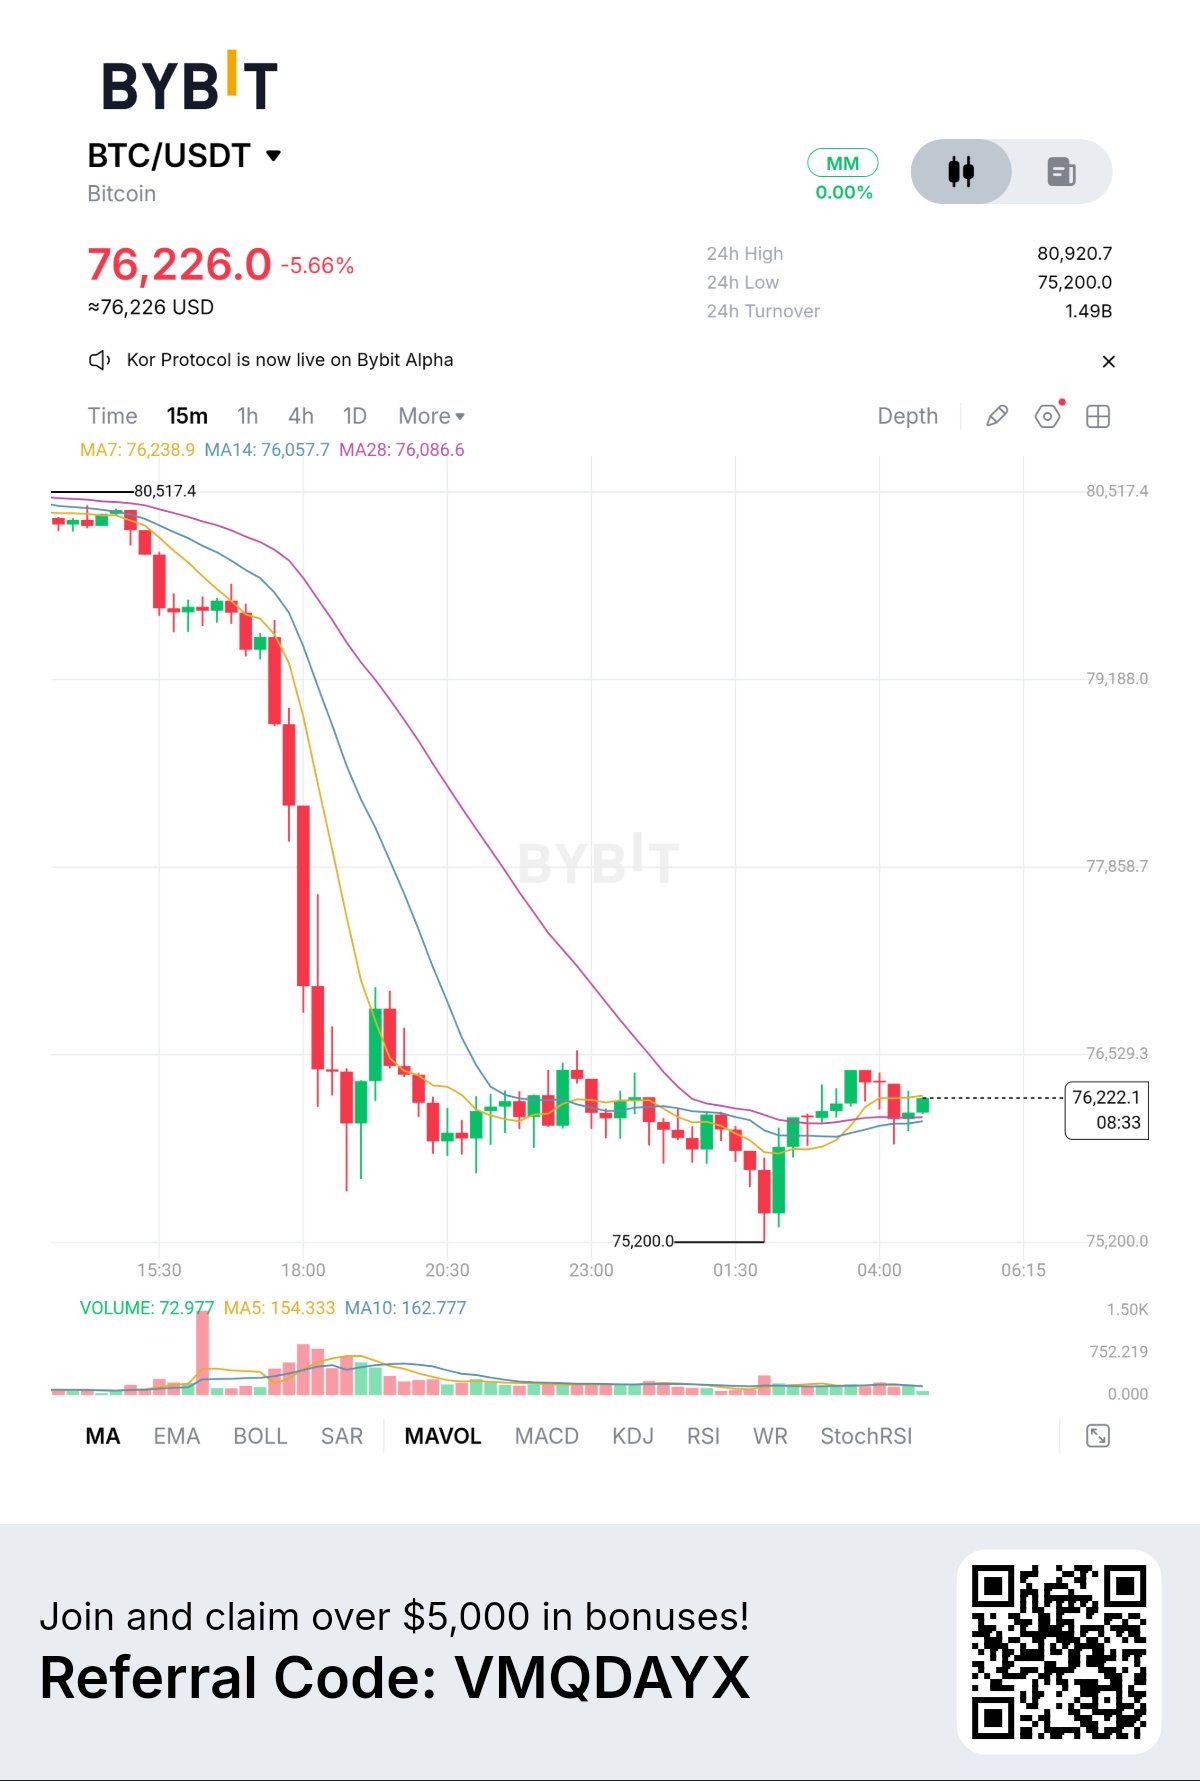
I'm watching $BTCUSDT around $76,021, and what stands out to me is how quickly the market has shifted from holding higher levels to trading below all three major moving averages on the 6H chart. MA7 is around $78,536, MA14 near $77,975, and MA28 around $77,820. That tells me buyers still have some work to do before I can consider the short-term structure healthy again. The recent selling pressure is clear, but I'm not interested in chasing a move simply because the candles look bearish. I'm focusing on the $75,200 area because it marks the recent 24H low and sits close to the lower Bollinger Band around $75,094. If sellers push price into that zone, I want to see how BTC reacts. A clean breakdown with expanding volume would make me cautious about further downside, while a strong rejection could open the door for a recovery attempt. On the other side, I want to see BTC reclaim the $77,800-$78,500 region before taking any bullish setup seriously. Momentum is still weak, with KDJ showing K at 32.8, D at 49.92, and J below zero. Volume also needs attention: current volume is around 1.07K, below both volume averages near 3.98K and 3.85K. I don't see enough confirmation yet to trust a reversal. For now, I'm waiting for either a convincing support reaction or a proper breakdown with volume confirmation. No forced entries, no guessing the bottom, and no chasing a relief bounce. BTC is giving me levels to watch, but not yet a setup worth taking. My current position is simple: WAIT. #WSOT2026 #BlockchainSecurity #WSOTPicktoEarn10U $BTCUSDT $ETHUSDT

🚨 Trezor aumentó de 50 a 128 caracteres el límite de sus frases de contraseña en cuatro modelos de dispositivos. La actualización busca reforzar la protección de las billeteras de bitcoin frente a intentos de acceso no autorizado. #BybitIAEvolucionando #Seguridad en Blockchain $SOLUSDT


Trump declaró que acepta los resultados
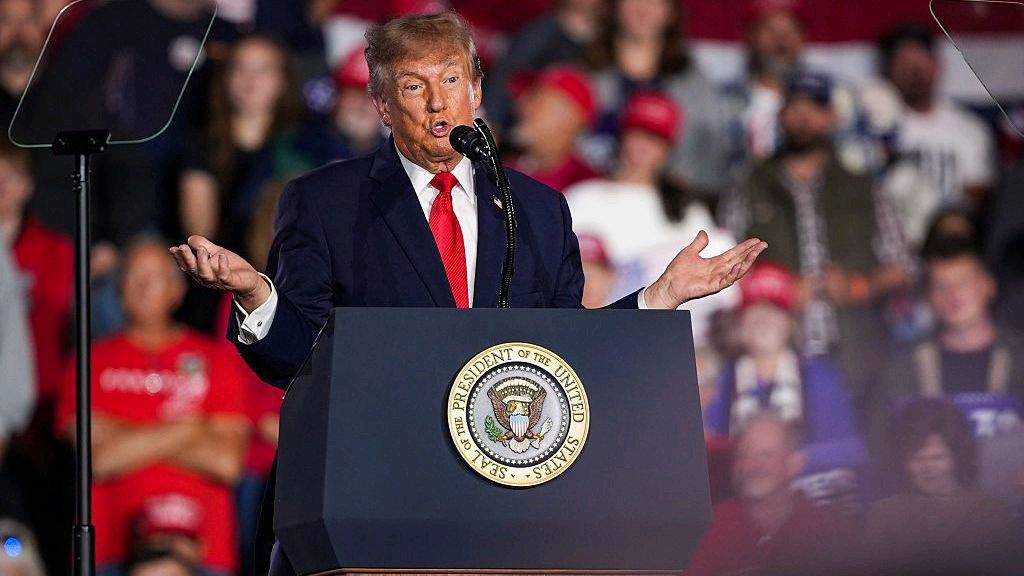
TRUMP y $BNBUSDT bajo la lupa mientras los titulares de las elecciones intermedias de EE. UU. sacuden el mercado Trump declaró que acepta los resultados de las elecciones intermedias de EE. UU. y está preparado para trabajar con los demócratas que han tomado el control de ambas cámaras del Congreso, según el rastreador en vivo del WSJ. Al mismo tiempo, escribió en Truth Social: "¡Yo no estaba en la boleta, pero si lo hubiera estado, habríamos ganado por una victoria aplastante!" Lo que muestra el rastreador en sus capturas de pantalla a la 1:26 AM, fuente AP vía WSJ. CÁMARA: 188 Dem, ganaron 13 vs 110 Rep, perdieron 13, 218 escaños para la mayoría. SENADO: 52 Dem, ganaron 6 vs 40 Rep, perdieron 6, 51 escaños para la mayoría. El mapa muestra que todavía hay reportes mixtos entrando, así que es un conteo en vivo, no el resultado final certificado. Por qué vigilo esto para las cripto: las elecciones intermedias siempre traen volatilidad. TRUMP es el beta meme para los titulares de Trump; sube y baja con fuerza según las publicaciones en Truth Social. $BNB es el beta del mercado y la moneda del ecosistema de Binance; cuando los titulares políticos afectan el sentimiento de riesgo, se mueve con $BTC. No voy a perseguir una vela verde basándome solo en el titular. Para TRUMP, el área de $0.03000 que fue el máximo de 24h en otros rastreadores de memes es la primera resistencia; el soporte es el mínimo del día alrededor de la zona de $0.02632, donde $Q también rebotó hoy. Para $BNB, vigilen el nivel de $76,648; si BTC mantiene el mínimo de 24h de $76,171, las alts tendrán un rebote de alivio, si rompe $75,736, las alts se desploman de nuevo. Mi plan es sencillo, nada de ponerse en largo en la cima por las noticias. Espero un retroceso y confirmación. Si TRUMP se mantiene por encima de $0.02810 y recupera los $0.02869 con volumen, opero en largo hacia los $0.02970 y $0.03000 con stop por debajo de $0.02632. Si el titular pierde fuerza y el precio cierra por debajo de $0.02730, me hago a un lado. Solo arriesgo del 1 al 2%, las operaciones basadas en noticias son rápidas y pueden revertirse. ¿Creen que el hecho de que los demócratas mantengan ambas cámaras es alcista o bajista para la regulación y el impulso de las cripto? Toca $TRUMPUSDT para operar esta volatilidad electoral @BybitX @Bybit Learn @612 Ceros @SignalX @Demon - Trader @GhostWriter @VietnexusCrypto @PRADO @IBLOLO @Crypto BOSS #trump #Las nóminas de EE. UU. y las decisiones sobre tasas impulsan la semana macro #Observatorio del Mercado de Elecciones de Medio Término #Seguridad en Blockchain #WSOT2026 #La volatilidad del petróleo sigue las conversaciones de paz con Irán

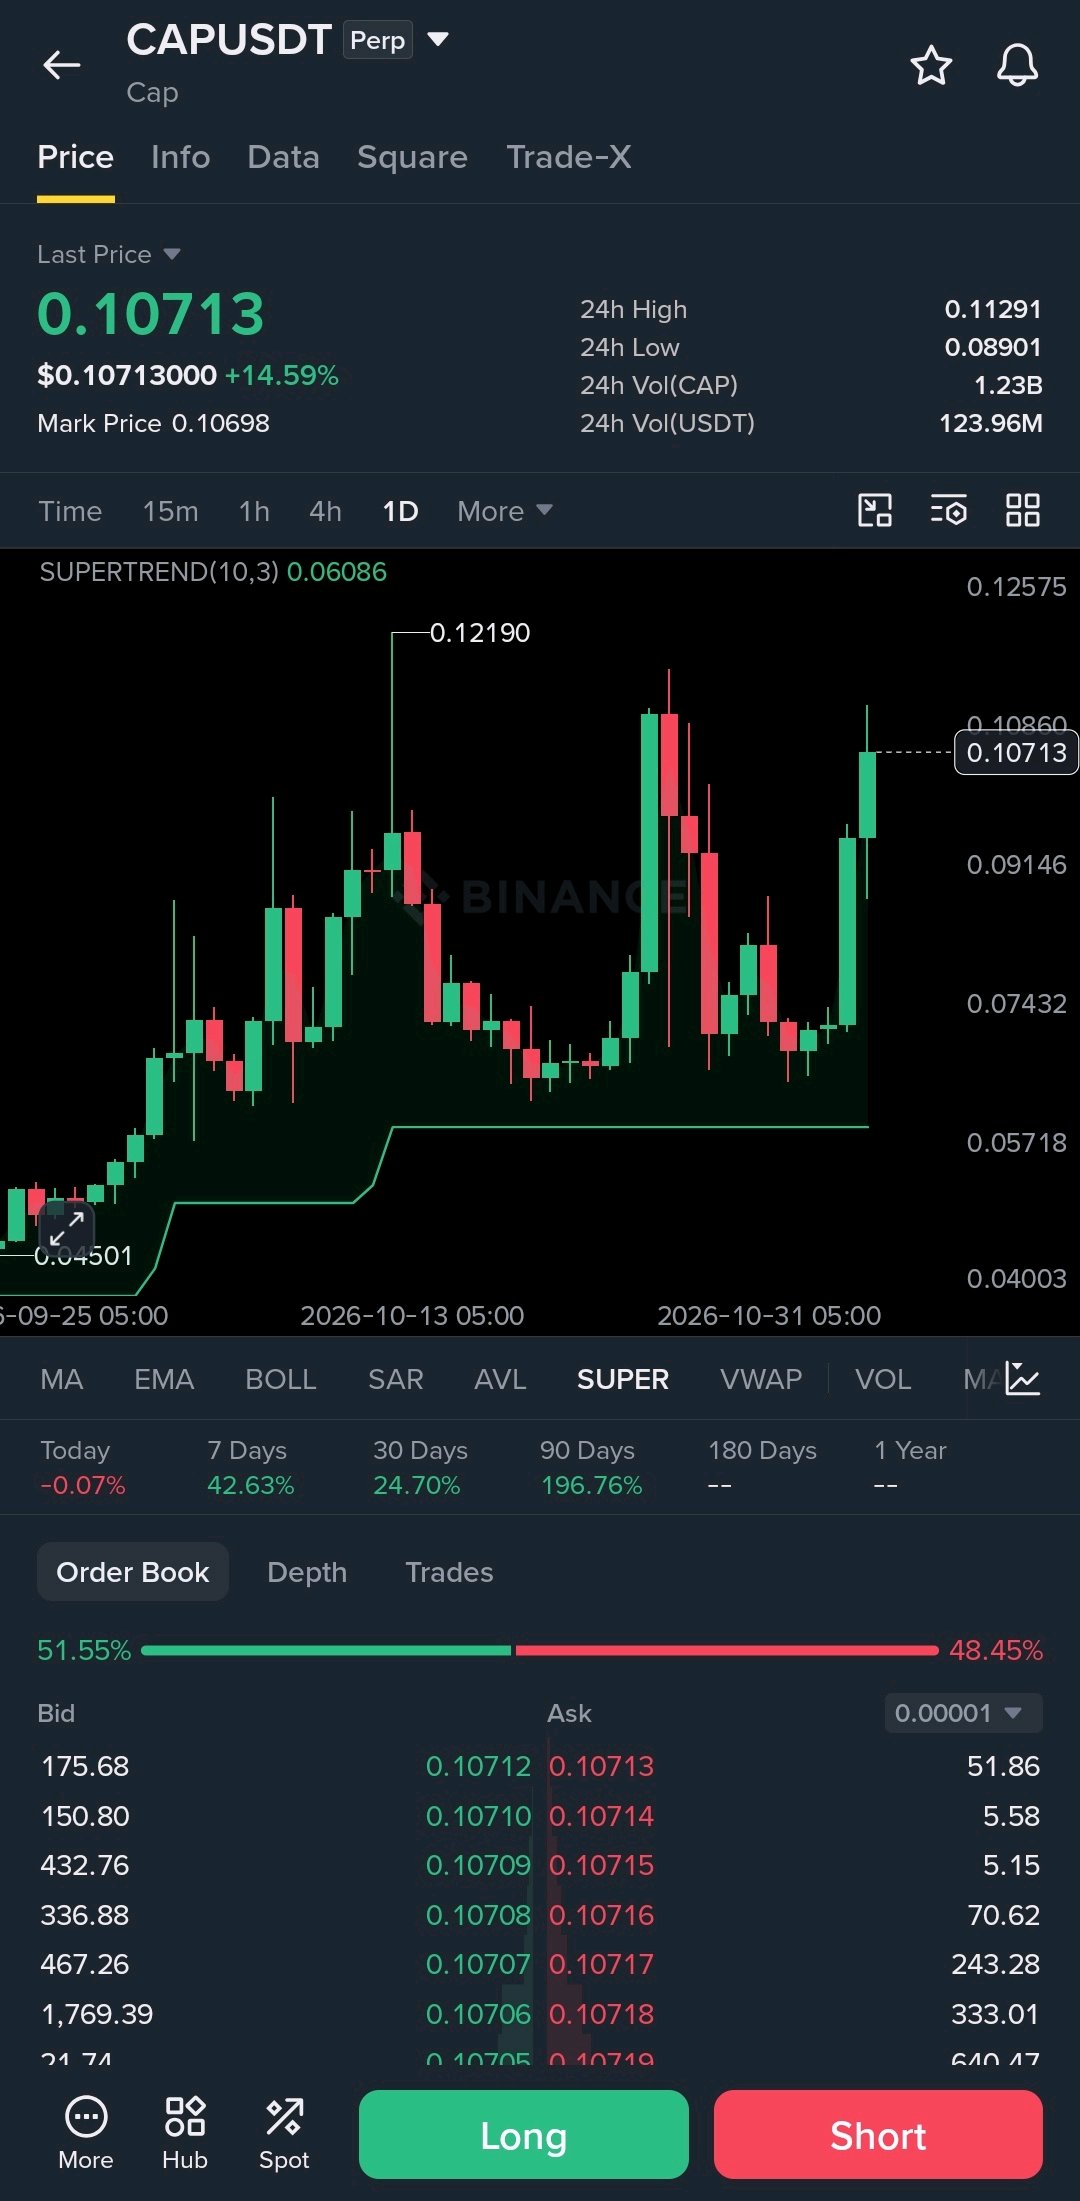
$CAPUSDT está construyendo una estructura alcista sólida, y los compradores claramente tienen el control de nuevo. El precio ha subido a $0.1071 tras recuperar el área de $0.09. El Supertrend diario se mantiene alcista en $0.06086, mientras que el impulso ahora pone el máximo anterior en el punto de mira. Niveles clave a vigilar: Soporte: $0.091–$0.089 Resistencia a corto plazo: $0.1129 Resistencia importante: $0.1219 Soporte de tendencia: $0.0608 Una ruptura clara por encima de $0.1129 podría preparar el terreno para volver a probar los $0.1219. Si los compradores no logran mantener los $0.089, un retroceso más profundo es posible. CAP está mostrando una fuerza relativa impresionante. El siguiente reto es convertir este impulso en una ruptura confirmada. #Oracle20BPlanDeFinanciamientoPruebasElComercioIA #Seguridad en Blockchain
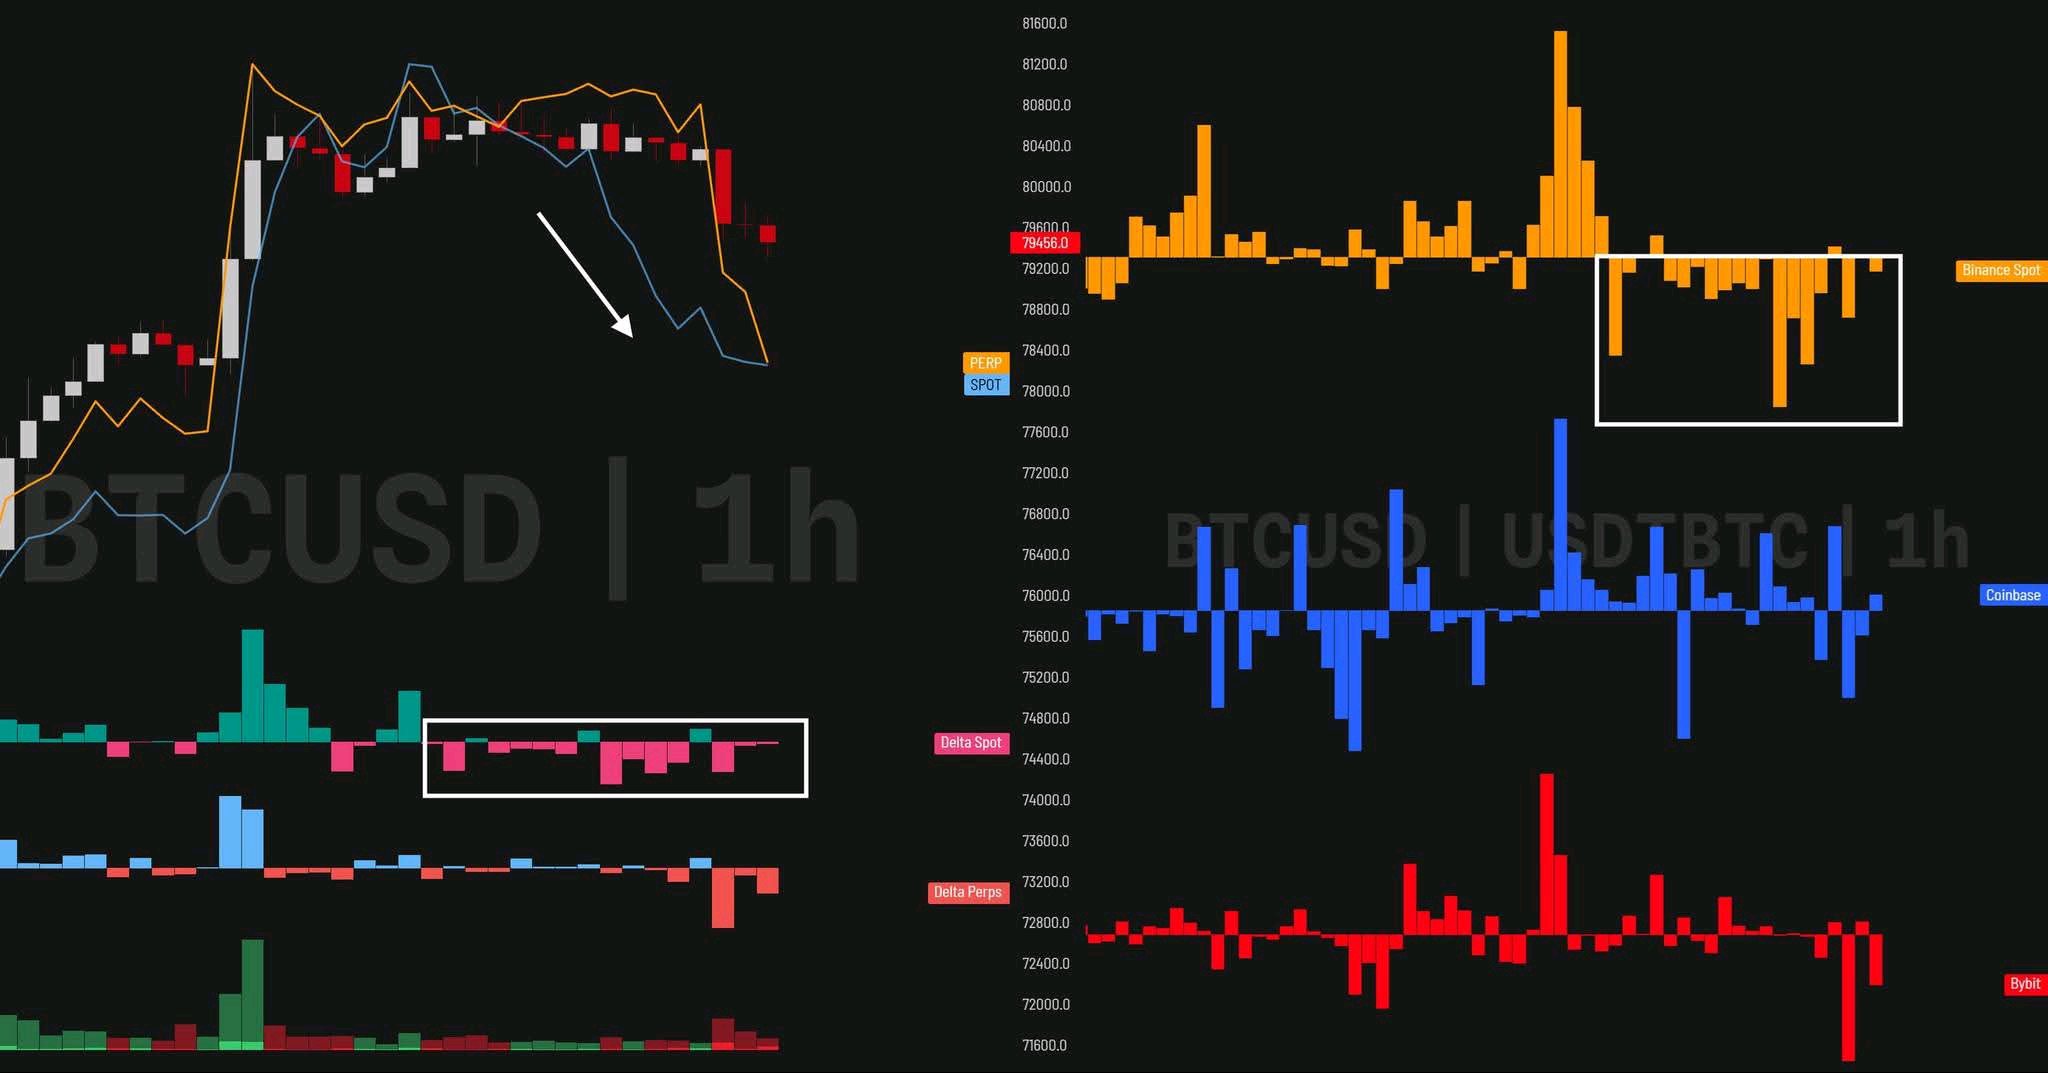
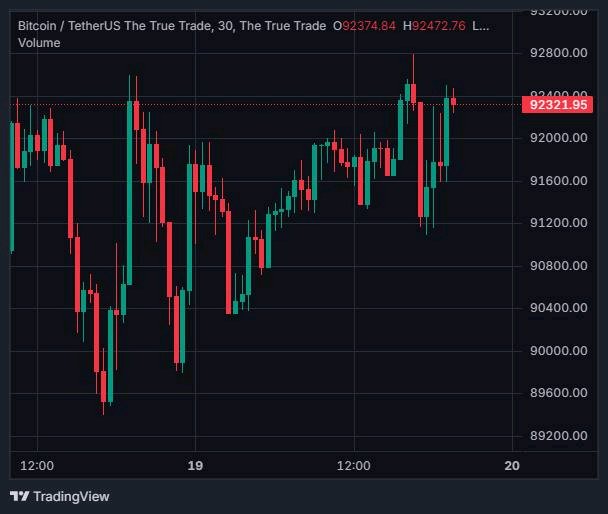
$BTCUSDT El volumen en spot disminuye mientras el precio baja lentamente. No es bajista, solo es normal después de una subida de 76k ➜ 80k. Sigo dentro desde los $76k Buscando comprar más en 78-79k Invalidación sin cambios #Seguridad en Blockchain #Las nóminas de EE. UU. y las decisiones sobre tasas impulsan la semana macro #WSOTPicktoEarn10U #WSOT2026 #BybitIAEvolucionando $MNTUSDT
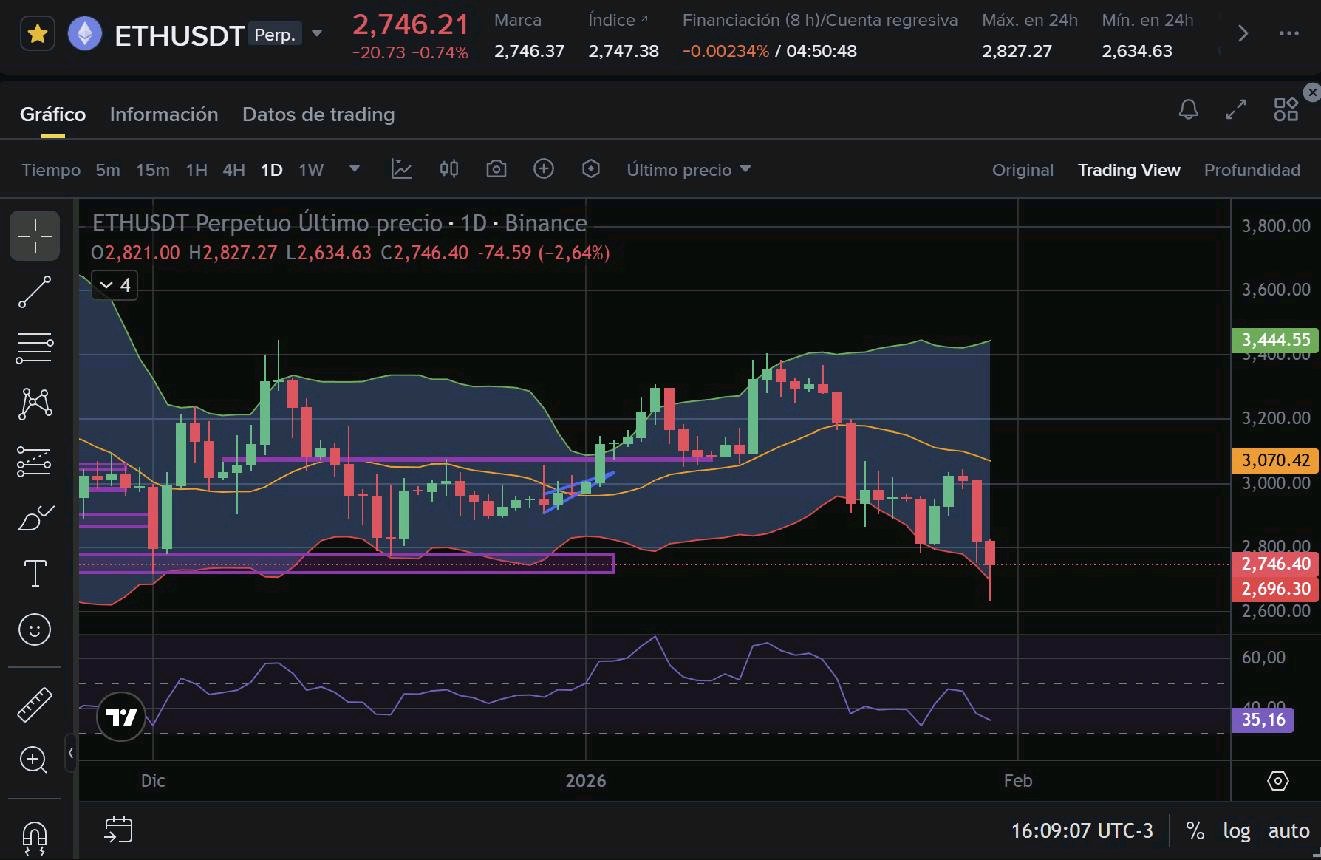
🚨 ETHEREUM (ETH) LIVE MARKET ANALYSIS
$ETHUSDT (ETH) MARKET UPDATE 📊 ETH/USDT – Market Outlook Ethereum is showing mixed market signals, with short-term bullish momentum on the 4-hour chart but a bearish trend on the daily timeframe. 💰 Latest Retrieved Price Snapshot: $2,286 📉 24H Change: -6.11% 🔍 Key Support Levels - $2,238 - $2,227 🎯 Key Resistance Levels - $2,321 - $2,330 - $2,452 📈 Bullish Scenario: If ETH breaks above $2,330 and maintains momentum, buyers could push the price toward higher resistance zones. 📉 Bearish Scenario: If ETH loses the $2,227 support zone, further downside pressure may develop. 📊 Market Sentiment: Short-term: Mixed / cautiously bullish Daily trend: Bearish 💡 Trading Strategy: Wait for a confirmed breakout or breakdown before entering a trade. Avoid chasing sudden price movements. ⚠️ Always use proper risk management. This analysis is for educational purposes, not financial advice. #ETH #ETHUSDT #CryptoAnalysis #Binance #Trading #CryptoMarket #WSOT2026 #USPayrollsAndRateDecisionsDriveMacroWeek #BybitAIEvolving #BlockchainSecurity

$XAUTUSDT Gold Shows Strong Recovery as Investors Watch Global Economic Developments Gold is gaining attention again as changing market expectations and movements in the US dollar influence precious metals. The $4,200 level is an important area to watch. A sustained move above this resistance could strengthen bullish momentum, while rejection may bring another period of consolidation. Gold remains an important asset to watch amid global economic uncertainty. Stay focused on market confirmation and manage your risk. #Gold #XAUUSD #GoldTrading #PreciousMetals #MarketNewsBinance Continues Security Recovery and Strengthens User Confidence Binance is making further progress with its security recovery efforts, including updates on asset withdrawals and platform protection. Security remains one of the most important factors for any crypto exchange. These developments highlight the importance of transparency, user protection, and stronger security systems across the crypto industry. The crypto community will be watching Binance's next updates closely. #BlockchainSecurity #Oracle20BFundingPlanTestsTheAITrade #MidtermsMarketWatch #AnthropicIPOTestsTheAIBoom #BOERateDecision $BTCUSDT
Bitcoin Shows Recovery Strength as Market Volatility Continues $BTCUSDT Bitcoin is showing signs of recovery after facing strong selling pressure. The market is trying to regain bullish momentum, while investors are closely watching the $82,000 resistance zone. ETF inflows and short liquidations are adding some support to the recovery. However, bulls still need a strong breakout to confirm the next upward move. The coming sessions could be important for Bitcoin's direction. Stay patient, manage risk, and watch key levels. #BlockchainSecurity #Oracle20BFundingPlanTestsTheAITrade #MidtermsMarketWatch #AnthropicIPOTestsTheAIBoom #BybitAIEvolving

$BTCUSDT looks interesting i suggest buy buy buy as much you can this last chance before 90k I'm bullish I'm opening #WSOT2026 #USPayrollsAndRateDecisionsDriveMacroWeek #BybitAIEvolving #AnthropicIPOTestsTheAIBoom #BlockchainSecurity
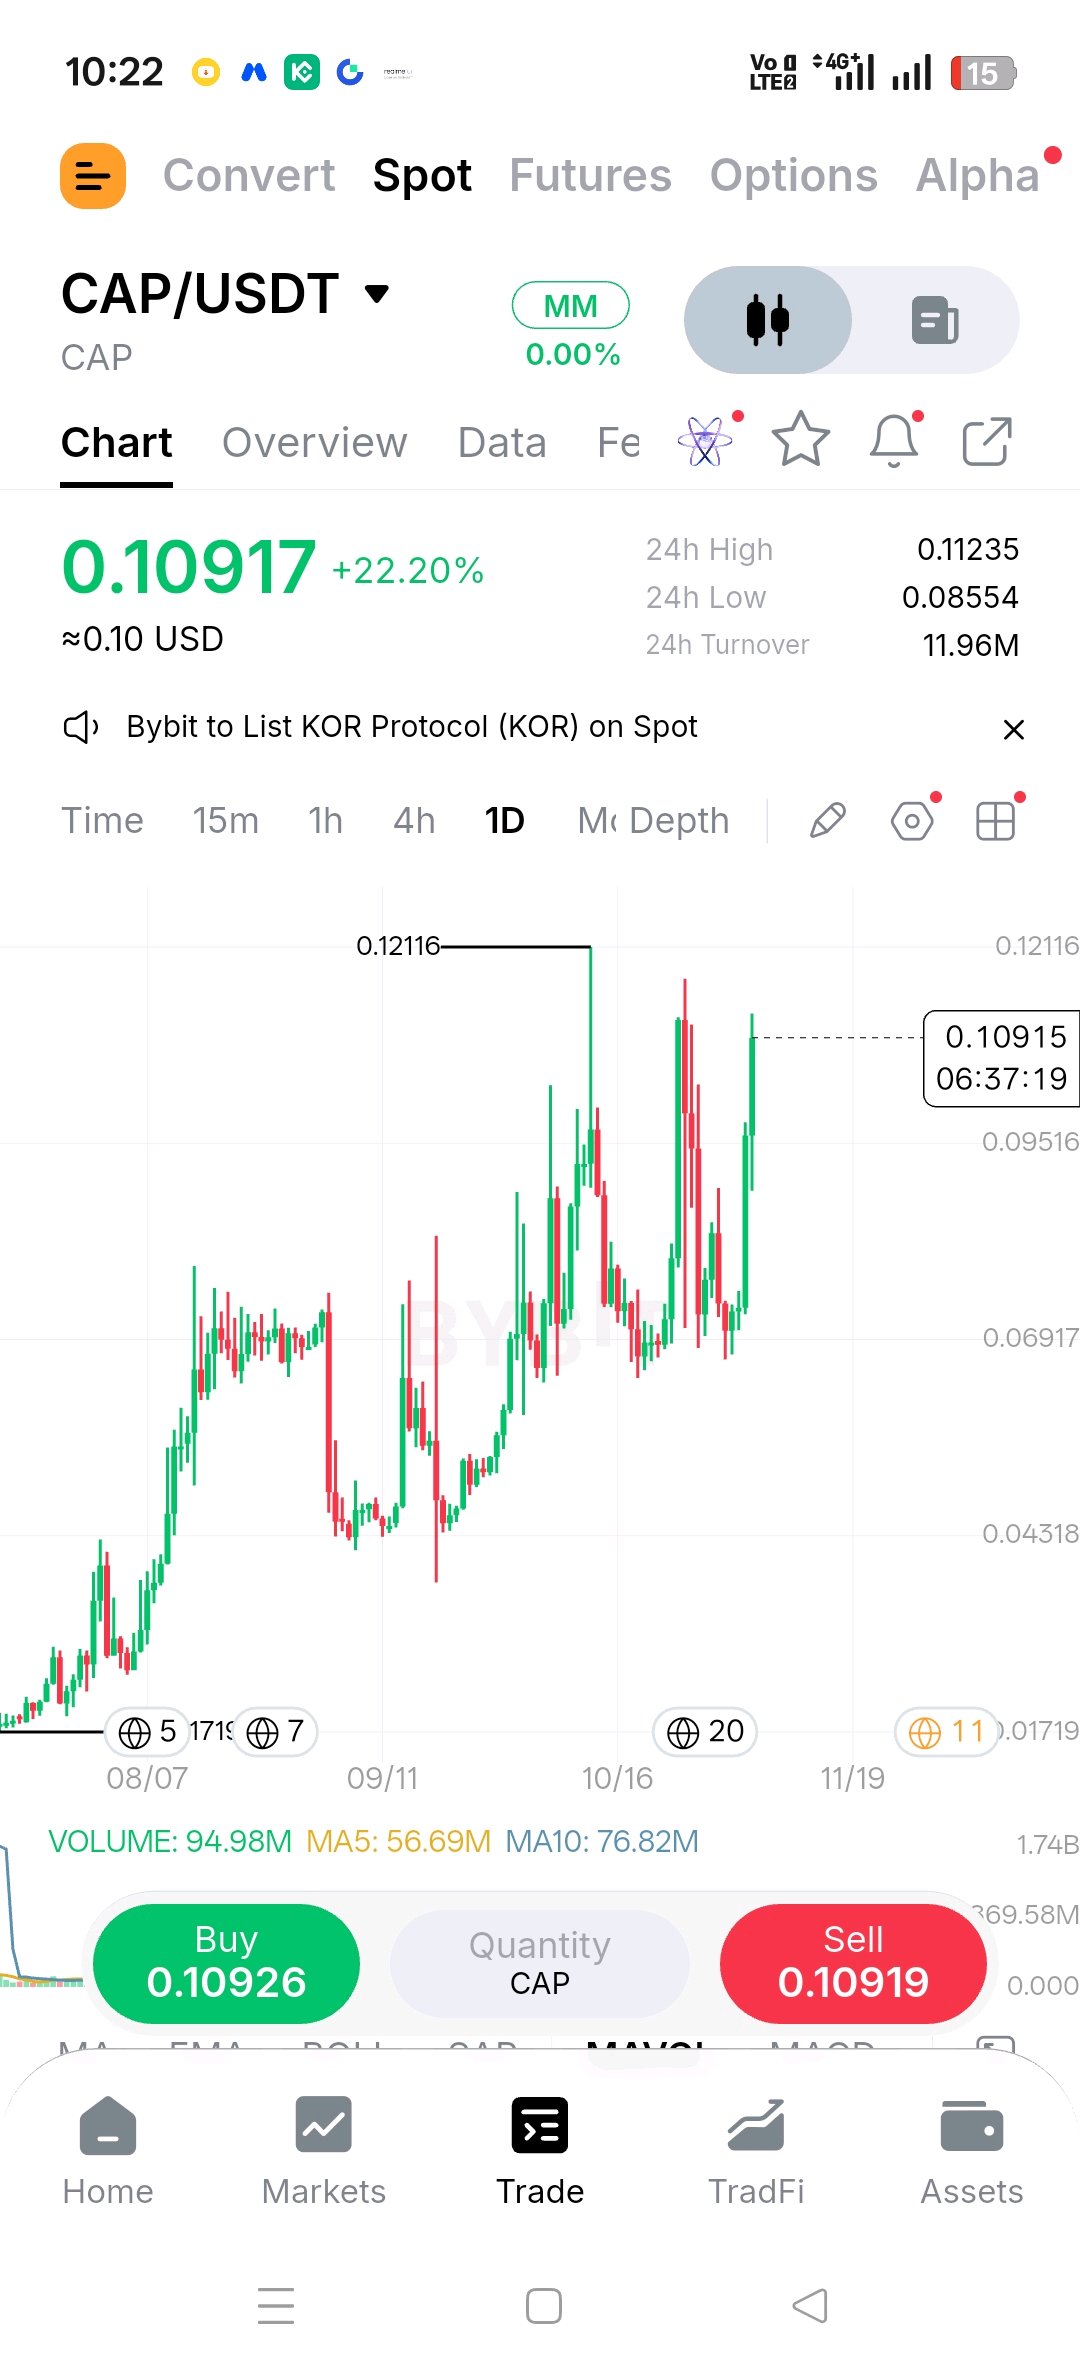
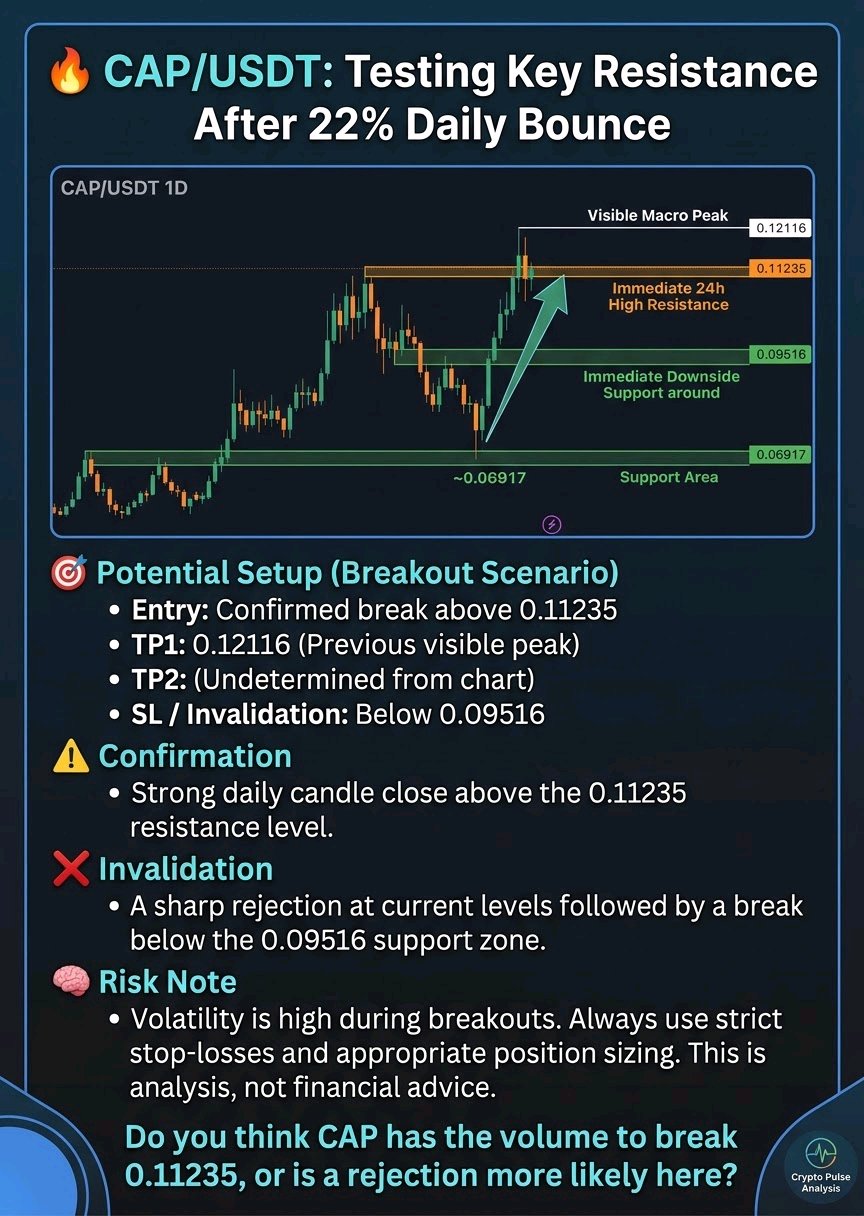
🔥CAP/USDT: Key Resistance Test
$CAPUSDT CAP is showing strong bullish momentum today, recovering sharply from recent lows to test local resistance. 📊 Market Structure: On the 1D chart, CAP/USDT is in a broader uptrend, having bounced firmly from the ~0.06917 support area. Price is currently challenging the immediate 24h high of 0.11235, with the visible macro peak sitting higher at 0.12116. Immediate downside support is visible around 0.09516. 🎯 Potential Setup (Breakout Scenario): · Entry: Confirmed break above 0.11235 · TP1: 0.12116 (Previous visible peak) · TP2: Not clear from chart · SL / Invalidation: Below 0.09516 ⚠️ Confirmation: A strong daily candle close above the 0.11235 resistance level. ❌ Invalidation: A sharp rejection at current levels followed by a break below the 0.09516 support zone. 🧠 Risk Note: Volatility is high during breakouts. Always use strict stop-losses and appropriate position sizing. This is analysis, not financial advice. #IMPACTbyTrade #BlockchainSecurity #BybitAIEvolving
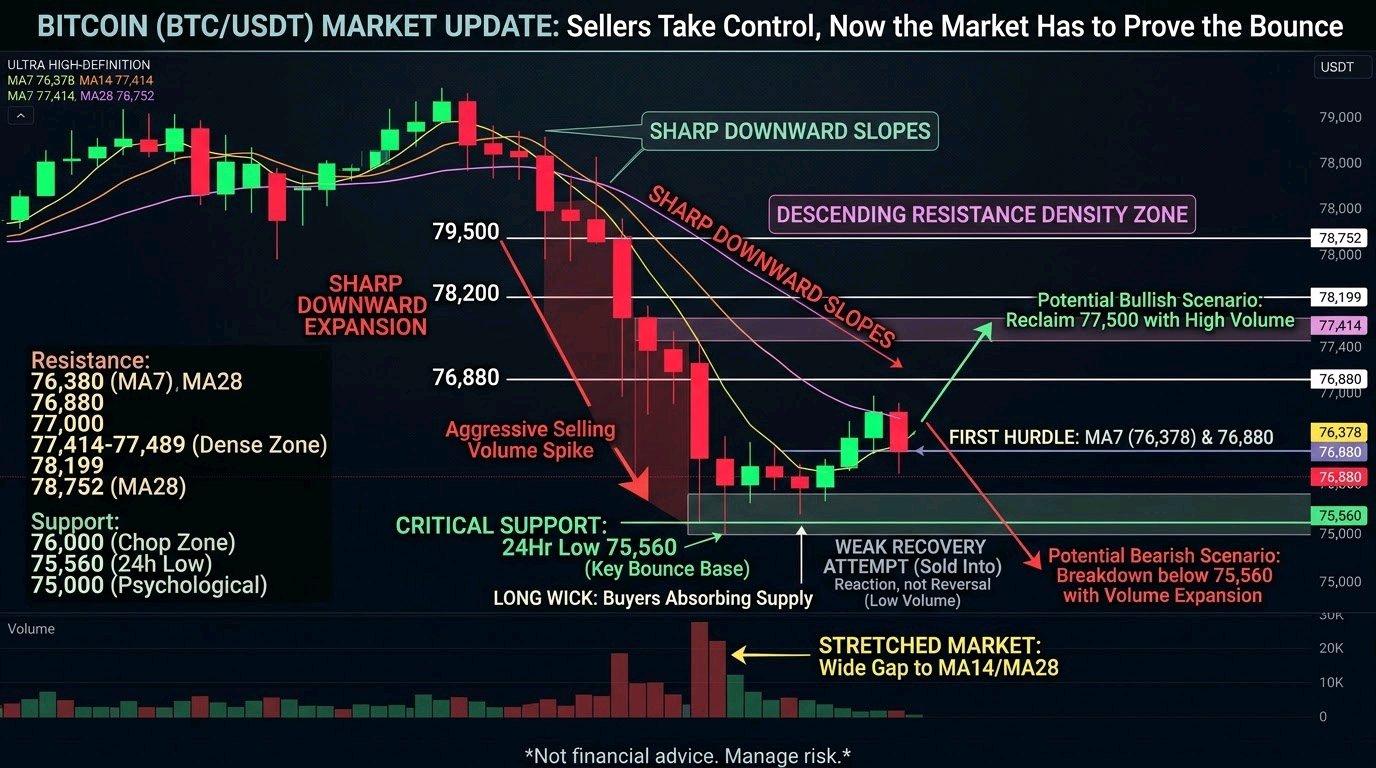
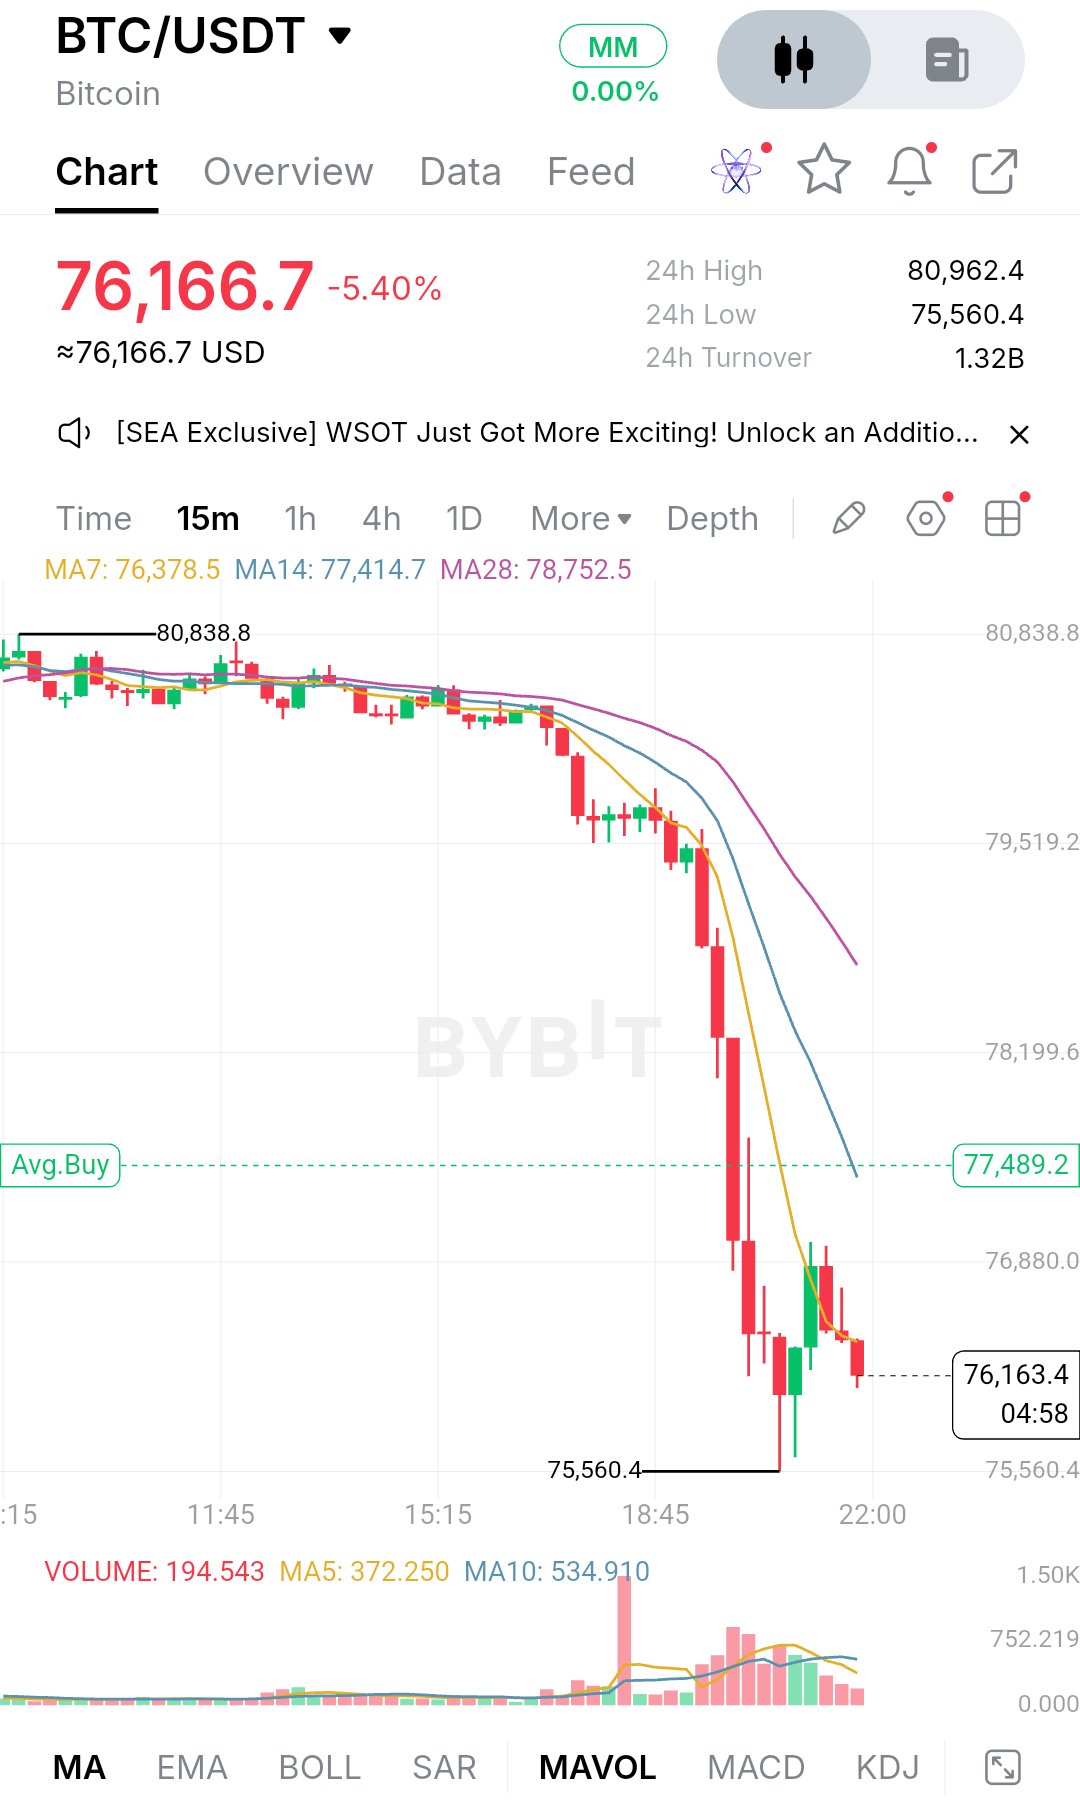
$BTCUSDC: Los vendedores tomaron el control, ahora el mercado tiene que probar el rebote Bitcoin cotiza alrededor de 76,166, con una baja de aproximadamente 5.4% en el día. El rango de 24 horas va desde un máximo cerca de 80,962 hasta un mínimo de 75,560, así que esto fue un reajuste de precio real, no una sangría lenta. El precio pasó la primera parte de la sesión oscilando justo por debajo de 81,000, y los vendedores siguieron apareciendo cerca del área de 80,800 hasta que el mercado finalmente cedió. Durante horas, el gráfico parecía un rango agotado. Las velas eran pequeñas y se superponían, sin una dirección clara, y los promedios móviles estaban agrupados y planos. Ese tipo de compresión rara vez dura. Una vez que el precio se deslizó por debajo del grupo de promedios, el movimiento se aceleró rápidamente. Una secuencia de grandes velas rojas llevó a BTC a través de 79,500, 78,200 y 76,880 con muy poca pausa, y el pico de volumen durante la parte más intensa de la caída confirma que esto fue una venta forzada y agresiva en lugar de un deslizamiento silencioso hacia abajo. Después del mínimo en 75,560, los compradores sí entraron. Un par de velas verdes empujaron el precio de vuelta hacia la región de 77,000, pero el rebote fue rápidamente vendido, y la vela más reciente es roja de nuevo. Eso me dice que la recuperación es todavía una reacción, no una reversión. El volumen en el rebote es notablemente menor que en la bajada, y la lectura actual se sitúa muy por debajo de su propio promedio a corto plazo, por lo que no hay una convicción fuerte de ninguno de los lados en este momento. El precio se está estabilizando, pero aún no ha construido ninguna estructura. En los indicadores que realmente puedo ver, el panorama sigue siendo bajista. La MA7 está en 76,378, la MA14 en 77,414 y la MA28 en 78,752, y las tres están apiladas en orden descendente con pendientes pronunciadas hacia abajo. El precio cotiza justo alrededor de la MA7, que es la primera línea de resistencia. Hasta que BTC pueda cerrar por encima de ella y mantenerse, la tendencia a corto plazo pertenece a los vendedores. La brecha amplia entre el precio y la MA14 y la MA28 también muestra lo estirada que estaba la caída, razón por la cual un rebote de alivio tiene sentido, pero un mercado estirado puede mantenerse estirado. El soporte más importante es el mínimo de 75,560, donde la liquidación se agotó y la mecha larga muestra a los compradores absorbiendo la oferta. Si se mantiene en una nueva prueba, especialmente con una caída en el volumen de ventas, podría convertirse en la base de un rango a corto plazo. Si se rompe, no hay soporte visible en este gráfico por debajo de él, y el nivel redondo de 75,000 se convierte en el siguiente imán psicológico. Entre el mínimo y el precio actual, el área de 76,000 es la zona más cercana donde el mercado ya está oscilando, así que observaría primero cómo se comporta el precio ahí. En cuanto a la subida, el primer obstáculo es la MA7 cerca de 76,380, seguido por el nivel de 76,880, que se rompió durante la caída y ahora actúa como resistencia. Por encima de eso, 77,000 es la siguiente barrera de número redondo, y la MA14 de 77,414 se sitúa justo al lado de la marca de 77,489, creando una zona de resistencia densa. Más allá de eso, 78,199 y la MA28 cerca de 78,752 son los niveles principales, y una recuperación que los alcance sería un cambio significativo en el tono. El área de 79,500 y luego 80,000 son los objetivos psicológicos más grandes, pero esos están lejos del precio actual y necesitarían un cambio sostenido en el impulso. Para el caso alcista, los compradores necesitan reclamar 76,880 y convertirlo en soporte, luego empujar a través del grupo de 77,400 a 77,500 con volumen creciente. Un movimiento así aplanaría los promedios a corto plazo y sugeriría que la liquidación ha seguido su curso. A partir de ahí, 78,200 y 78,750 se convierten en las siguientes paradas realistas. Un rebote con poco volumen que se estanca por debajo de la MA14 no sería suficiente. Para el caso bajista, la configuración es simple. Si el precio rechaza alrededor de 76,400 a 77,000 y se da la vuelta, el mercado probablemente volverá a probar 75,560. Una ruptura limpia por debajo de ese mínimo, particularmente con una expansión en el volumen como vimos durante la caída, abriría la puerta a 75,000 y una etapa más profunda hacia abajo. Los fallos repetidos en los promedios que caen también confirmarían que el rebote fue solo una pausa. **Niveles de precio clave** - Resistencia: 76,380 (MA7), 76,880, 77,000, 77,414 a 77,489 (área de MA14), 78,199, 78,752 (MA28), 79,519, 80,000 - Soporte: 76,000 (zona de oscilación cercana), 75,560 (mínimo de 24h), 75,000 (psicológico) - Invalidación de la visión bajista: mantenimiento sostenido por encima de 77,500 con volumen fuerte En general, BTC ha pasado de un rango ajustado e indeciso a una fuerte expansión a la baja, y el mercado ahora está decidiendo si eso fue el inicio de una tendencia o una limpieza excesiva. Los niveles que importan son claros: 75,560 abajo y la zona de 77,000 a 77,500 arriba. Observa cómo reacciona el precio en cada uno, y presta más atención al volumen y a los cierres de velas que a cualquier rebote individual. La próxima expansión vendrá, muy probablemente, de cualquiera de esos dos niveles que ceda primero. Esta es una lectura de gráfico para discusión, no un consejo financiero. Gestiona siempre tu riesgo. $ETHUSDC #Seguridad en Blockchain

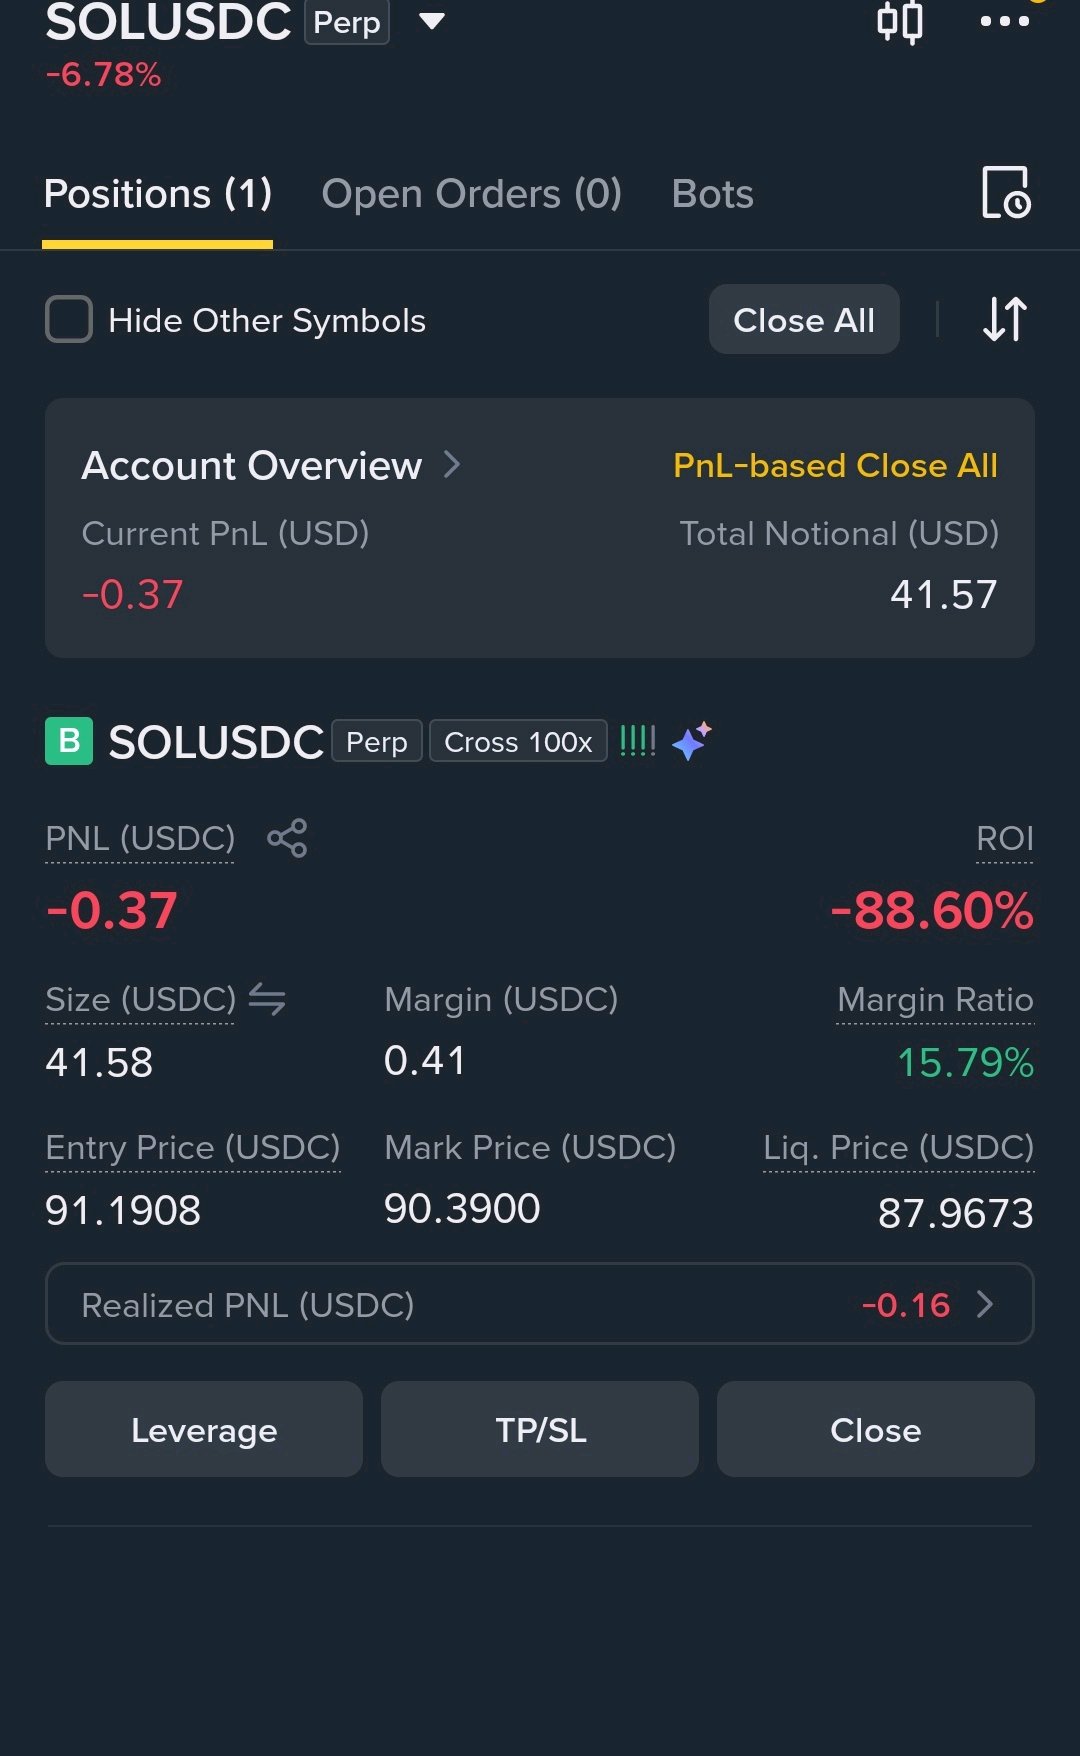
Buy/Rebound Speculative (Long) sol
Pair: SOL/USDT Trade Type: Long Buy/Bounce Current Price: $91.24 Suggested Entry Zone: Around the current price or upon testing support near $89.50-$90.00 Momentum Indicators: RSI(6) at 33.51 (approaching oversold territory), MACD showing slowing downward momentum with an attempt at a bullish crossover. Targets (Take Profit): Target 1: $93.00 Target 2: $95.00 Stop Loss: Close below $88.50 $SOLUSDT $NEARUSDT #WSOTPicktoEarn10U #أمن البلوكشين #BybitAIEvolving

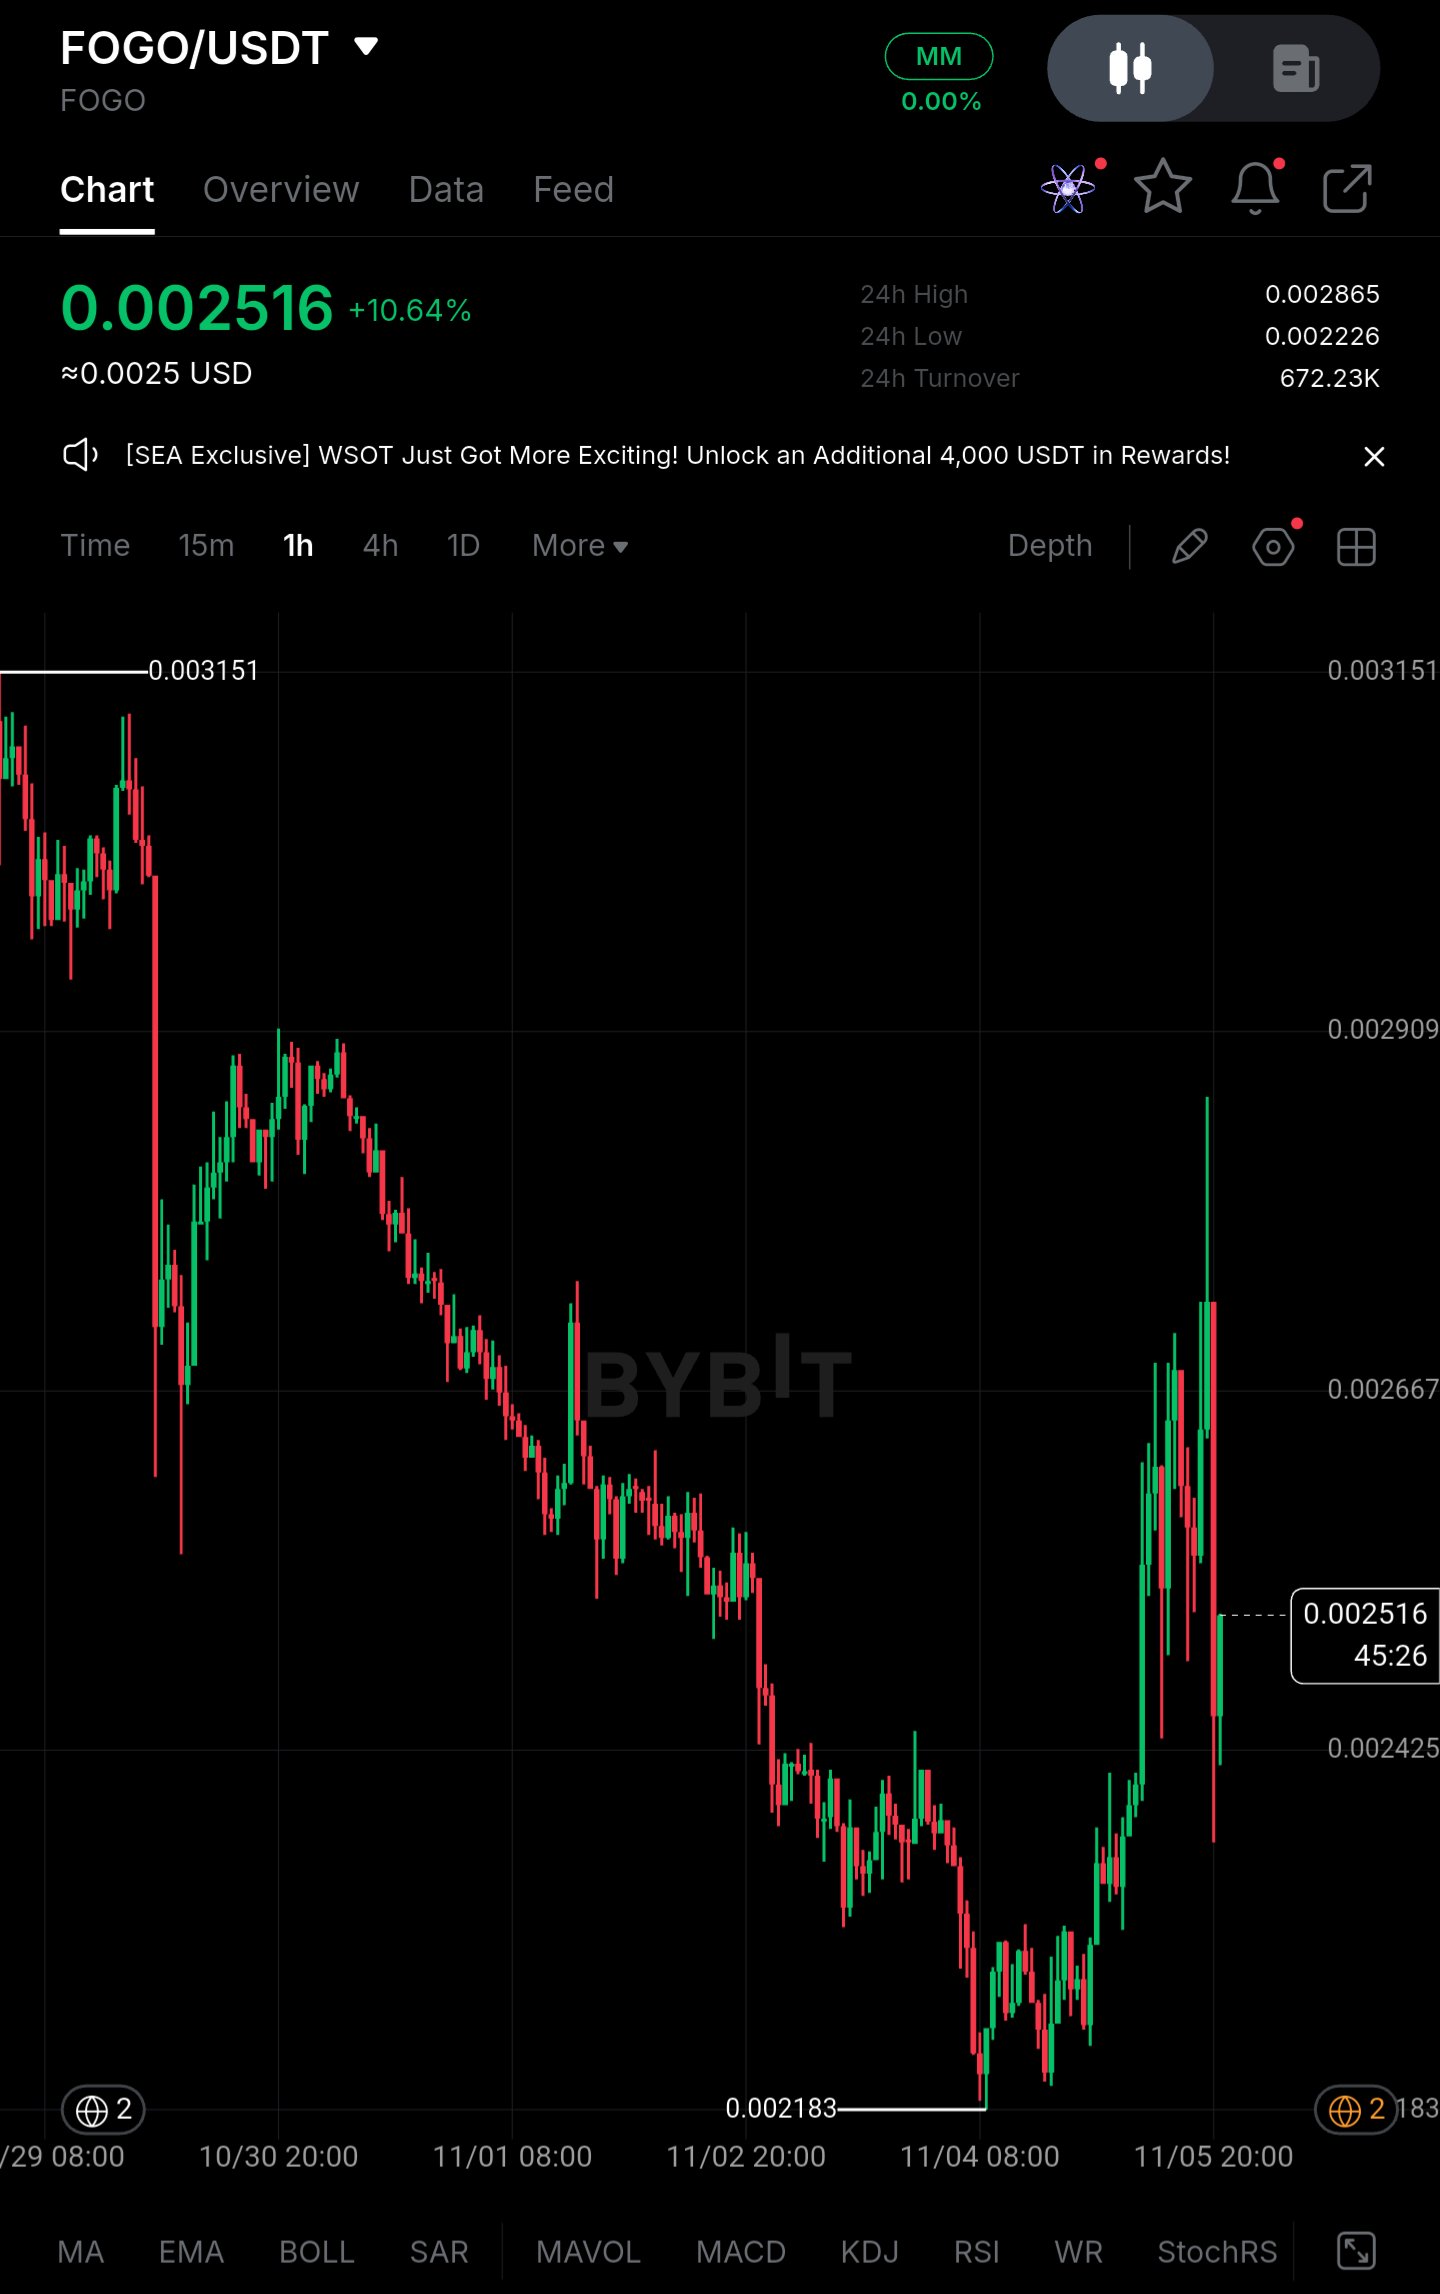
$FOGOUSDT FOGO/USDT – Market Structure Analysis | 1H Current Price: $0.002516 FOGO is trading around $0.002516 after rebounding approximately 15.25% from its recent chart low of $0.002183. While the latest price action shows a meaningful short-term bounce, I am not treating this move as a confirmed recovery yet. The broader structure remains under pressure. FOGO has experienced a prolonged sequence of lower highs and lower lows, and the recent upside move still needs confirmation through sustained spot demand. The key concern is whether buyers can absorb overhead selling pressure or whether this bounce becomes another opportunity for sellers to distribute. # 1\. Price Action & Market Structure * Current Price: $0.002516 * 24H Change: +10.64% * 24H High: $0.002865 * 24H Low: $0.002226 * Recent Chart Low: $0.002183 * Previous Major High: $0.003151 FOGO has recovered from the $0.002183 area, but the broader descending structure has not yet been invalidated. Immediate Resistance: * $0.002667 * $0.002865 * $0.002909 Support Zones: * $0.002425 * $0.002226 * $0.002183 A sustained reclaim above $0.002667 would improve the short-term structure. However, the $0.002865–$0.002909 region remains an important supply area. # 2\. Institutional / Large Capital Picture The chart shows a sharp downside trend followed by an aggressive rebound with elevated price volatility. However, there is no verified institutional flow, exchange wallet movement, or large-holder accumulation data available in the screenshot. The important distinction is that a sharp price rebound does not automatically establish meaningful capital inflows. I would want to see sustained spot buying volume and continued acceptance above reclaimed resistance before interpreting this move as genuine demand. ## 3\. Liquidity & Range Conditions FOGO previously declined from approximately $0.003151 toward $0.002183 before attempting its current rebound. The latest candles show aggressive volatility, including long upper and lower wicks. This suggests considerable short-term price uncertainty. The $0.002425–$0.002667 region is particularly important. A narrow consolidation after a significant decline is not sufficient evidence of accumulation. Stronger spot participation is necessary to establish whether buyers can defend the newly formed support. # 4\. Derivatives Positioning – Critical Risk The provided chart does not display open interest, funding rates, or long/short positioning. Therefore, precise derivatives figures cannot be established responsibly. * Open Interest: Not available. * Funding Rate: Not available. * Long/Short Ratio: Not available. * Long Position Percentage: Not available. This matters because excessive positive funding and crowded long positioning could make the current bounce vulnerable to a downside liquidity sweep. If leverage increases aggressively while spot demand remains weak, a breakdown below support could trigger fresh long liquidations. ## 5\. Key Figures | Metric | Price / Data | | -------------------- | ------------- | | Current Price | $0.002516 | | 24H Change | +10.64% | | Immediate Resistance | $0.002667 | | Major Resistance | $0.002865 | | Upper Resistance | $0.002909 | | First Support | $0.002425 | | Major Support | $0.002226 | | Recent Low | $0.002183 | | Previous High | $0.003151 | | Open Interest | Not available | | Funding Rate | Not available | | Long Percentage | Not available | # 6\. Confirmation Levels Bullish Confirmation: A sustained reclaim above $0.002667 would be the first meaningful improvement in short-term structure. A successful move through $0.002865 could open the way toward $0.002909 and potentially $0.003151. However, resistance breaks need volume confirmation rather than isolated upward wicks. Bearish Confirmation: A breakdown below $0.002425 would weaken the current rebound structure. Further acceptance below $0.002226 would expose the recent low at $0.002183. Losing that level would increase the probability of another downside liquidity sweep. ### 7\. Final Market Outlook FOGO is showing temporary strength, but the broader market structure has n ot yet confirmed a sustainable reversal. The recent +10.64% daily move deserves attention, but aggressive volatility and overhead resistance make chasing the bounce a risky proposition. My focus remains on two things: whether spot buyers can sustain demand above $0.002667 and whether leverage remains controlled during the consolidation. The decisive signal is not another green candle. It is sustained spot buying, a confirmed resistance reclaim, and controlled derivatives positioning. Otherwise, another support breakdown could turn this bounce into a fresh liquidity event. #BlockchainSecurity #BybitAIEvolving #ByXIMPACT
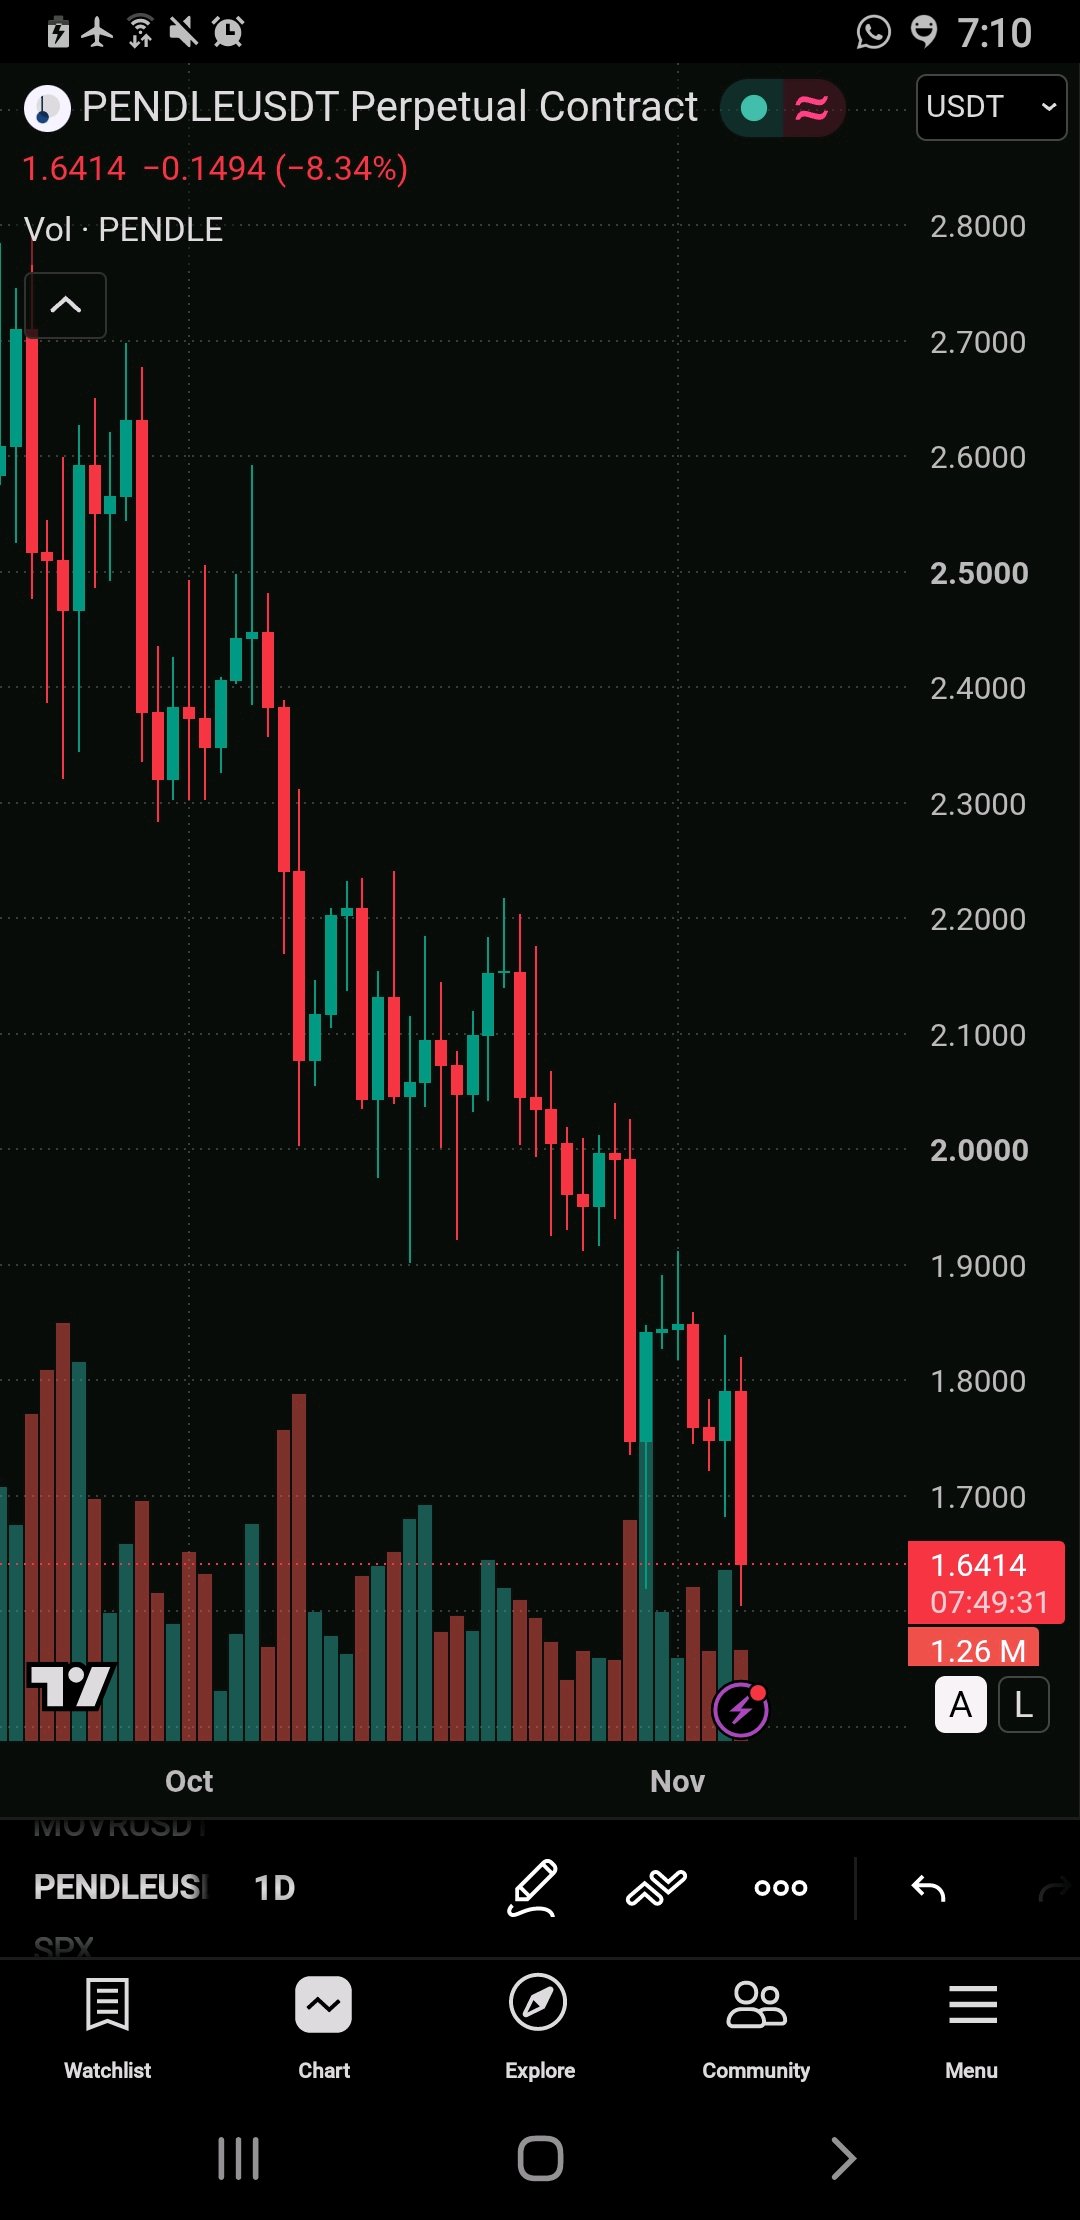
enormous recovery potential
🚀 RENDER Coin (RENDER) - Huge Recovery Potential! Will We Reach $16? 🔥 💰 Current Price: $1.614 (+0.62%) 📊 Technical Analysis: RENDER is showing consolidation near a key support zone between $1.20 and $1.60 after a prolonged downtrend. The weekly chart shows a descending trendline of resistance, while buyers attempt to establish a solid base for a move. 🎯 Potential Targets: Target 1 (TP1): $3 Target 2 (TP2): $6 Target 3 (TP3): $10 Main Target: $16 ⚠️ Key Levels to Watch: A confirmed break above $6 could significantly boost the bullish momentum. A break below support could weaken the outlook. (Reminder: This is a technical forecast for speculation and not a guaranteed target.) 👀 Do you think RENDER can make a strong comeback? $PENDLEUSDT $BTCUSDT #WSOTPicktoEarn10U #BybitAIEvolving #أمن البلوكشين
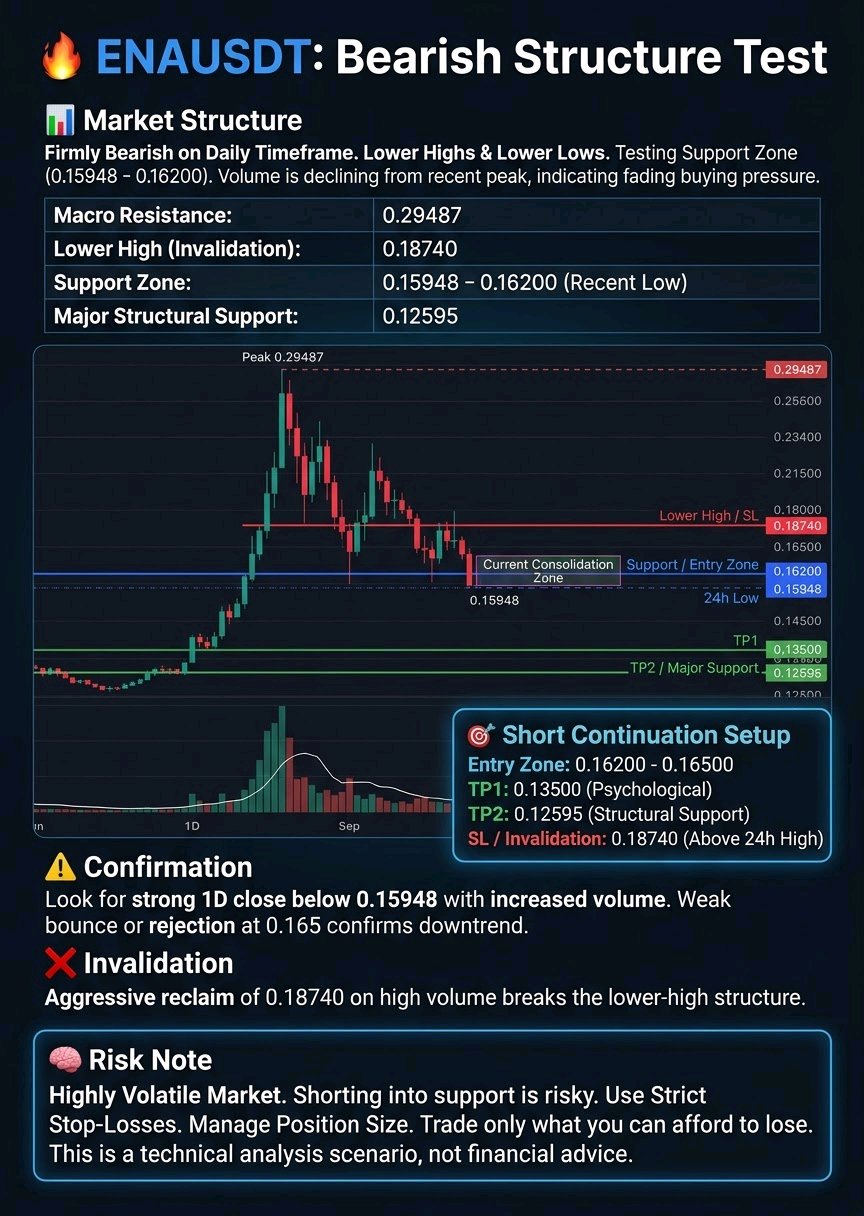
🔥 ENAUSDT: Bearish Structure Test
$ENAUSDT The daily chart for ENAUSDT shows a parabolic run followed by a steep corrective phase. After peaking near 0.29487, the asset is forming lower highs and lower lows. 📊 Market Structure: The visible trend on the 1D timeframe is firmly bearish. We are currently testing support around the 0.15948 - 0.16200 zone, which represents a recent 24h low and a potential temporary floor. Volume has notably declined from the massive spike seen during the peak, indicating fading buying pressure. The next major structural support below current levels is visible down at the 0.12595 area. On the upside, immediate resistance is found at the recent lower high around 0.18740, with the macro resistance remaining at 0.29487. 🎯 Potential Setup (Short Continuation): Note: This is a scenario based on the current visible downtrend, not a financial signal. Entry: 0.16200 - 0.16500 (Current consolidation zone) TP1: 0.13500 (Psychological and intermediate visible level) TP2: 0.12595 (Major visible structural support) SL / Invalidation: 0.18740 (Above the 24h high and recent lower high) ⚠️ Confirmation: For this bearish scenario to play out, we would want to see a strong 1D candle close below the 0.15948 support level, accompanied by an increase in downward volume. A weak bounce or rejection at the 0.165 area would further validate the downtrend. ❌ Invalidation: If the price aggressively reclaims the 0.18740 level on high volume, it would break the current market structure of lower highs and indicate a potential trend reversal or deeper retracement upward. 🧠 Risk Note: The crypto market is highly volatile, and shorting into strong support can be risky. Always use strict stop-losses, manage your position size according to your risk tolerance, and never trade more than you can afford to lose. #IMPACTbyTrade $BTCUSDT #BlockchainSecurity #BybitAIEvolving
BTC latest update
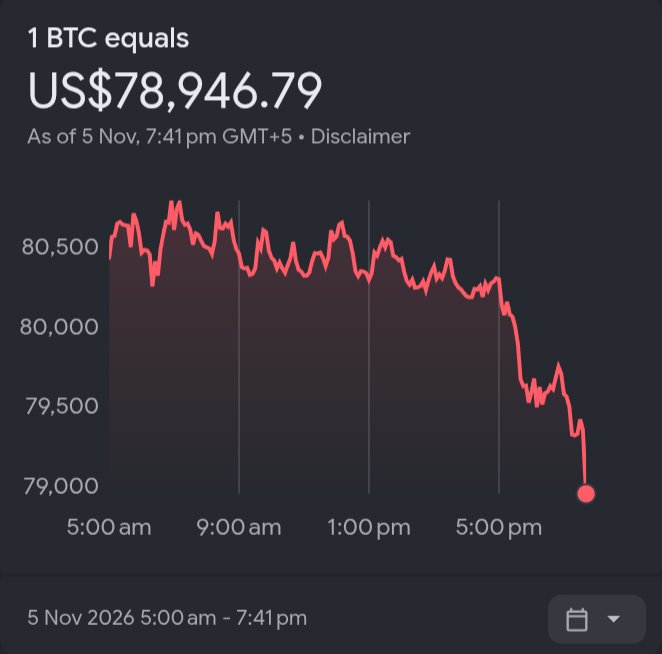
$BTCUSDT BITCOIN (BTC) LATEST MARKET ANALYSIS – NOVEMBER 5, 2026 Bitcoin is showing signs of recovery after bouncing back above the $80,000 psychological level. The short-term technical outlook is bullish, but BTC needs a confirmed breakout to continue its upward momentum. 📊 KEY MARKET LEVELS 🟢 Current reference price: $80,400 🟢 Support 1: $79,746 🟢 Support 2: $77,820 🔴 Resistance 1: $81,128 🔴 Resistance 2: $82,218 🔴 Major resistance: $83,582 📈 TECHNICAL ANALYSIS • Daily RSI: 50.2 (neutral momentum) • 4H trend: Bullish bias • Daily trend: Bullish bias • Weekly trend: Bullish bias BULLISH SCENARIO 🚀 If BTC breaks and holds above $81,128, the next targets could be $82,218 and $83,582. BEARISH SCENARIO ⚠️ If BTC loses $79,746, selling pressure could increase toward $77,820 and potentially $75,253. 🎯 MY MARKET VIEW Bitcoin is showing recovery potential, but confirmation above resistance is important. Avoid chasing breakouts without volume confirmation. What do you think? 🚀 BTC to $85K or correction toward $77K? #BybitAIEvolving #BlockchainSecurity #AnthropicIPOTestsTheAIBoom #MidtermsMarketWatch #Bitcoin #BTC #CryptoAnalysis #BinanceSquare #BitcoinTrading #CryptoMarket
$ETHUSDT USDT – EL VOLUMEN SÓLIDO HA VUELTO, Y ESTOY VIGILANDO EL EMPUJE POR ENCIMA DE 2410 HACIA 2450+** Ethereum está mostrando una clara fortaleza relativa hoy. Mientras que Bitcoin se mantiene alrededor del área de $79.6k–$80k con una ganancia más modesta, ETH ha subido aproximadamente un 3% en el día y se cotiza cerca de $2,387–$2,395. El mercado en general está en modo de riesgo (risk-on), pero ETH lidera el movimiento entre las criptos de gran capitalización. Estoy observando de cerca la estructura diaria y de 4H aquí. El precio actualmente está trabajando justo por debajo de la EMA50 diaria cerca de $2,410–$2,411. Ya ha recuperado la zona de la EMA20 y se mantiene por encima de la banda de soporte de mediados de los $2,300, la cual ha sido probada varias veces. El rango de 24h osciló aproximadamente entre $2,310 y $2,450, así que estamos situados en la mitad superior de ese rango tras una recuperación decente. ### Análisis de Volumen El volumen de trading de 24h se sitúa alrededor de los $15 mil millones. Es una participación saludable para ETH y respalda el movimiento alcista en lugar de ser un rebote débil y de baja convicción. Cuando el volumen aumenta en días verdes como este y el precio se mantiene por encima de la zona de demanda reciente, generalmente significa que los jugadores más grandes todavía están interesados en la continuación y no solo en cubrir posiciones cortas. Estoy considerando el volumen como constructivo para el escenario alcista a corto plazo. ### Mi Plan de Trading Estoy abordando esto como una posible configuración de continuación con niveles definidos: - **Zona de Entrada Inicial**: $2,380–$2,395 Estoy dispuesto a empezar a posicionarme aquí mientras el precio todavía está por debajo de la EMA50 pero manteniendo la estructura de recuperación reciente. - **Nivel Preferido de DCA**: $2,350–$2,360 Este es el borde inferior de la zona de consolidación diaria que ha visto múltiples toques. Un retroceso controlado hacia esta área mejoraría el promedio sin romper la estructura. - **Primera Resistencia**: $2,410–$2,415 La EMA50 diaria. Un cierre limpio y mantenernos por encima de este nivel sería la primera confirmación real de que los compradores tienen el control de nuevo. - **Objetivo Primario**: $2,445–$2,450 El máximo reciente de 24h y un nivel horizontal claro. Aquí es donde espero que aparezca la primera oferta real. - **Potencial Alcista Adicional**: $2,480–$2,530 Si el impulso continúa y el volumen se mantiene elevado tras superar los 2450, esta zona se vuelve realista en un movimiento medido. Busco que el precio se mantenga por encima de $2,370–$2,380 en cualquier caída intradía y preferiblemente cerrar el día por encima de la EMA50 para mantener la configuración limpia. ### ¿Qué podría salir mal? Un rechazo fuerte en la EMA50 seguido de una caída de vuelta por debajo de $2,360 debilitaría el escenario alcista a corto plazo y abriría la puerta a una re-prueba más profunda del área de demanda de $2,310–$2,320. Si ese nivel falla con un volumen en expansión, el siguiente soporte estructural se encuentra más abajo en la zona de $2,250–$2,300. También estoy observando a BTC de cerca; cualquier movimiento repentino de aversión al riesgo (risk-off) en Bitcoin podría arrastrar a ETH a la baja independientemente de su fortaleza relativa. La configuración pierde atractivo si perdemos el área de $2,350 en un cierre diario con volumen de venta creciente. ### Mi Perspectiva ETH es interesante en este momento porque está mostrando fortaleza relativa frente a BTC mientras el volumen se mantiene sólido y la estructura diaria intenta repararse a sí misma. Todavía no estamos en una ruptura limpia: el precio aún necesita superar y mantenerse por encima de la EMA50, pero la recuperación desde el mínimo de $2,310 ha sido ordenada y respaldada por la participación. Me inclino por la continuación durante las próximas sesiones si los compradores pueden defender la zona actual y empujar a través de 2410 con volumen. Un rechazo y deslizamiento de vuelta por debajo de 2350 me volvería más cauteloso y obligaría a esperar una mejor estructura. Por ahora, estoy vigilando de cerca la reacción de la EMA50 y el volumen. Esta es un área constructiva, pero todavía necesita confirmación. #Seguridad en Blockchain #WSOT2026 #Observatorio del Mercado de Elecciones de Medio Término
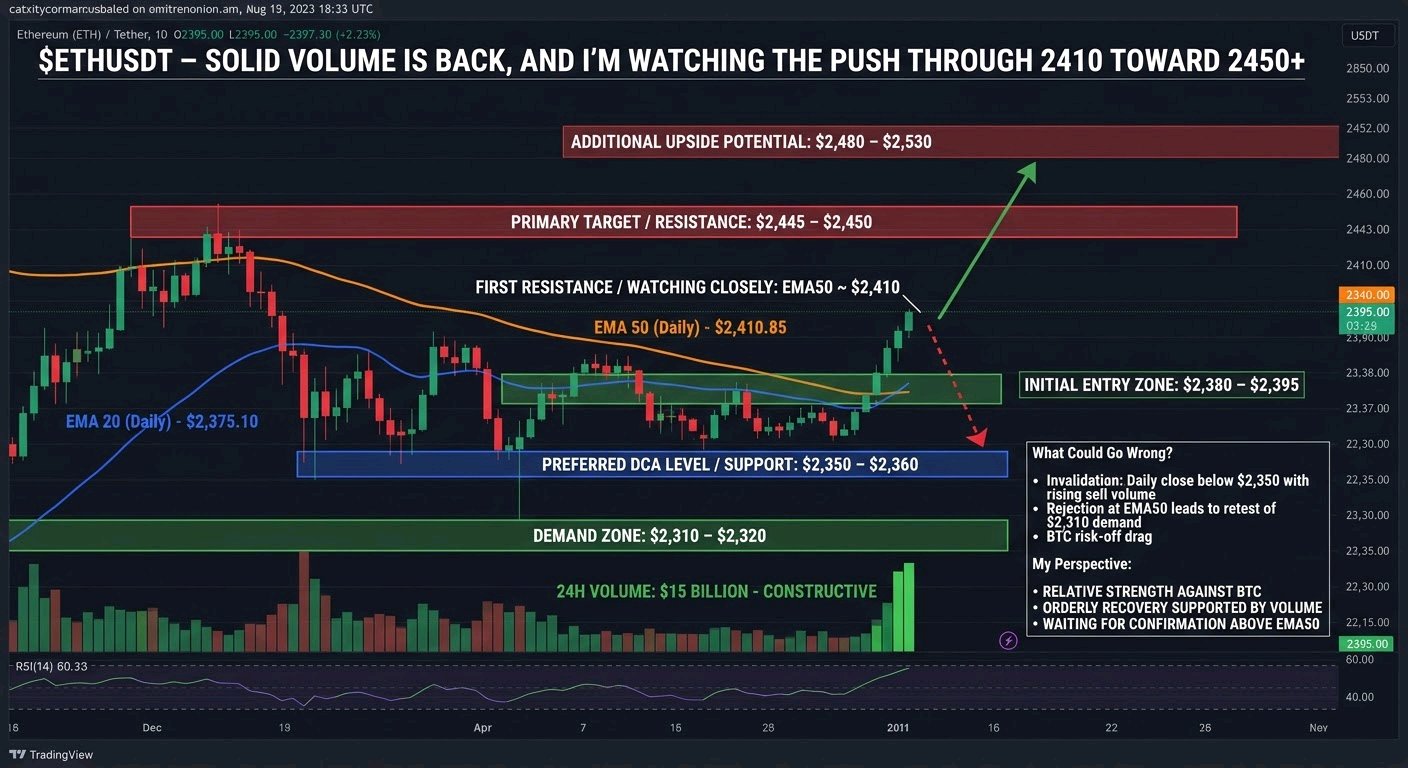
$TRUMPUSDT cotiza a 1.241, con una baja del 13.34% en las últimas 24 horas, alcanzando un máximo de 24h de 1.467 y un mínimo de 1.211. El volumen de operaciones se sitúa en 14.79M. Ese máximo de 1.467 está muy por encima del precio actual, lo que indica que los vendedores han controlado la sesión en términos generales. En el gráfico de 15 minutos, el daño más reciente se produjo en una fuerte caída. Después de oscilar alrededor del área de 1.25 a 1.27 durante la mitad de la sesión, el precio cayó con fuerza en una gran vela roja respaldada por una de las barras de volumen más pesadas en la pantalla. Esa purga lo llevó hasta 1.211 antes de que los compradores entraran. Lo que sucedió después del mínimo es la parte interesante. La vela de 1.211 dejó una larga mecha inferior, y las siguientes velas fueron cuerpos verdes fuertes que hicieron retroceder el precio por encima de 1.23. Eso parece un rebote de reacción de vendedores agotados, no una reversión confirmada. La última vela es roja con una pequeña mecha superior, por lo que la recuperación ya está encontrando cierta vacilación. Estructuralmente, el precio ha pasado de un rango lateral entre aproximadamente 1.25 y 1.29 a una ruptura y un rebote en forma de V. Está tratando de estabilizarse, pero aún no se ha recuperado nada. En los indicadores visibles, la MA7 se sitúa en 1.232, la MA14 en 1.245 y la MA28 en 1.255. El precio está por encima de la MA7 pero aún por debajo de la MA14 y la MA28, y ambas tienen una pendiente descendente. Esta es una estructura de recuperación dentro de una tendencia bajista a corto plazo. El volumen respalda esto: la barra actual marca 12.17K frente a una MA5 de 57.83K y una MA10 de 84.54K, por lo que el rebote se está produciendo con una participación decreciente. Una recuperación con poco volumen puede derivar, pero necesita un aumento en el volumen para ser confiable. El soporte comienza en el área de 1.231 a 1.232, donde se encuentran la MA7 y la primera zona de retroceso. Por debajo de eso, 1.211 es el nivel clave, ya que es tanto el mínimo de 15 minutos como el mínimo de 24 horas. Un retesteo que se mantenga allí lo convertiría en una base limpia tipo doble suelo. Una ruptura por debajo abriría el descubrimiento de precios a la baja sin una estructura reciente en la que apoyarse. La resistencia inmediata es la MA14 cerca de 1.245, justo por encima del precio actual. Más allá de eso, la MA28 cerca de 1.255 se alinea con la zona de 1.252 a 1.255 que actuó como soporte antes de la ruptura y ahora podría convertirse en resistencia. Más arriba, 1.272 y el máximo oscilante de 1.293 son los siguientes techos significativos, con 1.30 como número redondo psicológico. Para el caso alcista, los compradores necesitan mantenerse por encima de la MA7, superar 1.245 y luego cerrar una vela por encima de la MA28 cerca de 1.255, idealmente con un volumen en aumento. Eso aplanaría los promedios a corto plazo y pondría en juego 1.272 y luego 1.293. Para el caso bajista, un rechazo en la MA14 o MA28 seguido de una pérdida de 1.231 sugeriría que el rebote fue solo un movimiento de alivio. Eso pondría a 1.211 bajo presión nuevamente, y una segunda prueba de un nivel generalmente se sostiene peor que la primera. Niveles de precio clave: - Resistencia: 1.245 (MA14), 1.255 (MA28), 1.272, 1.293 - Soporte: 1.232 (MA7), 1.231, 1.211 (mínimo de 24h) - Rango de 24h: 1.211 a 1.467 En general, TRUMP se encuentra en medio de una zona de decisión. La venta masiva ha sido absorbida por ahora, pero el rebote carece de volumen y no ha recuperado los promedios móviles superiores. La próxima expansión probablemente vendrá de una ruptura respaldada por volumen por encima de 1.255 o una pérdida de 1.211. Observe cómo se comporta el precio alrededor de la MA14 antes de emocionarse demasiado con la recuperación, y trate todo esto como una lectura de la estructura, no como una garantía de dirección. Una nota sobre el gráfico: está en el marco de tiempo de 15 minutos, no en el de 1h, y solo muestra la MA7/14/28 y el volumen con la MA5/MA10. No hay EMA200, RSI, MACD o Fibonacci en pantalla, así que los omití en lugar de inventar valores. Si envías una captura de pantalla de 1h con esos indicadores, o la publicación de referencia de LITUSDT, puedo igualar el estilo y la profundidad más de cerca. #Seguridad en Blockchain #Observatorio del Mercado de Elecciones de Medio Término $BTCUSDT
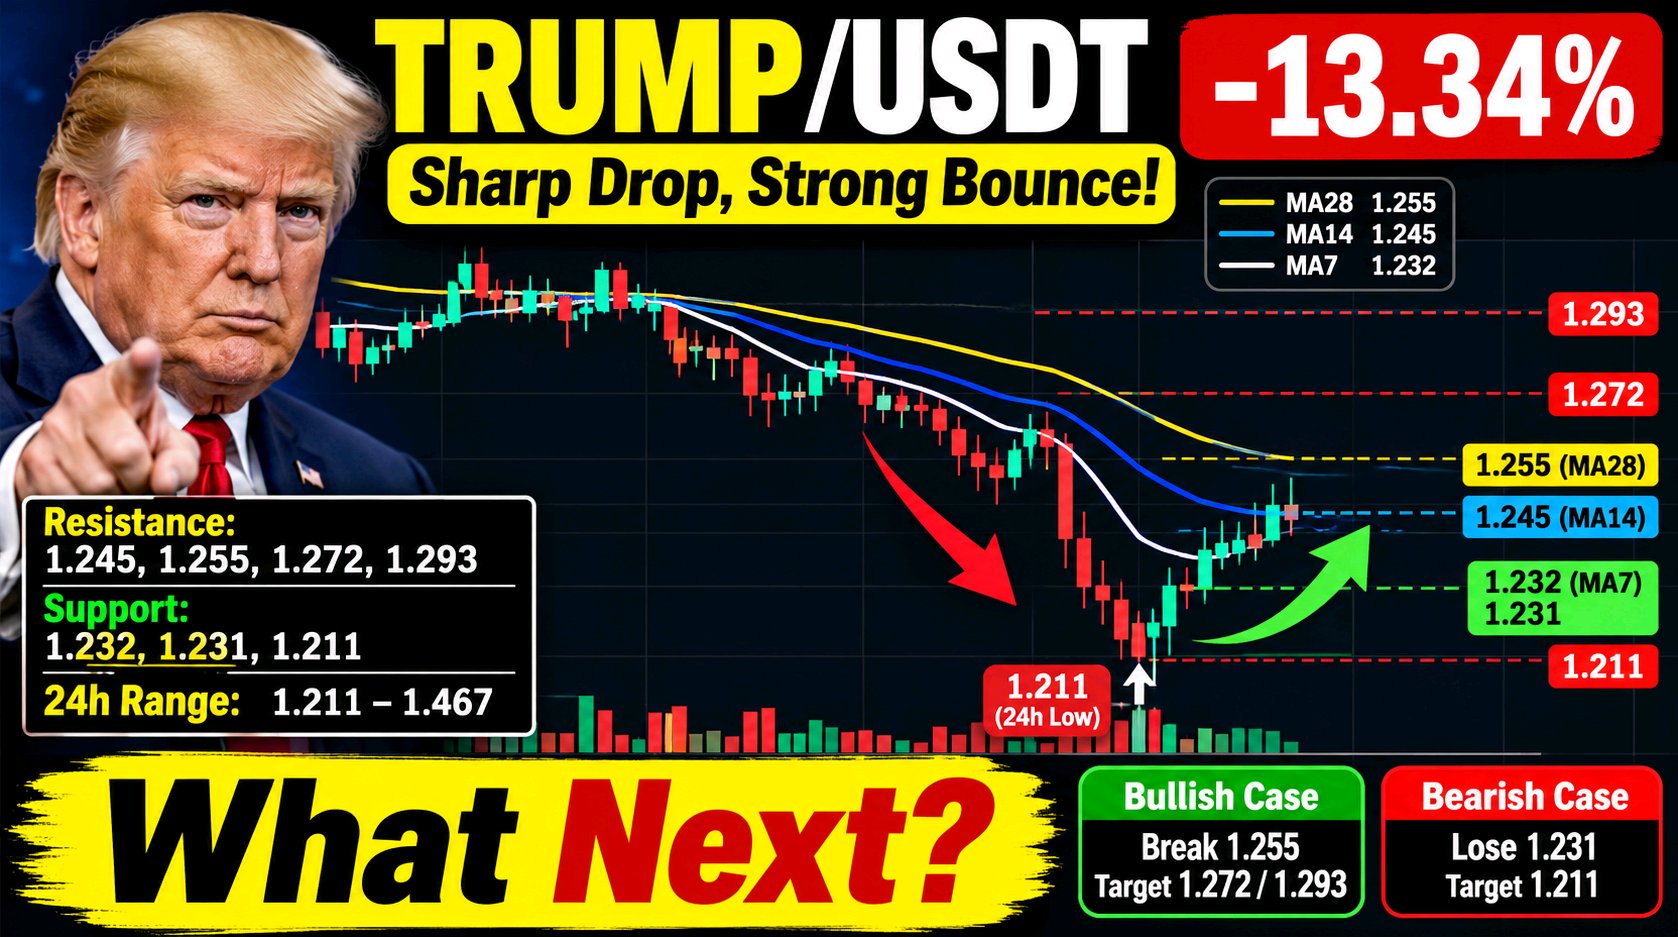
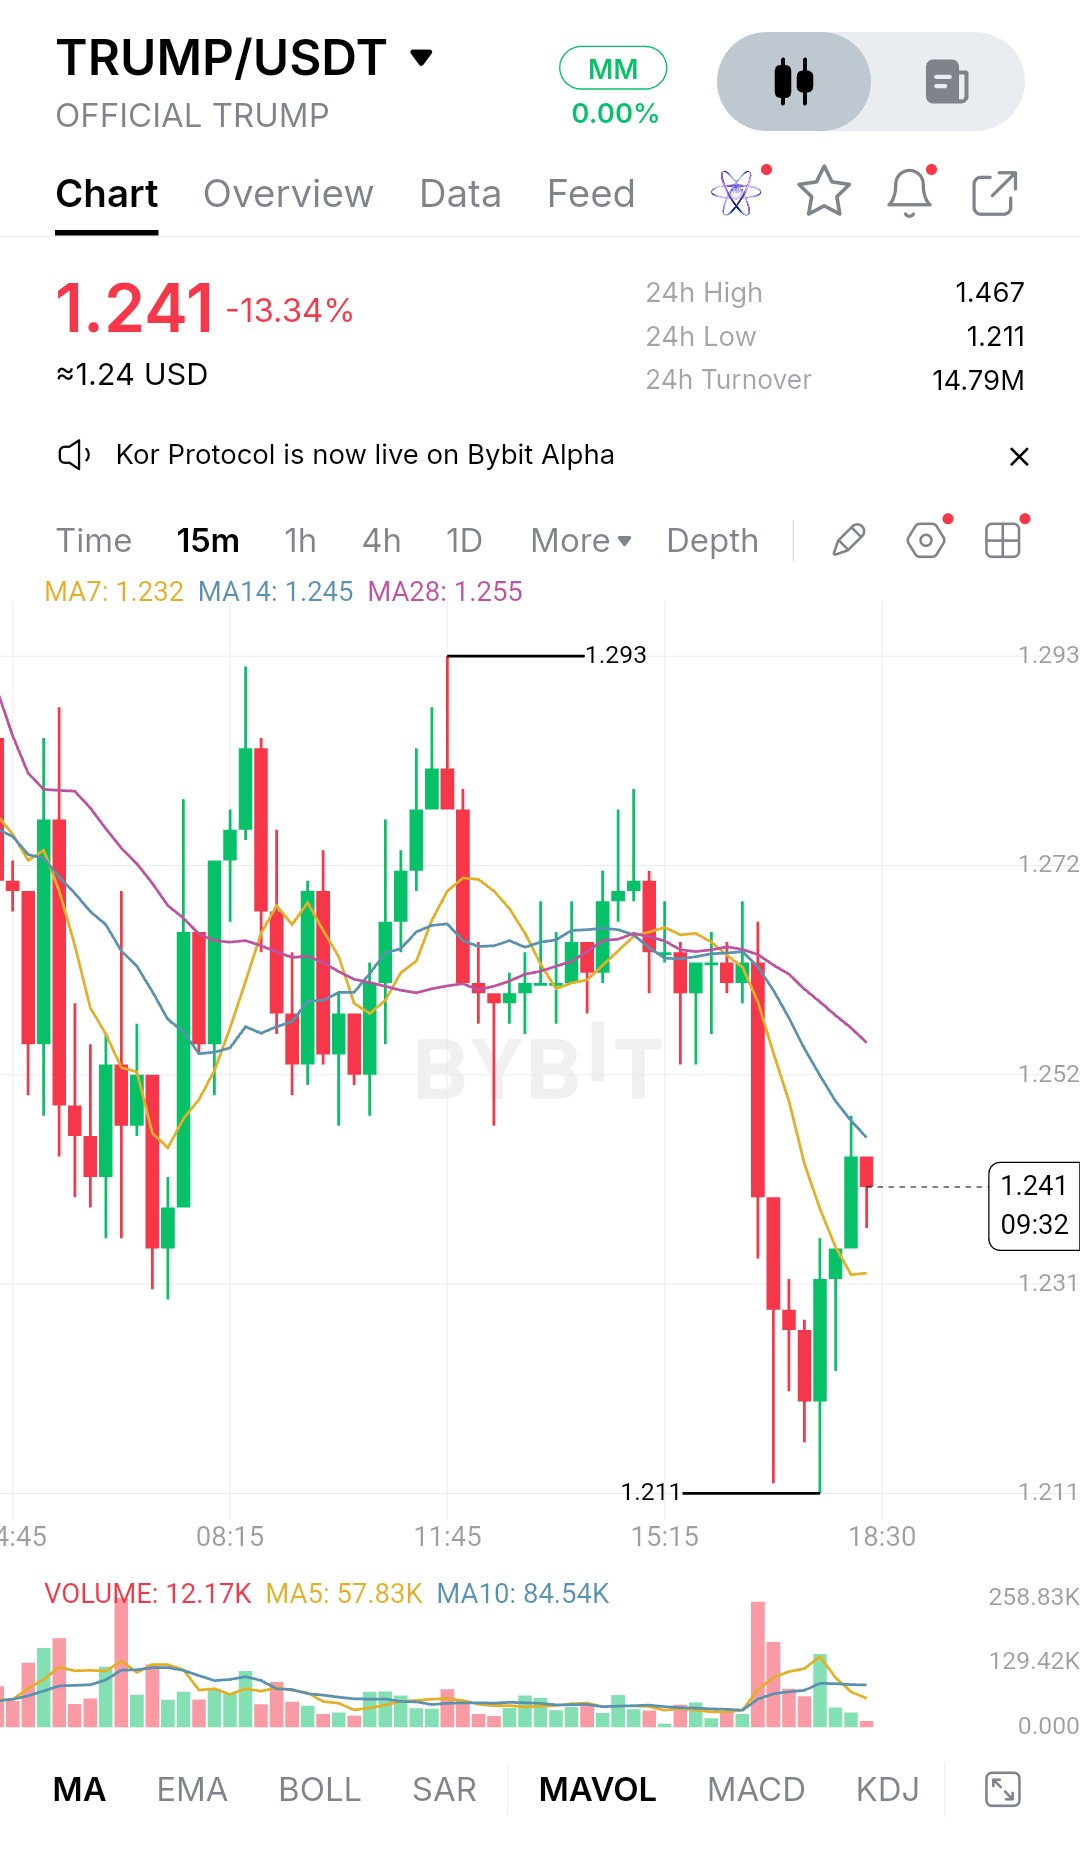

🚀 BITTENSOR (TAO) – ¡POTENCIAL DE REVERSIÓN ALCISTA MASIVA! ¿EN LA MIRA LOS $800? 🔥 💰 Precio actual: $223.30 (-0.04%) 📊 Análisis técnico: TAO se está acercando a una importante zona de demanda semanal alrededor de los $150–$220. El gráfico muestra una larga línea de tendencia bajista, mientras los compradores intentan defender esta área de soporte. 🎯 Objetivos potenciales: - TP1: $300 - TP2: $400 - TP3: $600 - Objetivo principal: $800 ⚠️ Una ruptura por encima de los $300 podría fortalecer el impulso alcista. Perder la zona de soporte de $150 podría invalidar la configuración. El objetivo de $800 es una proyección gráfica a largo plazo, no una garantía. 👀 ¿Podrá TAO tener un regreso poderoso? #Seguridad en Blockchain $ETCUSDT $BTCUSDT