WSOTPicktoEarn10U
Dukung skuad dan kapten favorit Anda dengan #WSOTPick2Earn. Berikan dukungan Anda: pasar apa yang paling mereka kuasai, dan apa yang mendefinisikan DNA trading mereka? Postingan terpilih berkualitas tinggi masing-masing akan mendapatkan 10 USDT. Pemenang akan dipilih secara acak dari entri yang memenuhi syarat. Bybit berhak atas interpretasi akhir.

$TSLAXUSDT Is Tokenized Tesla 's future is increasingly connected to artificial intelligence, autonomous transportation and robotics. At the same time, tokenized stocks are creating a new way for investors to access traditional equities through blockchain infrastructure. TSLAX sits directly at the intersection of these two developments. But can this tokenized Tesla exposure attract meaningful demand? Market Overview — November 11, 2026 Based on the latest available market snapshot: - Price: $384.24 - 24H Change: +2.00% - Market Cap: $69.94M - 24H Volume: $8.67M - 24H High: $386.88 - 24H Low: $370.60 - All-Time High: $496.55 - Distance from ATH: -22.6% Technical Analysis TSLAX is approaching an important resistance zone after recovering from recent weakness. Key levels to watch: - Immediate Support: $370–$374 - Strong Support: $350–$360 - Immediate Resistance: $386–$391 - Major Resistance: $395–$408 A sustained breakout above $391 could strengthen bullish momentum toward $408. However, losing $370 could expose the lower support region. Fundamental Development Tesla's strategic transition toward autonomous transportation and Cybercab production is an important development to watch. Its energy storage business and AI ambitions also contribute to the longer-term investment narrative. For TSLAX, the distinction is important: investors are getting tokenized exposure to Tesla's equity rather than investing in a conventional cryptocurrency ecosystem. Tokenomics and Risk TSLAX operates through a tokenized equity structure. Its value is linked to Tesla shares, while issuer arrangements, custody, redemption access, regulatory restrictions and secondary-market liquidity remain important considerations. My Market Outlook Bullish scenario: Holding $370–$374 and breaking above $391 could create an opportunity to test $395–$408. Bearish scenario: A breakdown below $370 could weaken the recovery and bring $350–$360 into focus. The bigger question is whether tokenized real-world assets will become a meaningful part of global financial markets. Community Question: Would you rather hold traditional Tesla shares or blockchain-based Tesla exposure through TSLAX? Share your thoughts below. #ByXIMPACT #WSOT2026 #BitcoinHitsTwoMonthLowAfterUSMidterms #WSOTPicktoEarn10U #BybitAIEvolving @

#ByXIMPACTHyper Marketing & Analytics (For Crypto‑Focused Projects like Hyperliquid / HYPE) Disclaimer: This is market‑education content only, not financial advice. 📌 Core Definition Hyper marketing means high‑speed, community‑first promotion tailored for fast‑moving crypto audiences — paired with analytics to track what works, who engages, and how market sentiment shifts. For projects such as Hyperliquid (HYPE), it focuses on highlighting network updates, token‑burn events, trading volume growth, and ecosystem expansion. 📊 Key Analytics Areas - On‑chain analytics: Token burn volume, wallet growth, staking activity, supply changes - Market analytics: Price trends, trading volume, liquidation levels, order‑book flow - Marketing analytics: Social reach, engagement rate, hashtag performance, new follower growth, sentiment score (positive / neutral / negative) ✅ Hyper Marketing Focus Points for HYPE 1. Share key milestones: mainnet upgrades, burn announcements, new exchange listings 2. Use short, bold posts for trading communities & WSOT squads 3. Pair every update with simple data points (e.g. “Total HYPE burned: …”) 4. Track which posts get the most views to refine future messaging 📈 Sample Good‑News Marketing Snippet “Hyperliquid keeps building momentum! Latest analytics show rising user activity + large token‑burn events reducing circulating supply. Traders & community members are watching closely as the ecosystem expands — stay tuned for next updates!” $HYPEUSDT #WSOT2026 #WSOTPicktoEarn10U #NovUSCPIWatch #BybitAIEvolving

BITCOIN
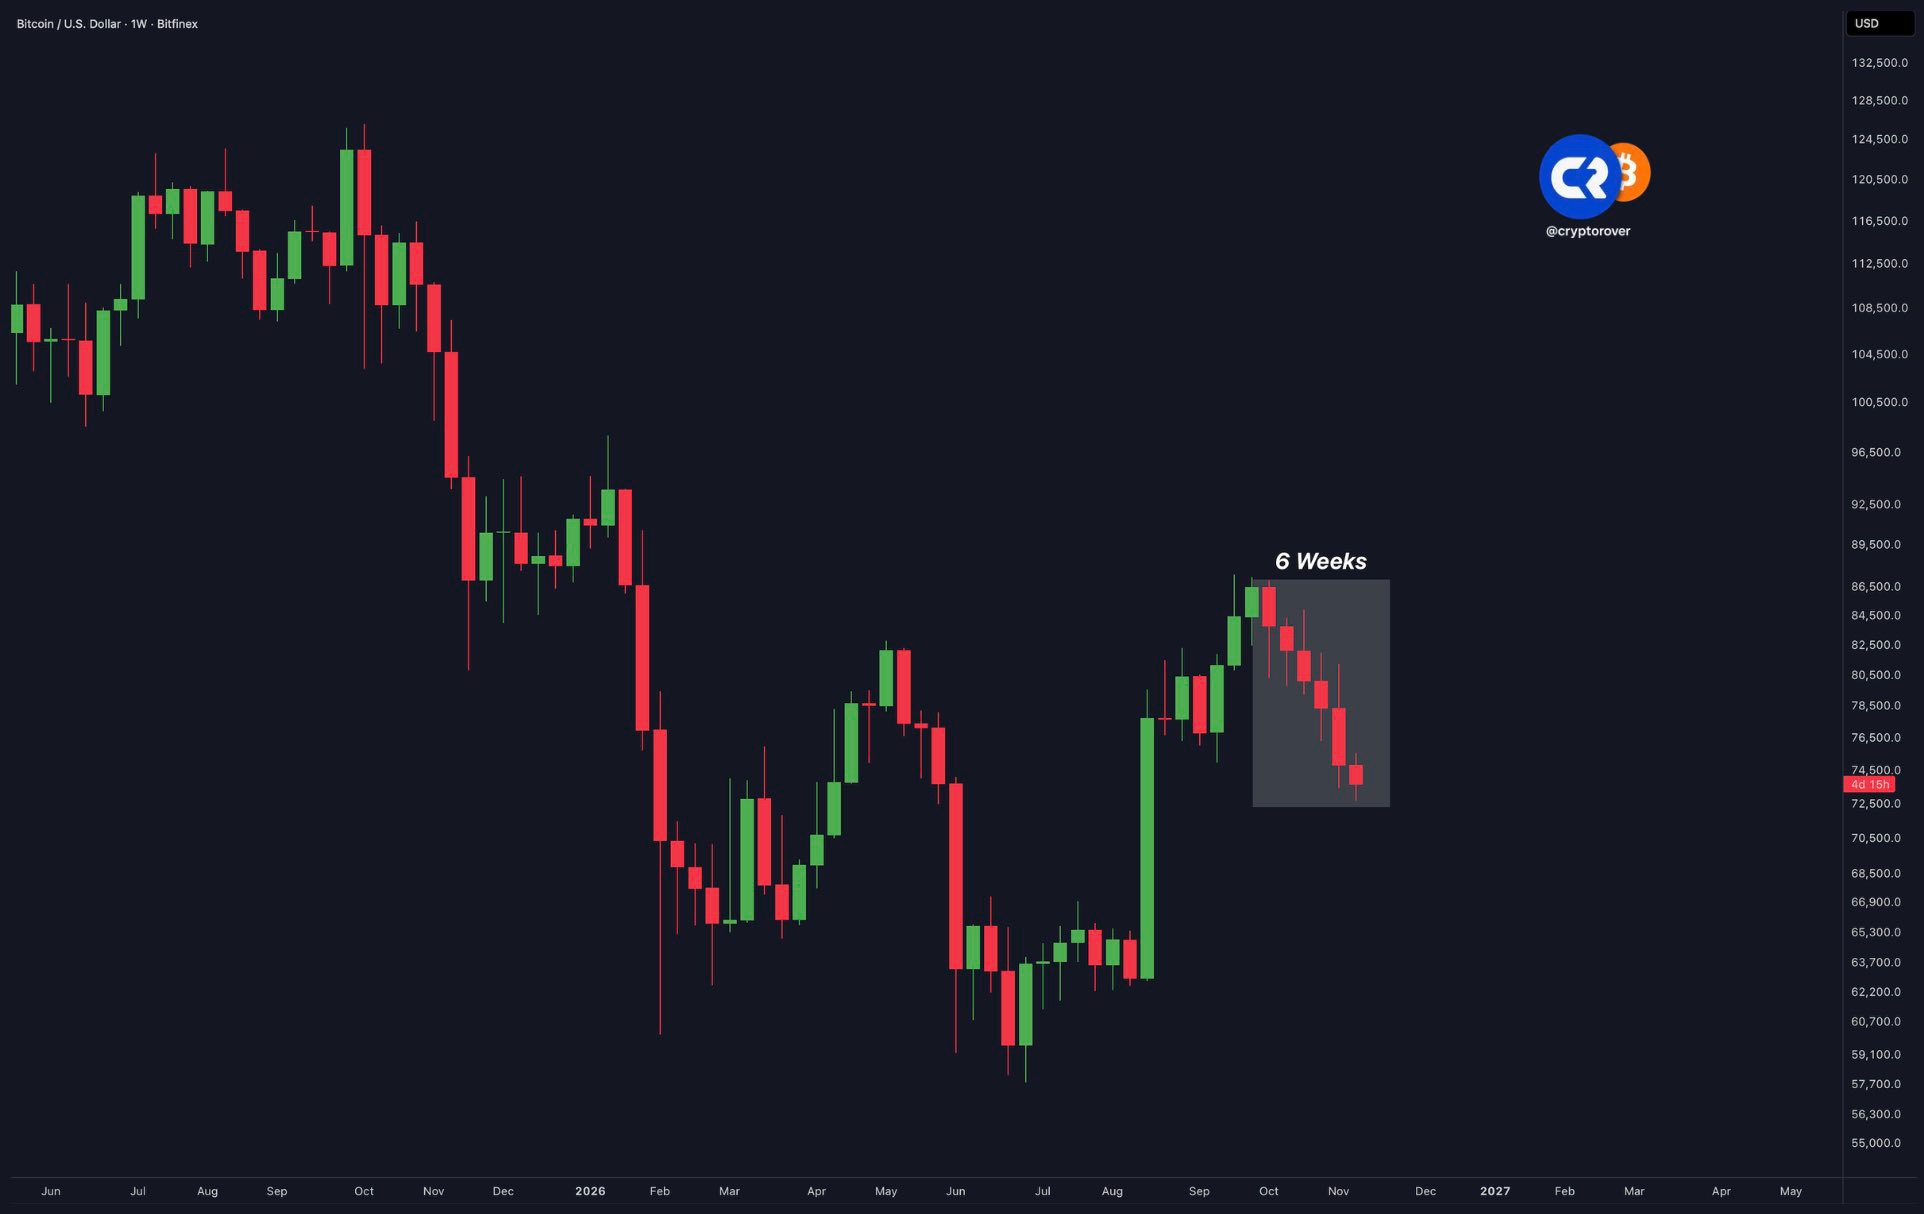
#USPayrollsAndRateDecisionsDriveMacroWeek 🔴 Bitcoin is about to close 6 RED weeks in a row. Bitcoin is experiencing one of the longest losing streaks in its history... Could this mean the longest winning streak in history is coming next? #WSOT2026 #WSOTPicktoEarn10U #OilVolatilityTracksIranPeaceTalks #NovUSCPIWatch
Trading
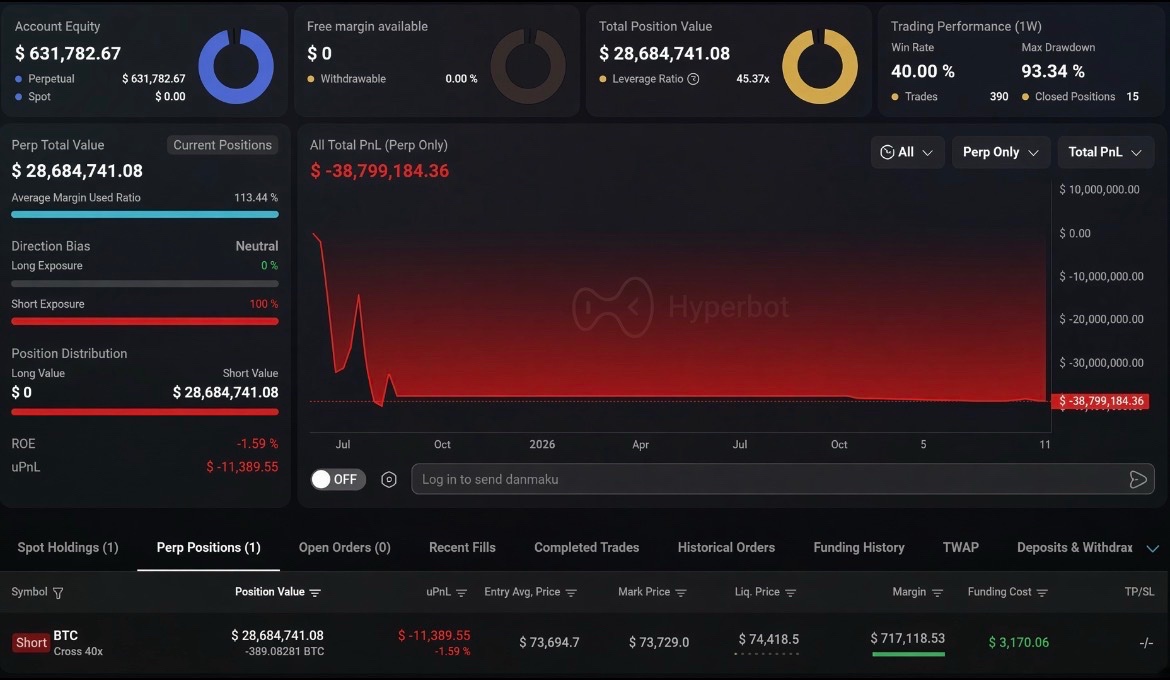
Someone just opened a 40x $BTC short worth ~$30M. His all-time PnL: -$38.8M When people start gambling on the last bit of downside, you know it’s time to go long #WSOT2026 #WSOTPicktoEarn10U #NovUSCPIWatch #USPayrollsAndRateDecisionsDriveMacroWeek #BybitAIEvolving

⚡️ NOW: Ripple CTO Emeritus David Schwartz 💰
Says he has sold nearly all his crypto due to his low risk tolerance. His holdings are down from about 26M $XRPUSDT , 1,500 $BTCUSDT and 40,000 ETH to roughly 3M XRP, 1 BTC and 6 ETH. #NovUSCPIWatch #WSOTPicktoEarn10U #USPayrollsAndRateDecisionsDriveMacroWeek #OilVolatilityTracksIranPeaceTalks #BybitAIEvolving



🚨 BRIEFING TAKTIS: Zona Kompresi, Keheningan
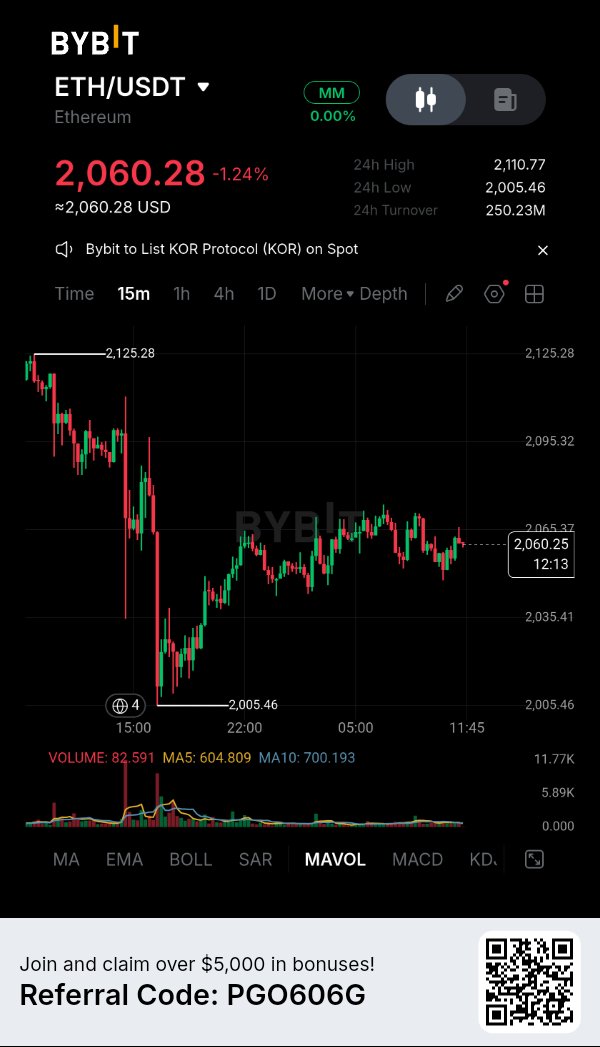
Perhatikan grafik 15 menit. Pasar baru saja menerima pukulan telak. Kita melihat penurunan tanpa henti dari level tertinggi 2.125, yang berpuncak pada pembersihan likuiditas (liquidity sweep) yang tajam langsung ke lantai 2.005,46. Itu adalah *shakeout* klasik yang dirancang untuk melikuidasi posisi *long* dengan *leverage* berlebihan dan menakuti trader ritel agar keluar dari posisi mereka. Namun lihat reaksinya. Para pembeli tidak hanya mempertahankan lantai harga tersebut; mereka menyerap kepanikan dan langsung mendorong harga kembali naik. Kita saat ini berada di 2.060,28, hanya turun 1,24% hari ini, dan harga bergerak menyamping (sideways), terjebak dalam kisaran sempit. Ini bukan kelemahan; ini adalah zona kompresi masif. Pasar sedang membangun energi untuk pergerakan berikutnya. ANALISIS TEKNIS (Mengapa ini penting): · Volume Vakum: Lihat batang volume di bagian bawah. Lonjakan merah masif dari penurunan awal sudah hilang. Volume penjualan telah benar-benar mengering. *Bear* tidak punya amunisi untuk mendorong harga lebih rendah saat ini. · Struktur Higher-Low: Meskipun terjadi gejolak hebat, harga menolak untuk turun kembali ke level terendah 2.005. Kita sedang membentuk struktur *higher-low* yang solid, membangun fondasi beton di bawah harga. · The Squeeze: Kita sedang terkompresi dengan ketat di antara *support* 2.035 dan *resistance* 2.065. *Moving average* mulai menyatu. Ekspansi tajam ke satu arah tidak terelakkan. RENCANA EKSEKUSI (BERDASARKAN ATURAN KETAT): Saya tidak memperdagangkan kondisi pasar yang tidak menentu seperti ini. Saya menunggu pasar menunjukkan arahnya, lalu saya menyerang dengan presisi bedah. 🎯 Pemicu (Trigger): Saya memantau candle 15 menit yang kuat untuk ditutup dengan kokoh di atas *resistance* lokal di 2.065,00. Begitu *bull* mengubah level tersebut menjadi *support* dengan lonjakan volume beli, pintu jebakan terbuka. 🛑 Invalidasi (Risiko): Ini tindakan bedah. Jika harga ditolak dengan agresif di sini dan kehilangan *support* struktural terkini di 2.035,00, tesis *bullish* menjadi tidak valid. Saya langsung keluar. Tanpa emosi, hanya *price action*. 💰 Target: · TP1: 2.095,00 (Resistance lokal terdekat) · TP2: 2.110,00 (Uji ulang level tertinggi 24 jam) KESIMPULAN: Pasar sedang melingkar seperti pegas. Jebakan telah disiapkan untuk *bear*. Saya tetap fokus, sabar, dan siap menyerang tepat di saat volume kembali dan *bull* berhasil menembus plafon harga. Apakah Anda melakukan trading di tengah gejolak ini, atau Anda menunggu *breakout* di atas 2.065? $ETHUSDT #ByXIMPACT #WSOT2026 #Pantauan IHK AS November #WSOTPicktoEarn10U #Data Penggajian AS dan Keputusan Suku Bunga Mendorong Pekan Makro


$AVAX Subnets & Rebound Test
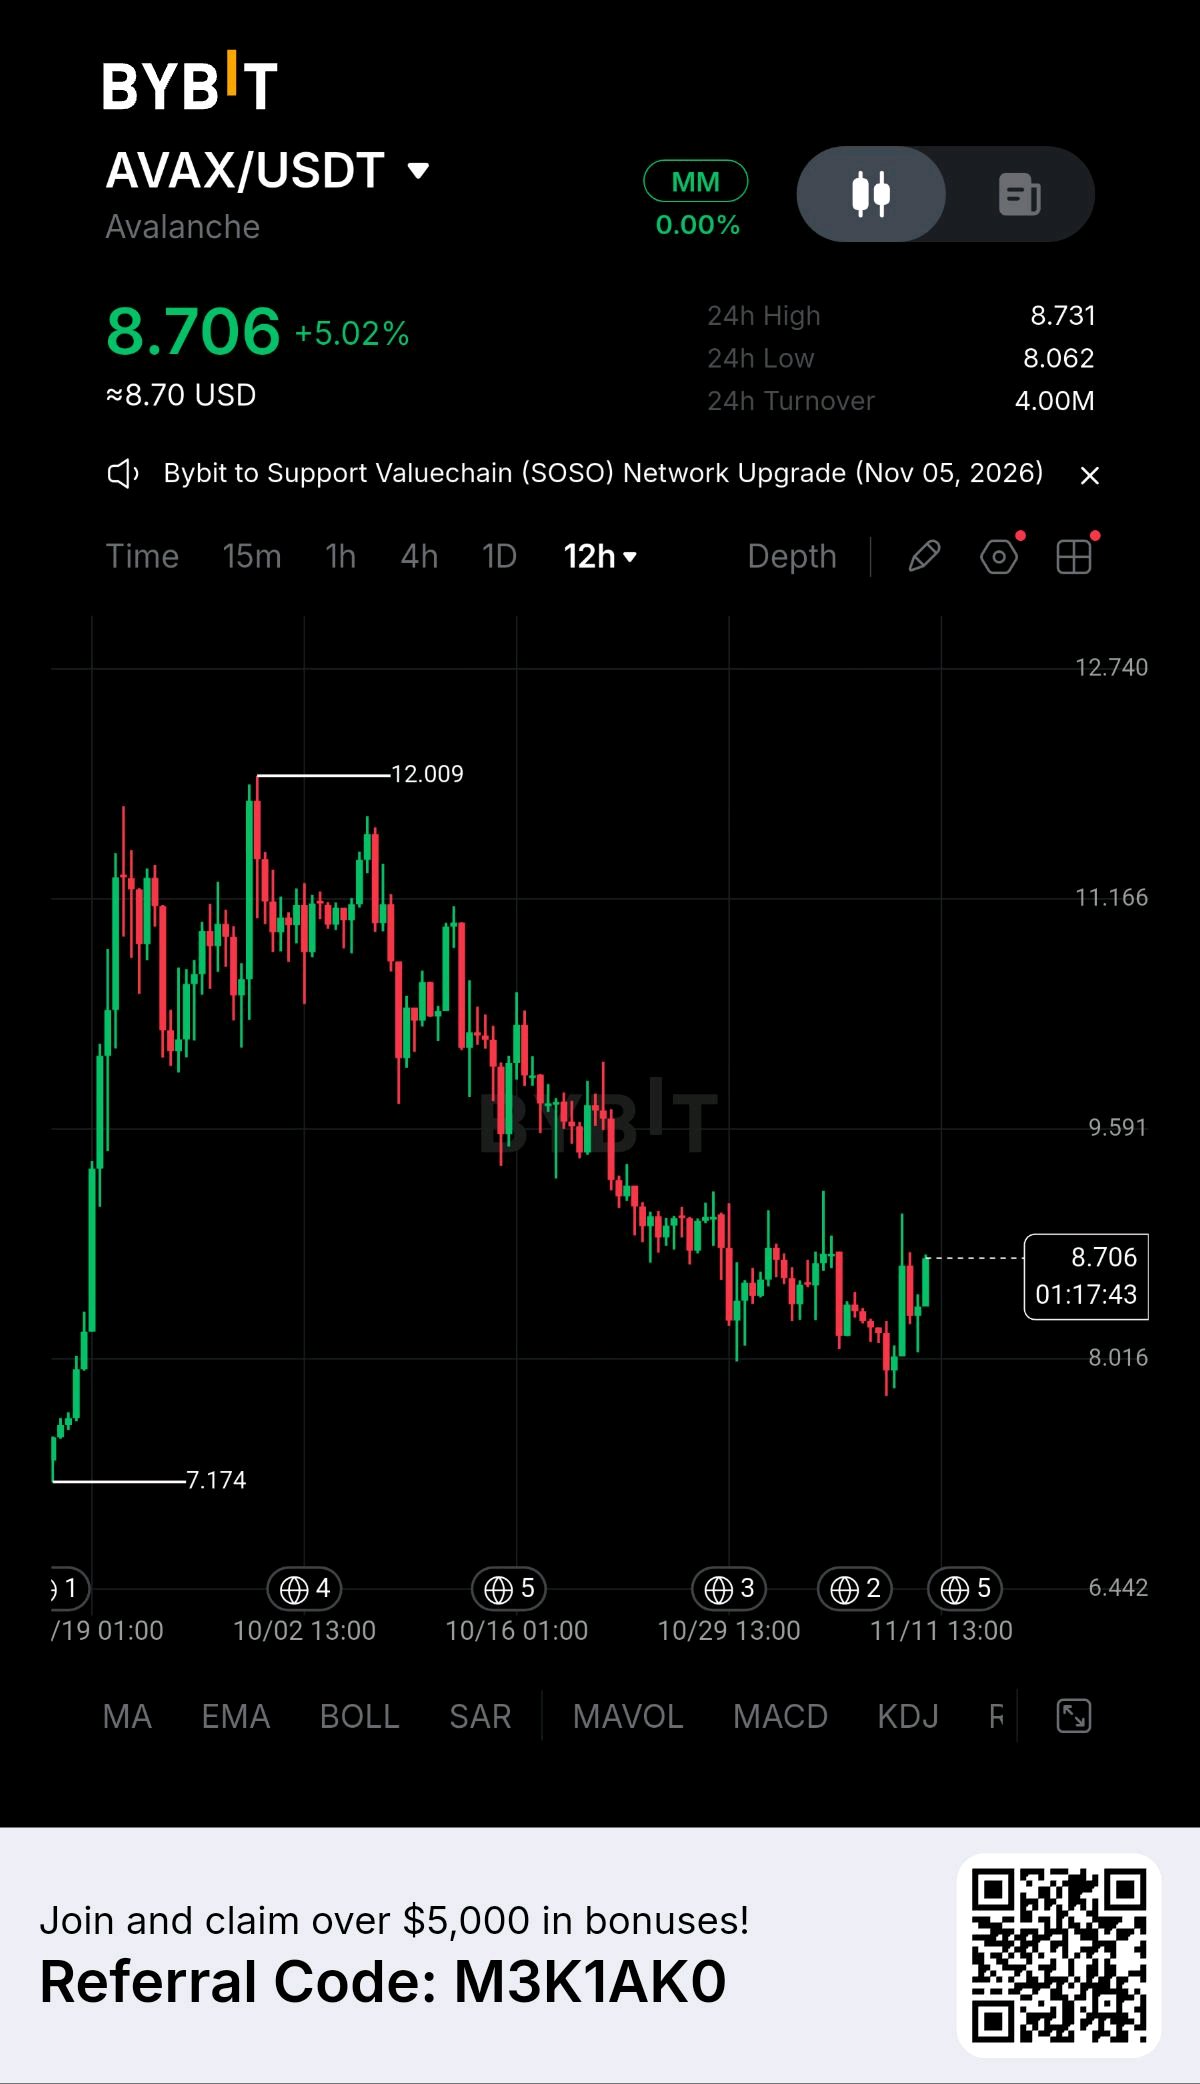
Latest News & Ecosystem Catalysts ➠ Subnet Scalability & Enterprise Adoption: Avalanche continues expanding its custom subnet architecture, driving institutional asset tokenization and high-throughput deployment across modular application chains. ➠ Network Upgrade Integration: Ecosystem validator updates and cross-chain messaging bridges improve transaction finality and user onboarding efficiency. ➠ Exchange Turnover Expansion: 24-hour trading turnover reaches $4.00M on Bybit as market volume picks up across layer-1 alternative pairs. Whale & Institutional Money Flow ➠ Order Book Bid Aggregation: Strong structural buy-side volume clusters defend the $8.016 to $8.062 demand corridor, absorbing multi-week corrective pressure. ➠ Smart Money Accumulation: On-chain metrics reveal large-wallet accumulation phases following the successful defense of multi-day swing lows near $7.174. Liquidity & Volume Dynamics ➠ Spot Price & Turnover Action: Spot $AVAX trades at $8.706 (+5.02%) on Bybit. 24-hour turnover registers at $4.00M with daily price oscillating between a low of $8.062 and a high of $8.731. ➠ Technical Rebound Momentum: Price action demonstrates an impulsive recovery leg, testing local resistance boundaries following a prolonged correction from highs near $12.009. Tokenomics & Structural Supply ➠ Deflationary Staking Model: Base fee burning mechanisms and validator bonding requirements continually reduce circulating liquid float during high network activity periods. Narrative & Market Sector ➠ Modular Subnet Infrastructure: Positions itself as a premier customizable layer-1 network tailored for institutional finance, enterprise subnet deployment, and high-performance decentralized gaming. Key Technical Setup (12H Chart) ➠ Primary Resistance Levels: $9.591 | $11.166 | $12.009 ➠ Core Support Levels: $8.016 | $7.174 | $6.442 Risk versus Reward Ratio ➠ Risk/Reward Profile: Favorable at 1:3.2 for momentum continuation swing positions initiated near the $8.05 to $8.45 retest zone, targeting an expansion toward $9.591 and $11.166. Trader’s Game Plan ➠ Support Retest Entry Strategy: Accumulate long exposure on healthy pullbacks into the $8.016–$8.400 support band, maintaining a strict stop loss below $7.100. ➠ Breakout Expansion Strategy: Trigger momentum long setups on a confirmed 12-hour candle close above local resistance at $8.731, targeting a push toward $9.591. Investor’s Angle ➠ Strategic Layer-1 Allocation: Building disciplined positioning near structural demand floors provides high asymmetric upside exposure during altcoin sector rotation phases. Not financial advice. $AVAXUSDT $LITUSDT #WSOT2026 #NovUSCPIWatch #WSOTPicktoEarn10U
📈SPX shows a strong bullish directional strength with a 71.7% probability despite extreme implied volatility and negative GEX positioning. Market sentiment is cautious due to macroeconomic headwinds including Fed rate hike expectations and de-dollarization concerns. Given your small holdings mainly in stable assets, cautious exposure to SPX spot buying could be considered for short-term gains.💡 行动建议Consider light spot buying with tight risk controls due to high volatility and macro uncertainty.⚠️ Risk Warning:- Extreme implied volatility indicates high price fluctuation risk- Macroeconomic uncertainties including Fed policy and global de-dollarization pressure market sentiment- Negative GEX suggests market makers may hedge downside, increasing volatility risk $SPXUSDT #ByXIMPACT #WSOT2026 #WSOTPicktoEarn10U #NovUSCPIWatch #BybitAIEvolving

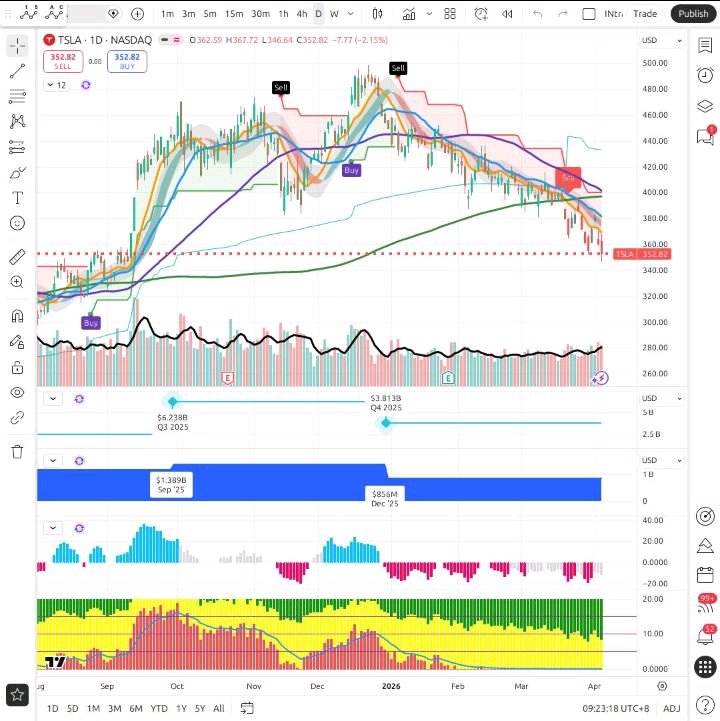
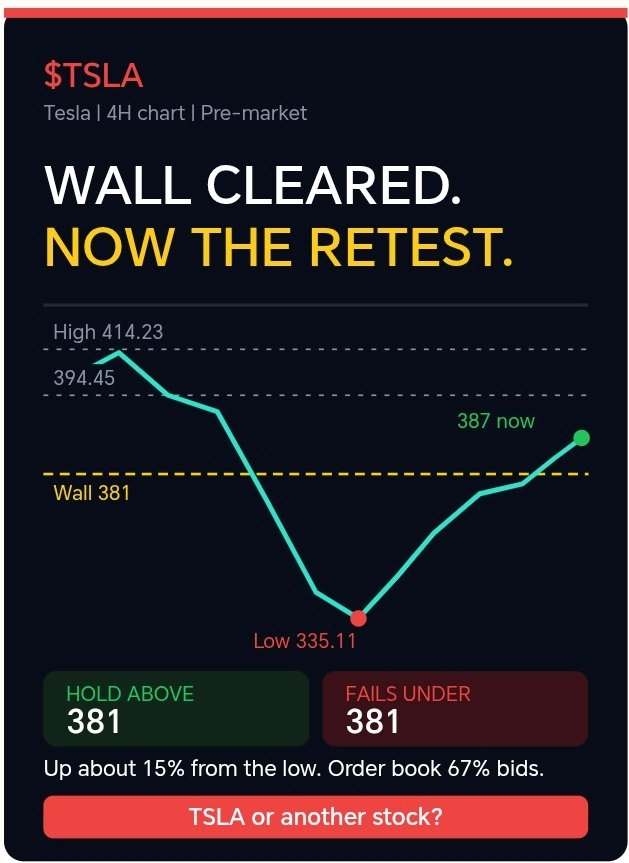
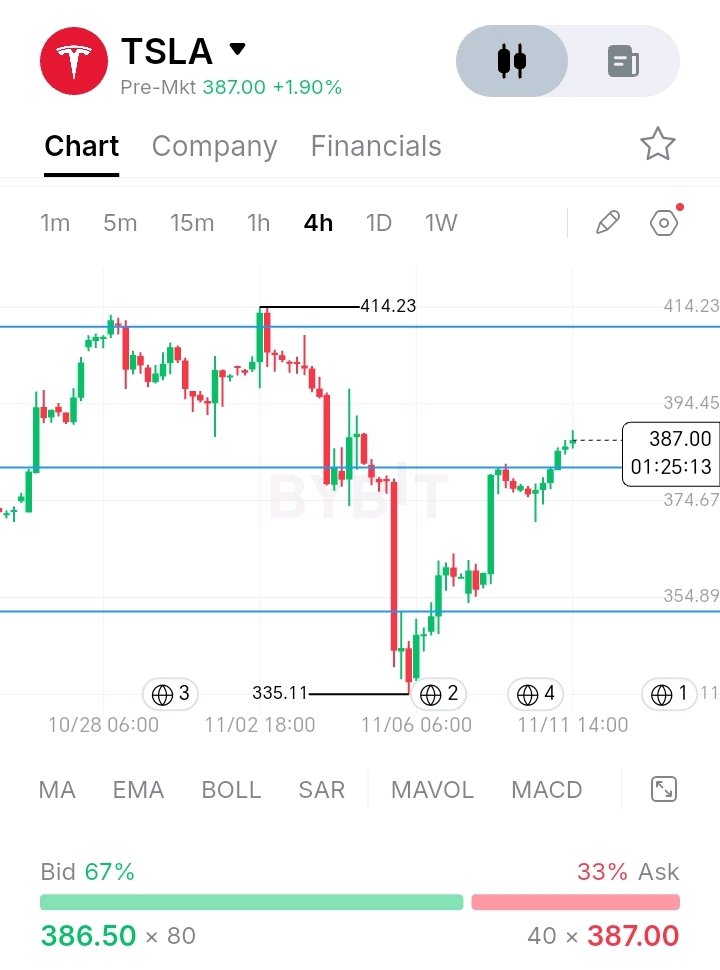
🧗 The wall is cleared in pre-market. Now comes the harder part. I don't want to celebrate $TSLA's recovery before it proves itself. I want to see 4H closes holding above the 381 line, because a level only turns into support after it survives a retest. Here's what the 4H chart shows: 🔹 The recovery: From the 335.11 low, $TSLA has climbed about 15%, higher lows and strong green candles the whole way. It has regained about two-thirds of the drop from 414.23. 🔹 The wall: The 381 line stopped price several times before. Pre-market price is now above it, and that's the first real break of the recovery. 🔹 The next levels: 394.45 sits just above on the chart, with the 414.23 high as the larger reference. That's about 7% above the current pre-market price. 🔹 The order book: Bids are around 67% vs 33% asks, a buyer-heavy lean. Pre-market books are thin, so it's a hint rather than proof. 🔹 The risk: After a fast 15% rebound, price often pulls back to test the level it just cleared. That retest is what decides whether 381 is now support. 🟢 Bullish: 4H closes holding above 381, then 394.45 and 414.23. A shallow pullback to 381 that holds would be a strong sign. 🔴 Bearish: a 4H close back under 381 makes this a failed reclaim, with 352 and the 335.11 low below. The breakout is the first step. The retest is the real test. TSLA or another stock? #TSLA #Stocks #BinanceSquare #WSOT2026 #WSOTPicktoEarn10U #USPayrollsAndRateDecisionsDriveMacroWeek #OilVolatilityTracksIranPeaceTalks #BybitAIEvolving $TSLAXUSDT$BTCUSDT

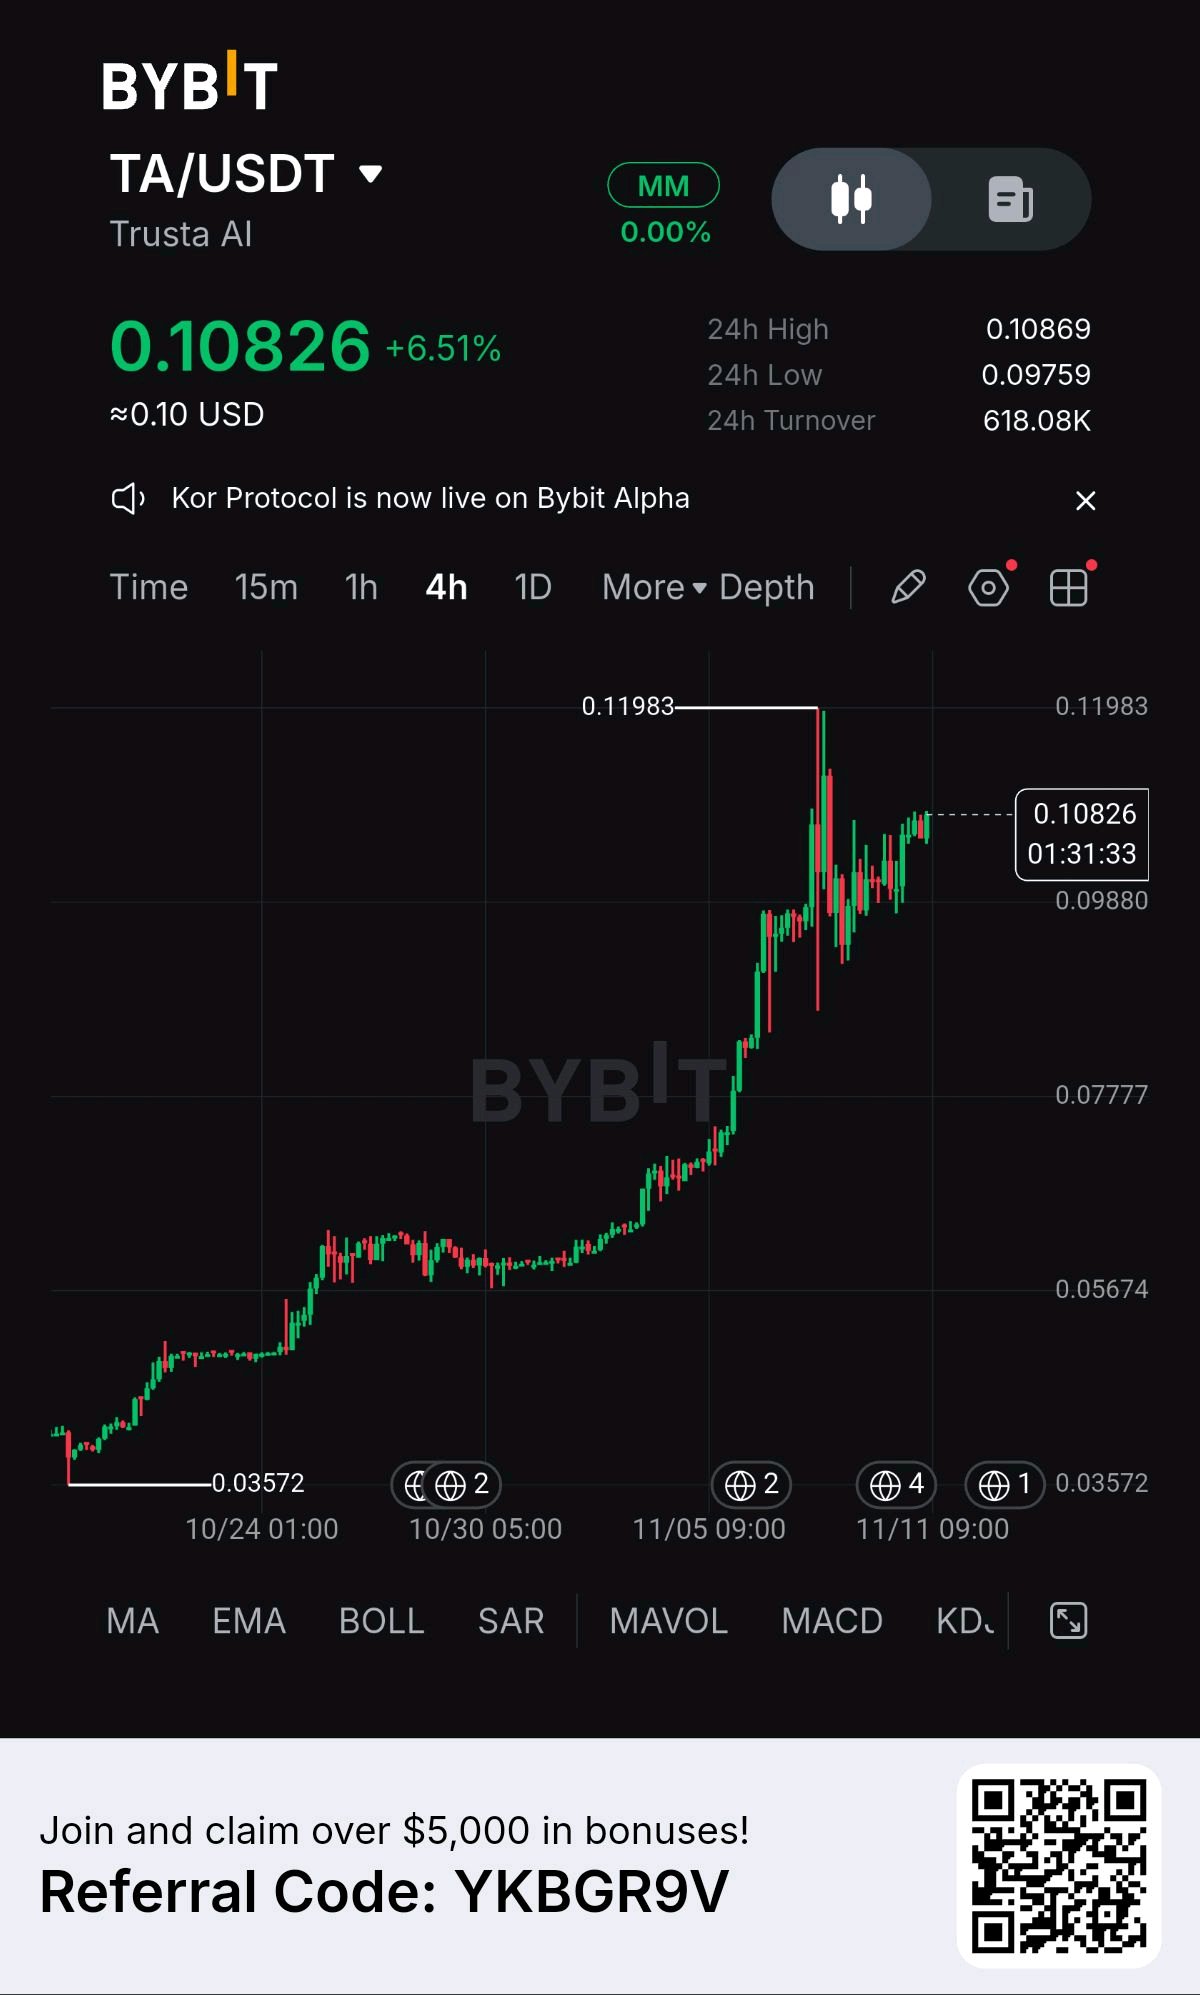
$0.15 Target Reaffirmed: $TA Parabolic Expansion & AI Data Base Market News & Macro Catalysts ✔ Bybit Spot Liquidity & Turnover: Trusta AI ($TA) registered a +6.51% intraday gain to trade at $0.10826 on Bybit, backed by 24-hour trading turnover volume of $618.08K. ✔ AI Identity & On-Chain Reputation Infrastructure: Trusta AI's core scoring engine continues to expand adoption across Layer-1 and Layer-2 ecosystems, providing Sybil attack prevention and verifiable identity metrics for Web3 protocols. ✔ Bybit Ecosystem Rotation: The debut of Kor Protocol on Bybit Alpha has catalyzed speculative liquidity rotation across early-stage AI agent and data-management protocols on the exchange. ✔ Intraday Range Stability: Price action established a firm 4-hour trading baseline between a session low of $0.09759 and a high of $0.10869, sustaining its structural uptrend off recent accumulation floors. Market Analysis & Price Action The Parabolic Trend Vector: 4-hour $TA price action at $0.10826 shows a powerful macro trend expansion originating from the $0.03572 accumulation base. The Overhead Supply Test: Following a sharp spike to the $0.11983 local swing peak, price action consolidated into a higher low at $0.09880 before resuming its upward trajectory to retest local high supply. Current Momentum: Market structure is aggressively bullish, with buyers defending step-up support levels ($0.03572 → $0.05674 → $0.07777 → $0.09880) to maintain upward momentum. Liquidity Targets: Downside sell-side liquidity rests below $0.09880. On the upside, immediate buy-side liquidity sits at $0.11983, with secondary macro expansion targeting $0.13500 and $0.15000. Support and Resistance Levels ✔ Immediate Support: $0.09880 – $0.10200 (4-hour local consolidation shelf & higher-low demand floor) ✔ Invalidation Support: $0.07777 (Major structural swing breakdown level) ✔ First Resistance Target: $0.11983 – $0.13500 (Immediate local peak & expansion supply zone) ✔ Macro Resistance Target: $0.15000 – $0.18000 (Major historical price discovery target zone) Risk Management Rule: A 4-hour close below $0.07777 invalidates the immediate parabolic continuation thesis and opens risk toward lower liquidity brackets at $0.05674. Maintain strict position sizing limited to 1–2% of total trading equity. $TAUSDT $COREUSDT #WSOT2026 #WSOTPicktoEarn10U #NovUSCPIWatch

Altcoin Opportunities
Research Before Following the Crowd! The altcoin market offers many innovative projects, but popularity alone does not establish long-term value. I prefer to examine tokenomics, development progress, liquidity, partnerships, and actual product usage before evaluating any project. Understanding the risks is just as important as identifying potential opportunities. Which altcoin deserves more attention for its technology and real-world utility? This is my personal market analysis, not financial advice. Always do your own research (DYOR). #Altcoins #CryptoResearch #Tokenomics #Blockchain #Bybit #DYOR #BybitAIEvolving #WSOT2026 #NovUSCPIWatch #WSOTPicktoEarn10U #USPayrollsAndRateDecisionsDriveMacroWeek
Solana ($SOL)
Can Ecosystem Expansion Strengthen Its Position? Solana has built a growing ecosystem around decentralized finance, applications, and digital assets. Its ability to attract developers, maintain network reliability, and increase real user activity will be important factors to watch. I believe long-term adoption is more meaningful than temporary market excitement. What should Solana prioritize next: network stability, developer growth, or wider adoption? This is my personal market analysis, not financial advice. Always do your own research (DYOR). #Solana #SOL #Blockchain #CryptoAnalysis #Bybit #DYOR$SOLUSDT #WSOTPicktoEarn10U #NovUSCPIWatch #WSOT2026 #USPayrollsAndRateDecisionsDriveMacroWeek #BybitAIEvolving

GRAM Gains 10%: Can Bulls Break $1.20?
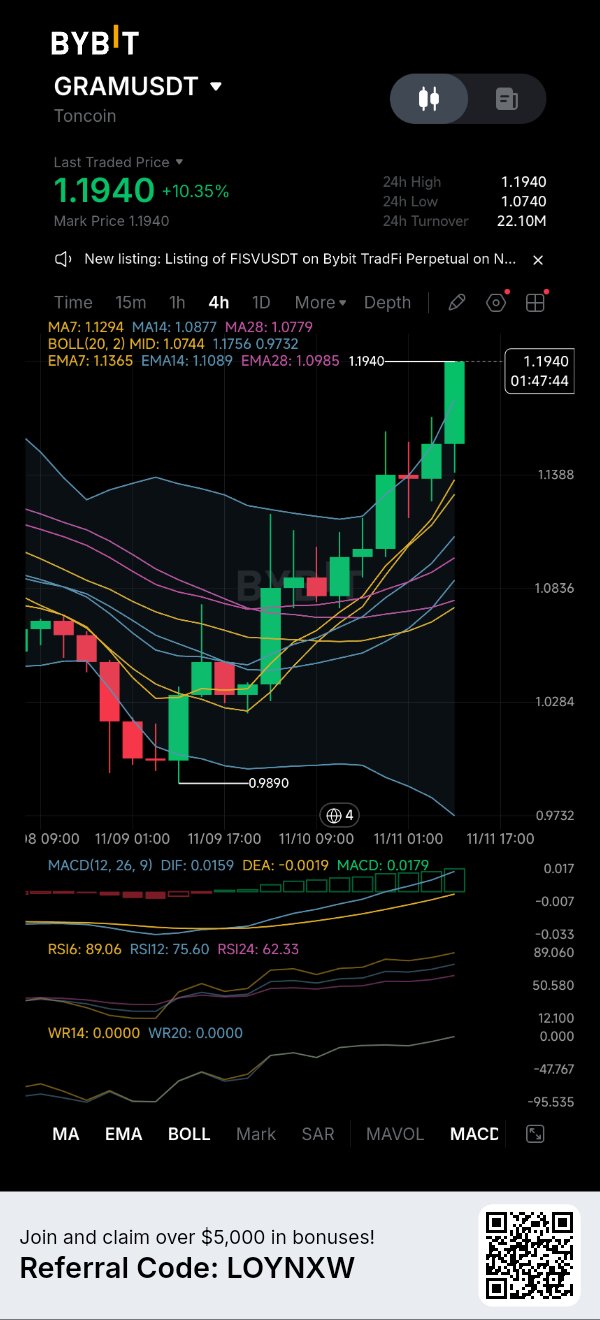
$GRAMUSDT is showing impressive momentum after recovering from its recent $0.9890 low. Price is now trading around $1.1940, up 10.35%, with consecutive bullish candles pushing toward the $1.20 psychological resistance. The 4H structure has turned decisively bullish: • Price is above MA7 ($1.1294), MA14 ($1.0877) and MA28 ($1.0779). • MACD is bullish, with DIF at 0.0159 above DEA at -0.0019. • The MACD histogram has expanded to 0.0179, confirming strengthening momentum. • RSI6 stands at 89.06, while RSI12 is at 75.60, indicating an extremely overbought market. There is strong buying pressure, but the distance between price and the moving averages suggests that the rally may need a cooling-off period. Key levels to watch: - Immediate resistance: $1.1940 - Psychological resistance: $1.2000 - First support: $1.1756 - Secondary support: $1.1365–$1.1294 - Stronger support: $1.1089–$1.0985 A sustained breakout above $1.1940 could bring $1.20 into focus. However, rejection near this level could trigger profit-taking, with $1.1756 becoming the first important support to monitor. The bullish momentum is clear, but an RSI above 89 is a warning against chasing the current candle. Trading focus: Watch for consolidation, a controlled pullback or a confirmed breakout retest. Check liquidity, define invalidation and assess risk-to-reward before considering a position. Can GRAM sustain its momentum above $1.20, or will buyers take a breather first? Not financial advice. DYOR. #WSOT2026 #NovUSCPIWatch #WSOTPicktoEarn10U #USPayrollsAndRateDecisionsDriveMacroWeek #OilVolatilityTracksIranPeaceTalks $GRAMUSDC

BTC & ETH
The Two Pillars of the Crypto Market Bitcoin and Ethereum continue to serve different but important roles in the digital asset industry. Bitcoin is known for its limited supply and decentralized value, while Ethereum supports smart contracts and a wide range of blockchain applications. Their future development depends on adoption, investor confidence, and technological progress. Which one do you believe has stronger long-term potential: $BTC or $ETH? This is my personal market analysis, not financial advice. Always do your own research (DYOR). #Bitcoin #BTC #Ethereum #ETH #CryptoMarket #Bybit #DYOR #WSOT2026 #NovUSCPIWatch #WSOTPicktoEarn10U #USPayrollsAndRateDecisionsDriveMacroWeek #OilVolatilityTracksIranPeaceTalks $BTCUSDT $ETHUSDT

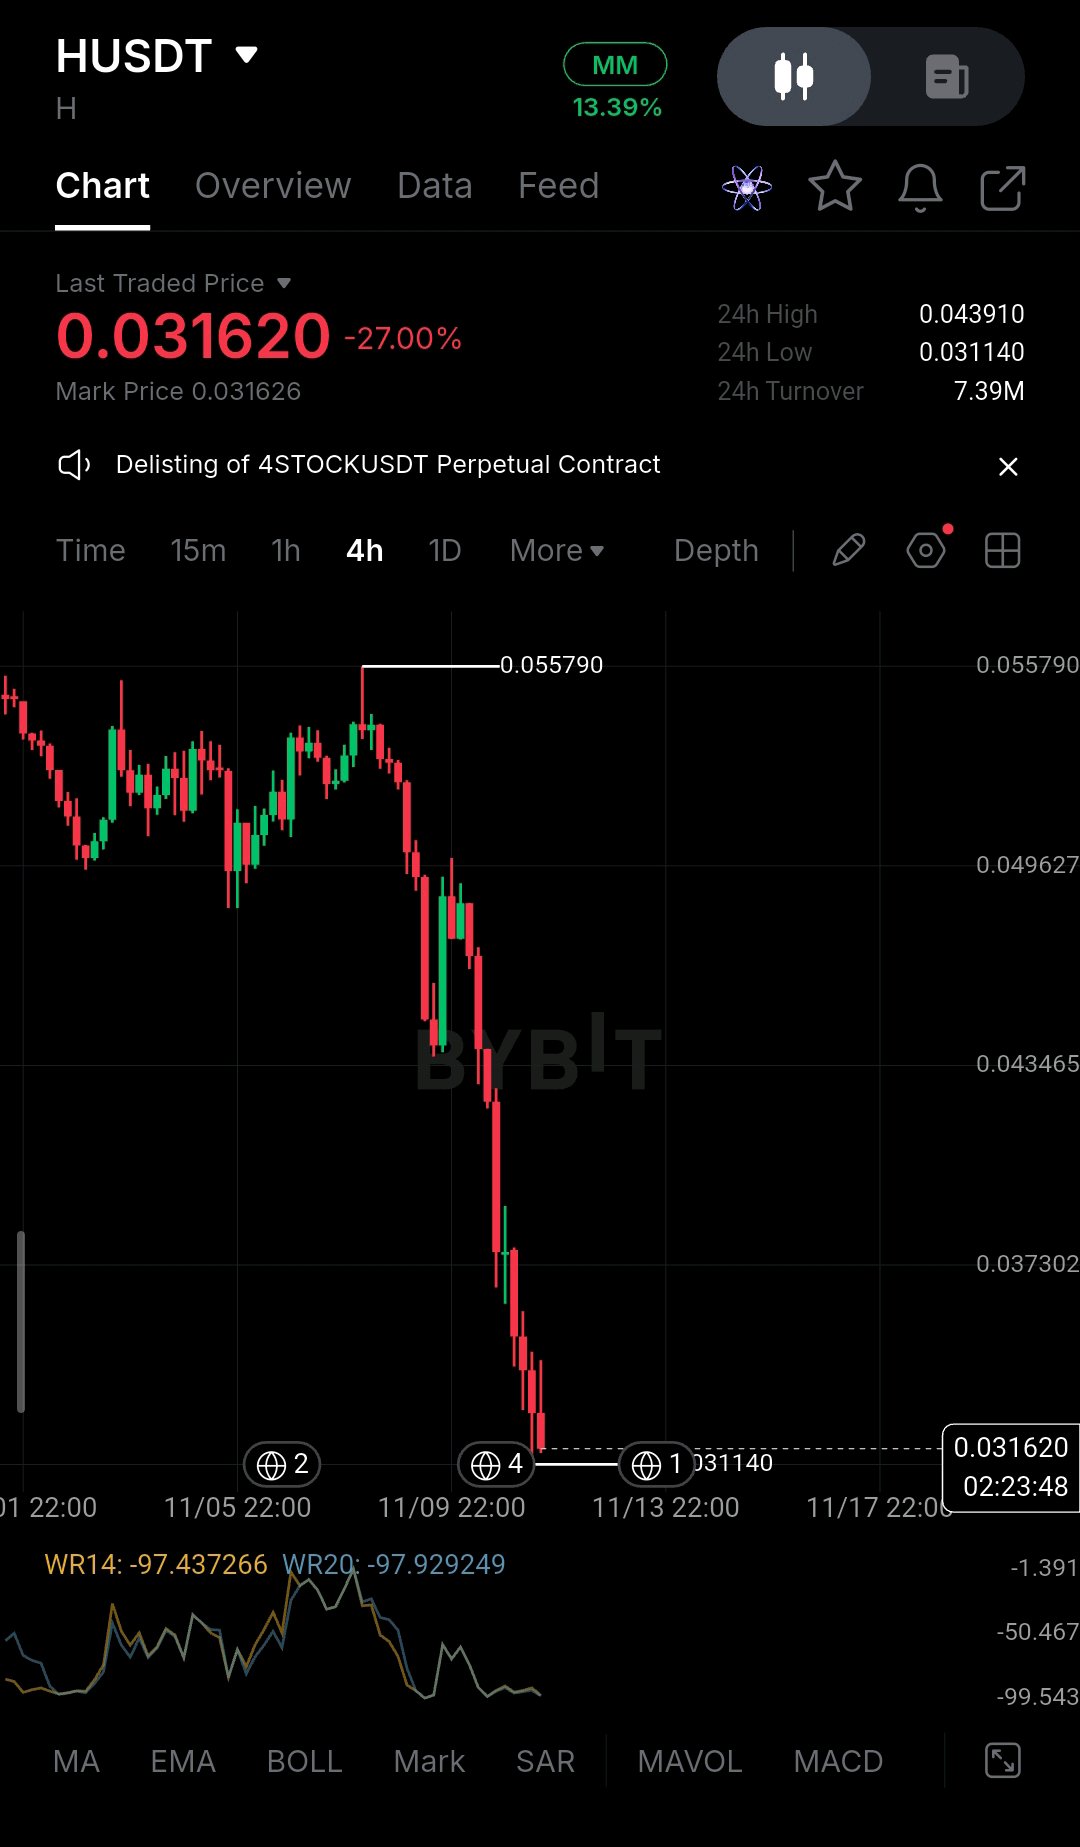
😳📉 $HUSDT Humanity Protocol kembali berdarah-darah, dan grafiknya makin anjlok ke bawah ⚰️ 🩸 Kapitalisasi pasar turun dari puncaknya yang sempat di atas $1 Miliar menjadi sekitar $70-80 Juta saat ini (estimasi saya) 💥 🧨 Peretasan private-key senilai $36 Juta pada bulan Juni belum pulih. Itu membuat token anjlok sekitar 90% dan memaksa migrasi token secara penuh 🔑 🔓 Unlock berikutnya tanggal 25 Nov: 266 Juta H, sekitar $8 Juta dengan harga hari ini. Trader sudah melakukan aksi jual duluan (front-running) karena mengantisipasi tekanan jual 📉 👀 GoPlus menandai kontrak token yang baru sebagai 'upgradeable', jadi pemiliknya bisa mengubah kode, termasuk melakukan minting 🚨 Apakah ini titik terendah, atau unlock ini bakal bikin harganya makin anjlok? 🕳️ Mana yang lebih bikin kamu takut: unlock atau kontraknya? 👇 ➕ Follow untuk info lebih lanjut #Pantauan IHK AS November #Data Penggajian AS dan Keputusan Suku Bunga Mendorong Pekan Makro #WSOTPicktoEarn10U @BybitX @killer901 @WhaleX🐳 @JANGAN HAKIMI SAYA

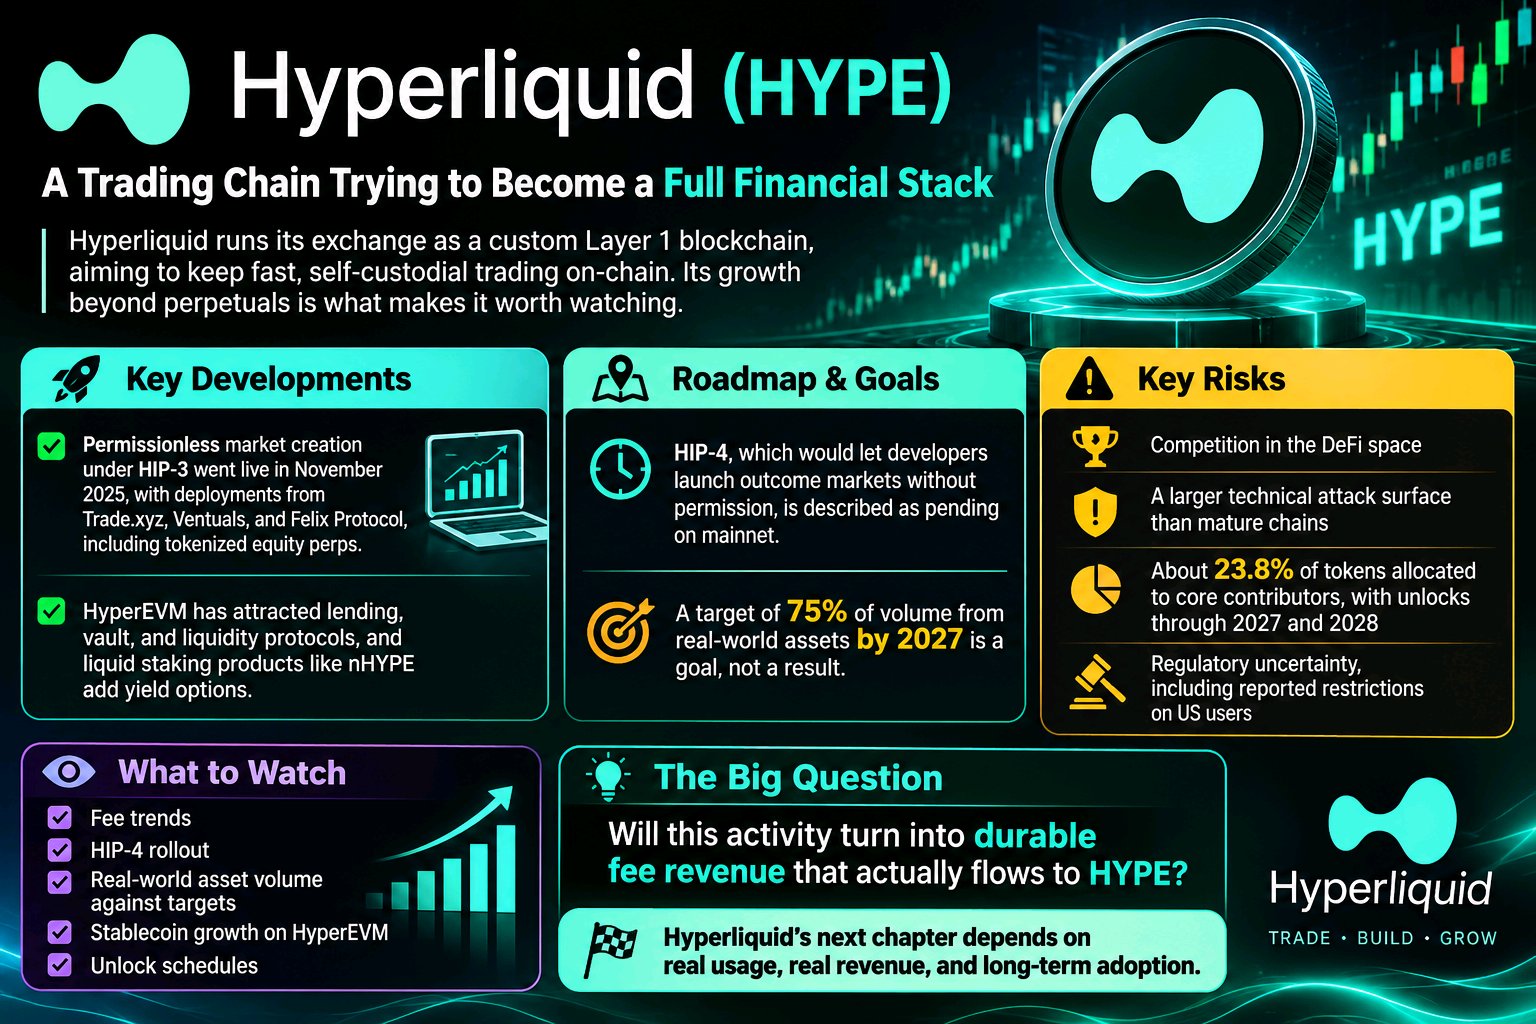
Hyperliquid (HYPE): Rantai Perdagangan yang Berupaya Menjadi Tumpukan Keuangan Lengkap Hyperliquid menjalankan bursa efeknya sebagai blockchain Layer 1 khusus, dengan tujuan untuk menjaga perdagangan yang cepat dan mandiri (self-custodial) tetap ada di dalam rantai (on-chain). Pertumbuhannya di luar perpetual adalah hal yang membuatnya layak untuk diperhatikan. Penciptaan pasar tanpa izin (permissionless) di bawah HIP-3 mulai aktif pada November 2025 dengan peluncuran dari Trade.xyz, Ventuals, dan Felix Protocol, termasuk perp ekuitas yang ditokenisasi. HyperEVM telah menarik protokol pinjaman, vault, dan likuiditas, serta produk staking likuid seperti nHYPE yang menambahkan opsi hasil (yield). Beberapa item masih bersifat pandangan ke depan. HIP-4, yang akan memungkinkan pengembang meluncurkan pasar hasil (outcome markets) tanpa izin, digambarkan masih tertunda di mainnet, dan target 75% volume dari aset dunia nyata (real-world assets) pada 2027 adalah sebuah tujuan, bukan hasil. Pertanyaan yang lebih besar adalah apakah aktivitas ini berubah menjadi pendapatan biaya (fee revenue) yang tahan lama dan benar-benar mengalir ke HYPE. Risiko yang ada termasuk persaingan, permukaan serangan teknis yang lebih besar daripada rantai yang sudah matang, sekitar 23,8% token dialokasikan untuk kontributor inti dengan pembukaan kunci (unlock) hingga 2027 dan 2028, serta ketidakpastian regulasi, termasuk pembatasan yang dilaporkan terhadap pengguna AS. Perhatikan tren biaya, peluncuran HIP-4, volume aset dunia nyata terhadap target, pertumbuhan stablecoin di HyperEVM, dan jadwal pembukaan kunci. #IMPACTbyTrade $HYPEUSDT $BTCUSDT #Oracle20BFundingPlanTestsTheAITrade #WSOT2026 #WSOTPicktoEarn10U

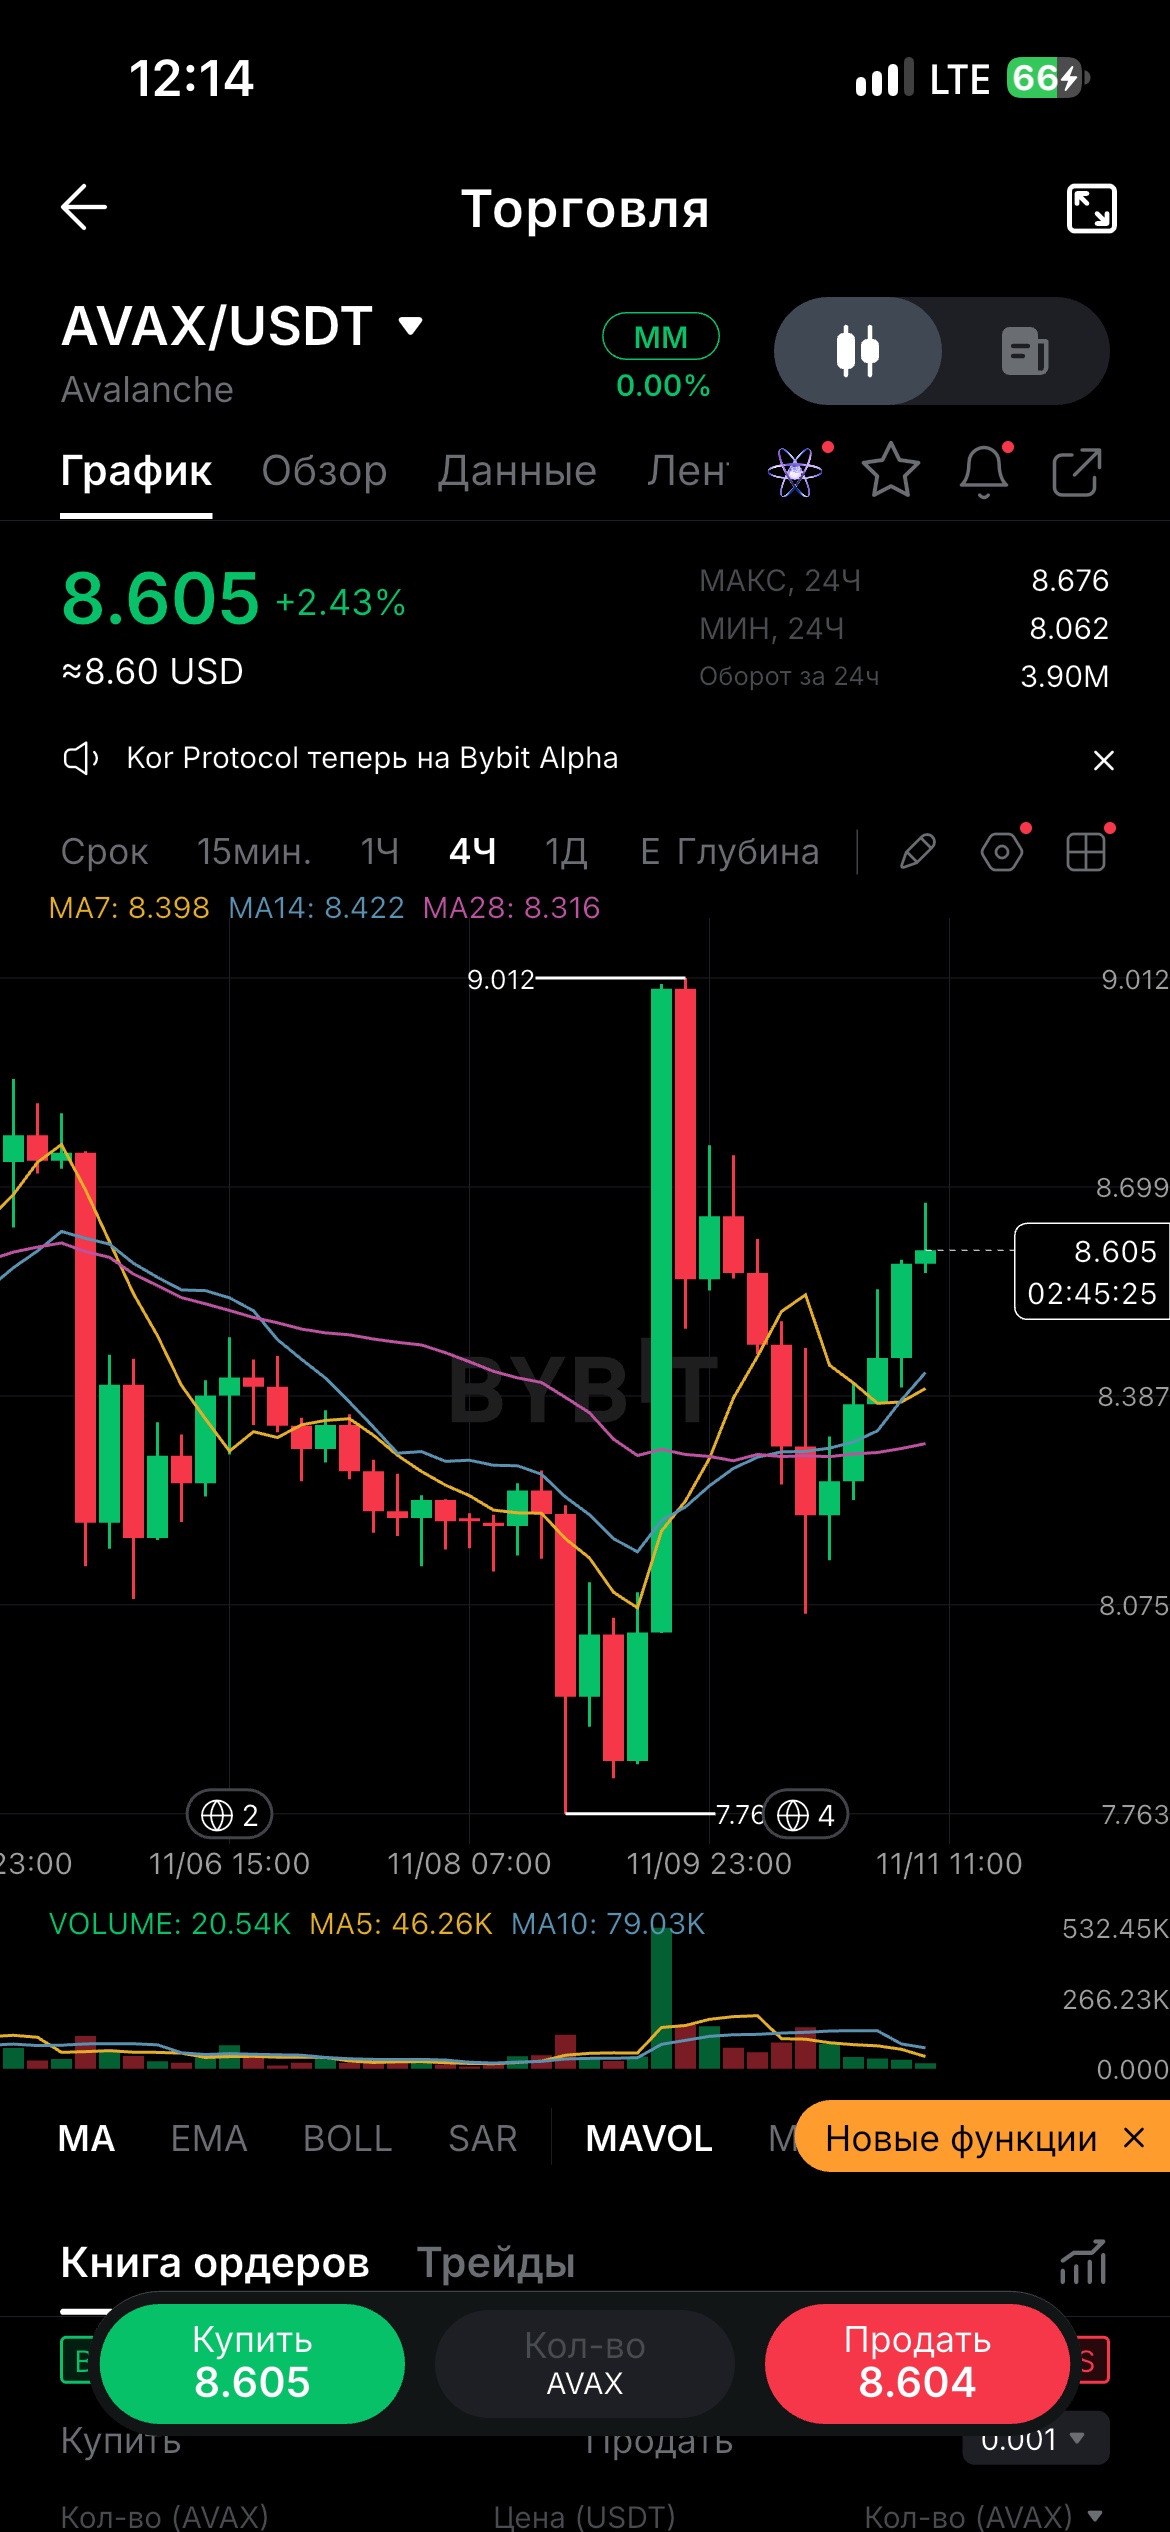
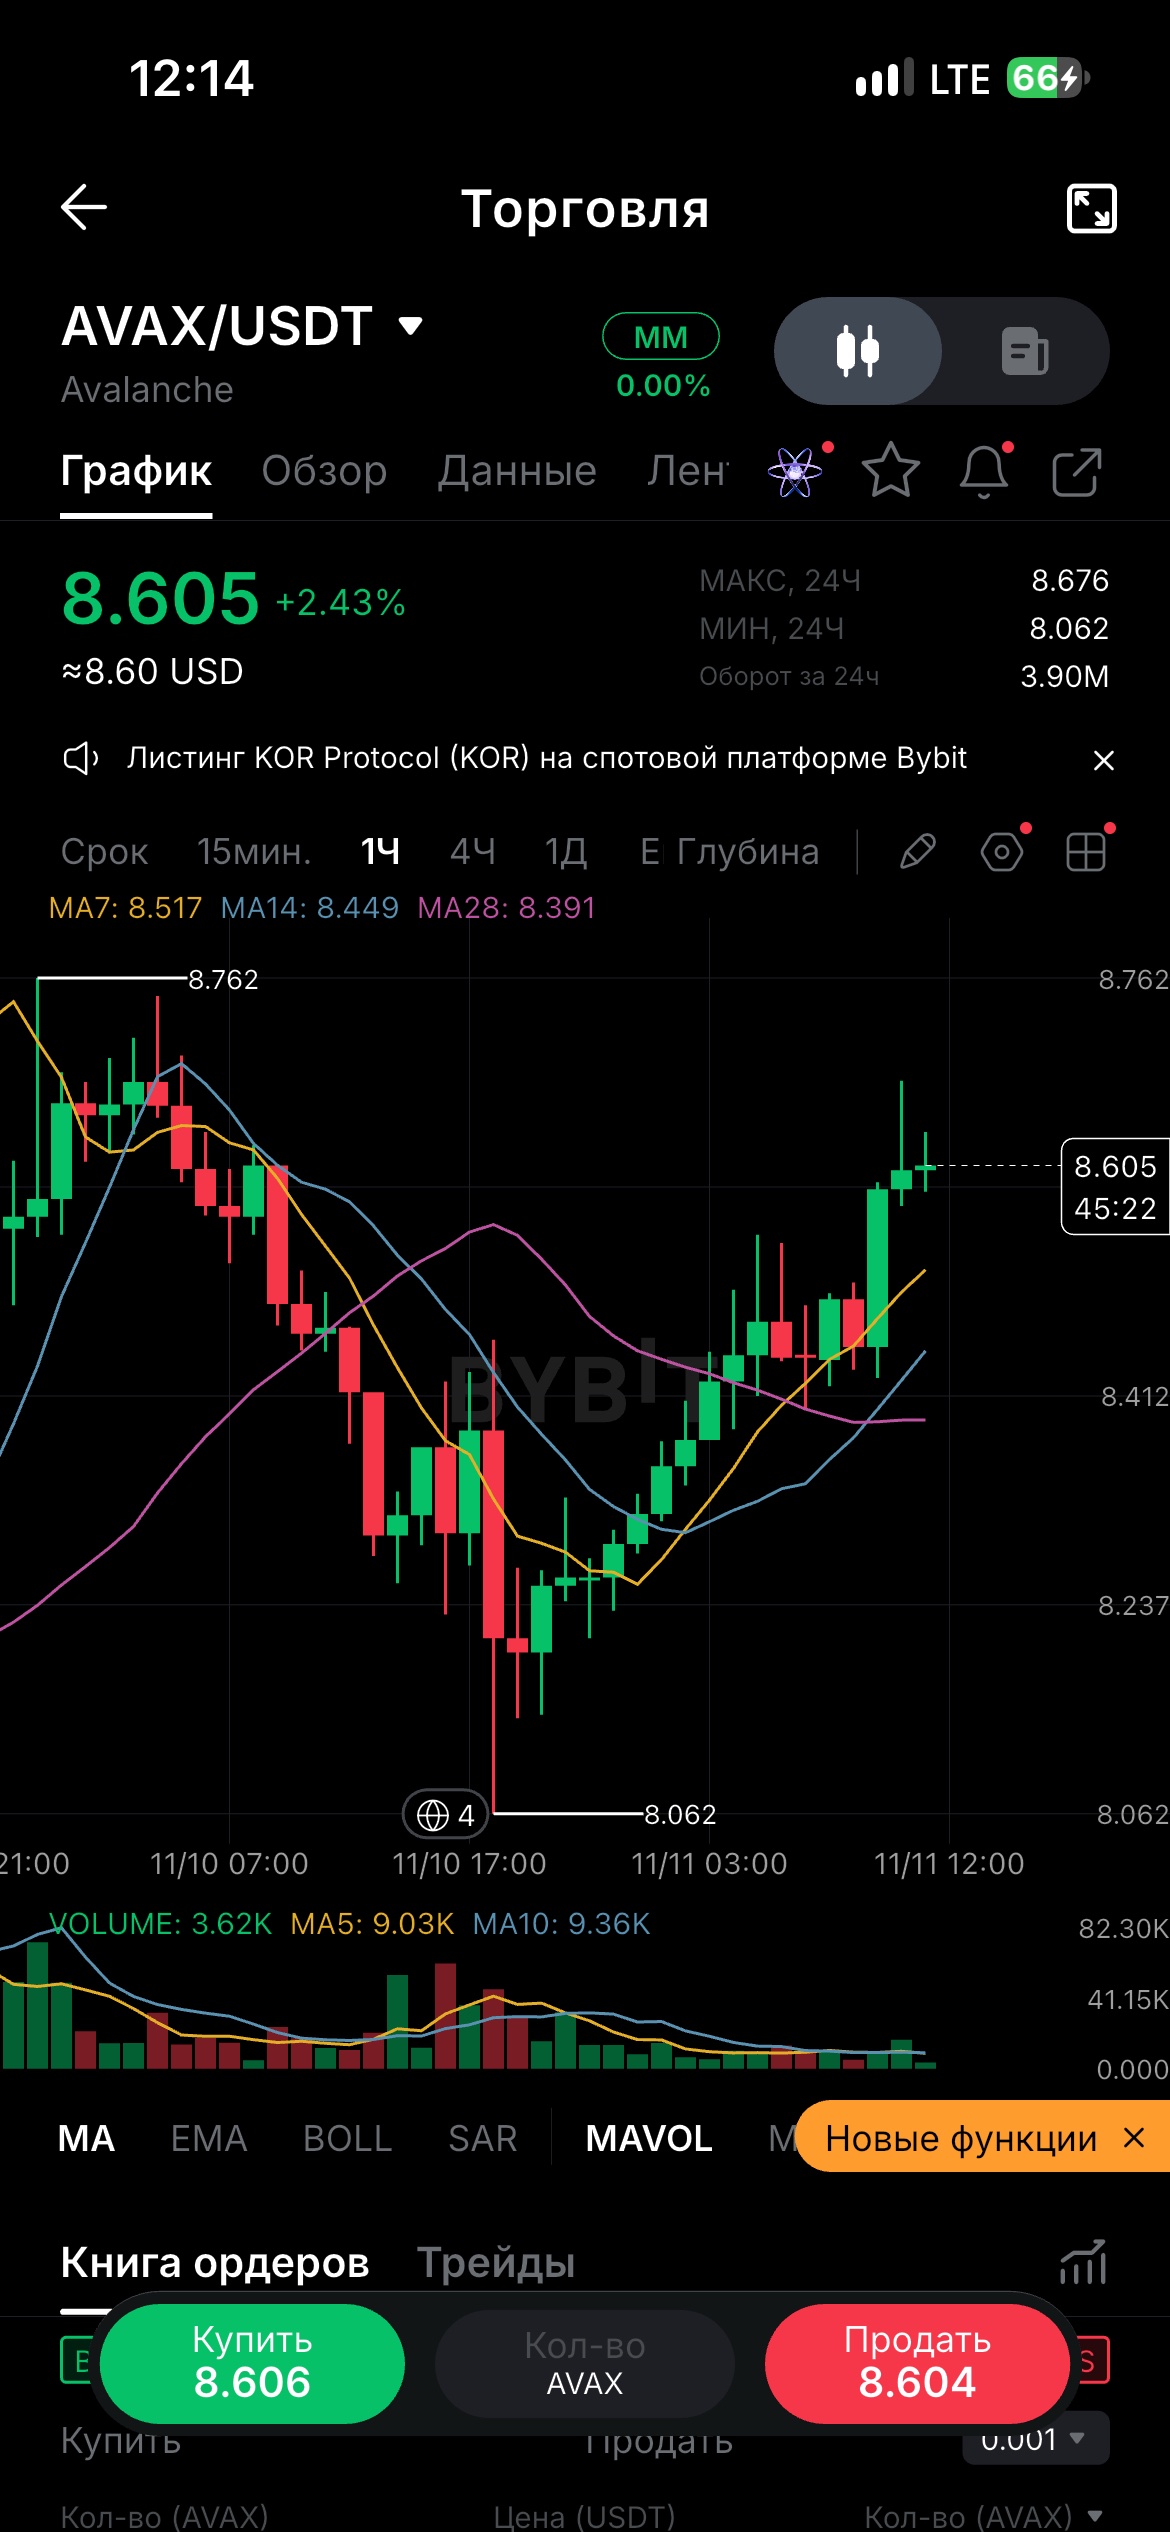
🚨 $AVAX MULAI BANGKIT — APA $9 SELANJUTNYA? 👀
Sementara para trader memperhatikan BTC, $AVAXUSDT diam-diam sedang membangun momentum. 🟢 Harga: $8.60 (+2.43%) 📈 1J: Trading di atas MA7, MA14 & MA28 🔥 4J: Pembeli mendorong harga lebih tinggi LEVEL KUNCI: 🎯 $8.68 — resistance terdekat 🚀 $9.00 — target bullish berikutnya 🛡️ $8.40 — support penting Breakout di atas $8.68 bisa membuka jalan menuju $9. Namun, apakah ini pembalikan nyata atau hanya bull trap lainnya? 💬 ke $9 atau kembali ke $8? 👇 #WSOT2026 #Pantauan IHK AS November #WSOTPicktoEarn10U #Data Penggajian AS dan Keputusan Suku Bunga Mendorong Pekan Makro #Volatilitas Minyak Melacak Pembicaraan Perdamaian Iran
🟢 ETH — Good‑News Focus & Market Analysis (Nov 11 2026) Even as short‑term price action remains choppy (ETH currently ~$2,050, down ~3.8 % 24‑hr), several structural positive catalysts are building behind the recent pullback. ✅ Key Good News for Ethereum 1. Strong long‑term staking loyalty Nearly 36.4 % of circulating ETH — about 44.5 million tokens — remains locked in staking contracts, with no large‑scale unstaking rush amid volatility. This shrinking liquid supply acts as a structural floor: fewer coins available for immediate sale during dips, while yield‑seeking holders continue to accumulate for multi‑cycle positions. 2. Whale smart‑money buying at support zones On‑chain data shows large‑cap wallets have stepped in to accumulate near the $2,000‑$2,050 range — one notable group purchased over 20 000 ETH in recent sessions at average prices close to current levels. Many analysts view this weekly 0.618 Fibonacci retracement zone as a historically reliable accumulation window for medium‑term ETH cycles . 3. Upcoming Glamsterdam upgrade pipeline The highly anticipated Glamsterdam upgrade is scheduled for late‑Q4 2026, bringing parallel transaction execution and ePBS (proposer‑builder separation) — designed to boost base‑layer throughput, lower Layer‑1 congestion, and further strengthen decentralization for the fast‑growing Layer‑2 ecosystem . Layer‑2 transaction volumes have stayed resilient through market softness, keeping Ethereum’s position as the leading home for real‑world‑asset (RWA) and stablecoin settlement. 4. Broader global regulatory progress Outside the US, clearer frameworks for ETH‑linked investment products are emerging across Asia and Europe, opening new institutional access channels that could offset near‑term US spot‑ETF outflows over time . 📊 Balanced Technical & Macro Outlook Short‑term headwinds remain: hotter‑than‑expected US inflation data keeps Fed‑rate‑hike expectations elevated, pressuring risk assets, while US ETH spot ETFs have seen several days of net outflows recently. - Immediate support zone: $2,000‑$2,020 - First bullish trigger: Sustained close above $2,130‑$2,200, which would signal a shift back toward recovery momentum The positive story here is not about an instant price jump — it is about fundamentals holding firm while sentiment wavers. For longer‑term observers, the current pullback is being framed as a chance to focus on Ethereum’s expanding utility pipeline rather than short‑term volatility. $ETHUSDT $BTCUSDT #ByXIMPACT #WSOT2026 #WSOTPicktoEarn10U #BybitAIEvolving
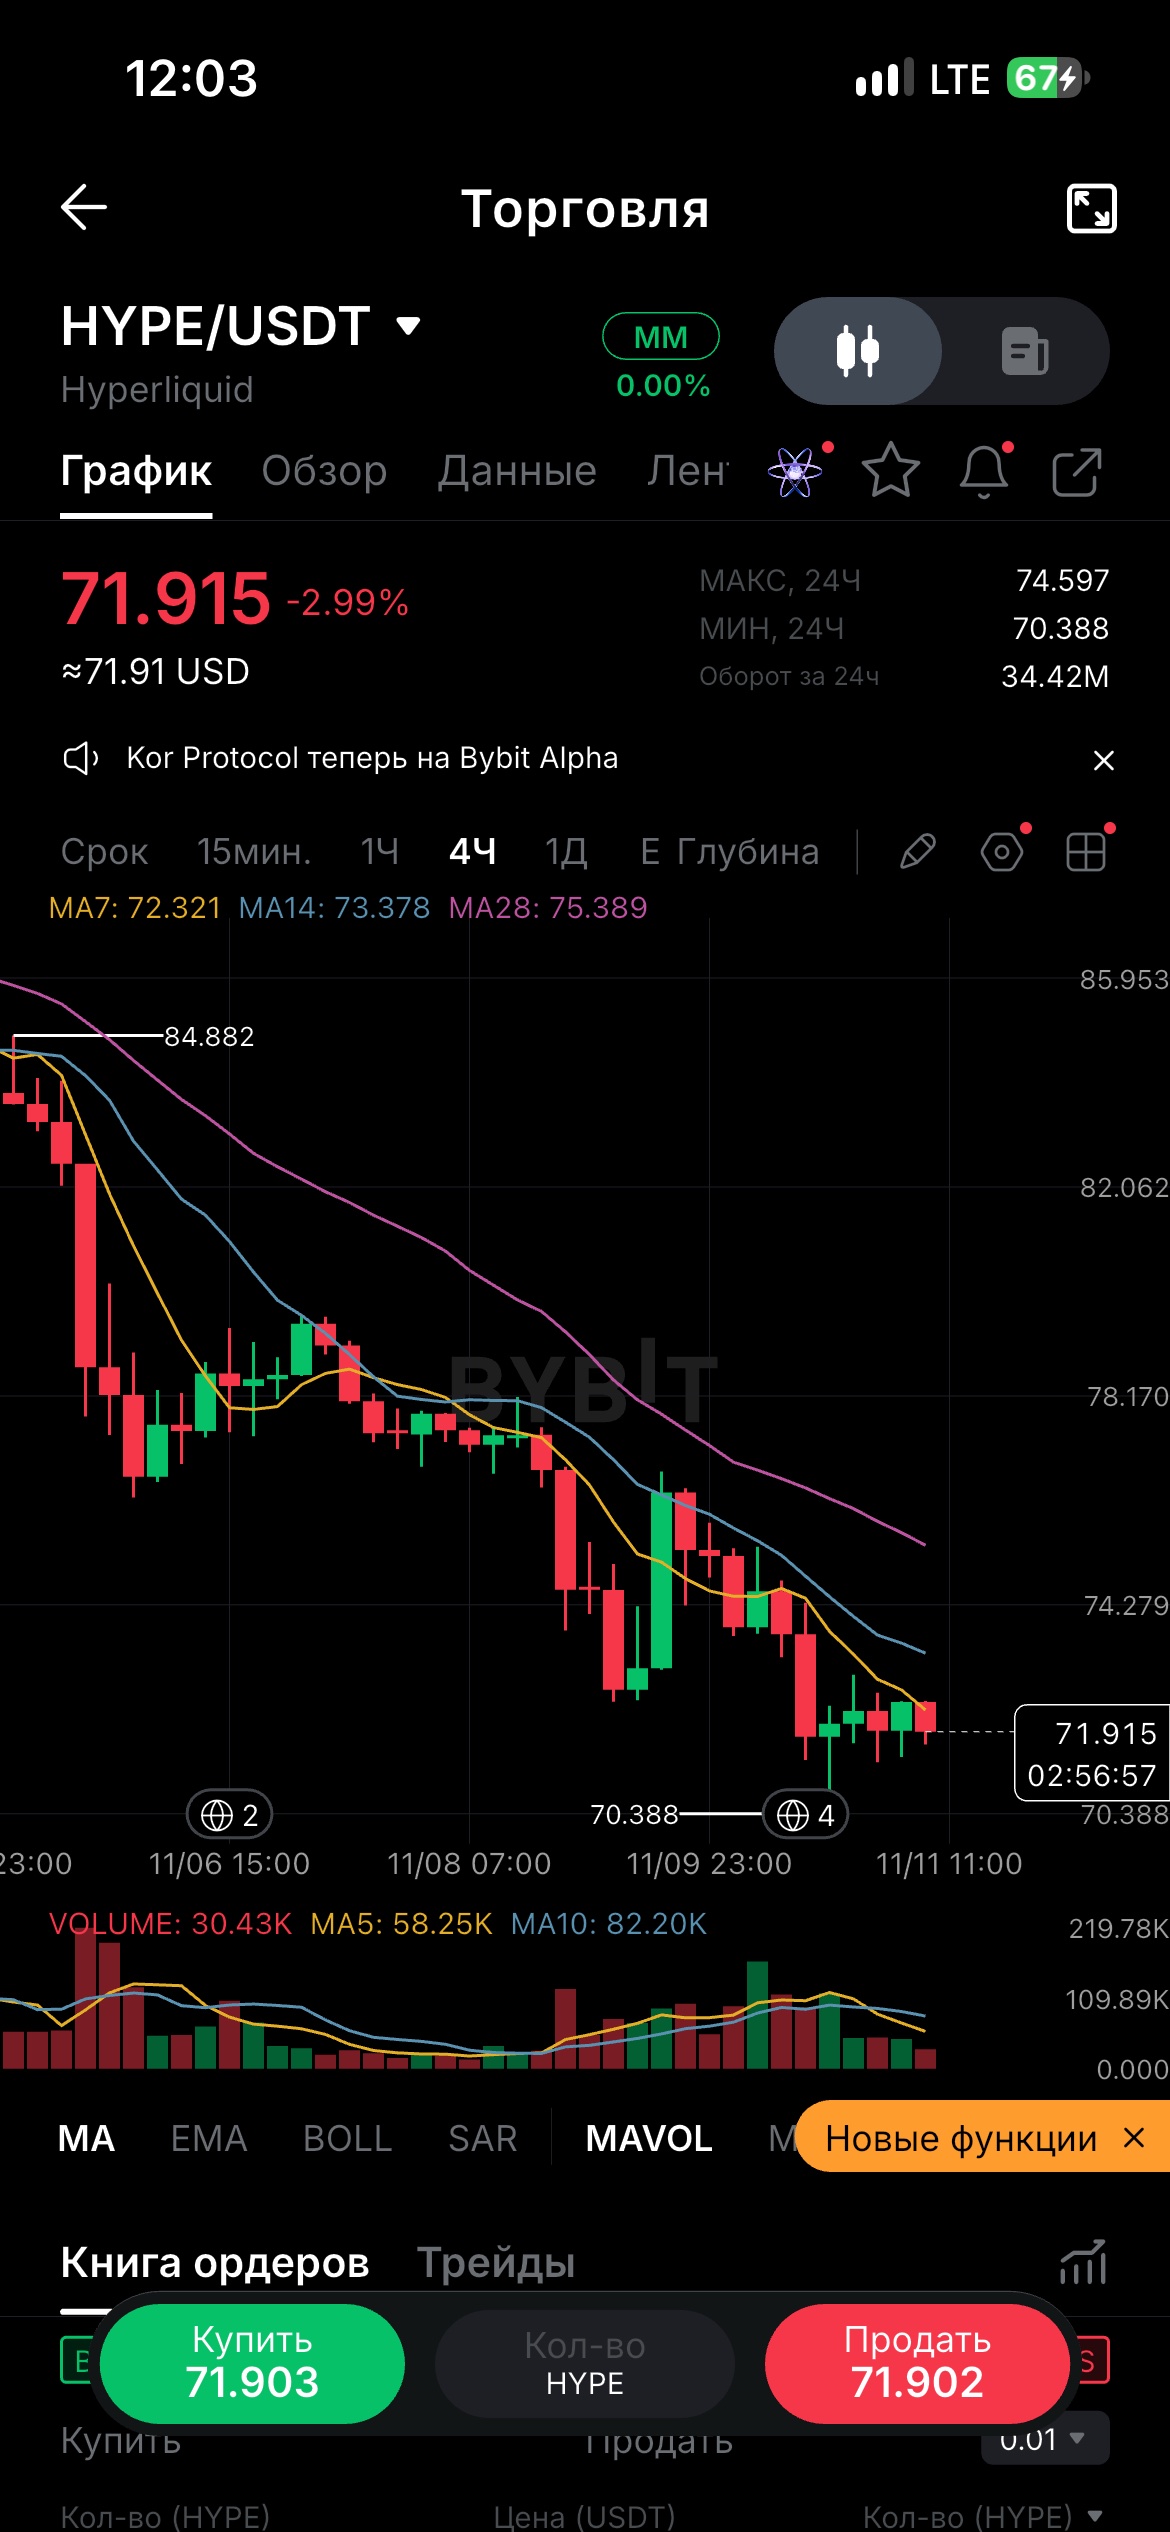
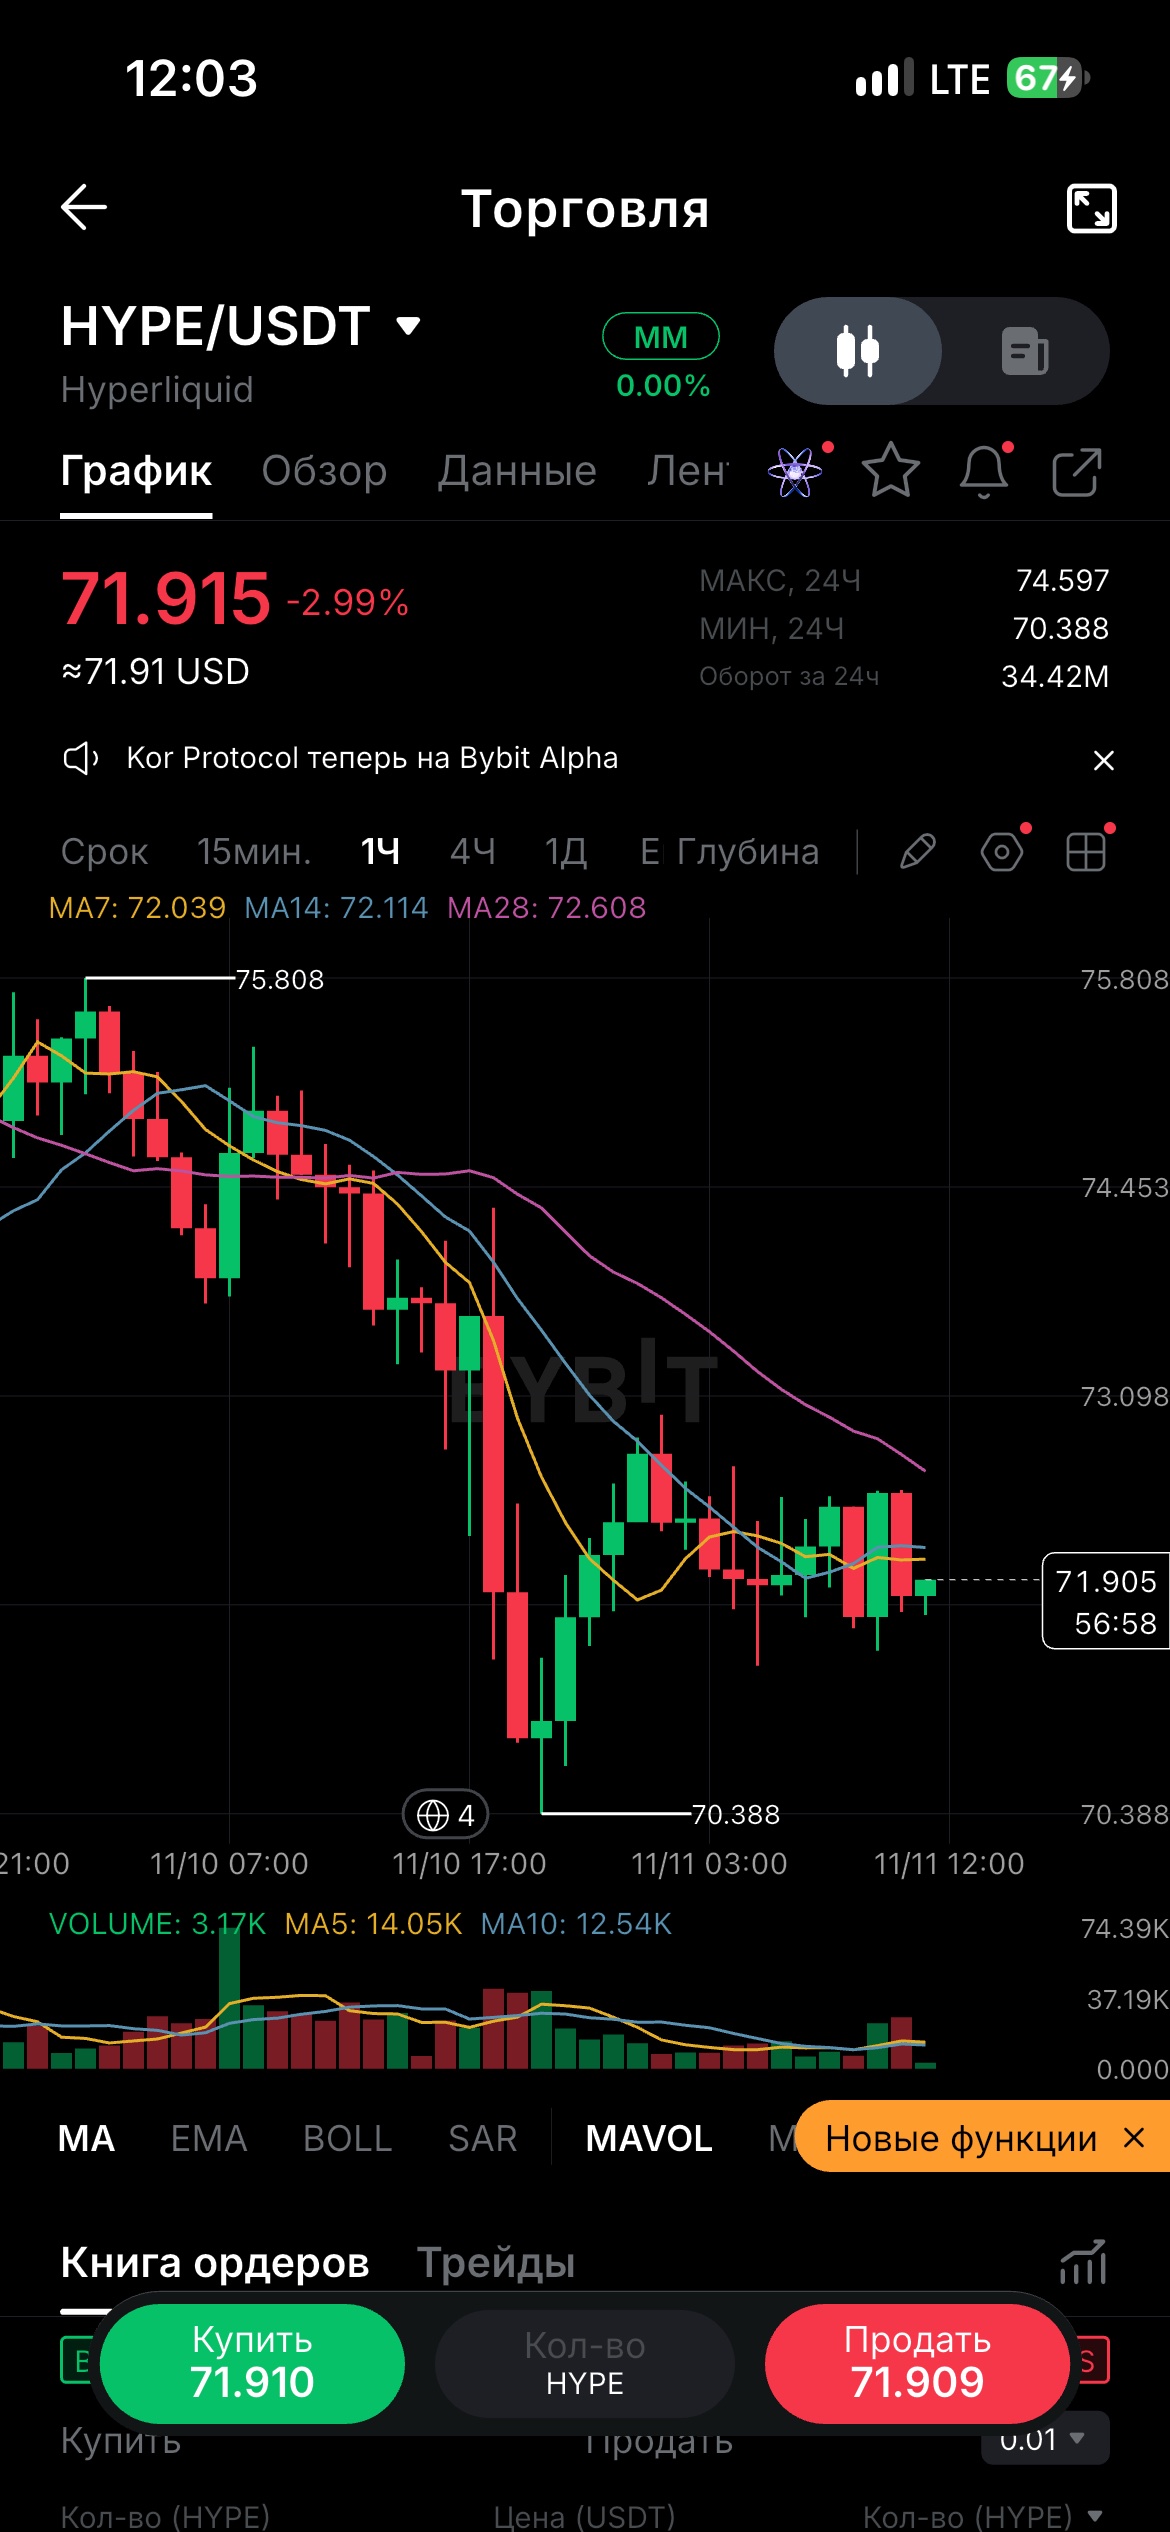
🚨 $HYPE — JEBAKAN BULLISH ATAU AWAL DARI PEMBALIKAN ARAH?
$HYPEUSDT diperdagangkan di dekat $71,9 setelah memantul dari $70,38. 📉 Tren 4 jam tetap bearish. 🟢 Di atas $72,6 → bulls bisa menargetkan $73,4 🔴 Di bawah $71,35 → $70,38 kembali menjadi target 👀 Apakah whale sedang akumulasi atau bersiap untuk dump lagi? Apa langkahmu selanjutnya — LONG atau SHORT? 👇 #WSOT2026 #Pantauan IHK AS November #WSOTPicktoEarn10U #Data Penggajian AS dan Keputusan Suku Bunga Mendorong Pekan Makro #AnthropicIPOValuationTest
📊Current BTC snapshot Bitcoin (BTC) is trading around $73,700 (‑~2.1 % 24‑hr), after dipping to an intraday low near $72,700 overnight . Total crypto‑market liquidations hit ~$723 M in the past 24 h, with most from long‑position forced closes . Key drivers behind the pullback - Hot US inflation data: October CPI rose 0.4 % month‑over‑month (above forecasts), lifting market odds of another Fed interest‑rate hike in December — higher rates tend to weigh on non‑yielding assets like BTC . - ETF outflows: US spot Bitcoin ETFs saw net outflows for a third straight session as institutional investors reduced exposure . - Regulatory uncertainty: Post‑US‑election policy outlook + Fed‑crypto banking disputes added risk‑off sentiment . Technical levels being watched - Near‑term support zone: $72,700‑$73,000 - First resistance to reclaim: $74,500‑$75,000 - A break below main support could open a move toward $70,000, per technical analysts . Quick altcoin update - ETH: ~$2,050 (‑~3.8 % 24 h) - XRP: ~$1.05 (‑~4.2 % 24 h) Upcoming catalysts to monitor - Fed officials’ speeches & December rate‑hike signalling - Weekly US spot‑ETF flow reports - On‑chain miner‑selling & large‑wallet movement data $BTCUSDT #ByXIMPACT #WSOT2026 #WSOTPicktoEarn10U #NovUSCPIWatch
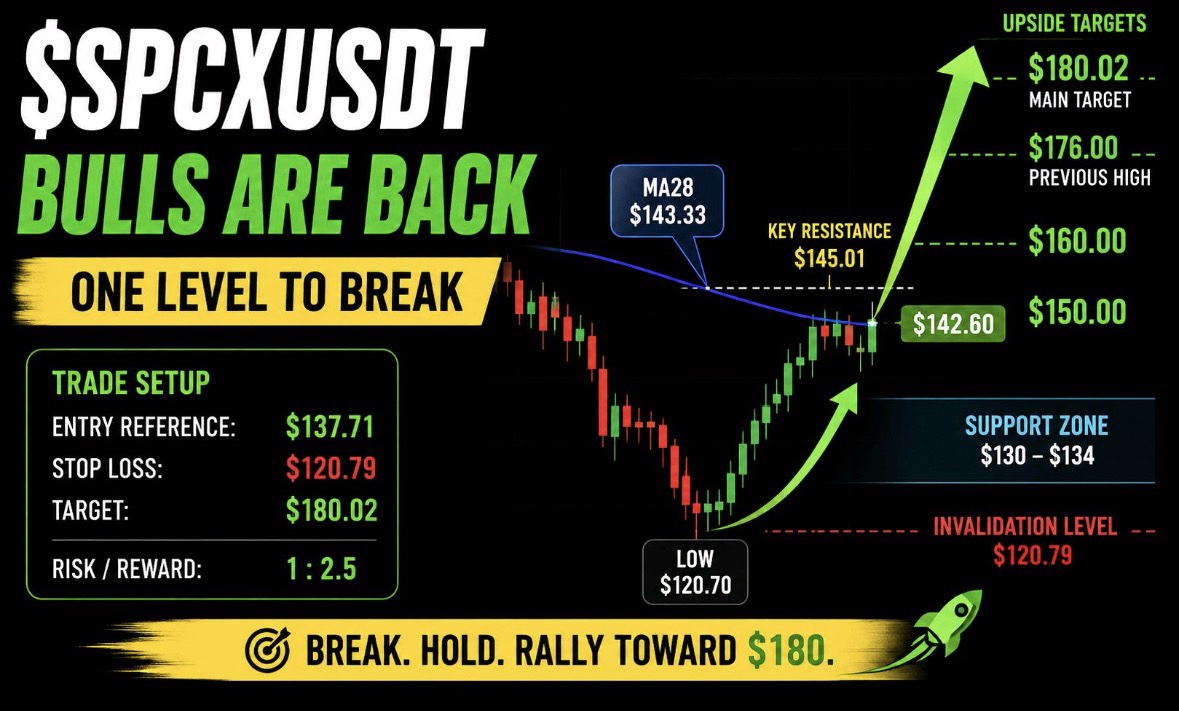
#SPCXXUSDT Bulls have recovered control, but one major hurdle remains. SPCX has staged a strong comeback from $120.70, reclaiming the lost ground and pushing back toward $142.60. Now the market is approaching a critical decision zone. spcx #WSOT2026 #NovUSCPIWatch #USPayrollsAndRateDecisionsDriveMacroWeek #WSOTPicktoEarn10U #BybitAIEvolving
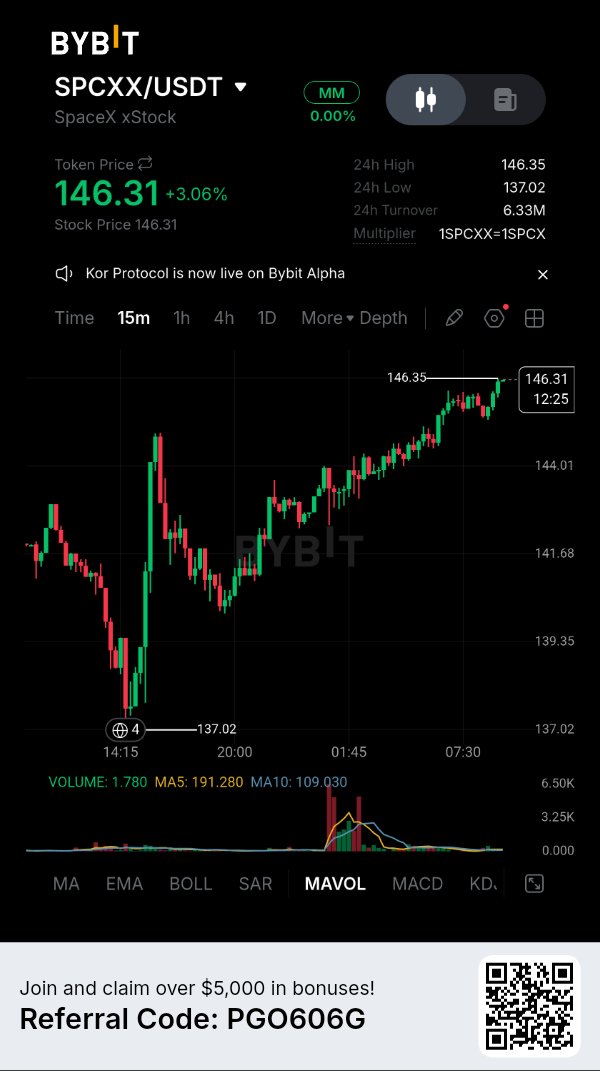
📊 Chart Overview · Asset: SPCXX paired with USDT (SpaceX xStock). · Current Price: $146.31 (Up +3.06%). · Timeframe: 15-minute (15m) chart. (Intraday view). · 24h Data: High: $146.35 | Low: $137.02 | Turnover: 6.33M. · Crucial Detail: The chart shows a "Multiplier" of 1SPCXX = 1SPCX. 📈 Technical Analysis Breakdown 1. Price Action & Recovery · The V-Shape: The chart displays a dramatic, aggressive V-shaped recovery. After a severe sell-off down to $137.02 (marked with a #4 circle), the price found immediate, strong support. · The Uptrend: From the bottom, buyers aggressively stepped in. The price formed a consistent series of higher highs and higher lows. · Current State: The price is currently pushing up against the 24-hour high of **$146.35**, resting just slightly below it at $146.31. It is consolidating in a tight range at the top of this trend. 2. Resistance & Support Levels · Immediate Resistance (Ceiling): $146.35. This is the current 24h high. A strong 15-minute close above this level is needed to confirm a breakout and continuation of the upward momentum. · Immediate Support (Floor): ~$144.01. Looking at the chart structure, this is the previous consolidation zone before the final leg up. If the price breaks down, this is the first area to watch. · Major Support: $137.02. The bottom of the recent crash. This is the critical structural floor for this 24-hour period. 3. Volume Analysis (The Story of the Move) · Look at the volume bars at the bottom. There is a massive, distinct spike in volume that occurs right at the bottom of the dip and the beginning of the recovery (around 01:45). · Interpretation: This massive green volume bar indicates heavy institutional or whale buying. This confirms that the bounce off the $137.02 level was a high-conviction buy. · The Catch: Notice the current volume on the right side. As the price climbs to new local highs, the volume is relatively flat and low. The current open candle shows a volume of 1.780 compared to the MA5 of 191.280. This is a classic bearish divergence on lower timeframes. The price is going up, but the buying volume is drying up, meaning the current uptrend lacks strong momentum to break the high. 🎯 Trading Scenarios · Bullish Scenario (Breakout): If a strong 15m candle closes solidly above $146.35, it signals the buyers have overpowered the resistance. However, for this to be reliable, you would want to see a spike in volume accompanying the breakout. · Bearish Scenario (Rejection/Pullback): The price is struggling at the 24h high with declining volume. There is a high probability of a rejection here. If the price gets pushed down, it will likely retest the $144.01 support area. If that fails, a slow bleed back down is possible. ⚠️ Important Notes for this Specific Asset · Tokenized Stock Dynamics: Because this is a tokenized version of a private asset (SpaceX), its price action may not perfectly track the traditional stock market (which is closed outside normal hours). It trades 24/7 on Bybit. · Liquidity Risk: While the turnover is decent (6.33M), the order book depth for tokenized private equity is often much thinner than standard crypto pairs. Watch out for sudden "wicks" (sharp, violent price movements) in either direction. · Notice: The banner notes "Kor Protocol is now live on Bybit Alpha." This is a general exchange announcement and not specific to this chart, but it's good to be aware of. (Disclaimer: This is a technical analysis of the provided image and does not constitute financial advice. Trading tokenized stocks carries unique risks.) $SPCXXUSDT #ByXIMPACT #WSOT2026 #NovUSCPIWatch #WSOTPicktoEarn10U #USPayrollsAndRateDecisionsDriveMacroWeek

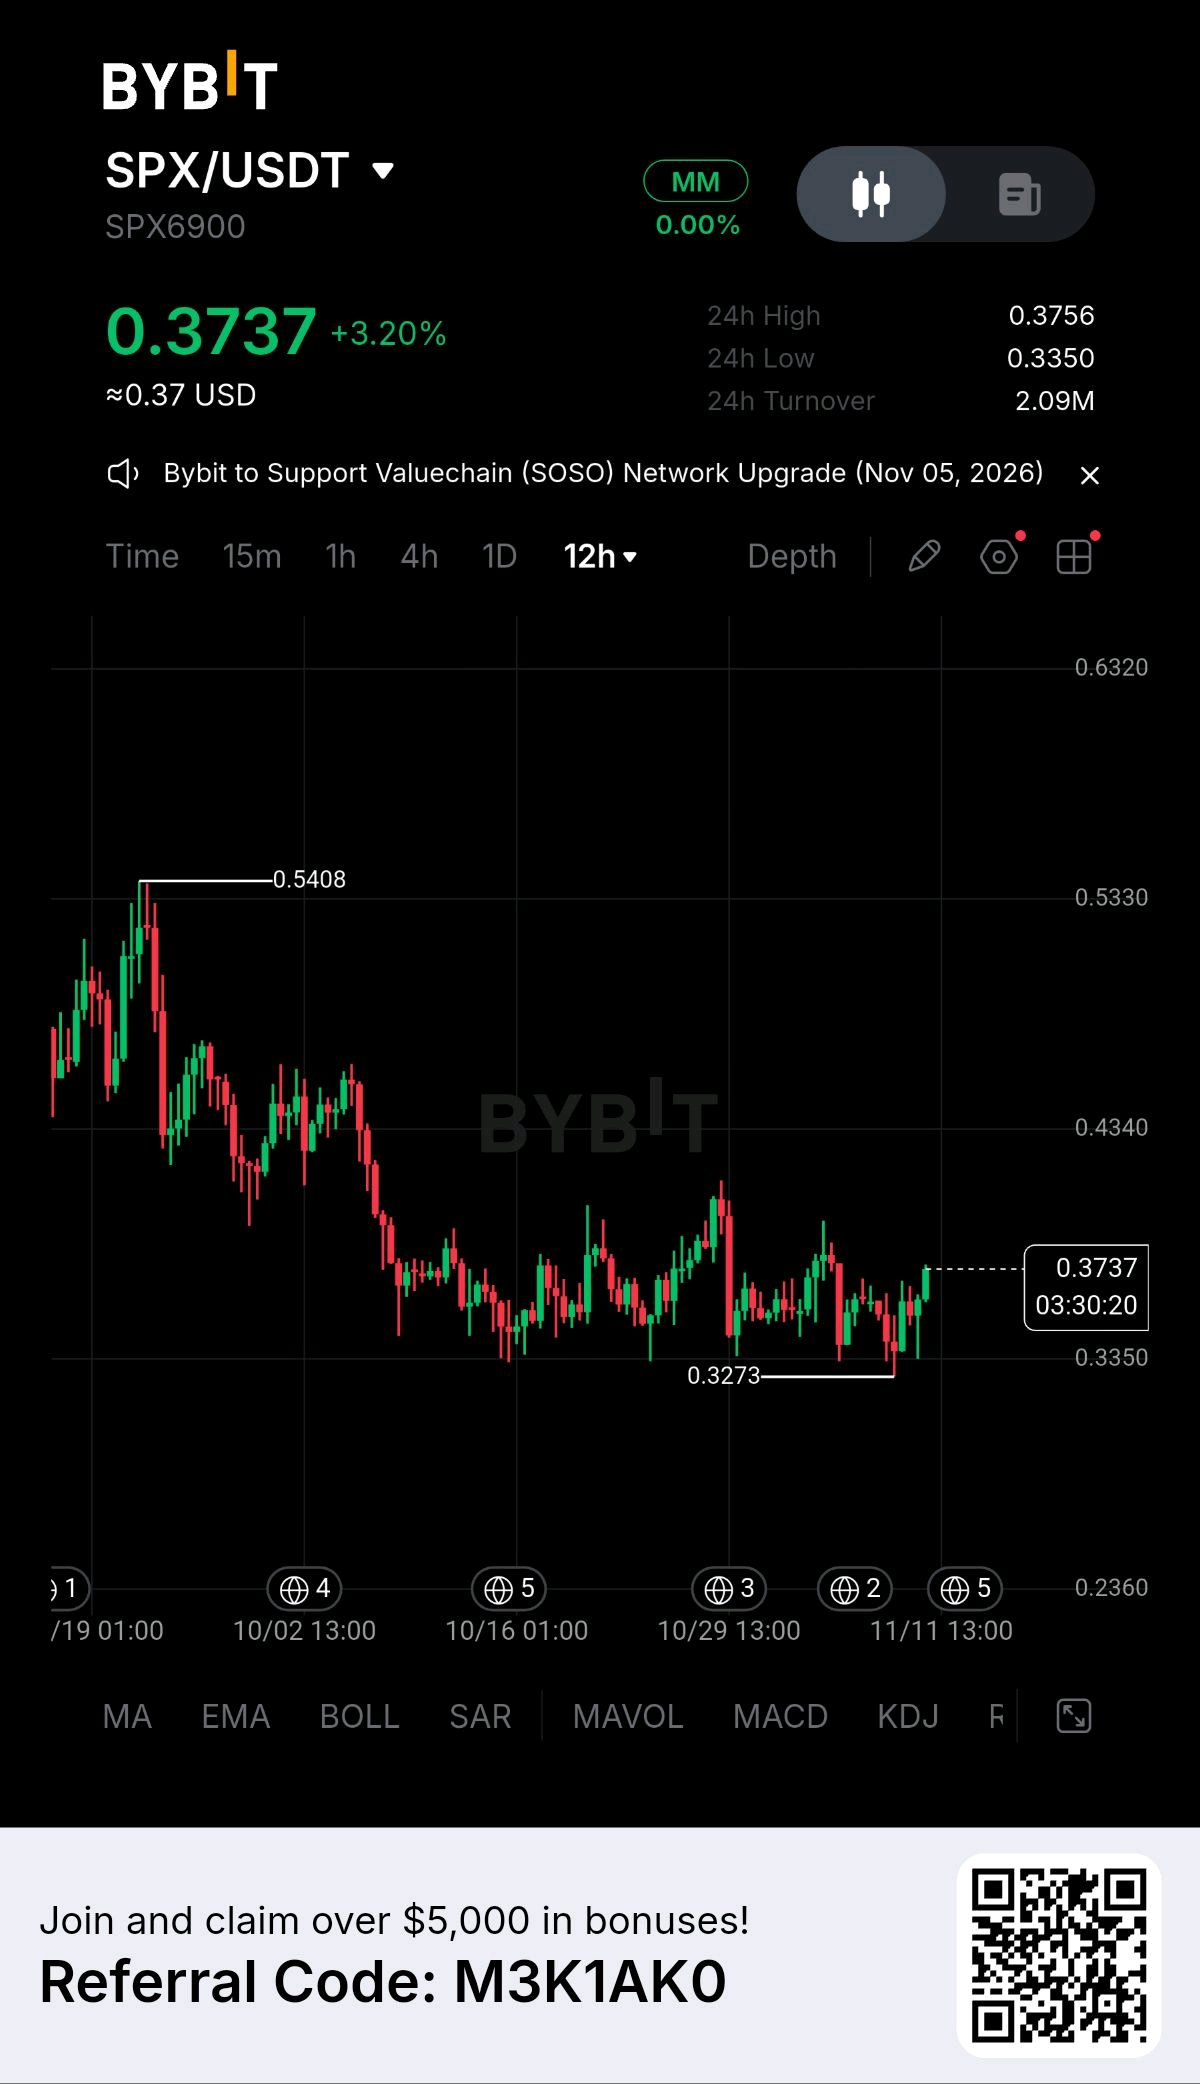
$SPX Bounces 3% Off Its Weekly Low Near $0.33
SPX6900 just posted a solid green session, climbing back above 0.37 after testing a fresh low for the stretch, though the token remains deep in a downtrend that's defined most of this year. SPX6900 is a self-described community meme asset with no roadmap, no team-led development, and no claimed intrinsic value, its own project says as much. The community, who call themselves Aeons, has built a reputation around a buy-and-hold mentality, and prominent crypto commentator Murad Mahmudov recently compared their conviction through steep drawdowns to early Bitcoin holders, though he was careful to frame it as a comparison of behavior rather than a claim the two assets will perform alike. That conviction has been tested, SPX now trades more than 80% below its July 2025 all-time high of 2.27, and 2026 has been its calmest year on record in terms of price range, with every close falling between roughly 0.25 and 0.65. Technical commentary earlier this week flagged the token sitting in a descending channel, with analysts noting price needed to hold around 0.34 and reclaim its 200-day moving average near 0.39 to show real signs of recovery, a level that today's bounce is now testing from below. The chart shows a steep decline from a high of 0.5408 down through a choppy multi-week slide to a low of 0.3273, with today's bounce bringing price back to 0.3737, up 3.20%, right around the middle of that broader range. Given the token is bouncing from a key support zone that technical watchers have specifically flagged, this looks like a cautious long rather than a wait-and-see setup, provided the level holds. An entry near the current 0.3737 with invalidation below 0.3273, the recent low, keeps risk tied to that well-defined floor. The first target sits near 0.39, the 200-day moving average and the level analysts have pointed to as the line between continued range-bound trading and a real recovery attempt, offering a modest but reasonable reward relative to the risk. China's Q3 GDP grew 4.5% year on year, beating forecasts on strong AI-related exports and tech manufacturing, a mildly supportive macro backdrop for risk assets broadly, though a pure sentiment-driven meme token like SPX is likely to keep trading far more on its own community conviction than on any macro data print. Not financial advice. $SPXUSDT $COREUSDT #WSOT2026 #WSOTPicktoEarn10U #NovUSCPIWatch


227.196 BTC lama berpindah. Bearish? Belum tentu.
Checkonchain mengatakan sekitar 227.196 BTC yang diperoleh sebelum 2019 "bangkit kembali" pada tahun 2026, menurut Bitcoin.com News.$BTCUSDT Angka yang besar. Jadi, saya melihat lebih dari sekadar judul beritanya. Pertama, angka dolarnya tidak masuk akal. Liputannya menyebutkan $183,6 miliar. Dengan harga sekitar $74.000 per BTC, 227.196 BTC lebih mendekati angka $16,8 miliar (menurut perhitungan saya). Menariknya, artikel yang sama menilai 33.932 BTC dari kumpulan data lain senilai $2,49 miliar, yang konsisten dengan harga tersebut. Namun, pertanyaan yang lebih besar adalah apa arti "bangkit kembali" itu sebenarnya. Koin yang berpindah. Belum tentu koin yang dijual. Btcparser melacak 873 transfer dengan total 33.932 BTC dari alamat yang tidak aktif antara Januari dan Oktober. Itu sekitar 15% dari angka Checkonchain. Subjek umum yang sama. Definisi tidak aktif yang berbeda. Total yang sangat berbeda. Berikut adalah perbedaan yang menurut saya paling penting. Tiga peristiwa berbeda bisa berada di balik frasa "koin lama berpindah". Transfer dompet: Pemilik yang sama, alamat baru. Bisa jadi perubahan hak asuh, peningkatan keamanan, atau perencanaan warisan. Setoran bursa: Koin mencapai tempat di mana koin tersebut dapat dijual. Itu menciptakan potensi tekanan jual, tetapi tidak mengonfirmasi penjualan. Penjualan aktual: Koin dijual atau dibelanjakan. Saat itulah tekanan jual langsung menjadi nyata. Data pergerakan yang tersedia tidak memberi tahu kita mana yang terjadi dalam setiap kasus. Jadi, mengapa pemegang koin lama memindahkan koin mereka? Pengambilan untung, perubahan hak asuh, dan reposisi paus (whale) adalah beberapa kemungkinannya. Kami tidak memiliki cukup bukti untuk memilih satu penjelasan. Beberapa detail menarik perhatian saya. Empat alamat, semuanya dibuat pada 23 Januari 2016, masing-masing memindahkan tepat 500 BTC. Transfer terjadi pada 24 Maret, 19 Mei, 2 Juli, dan 20 Oktober. Itu adalah 2.000 BTC dalam empat transaksi. Jarak waktunya terlihat disengaja, tetapi jumlah dan tanggal pembuatan yang identik tidak membuktikan kepemilikan bersama atau rencana yang sama. Detail lainnya: 81,9% koin yang bangkit kembali berasal dari tahun 2015–2018. Koin dari sebelum 2015 mencakup sekitar 18% (menurut perhitungan saya). Sekarang lihat waktunya. Periode tersibuk Btcparser adalah Q3, ketika Bitcoin reli sekitar 43%. Koin lama yang bergerak saat reli bisa mengarah pada pengambilan untung, bukan kepanikan. Itu adalah interpretasi yang masuk akal, bukan bukti. Bitcoin masih turun sekitar 16% tahun ini. Dan saya belum akan menyebut ini sebagai gelombang baru. Satu analisis bulan Agustus menempatkan reaktivasi koin tidak aktif tahun 2026 pada kurang dari setengah level tahun 2025. Definisi yang berbeda membuat perbandingan itu patut disikapi dengan hati-hati. Pendapat saya: BTC lama yang bangkit layak untuk dipantau, tetapi pergerakan saja bukanlah sinyal bearish. Saya memantau dua hal: arus masuk bursa dari dompet koin lama dan bukti pembelanjaan aktual. Jika koin berpindah ke penyimpanan dingin (cold storage) yang baru, itu mungkin hanya manajemen hak asuh. Jika koin tersebut mencapai bursa dan dijual, situasinya berubah. Sampai saat itu, saya tidak akan mencampuradukkan pergerakan dompet lama dengan keluarnya pemegang koin lama. $KORUSDT #WSOT2026 #Pantauan IHK AS November #WSOTPicktoEarn10U #Data Penggajian AS dan Keputusan Suku Bunga Mendorong Pekan Makro #Volatilitas Minyak Melacak Pembicaraan Perdamaian Iran

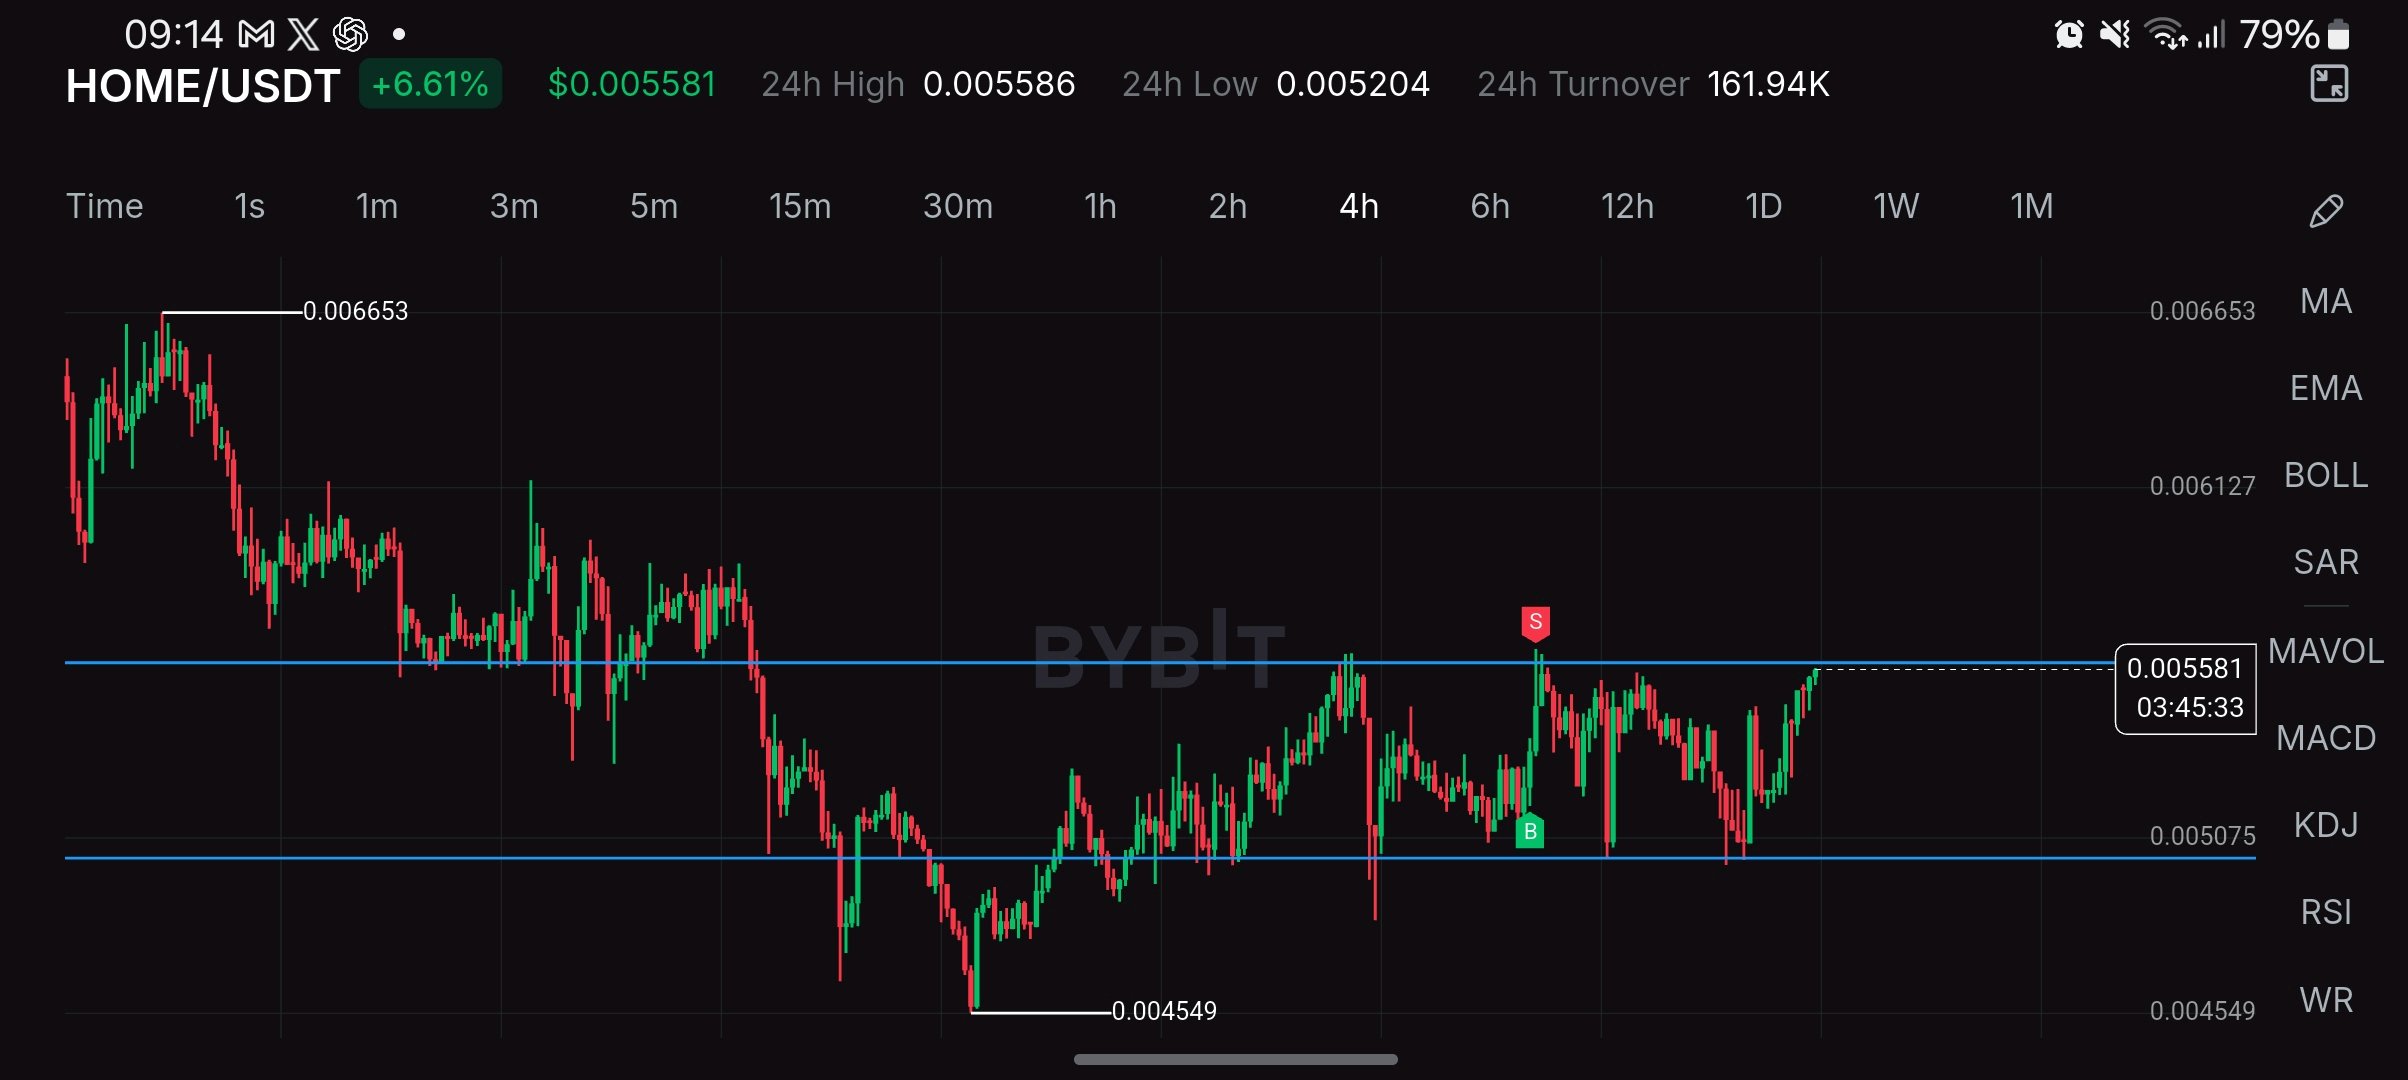
$HOME: Testing the $0.0056 Ceiling
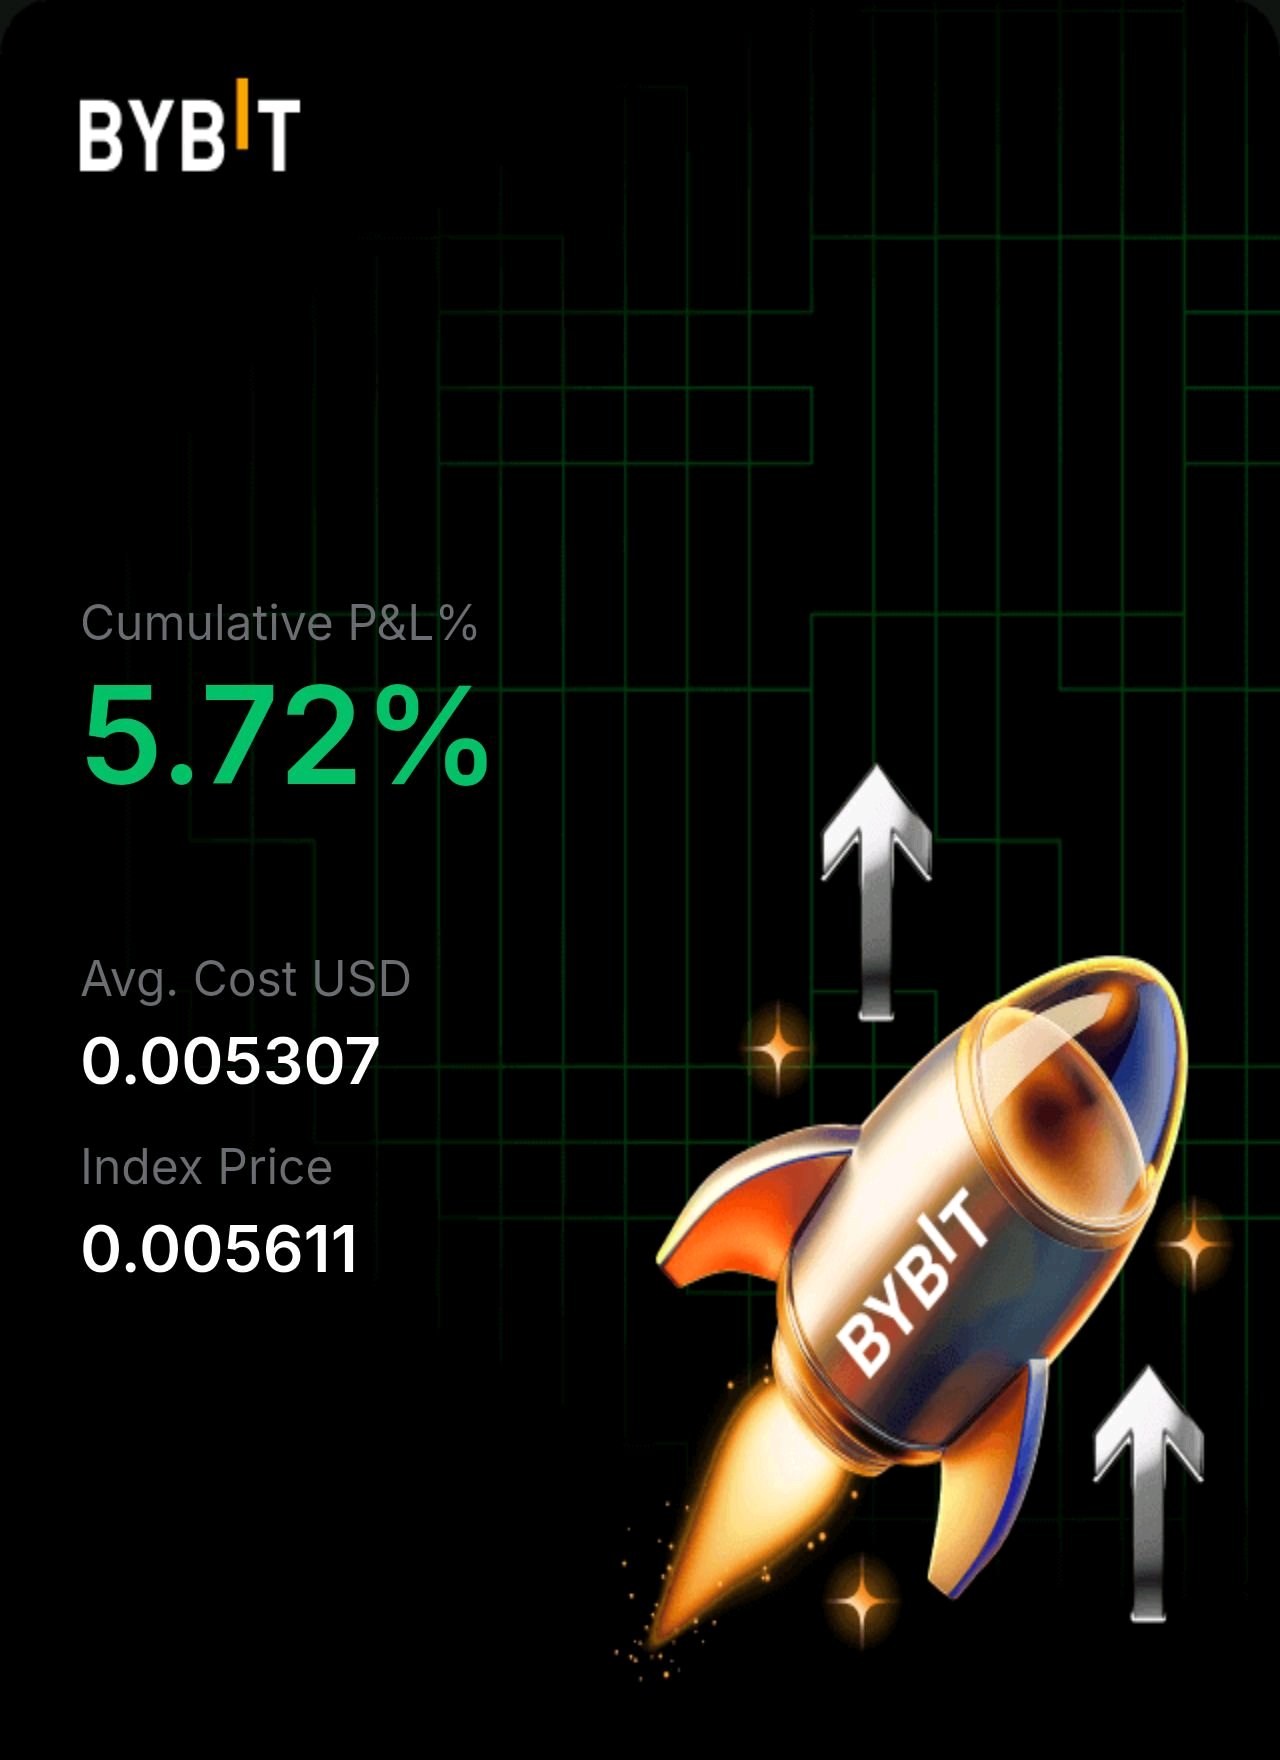
$HOME is pushing into the same ceiling that has rejected it several times in recent weeks. Today's 6.6% move is happening on low volume, so the real test is what comes next. What the 4H chart shows: Price is $0.005581, right at the upper edge of a range between about $0.0051 and $0.0056. Every push into $0.0056 has been rejected, including the sharp wick that printed a sell signal, and every dip toward $0.0051 has been bought. The 24h range is $0.005204 to $0.005586, so price is sitting exactly at the top. The bigger picture is still bearish: the structure is lower highs from $0.006653, and the yearly low is $0.004549. 24h turnover on Bybit is only about $162K, so a breakout without strong volume would be suspect. What's happening: There is no fresh project news this week. The main story is the tokenomics. Defi App uses 80% of protocol revenue for weekly on-chain buybacks, and when that was confirmed in August, $HOME jumped 13%. Upbit also listed HOME around then, which added Asian retail demand. The roadmap includes a physical debit card and prop trading in Q4 2026, which could be a catalyst if it ships. The headwind is supply: only about 4.36B of the 10B tokens are circulating, so roughly 56% is still to come from team, investor and ecosystem unlocks over the next years. That limits how far rallies can go. China and the global backdrop: China's Q3 GDP grew 4.5%, beating forecasts, and the yuan hit a 4-year high. For China, that means steadier policy and less need for emergency stimulus. For the world, stronger Asian growth supports risk appetite, and Asian retail access (like the Upbit listing) matters for a token like $HOME. The link is indirect, since China restricts crypto trading, and the beat is export-led with retail sales up only 1.1%. For $HOME, trading volume on Defi App (which drives buybacks) and Bitcoin's direction matter far more than China data. Key levels: Support: $0.0052 to $0.0051 first, then $0.004549 (the yearly low). A break below $0.0051 would reopen the move to the lows. Resistance: $0.0056 first, then $0.006127, then $0.006653 (the swing high). I want a 4H close above $0.0056 on rising volume before I treat this as a breakout. Scenarios: Bull: volume picks up, buyers close above $0.0056, and $HOME heads toward $0.006127. Base: $HOME gets rejected again and ranges between $0.0051 and $0.0056. Bear: sellers take control, $0.0051 breaks, and $HOME retests the $0.004549 low. Honest risk: thin liquidity means breakouts can fail fast, and the large locked supply is a constant overhang. Not financial advice. Does the fourth test of the ceiling finally break it? $HOMEUSDT $ICPUSDT #WSOT2026 #WSOTPicktoEarn10U #NovUSCPIWatch
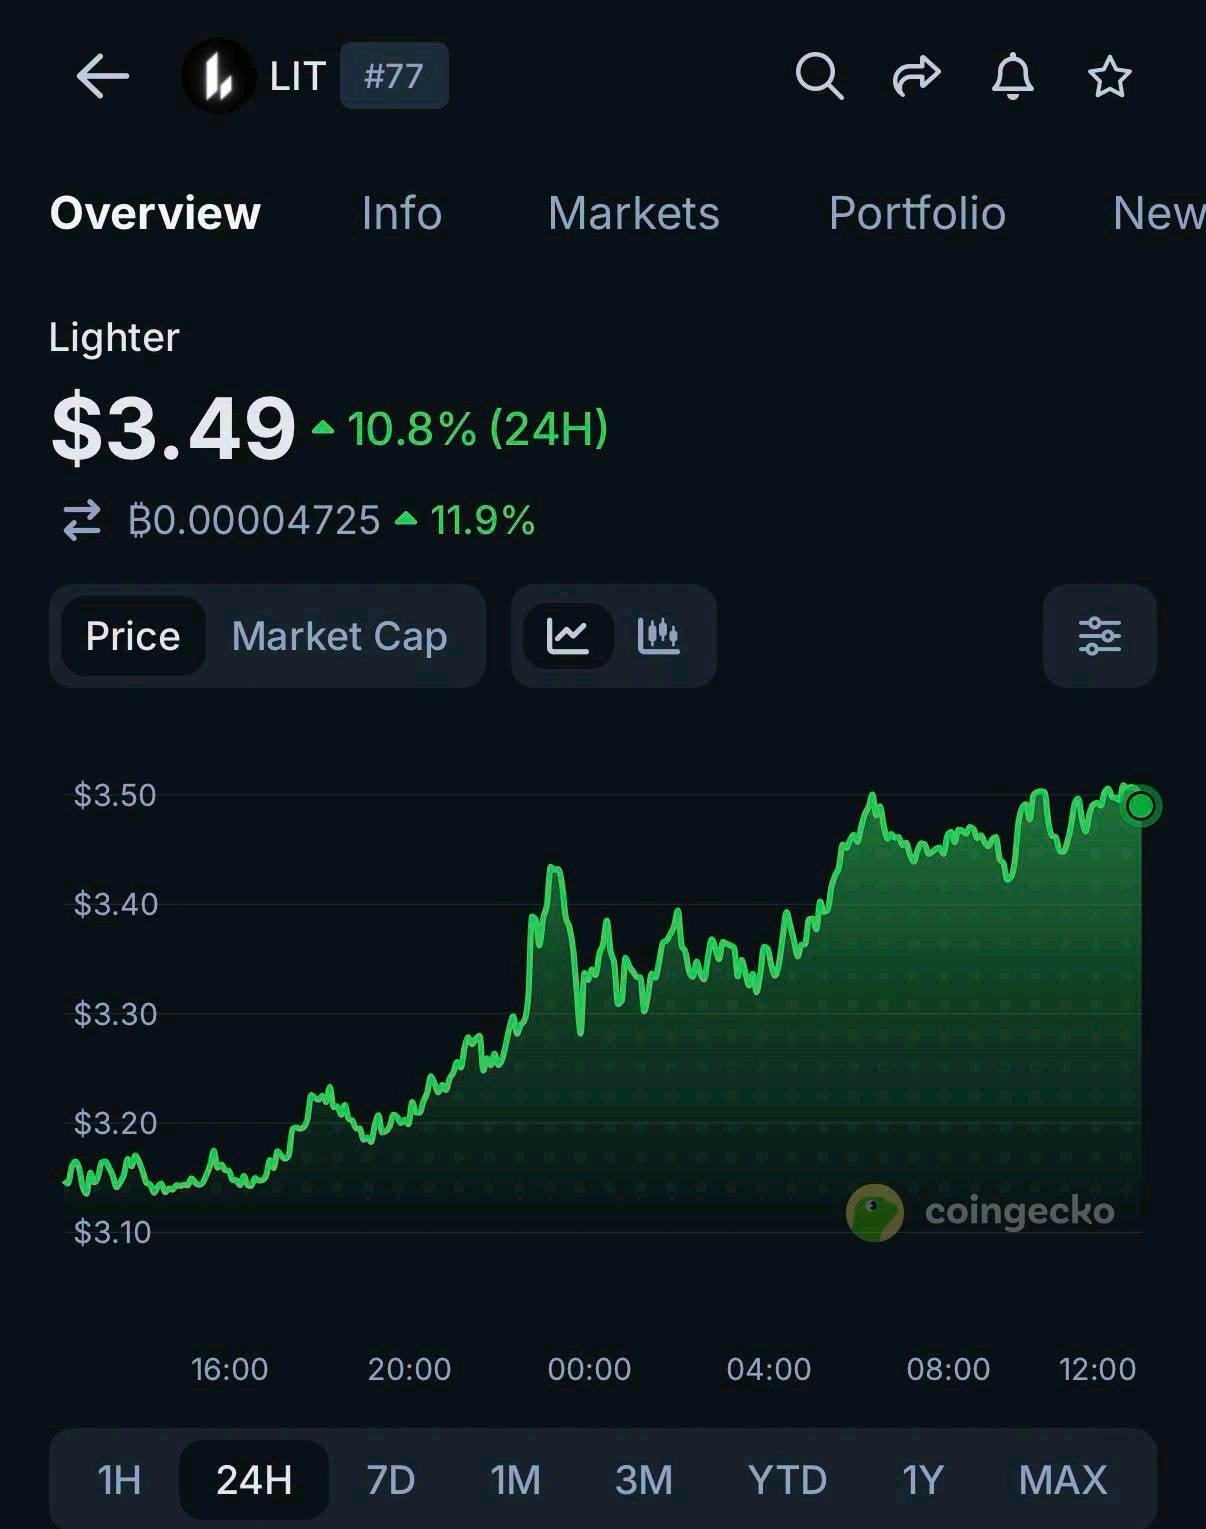
$LIT is up 10.8% 🚀
INSIGHT: $LITUSDT is up 10.8% today against a red market, two days after Swiss bank Sygnum added it for trading, custody, and lending. #NovUSCPIWatch #WSOTPicktoEarn10U #USPayrollsAndRateDecisionsDriveMacroWeek #OilVolatilityTracksIranPeaceTalks #BybitAIEvolving $MCRTUSDT
🚨 $MCRT baru saja mencetak candle hijau yang masif.
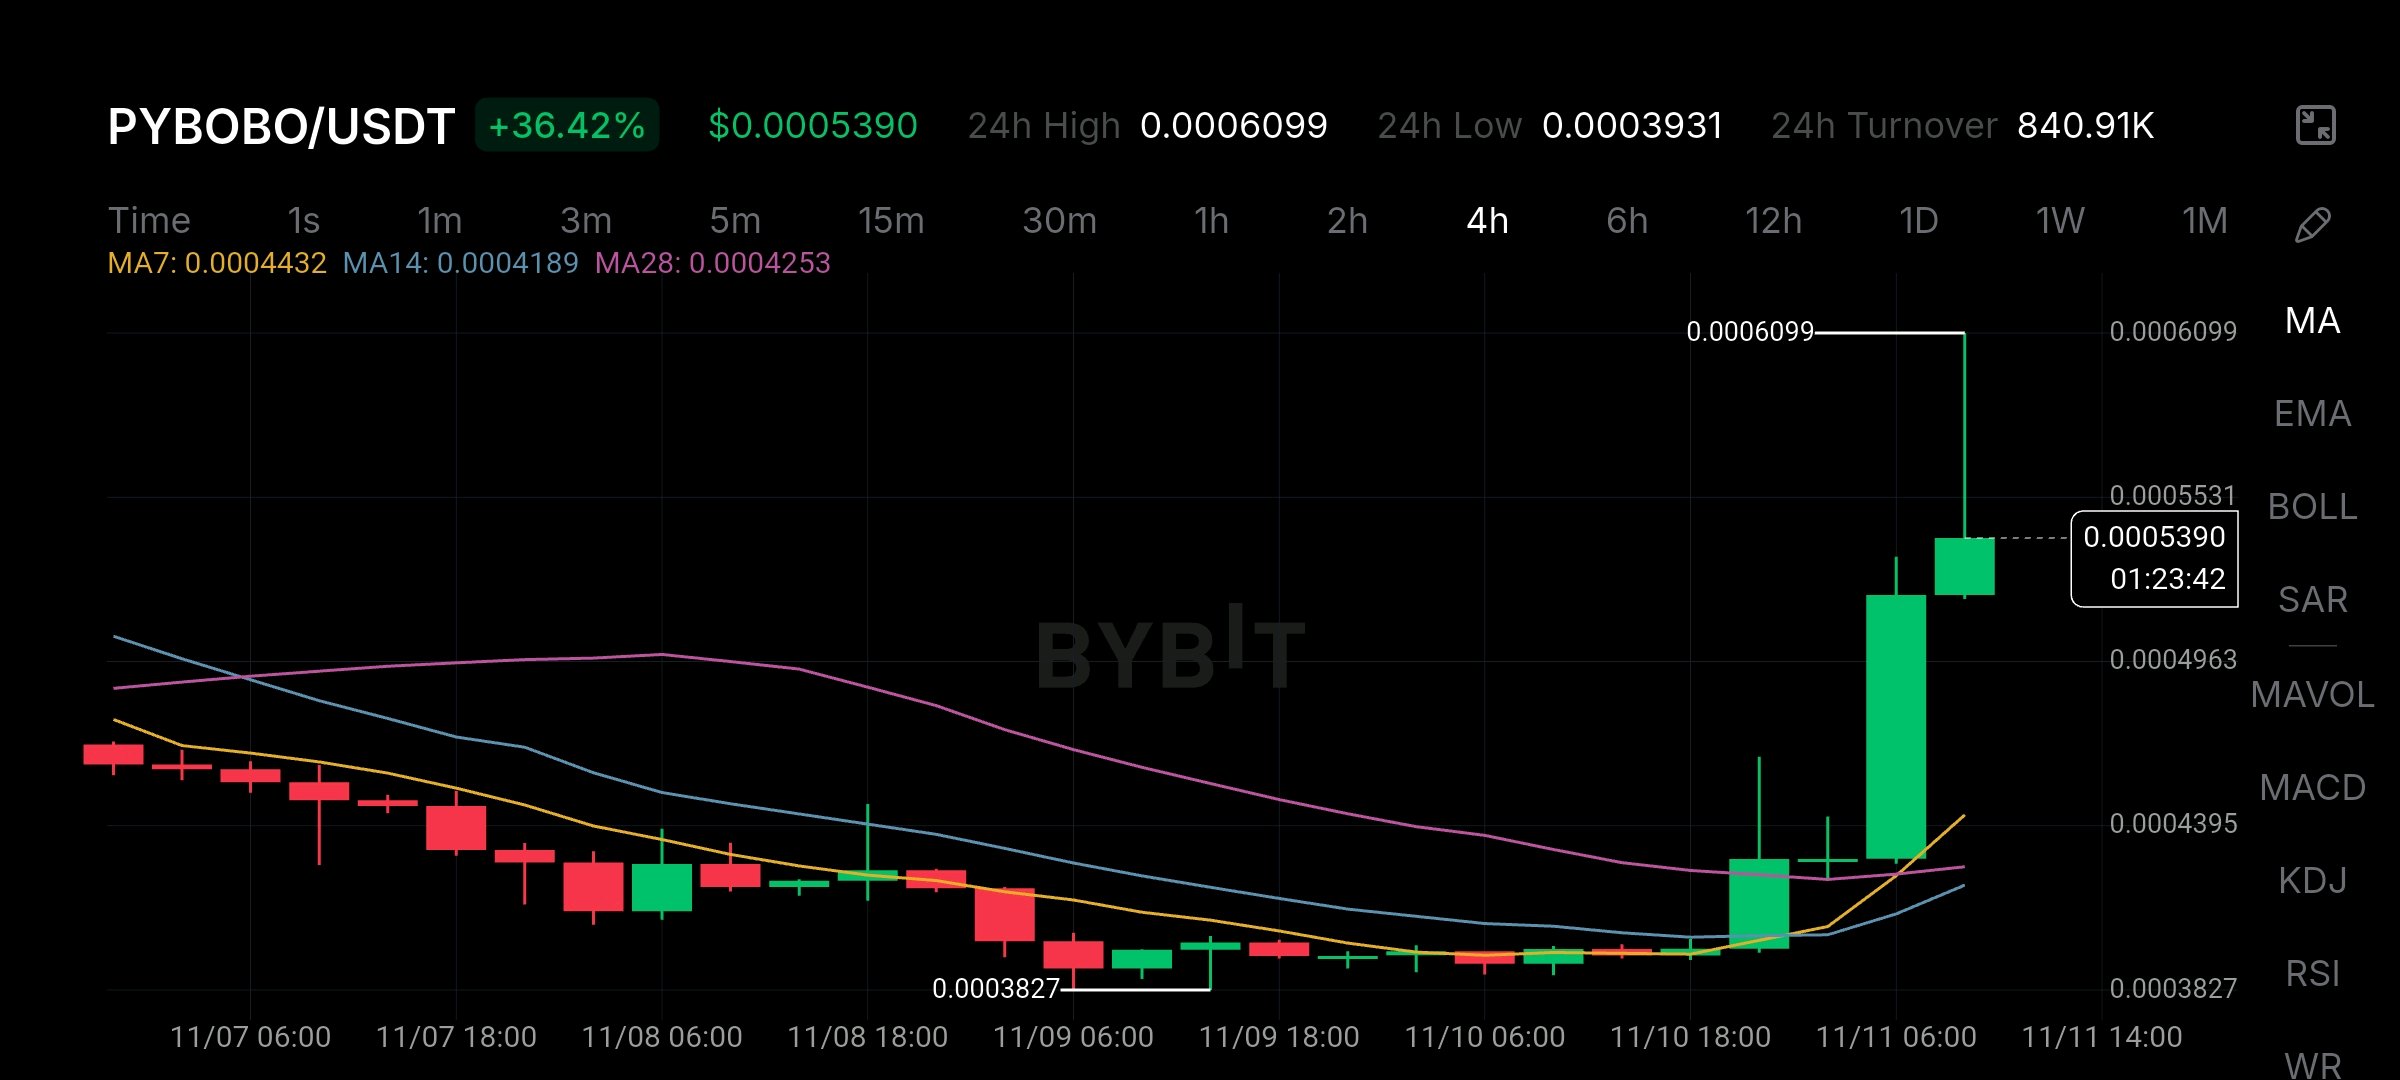
Tapi coba lihat volume $MCRTUSDT . Cek chart 15m ini. MCRT sempat flat di base yang sempit di 0.0001208, lalu tiba-tiba naik vertikal menyentuh 0.0001537. Sekarang naik 23%, bertahan di 0.0001500. Tapi ini red flag besarnya. Lihat turnover-nya. Hanya 25.40K. Itu likuiditas yang sangat tipis. Pergerakan seperti ini terjadi saat order book kosong, dan bisa balik arah secepat itu juga. Level-levelnya: Resistance ada di puncak 0.0001537. Support ada di MA7 jauh di bawah di 0.0001271. Jangan FOMO ke pump tipis ini. Tunggu pullback ke moving average untuk melihat apakah harganya benar-benar kuat. Apakah kamu menolak spike ini? 👇 #Pantauan IHK AS November #WSOTPicktoEarn10U #Data Penggajian AS dan Keputusan Suku Bunga Mendorong Pekan Makro #Volatilitas Minyak Melacak Pembicaraan Perdamaian Iran #Keputusan Suku Bunga BOE $PYBOBOUSDT
DTCC baru saja LIVE dengan Chainlink 🤯 Perusahaan di balik transaksi sekuritas senilai $4,7 KUADRILIUN tahun lalu 💥$GRAMUSDT 🏦 Chainlink akan menjalankan margin, valuasi, optimalisasi agunan, dan penyelesaian di dalam Collateral AppChain milik DTCC ⚙️ 🧠 Riset Nasdaq menemukan 52% perusahaan berharap dapat mengelola agunan tokenisasi secara langsung pada akhir tahun 2026 📊 🐋 LINK di bursa turun sekitar 12% dalam sebulan karena pasokan dipindahkan keluar 👀 ⚠️ Target DTCC sendiri untuk peluncuran penuh adalah Q4 2026 Apakah ini momen di mana infrastruktur Wall Street beralih ke on-chain? 🔌 Bagian mana yang paling mengejutkanmu? 👇 ➕ Ikuti untuk info lainnya #WSOTPicktoEarn10U #Data Penggajian AS dan Keputusan Suku Bunga Mendorong Pekan Makro #Pantauan IHK AS November #Volatilitas Minyak Melacak Pembicaraan Perdamaian Iran @BybitX @kas***@**** @killer901 @DON'T JUDGE ME @BybitX @WhaleX🐳

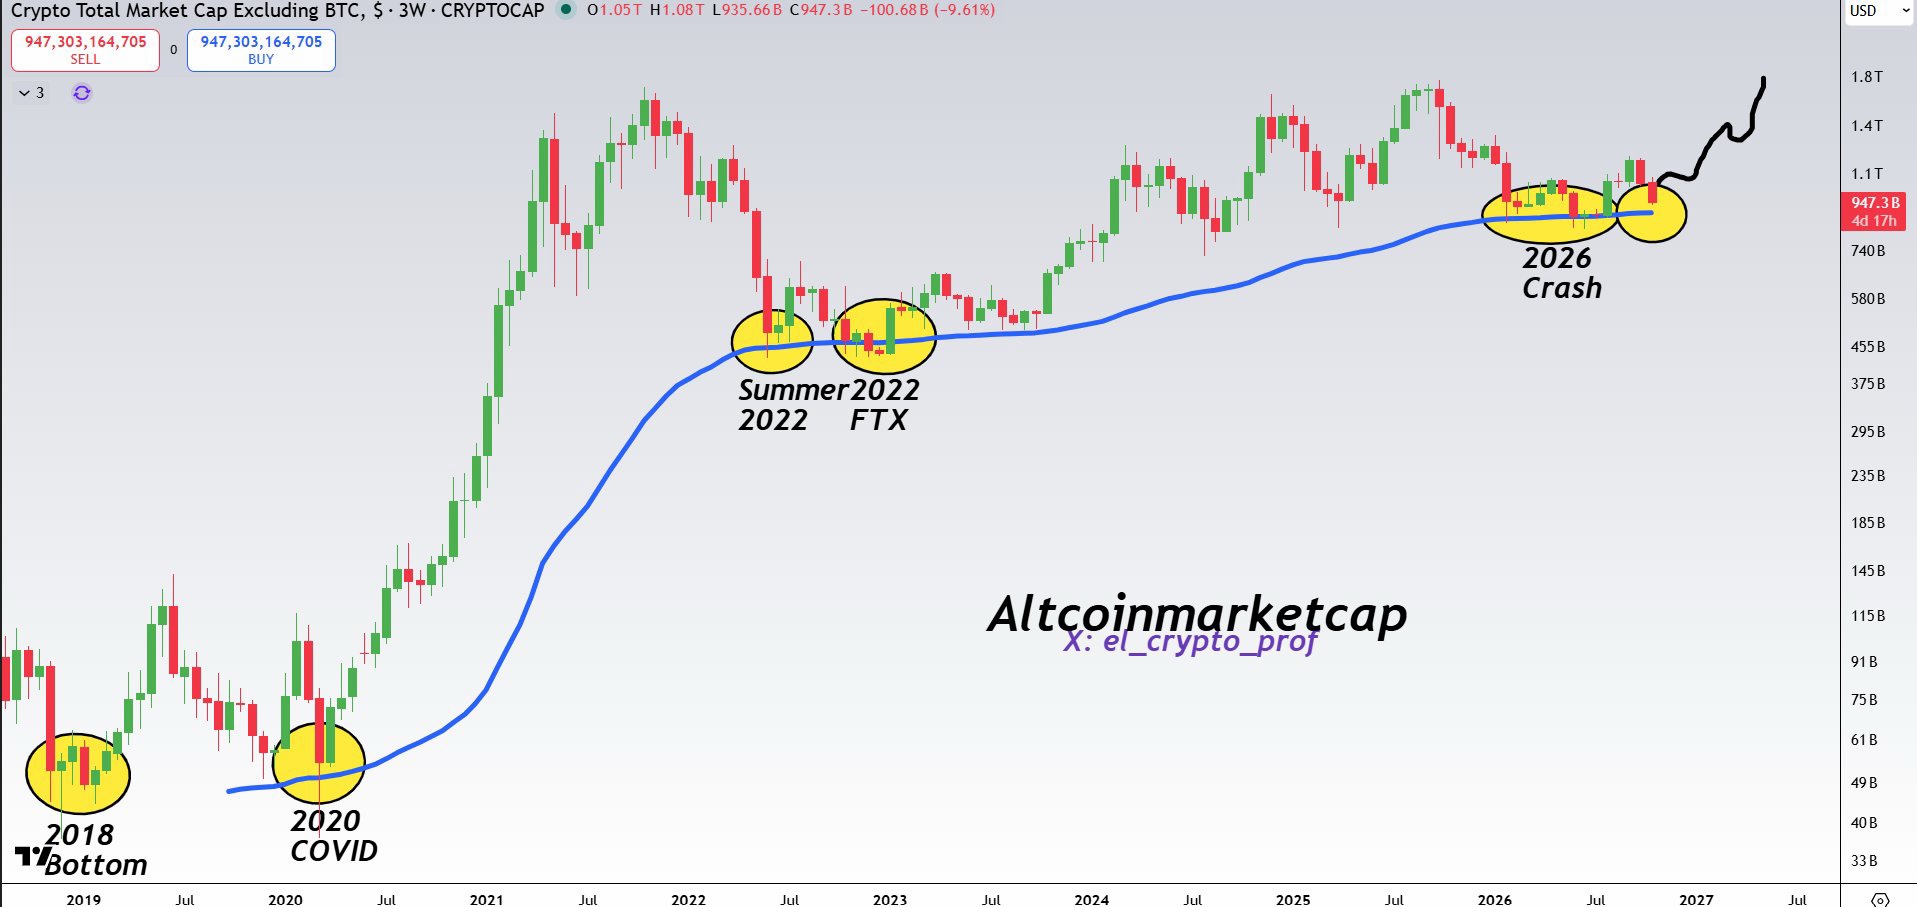
#Altcoins Did you know that the blue line marked the bottom in almost every cycle for TotalMarketCap? The bottom is very close or has already been reached. Higher, much higher. #WSOT2026 #WSOTPicktoEarn10U $INITUSDT
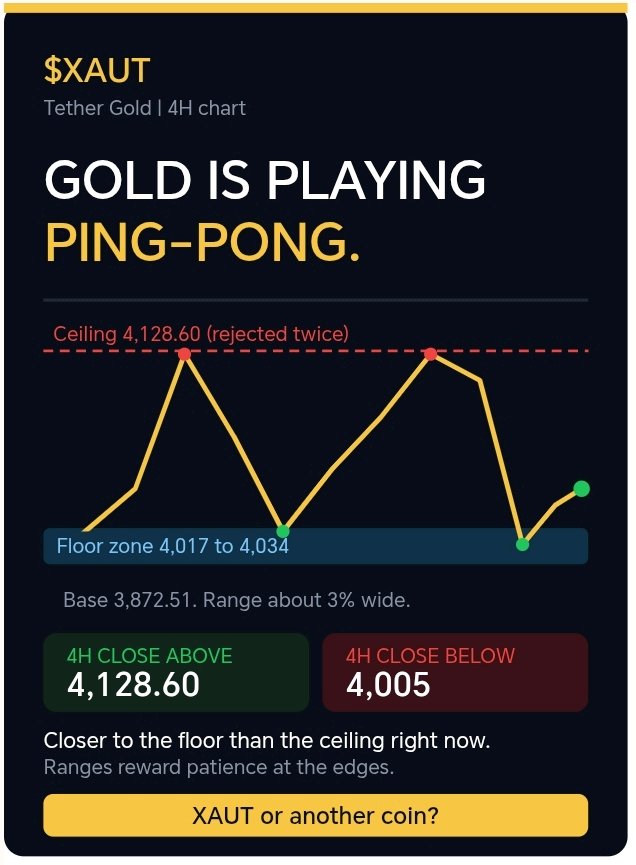
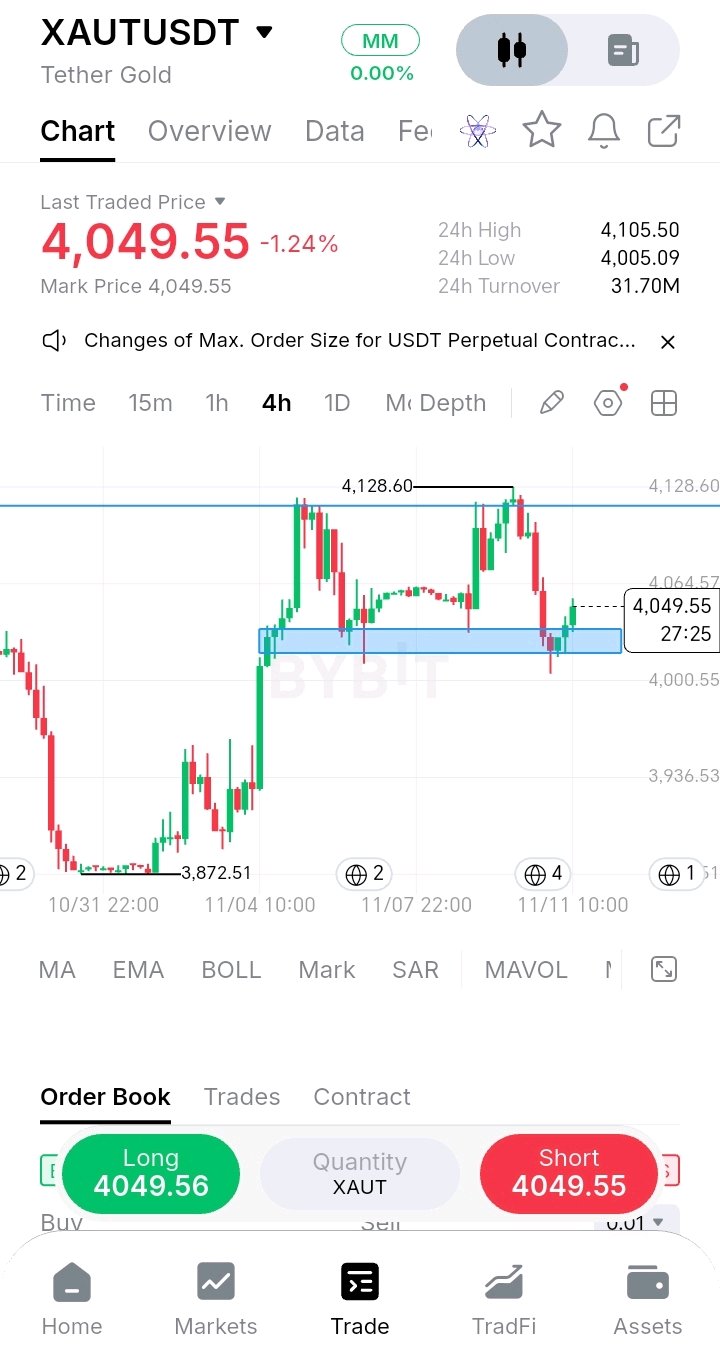
🏓 Emas sedang main ping-pong, dan kedua batasnya terus tersentuh. Saya tidak mau trading di tengah rentang $XAUT ini. Saya ingin melihat batas mana yang tembus duluan pada penutupan candle 4 jam: di atas 4.128,60 atau di bawah 4.005. Inilah yang ditunjukkan oleh chart 4 jam: 🔹 Batas atas: Emas bergerak dari 3.872,51 naik ke level 4.120-an dan telah dua kali ditolak di dekat langit-langit, dengan harga tertinggi terakhir di 4.128,60. 🔹 Batas bawah: Setelah setiap penolakan, harga turun ke zona biru di sekitar 4.017 hingga 4.034, di mana pembeli mulai masuk. Sumbu candle terakhir bahkan sempat turun ke 4.005,09 sebelum kembali pulih. 🔹 Rentang: Sekitar 4.005 hingga 4.128, lebarnya sekitar 3%. Emas telah bergerak bolak-balik di dalamnya beberapa kali. 🔹 Pantulan: Harga berada di 4.049,55, sekitar 1% di atas zona tersebut dan 2% di bawah langit-langit. Harganya lebih dekat ke batas bawah, jadi risiko dan imbal hasilnya condong ke arah lantai saat ini. 🔹 Aktivitas: Turnover 24 jam sebesar 31,70 juta dengan rentang 24 jam di 4.005,09 hingga 4.105,50. Pergerakannya cepat namun tertahan. 🟢 Bullish: penutupan 4 jam di atas 4.128,60 menembus langit-langit untuk pertama kalinya. Swing high 4.208,90 dari sebelumnya akan menjadi referensi berikutnya. 🔴 Bearish: penutupan 4 jam di bawah 4.005 menembus lantai, dan level 3.936 serta 3.872 akan terlihat. Rentang harga menghargai kesabaran di batas-batasnya. Breakout adalah tempat di mana pergerakan sebenarnya dimulai. Apakah Anda sedang memantau $XAUT atau koin lain? #XAUT #Emas #Kripto #BinanceSquare #WSOT2026 #WSOTPicktoEarn10U #Data Penggajian AS dan Keputusan Suku Bunga Mendorong Pekan Makro #Volatilitas Minyak Melacak Pembicaraan Perdamaian Iran #BybitAIEvolving $XAUTUSDT $BTCUSDT
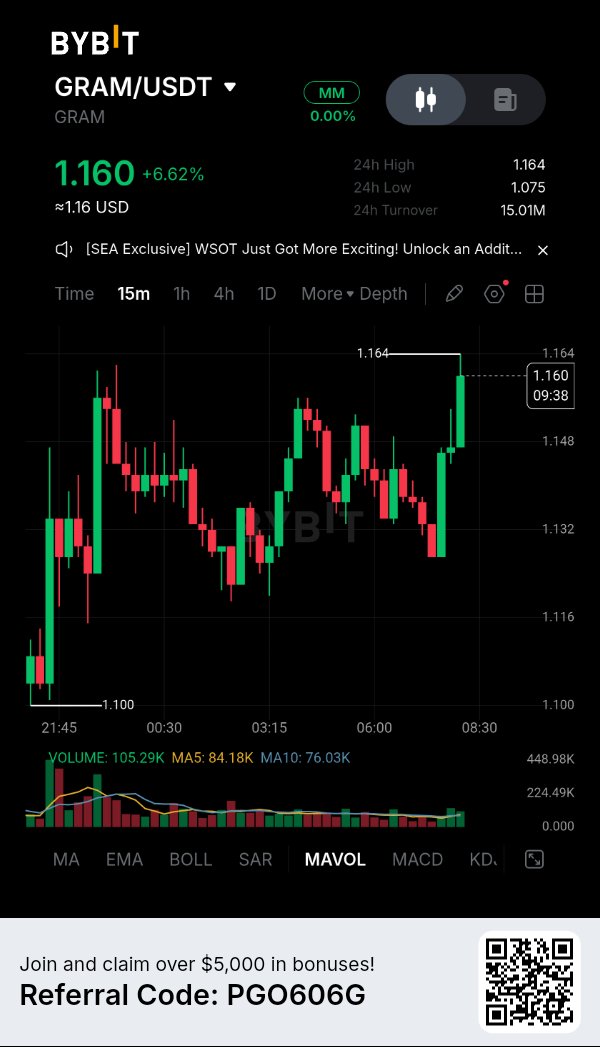
Here is a fresh, master-level breakdown of the GRAM/USDT chart on the 15-minute timeframe. This chart illustrates a highly volatile, choppy market that is slowly grinding upward. It is a great example of why patience is the most important tool in a trader's arsenal. Let's break down the mechanics. 1. The "Whipsaw" Environment Look at the chart from left to right. The price starts at the 24h Low of 1.100, rockets up to ~1.160, crashes down to ~1.125, rallies back to ~1.155, drops to ~1.130, and finally pushes to a new 24h High of 1.164. · The Master's View: Notice the long wicks on almost every candle. This is a classic "whipsaw" market. It is designed to trap retail traders. If you buy the green candles, you get stopped out by the red ones. If you short the red candles, you get squeezed by the green ones. The 24h Turnover is 15.01M—there is plenty of liquidity here, which means these erratic moves are likely driven by algorithmic trading and market makers shaking out weak hands. 2. The "Higher Low" Trend Despite the chaotic, violent swings, look at the macro structure. · First bottom: 1.100 · Second major bottom: ~1.125 · Third major bottom: ~1.130 · The Lesson: Even though the price is chopping wildly, it is printing higher lows. The underlying trend is actually mildly bullish. Buyers are slowly stepping in at higher prices, building a floor. 3. The Current Setup: The Breakout Attempt Right now, the price is sitting at 1.160, pressing right up against the 24h High of 1.164. · Look at the volume bar beneath the most recent massive green candle. It's a very healthy green spike. This tells us that real money is driving this final push. · However, notice that the price has stalled right at the resistance line. It is struggling to break through. --- The Master Trader's Game Plan for GRAM: This is a frustrating chart to trade on a 15-minute timeframe because the chop is so violent. The trend is bullish, but you are currently staring at a major resistance level. Here is how a professional handles it: · Do Not FOMO: Buying right now at 1.160 is a gamble. You are buying right into a wall of sellers at the 24h high. If it rejects here, you will be trapped. · The "Breakout Confirmation" Play: The master move is to wait. Set a buy stop order just above 1.164. If a 15-minute candle closes solidly above that level with strong volume, the resistance is broken, and you can enter a long position. · The "Buy the Dip" Play (The Safe Route): Look at the recent structure. There is a clear support zone around 1.130 - 1.148 (the area of the last pullback). If the price rejects the 1.164 high and pulls back, wait for it to hit that 1.130 zone. If it prints a strong green bounce candle there, that is a much safer entry with a defined stop-loss. · The Danger Zone: If the price violently breaks below 1.125 (the middle swing low), the higher-low structure is broken. The trend has shifted bearish, and the price will likely revisit the 1.100 floor. Summary: GRAM is in a choppy, volatile uptrend, but it is currently fighting a major resistance level at 1.164. The recent volume is promising, but do not chase the price at the top of the range. Wait for a confirmed breakout above 1.164, or a healthy pullback to the 1.130 support zone before making a move. $GRAMUSDT #ByXIMPACT #NovUSCPIWatch #WSOTPicktoEarn10U #USPayrollsAndRateDecisionsDriveMacroWeek #BybitAIEvolving


$BNB | Network growth and token performance don't always move at the same pace. BNB's market strength is closely linked to activity across its ecosystem, from DeFi liquidity to on-chain applications and transaction demand. For traders, three metrics deserve closer attention: → Changes in network activity and active addresses. → DeFi liquidity and TVL trends across BNB Chain. → BNB trading volume, demand and key market structure levels. The important distinction is whether ecosystem expansion is creating measurable demand for the native token. Fundamentals provide context, but price confirmation determines market strength. #BNB #BNBChain #CryptoAnalysis #Bybit #WSOTPicktoEarn10U

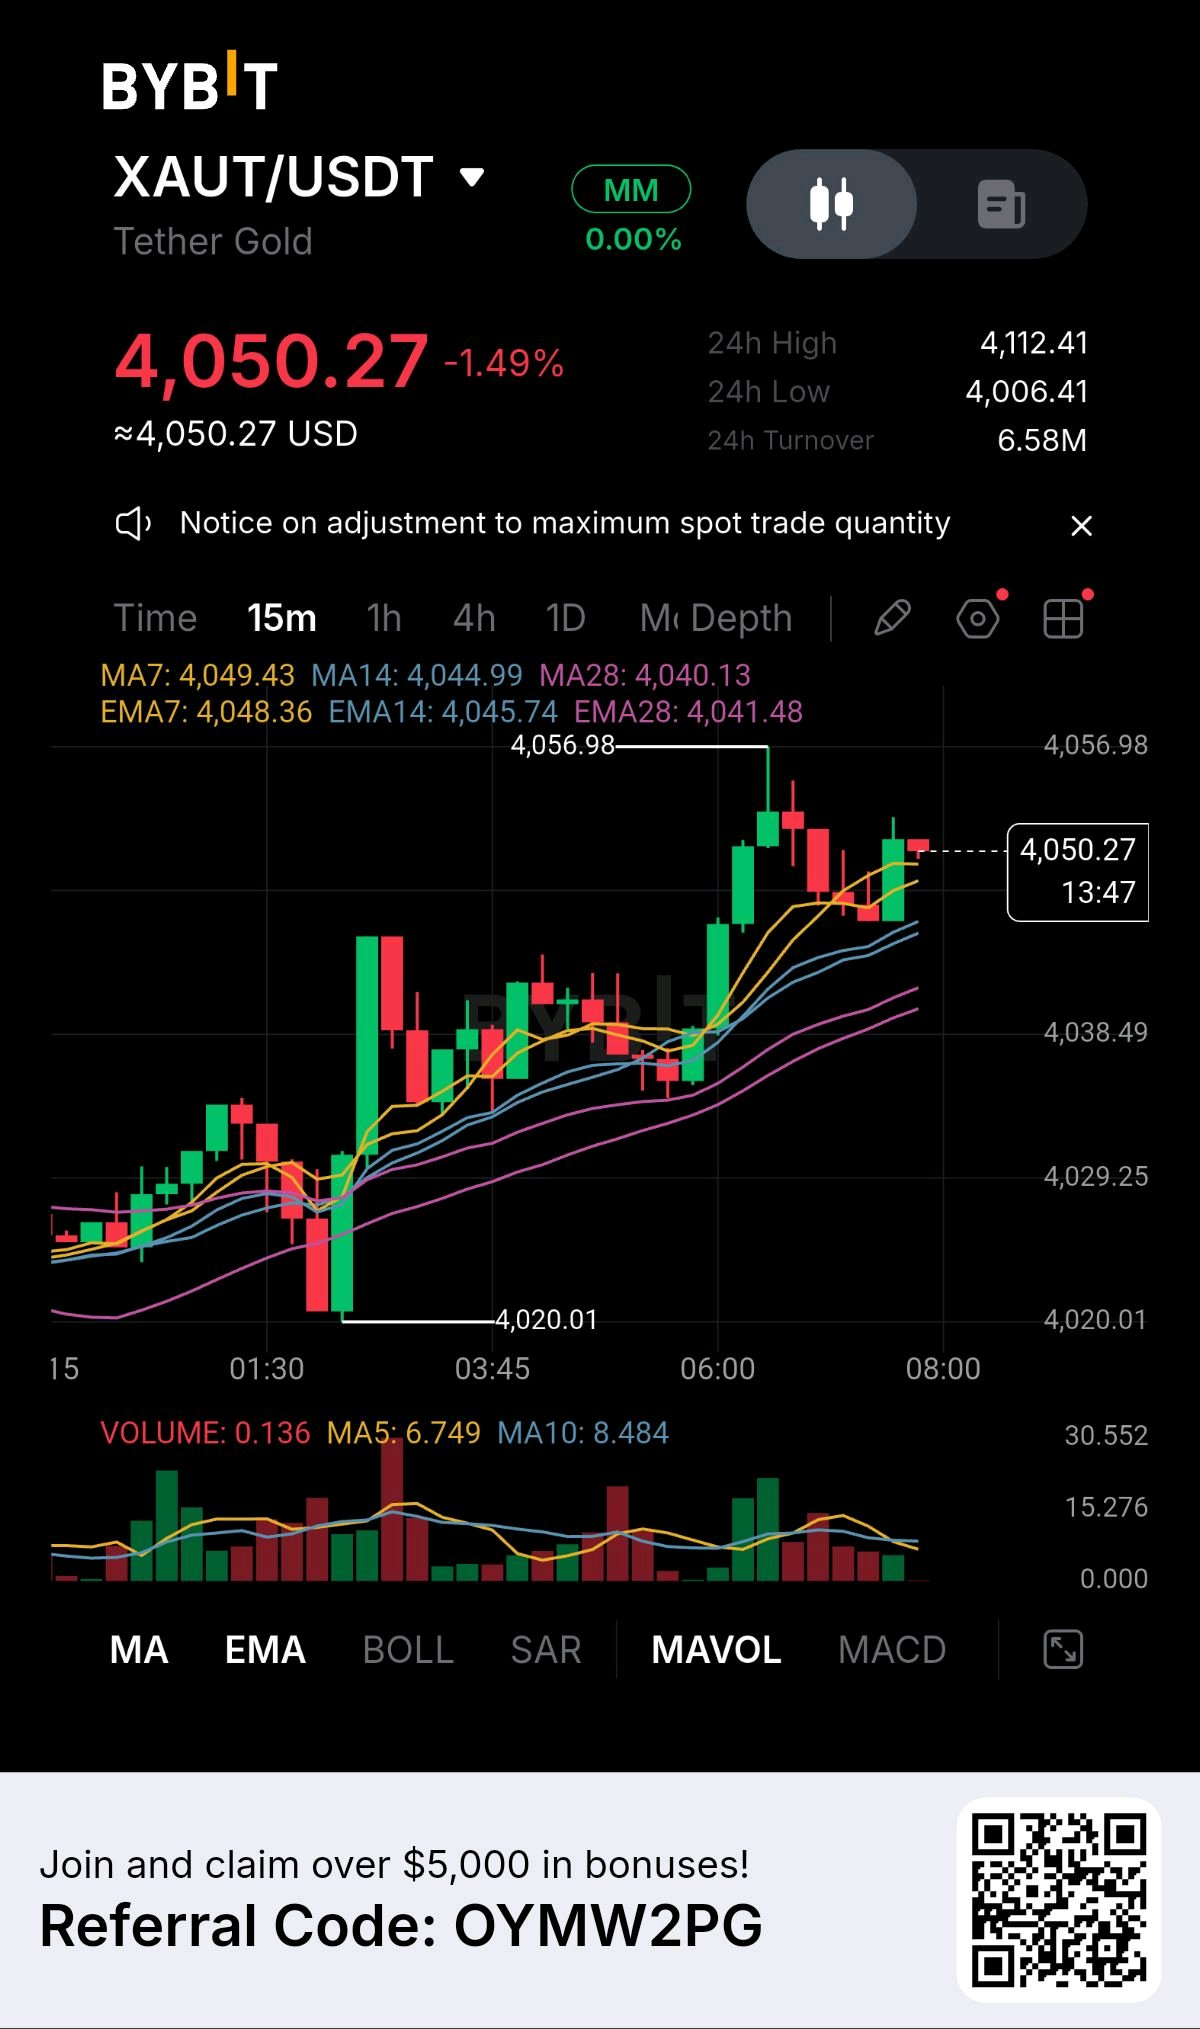
XAUT Bertahan: Apakah Pergerakan Emas Lainnya Akan Segera Terjadi? Emas menunjukkan struktur pemulihan jangka pendek yang menarik meskipun masih berada di bawah tekanan pada grafik 24 jam. $XAUTUSDT diperdagangkan pada $4.050,27, turun 1,49% selama 24 jam terakhir. Namun, grafik 15 menit mengungkapkan bahwa pembeli masih mempertahankan pemulihan baru-baru ini. Apa yang diungkapkan grafik • Harga: $4.050,27 • Tertinggi 24 Jam: $4.112,41 • Terendah 24 Jam: $4.006,41 • Volume Perdagangan: $6,58 Juta Gambaran teknis Rata-rata pergerakan (moving averages) jangka pendek selaras secara positif: • MA7: $4.049,43 • MA14: $4.044,99 • MA28: $4.040,13 Struktur EMA menunjukkan cerita yang serupa, dengan harga diperdagangkan sedikit di atas rata-rata jangka pendek utama. Ini menunjukkan bahwa pembeli masih memiliki kendali atas struktur pasar langsung, meskipun momentum memerlukan konfirmasi yang lebih kuat. Level-level yang penting Resistensi: $4.056,98 Support: $4.044 hingga $4.040 Support penurunan lebih lanjut: $4.038,49 dan $4.029,25 Dua kemungkinan perkembangan Breakout yang meyakinkan di atas $4.056,98 dapat memperkuat momentum bullish dan membuka jalan bagi pengujian kenaikan lainnya. Namun, kehilangan zona support $4.040 dapat melemahkan pemulihan dan mengekspos level support yang lebih rendah. Perspektif pasar saya Pertanyaan pentingnya bukan lagi hanya apakah XAUT dapat pulih. Melainkan apakah pembeli dapat mempertahankan tekanan cukup lama untuk mengubah pemulihan ini menjadi pergerakan naik yang lebih kuat. Breakout membutuhkan konfirmasi, bukan antisipasi. Bagaimana menurut Anda selanjutnya? Akankah emas menembus di atas $4.057 atau kembali menguji support yang lebih rendah?#ByXIMPACT #WSOT2026 #WSOTPicktoEarn10U

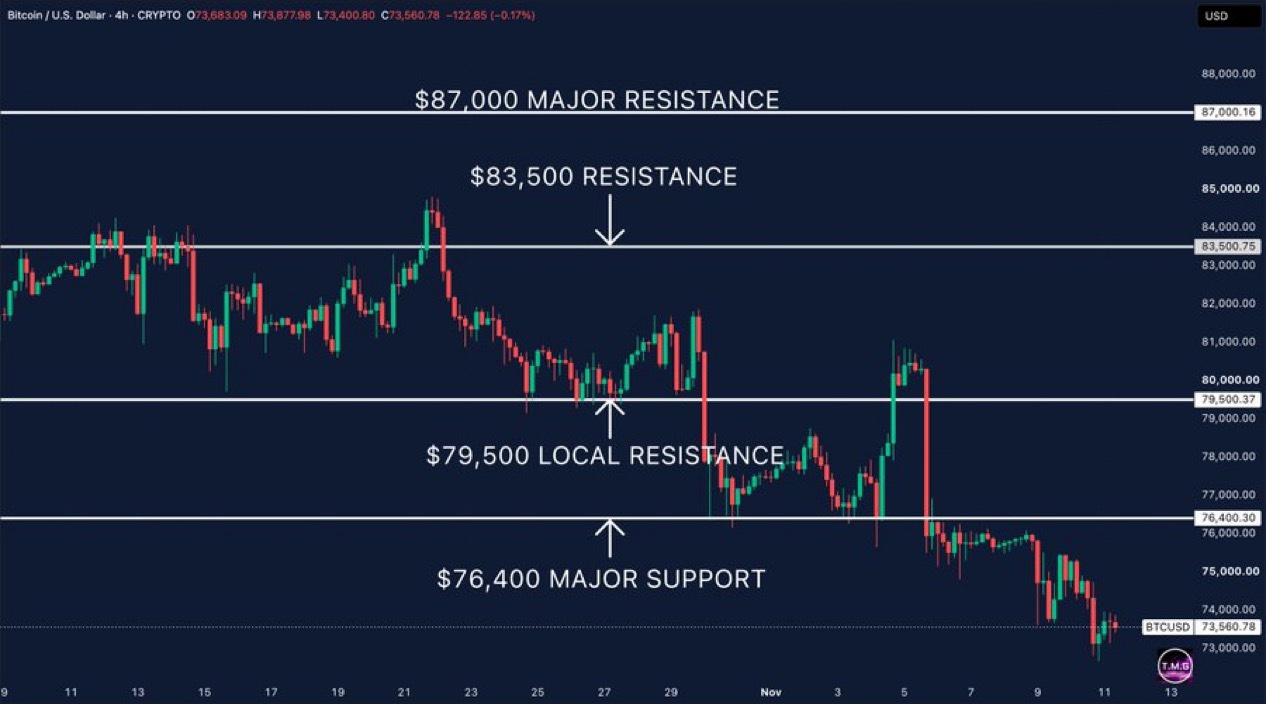
Bitcoin is struggling to find a floor. We've now lost the $76,400 support level, which had been holding the market together. BTC is trading around $73,560, with the 4H chart continuing to print lower highs and lower lows. The next thing I want to see is whether buyers can defend the recent $73K region. A reclaim of $76,400 would be the first meaningful sign of strength. Until then, the bears have the upper hand. #WSOT2026 #WSOTPicktoEarn10U
Kerugian $6,3 Miliar BitMine: Di Atas Kertas, Tunai, dan Titik Impas
Laporan 10-K BitMine menunjukkan kerugian bersih sekitar $6,31 miliar untuk tahun yang berakhir pada 31 Agustus. Setahun sebelumnya, mereka mencetak keuntungan $349 juta. Kerugian yang belum direalisasi atas aset digital adalah $6,23 miliar. Tahun sebelumnya, mereka mencatatkan keuntungan $805 juta. Menurut The Block, ETH turun 44% selama periode tersebut. Headline-nya terdengar brutal. Jadi saya membaginya menjadi dua. Di atas kertas. Kerugian tersebut berasal dari penyesuaian nilai ETH ke nilai wajar. Tidak ada yang dijual dalam kondisi rugi tersebut. Arus kas. Itu cerita yang berbeda. Operasional menghabiskan $305,1 juta. Pendapatan sekitar $125 juta, dan 97% darinya berasal dari staking ($121 juta). Beban umum dan administrasi sebesar $376,9 juta. Sekarang, angka yang harus diingat. Basis biaya ETH BitMine adalah $19,95 miliar untuk 5,9 juta ETH. Sekitar $3.380 per ETH. Nilai wajar pada 31 Agustus adalah $14,56 miliar, sekitar $2.470 per ETH (menurut hitungan saya). Dengan ETH mendekati $2.130 minggu ini, dibutuhkan kenaikan sekitar 59% lagi untuk kembali ke harga modal berdasarkan basis tersebut (menurut hitungan saya). Satu koreksi untuk cuitan tersebut. 5,9 juta ETH adalah angka per 31 Agustus. Per 8 November, BitMine memegang 6.070.092 ETH, yaitu 4,97% dari total suplai. Ini bagian yang memberi harapan. Staking sedang meningkat. Pembaruan terbaru BitMine menunjukkan imbal hasil staking tahunan sekitar $309 juta dari 5,2 juta ETH yang di-staking. Itu adalah yield 2,65%. Angka ini kurang lebih menyamai pembakaran kas tahun lalu sebesar $305 juta (menurut hitungan saya). Namun, itu adalah run-rate, bukan pendapatan yang dilaporkan. Itu bergantung pada harga ETH dan yield-nya. Pada harga $2.130, angkanya mendekati $295 juta. Dan beban umum & administrasi mungkin termasuk item non-kas. Saya memantau dua hal. Pendapatan kuartal berikutnya dibandingkan dengan run-rate $309 juta itu. Dan kas BitMine: $475 juta per 8 November, turun dari $514 juta dua minggu sebelumnya. Jika pendapatan staking mencapai run-rate tersebut, model ini dapat mendanai dirinya sendiri pada harga saat ini. Jika ETH jatuh, hitungan itu pun ikut jatuh. #WSOT2026 #Pantauan IHK AS November #WSOTPicktoEarn10U #Data Penggajian AS dan Keputusan Suku Bunga Mendorong Pekan Makro #Volatilitas Minyak Melacak Pembicaraan Perdamaian Iran


if you're in your early 20s, actively participating in Web3, and you've convinced yourself that one day the next big airdrop, protocol, ecosystem or alpha call is going to change your life, I really pity you. Because there's a dangerous side to this space that a lot of young people don't talk about. You can spend three, four or even five years chasing opportunities on Crypto Twitter. Waking up to check your timeline, farming points, joining Discord communities, grinding leaderboards, hunting for whitelists, jumping from one testnet to another and convincing yourself that the next opportunity is the one that will finally pay off. And there's nothing inherently wrong with that. Web3 has created real opportunities for people who were willing to take risks, learn and put in the work. But what happens when you spend all those years chasing digital opportunities while neglecting the ones right in front of you? You could have learned a practical skill, built a business, pursued a career, gone back to school, developed meaningful relationships, travelled, met people outside your timeline or even started something of your own. Instead, you keep postponing real-life progress because you're waiting for an airdrop that may never come, a token that may never appreciate or a project that might not even remember your contribution when it's time to distribute rewards. The scary part is that the years don't announce themselves before they pass. One day, you'll look up and realise you're approaching 30. You have thousands of followers, hundreds of Discord roles, countless testnet transactions, a folder full of project bookmarks and an impressive knowledge of protocols nobody around you understands. But outside Twitter, what have you actually built or achieved ? What skills can you monetize? What tangible assets do you own? What experience can you put on your CV? What opportunities have you created for yourself beyond the possibility of another airdrop or an NFT you can flip for peanuts? I'm not saying leave Web3. I'm not saying the opportunities aren't real. Some people will genuinely change their lives through this industry. I'm saying don't make Web3 your entire life. Learn to code. Get a job. Start a business. Build something tangible. Develop skills that remain valuable even when the market turns red and the timeline goes quiet. Make friends outside Crypto Twitter. Take care of your health. Explore opportunities in the real world. You can farm points and build your future at the same time. Participate in the ecosystem, but don't become so consumed by the possibility of making it big that you forget to actually make something of yourself. Don't spend your entire 20s waiting for crypto to change your life. Make sure you're building a life that doesn't depend on it. #WSOT2026 #WSOTPicktoEarn10U #BybitAIEvolving $XLMUSDT @

WSOT 2026
WSOT 2026] Join the squad and compete for a share of up to 3.2M USDT $BTCUSDT $SOLUSDT #WSOT2026 #OilVolatilityTracksIranPeaceTalks #WSOTPicktoEarn10U

Compression Before Expansion? 🧠📉
Bitcoin is currently trapped in a volatile tug-of-war. If you are trading the 15-minute chart, here is the only technical breakdown you need right now. 📊 SNAPSHOT ▪️ Price: $73,589.7 (-1.46%) ▪️ **24h Range:** $72,727.2 – $74,995.5 ▪️ Liquidity: 974.12M USDT (Heavy trading) 🔍 MARKET STRUCTURE: THE BATTLEGROUND The Setup: BTC is currently chopping sideways in a wide, messy range. We have a clear ceiling at $74,057.3** and a hardened floor at **$73,217.7. Price is currently hovering just below the mid-point. The Volume Warning (Crucial): Look at the bottom indicator. Volume is 60.889, which is below both the MA5 (91.499) and MA10 (89.410). 👉 Translation: The market is currently in a liquidity drought. The aggressive moves we saw earlier have died down. When volume dries up in a range, it usually precedes a violent breakout (in either direction). ⚡ TRADING SCENARIOS (What to watch for next) 🟢 Scenario A: The Bullish Breakout We need a 15m candle to close **above $73,847** and push toward the $74,057 ceiling. ▪️ The trigger: A sudden spike in green volume. No volume = fake breakout. 🔴 Scenario B: The Bearish Rejection If price rejects the current zone and breaks below the immediate support at **$73,427**, we will likely see a retest of the $73,217 floor. ▪️ The trigger: A strong red candle closing below $73,427 with increasing volume. 🧠 TRADER'S PSYCHOLOGY & RISK Right now, the chart is screaming "Indecision." Do not force a trade in the middle of a low-volume chop. Retail traders get chopped up here. The professional move is to wait for the market to show its hand. Let the price break the range, confirm with volume, and then act. 💬 What is your read? Are we heading to $74K or $73K? Drop your chart analysis below! 👇 $BTCUSDT #ByXIMPACT #WSOTPicktoEarn10U #USPayrollsAndRateDecisionsDriveMacroWeek #OilVolatilityTracksIranPeaceTalks #BybitAIEvolving

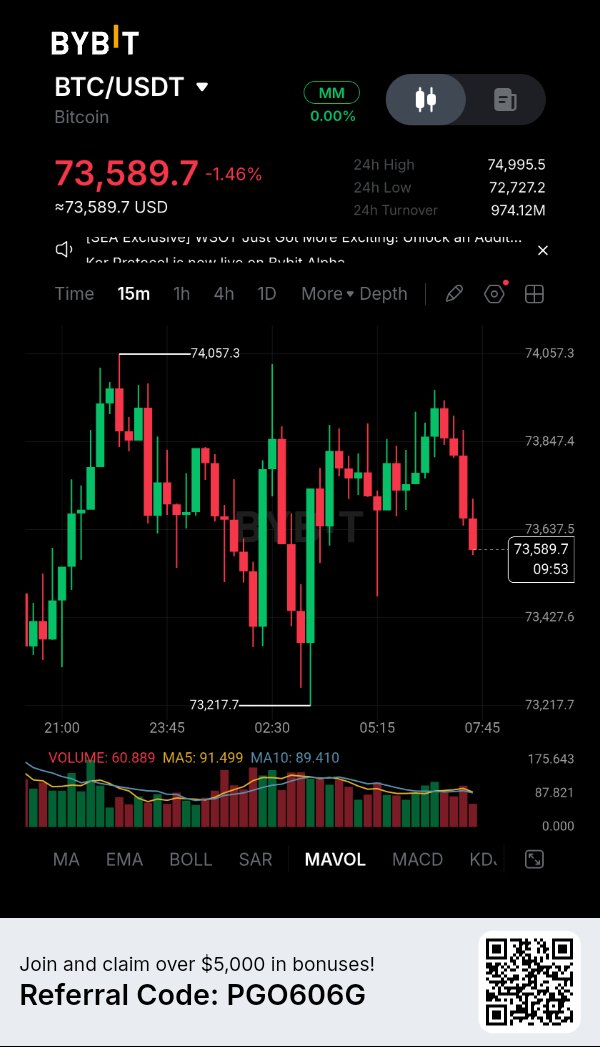

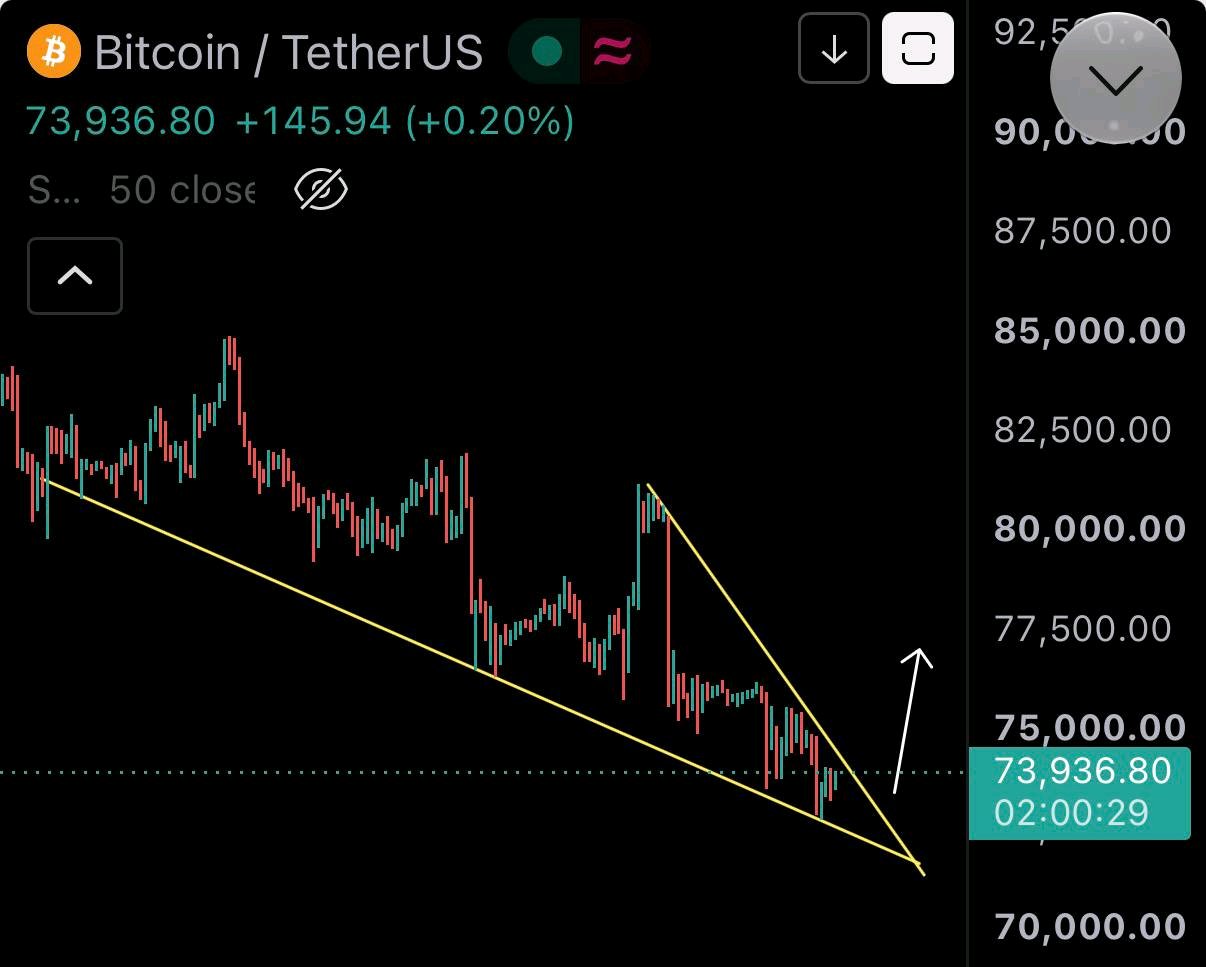
Bitcoin is forming a falling wedge pattern, which is considered bullish. If the pattern plays out, we may see a breakout and price will hit $75k to $76k resistance $BTCUSDT #WSOT2026 #NovUSCPIWatch #WSOTPicktoEarn10U #USPayrollsAndRateDecisionsDriveMacroWeek #OilVolatilityTracksIranPeaceTalks