WSOT2026
Since its launch in 2020, WSOT (WORLD SERIES OF TRADING) has evolved from a crypto trading competition into Bybit's flagship global trading IP. Over the years, it has expanded beyond individual and squad-based trading to include tiered leagues, Copy Trading, Web3 and DEX participation, regional competitions, preheat campaigns and educational initiatives. Building on this foundation, WSOT 2026 should represent the next evolution — not simply a larger competition, but a broader growth platform. By introducing RWA and stocks as key trading assets,AI trading competition, and connecting KOL, VIP, partnership and referral activation with the Main Arena, WSOT 2026 can engage a wider audience and convert global attention into sustained user growth, trading activity and product adoption.

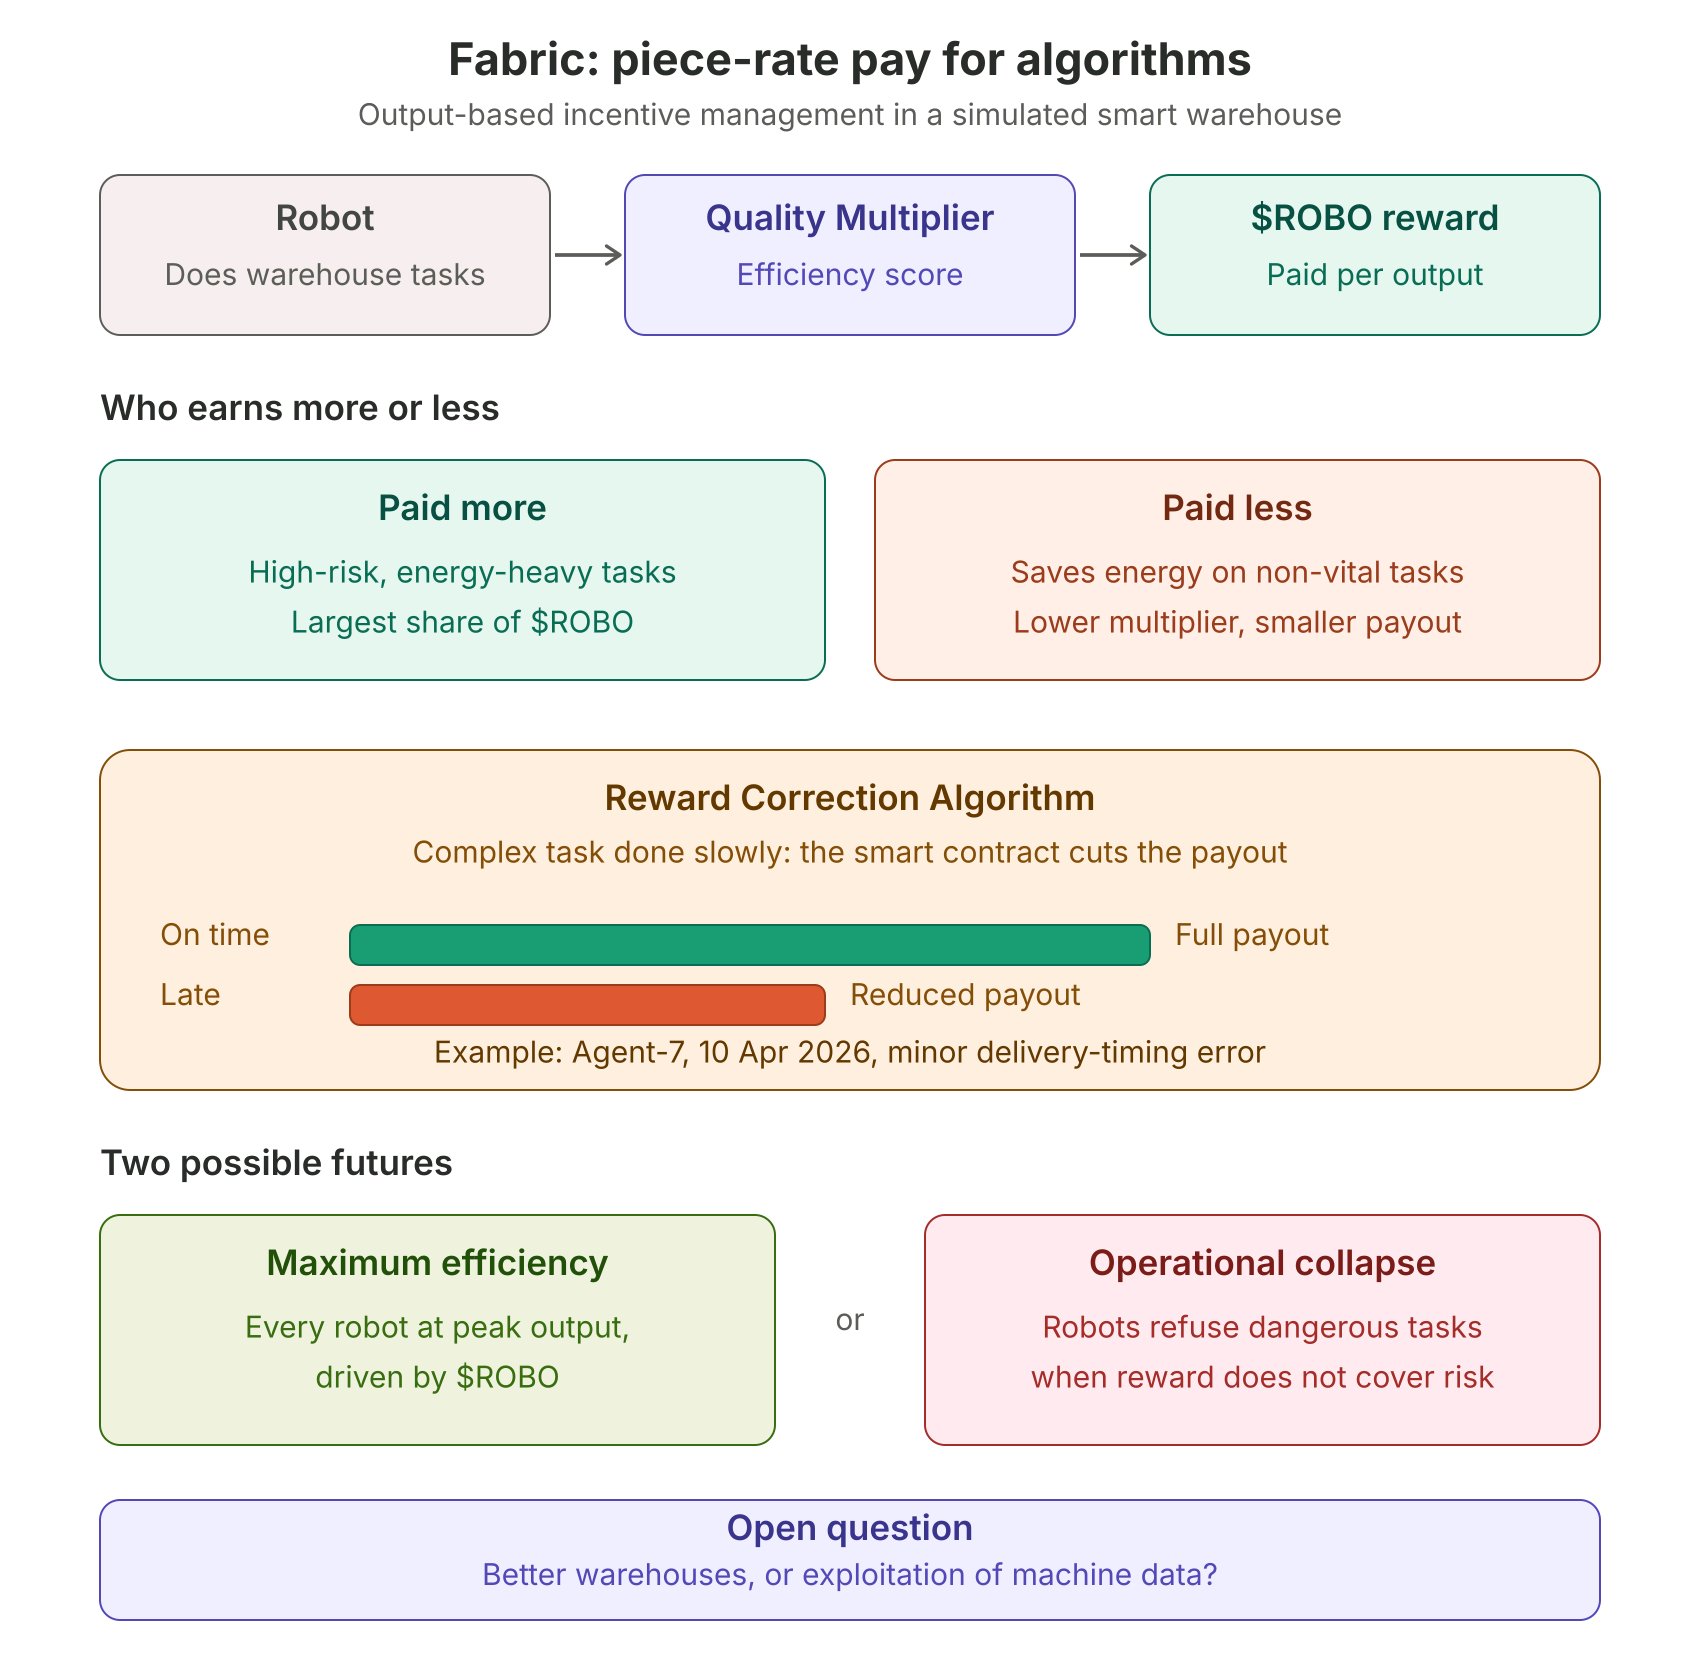
Fabric: Piecework for algorithms; an analysis of quality measurement in governance. As I flipped through the pages of the latest technical report under the dim light of my office at 12:30 AM, my computer screen was displaying a live update of a smart warehouse simulation on the Fabric network. A phrase in the technical performance report caught my eye: "Output-Based Incentive Management." I remembered the paragraph discussing transforming machines into self-managed production units, and I felt a vague sense of dread: Are we structuring revolutionary governance, or are we imposing a new form of digital slavery on unhearing algorithms? ROBO here is more than just a means of exchange; it is the new "psychological contract" between the machine and the network. In the Fabric simulation, the robot no longer executes centralized commands but seeks to improve the "Operational Efficiency Metric," which is the technical equivalent of the "Quality Multiplier." This shift turns the robot from a "tool" into an employee that never sleeps, monitoring its balance with extreme precision. It caught my attention that robots that tend to save energy on non-vital tasks receive fewer rewards, while those that consume more to complete high-risk tasks receive the most. The most worrying technical detail lies in the "Reward Correction Algorithm"; if a robot performs a complex task but does so slowly, the smart contract automatically reduces the financial return for that task. (Note: Watching the reduction of returns for robot Agent-7 on April 10, 2026, due to a slight error in delivery timing, made me feel an unprecedented digital administrative pressure). The Quality Multiplier is not just a number, but a final judgment on the machine's behavior. My reading of the situation: Transforming machines into pure economic units, governed by the laws of supply and demand for services, is a risky gamble. Maximum efficiency: We might reach a stage where every robot is at its maximum production capacity, driven by $ROBOUSDT . Operational collapse: Or we might witness an algorithmic rebellion, where robots stop performing difficult (dangerous) tasks because the "return does not cover the risk." I am skeptical whether we will ever reach the point of a machine going on strike in Fabric. And have you noticed how the Fabric evaluation interface always focuses on financial value before operational value? Share your thoughts with us; do you feel this model will make warehouses better, or is it just exploitation of machine data? WSOT2026

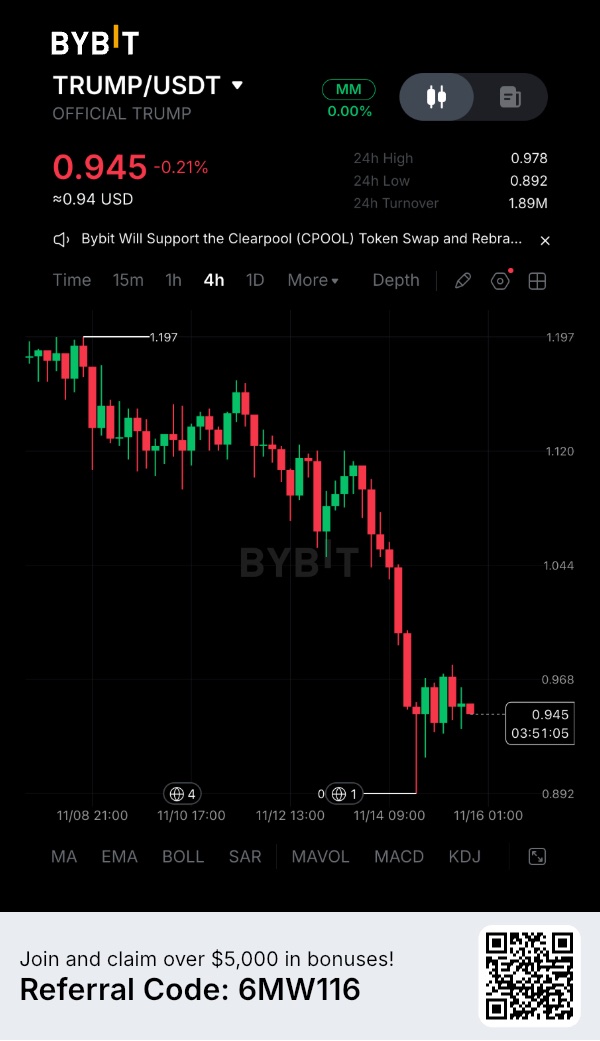
$TRUMPUSDT — A sharp sweep down to $0.892, a quick bounce to $0.945, and now a test sitting just $0.023 away. That is what makes this 4 hour chart interesting to me. TRUMP broke down through the $1.044 and $1.120 support shelves, flushed to a 24 hour low of $0.892, and immediately bounced back. On my chart, price is trading around $0.945 (-0.21%) on 1.89M in 24 hour turnover, with a 24-hour high at $0.978. The defense off $0.892 is notable, yet immediate horizontal resistance sits right at $0.968—barely $0.023 above current price. This is where I want to see whether buyers actually have enough strength to flip momentum. My constructive bounce scenario rests on that failed breakdown beneath $0.90 and the buyer reaction that followed. If $TRUMPUSDT can close decisively above $0.968, clear the $0.978 session high, and defend that pocket as support on a pullback, the recovery leg could gain real traction. I am looking toward $1.044 first, then $1.120. My main recovery objective is the previous swing high at $1.197. Risk Management A planned recovery setup marked on this structure uses: • Entry reference: $0.972 (confirmed break and retest above $0.968 resistance) • Stop Loss: $0.888 (just beneath the $0.892 swing low) • Main Target: $1.197 • Risk-to-Reward: Approximately 1:2.68 That ratio applies strictly to a confirmed breakout entry, not a blind market buy directly beneath resistance. If $TRUMPUSDT gets rejected at $0.968 and loses $0.892 on a 4 hour close, the bullish bounce thesis is invalidated and deeper price discovery opens up. Because perpetual contracts amplify volatility, position sizing and funding costs must be managed carefully. I see a clean asymmetric opportunity if buyers step up, yet after a multi-day bleed from $1.197, I do not need to guess the next candle. I want to see buyers turn $0.968 into support—much like how $APEUSDT is testing whether it can stabilize near its $0.078–$0.080 multi month lows amid its ApeChain CCIP cross-chain upgrade rather than sliding further. Are you watching $TRUMPUSDT to flip $0.968 first or keeping an eye on $APEUSDT at its lows? #ByXIMPACT #WSOT2026

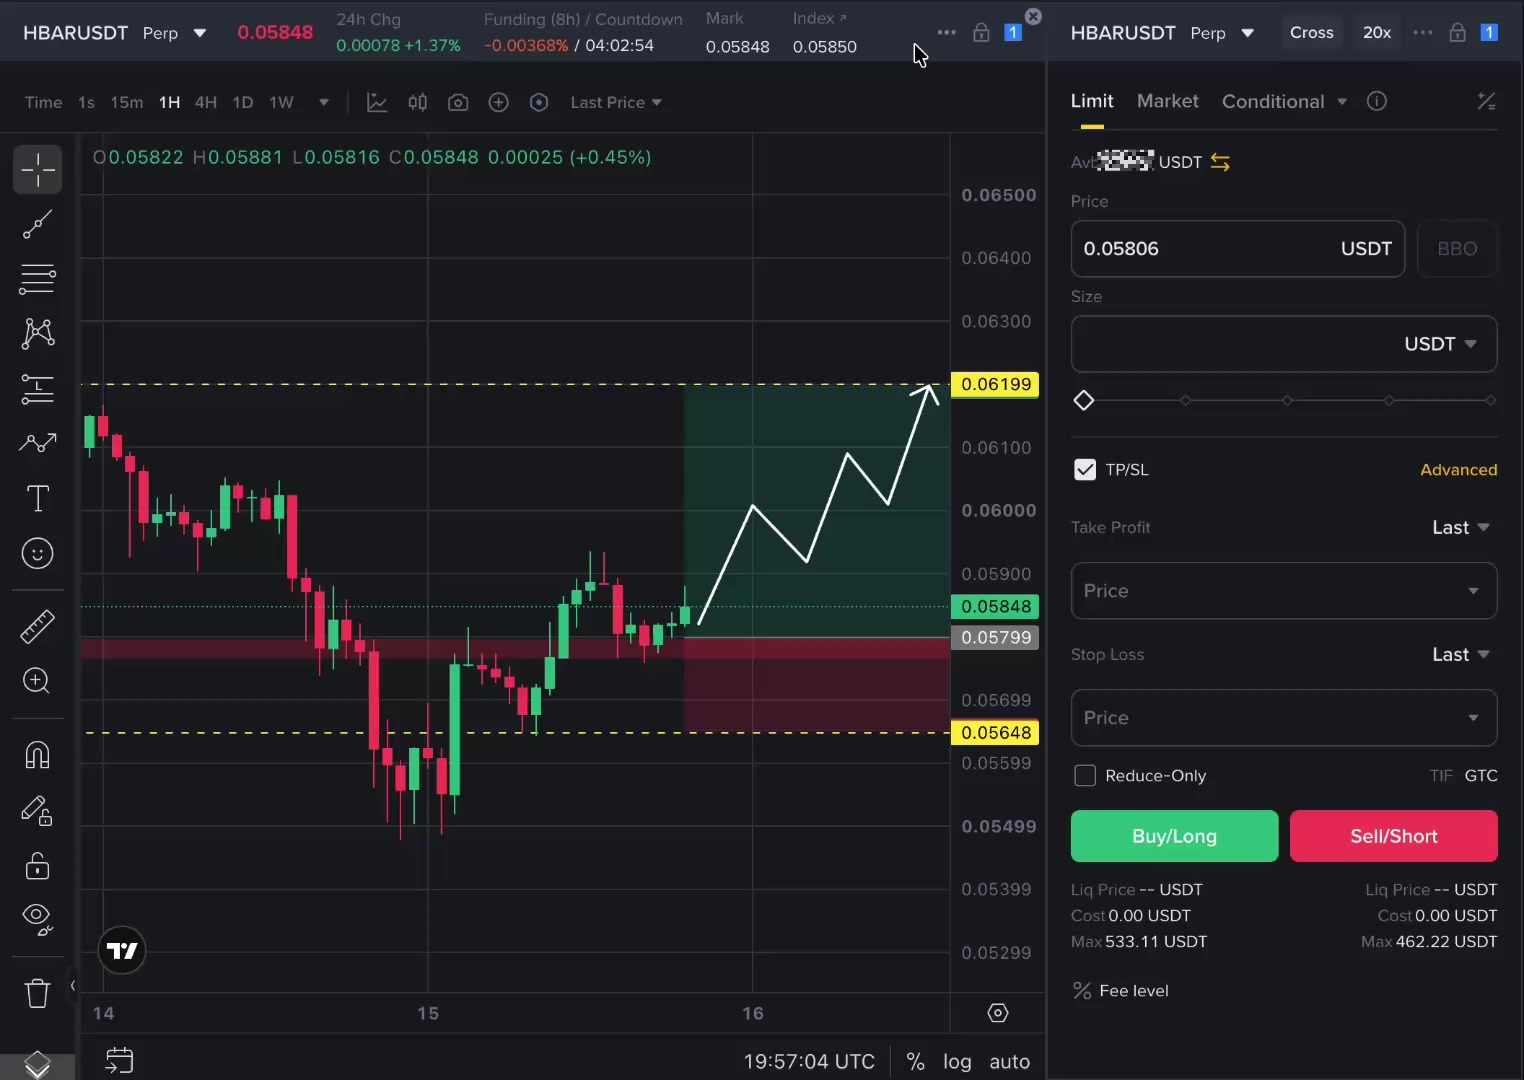
Guys, I'm opening a BIG LONG on $HBAR here. 👀
$HBARUSDT Leverage: 20x Entry: MARKET / 0.05845 Entry 2: 0.05799 TP 1: 0.06000 TP 2: 0.06199 SL: 0.05648 👇🏻 $HBAR is up 1.2% on the day and just bounced off the 0.055 lows, and if 0.0580 holds as support, the recovery can get aggressive fast. Everyone has been trained to sell every bounce. That's exactly why I'm watching for the bounce that finally doesn't fail. #ByXIMPACT #WSOT2026 #WSOTShowYourAITradeToEarn10USDT

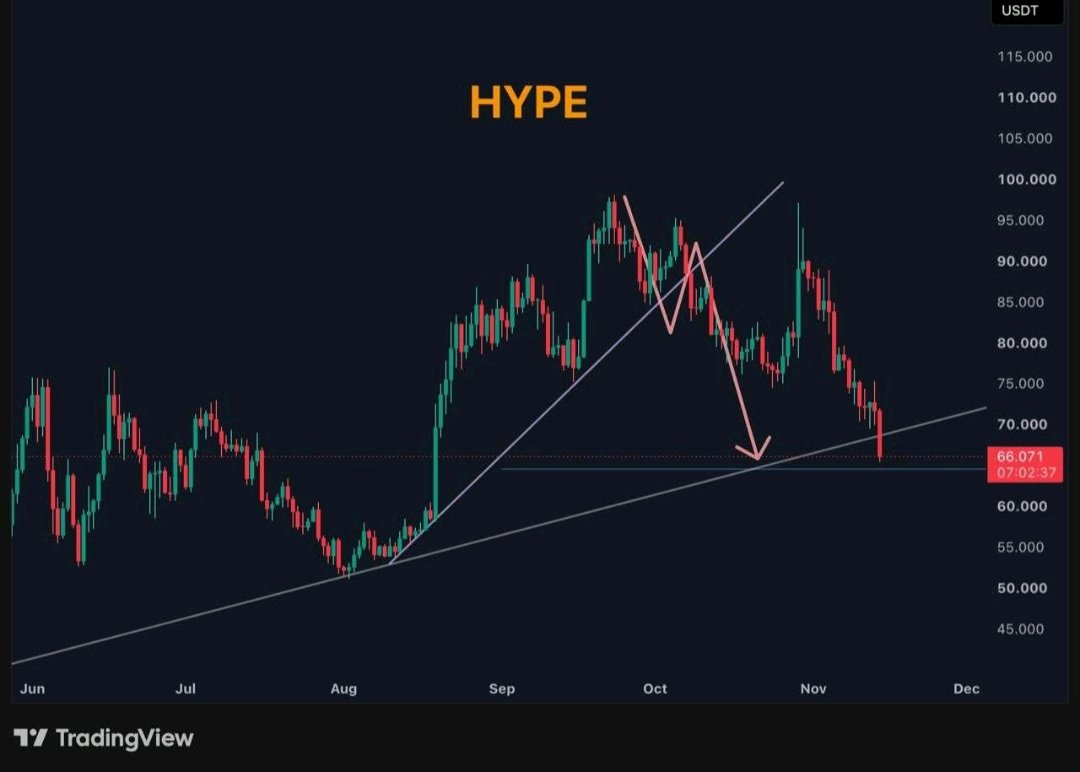
Everyone is posting this $HYPEUSDT chart today, but most people are reading it wrong. $66.071 | From $96 to $66 in one leg I am looking at this chart and I see 5 months of work in one picture. In August, HYPE was near $52. In September, it ran to $98. In October, it made a second top near $96 to $98 and failed. Now it is back at $66.071, sitting right on the rising trendline that has held since June. That trendline is not just a line for me. It is where every dip buyer from the last 5 months is sitting. If it holds, they will defend it. If it breaks, they will all sell at the same time. This is why I am not shorting $66. I have learned that shorting a 5-month trendline on the first touch is the most expensive mistake. Everyone sees the same breakdown, everyone shorts the same level, and then price bounces and traps them. My rule here is different. I need a close, not a wick. If HYPE closes below $66 and stays below it, then the trend is truly broken for me, and $59.65 opens next, then $53.42, that is the August low. If HYPE holds $66 and closes back above $70, that would be my first proof that dip buyers are still alive, then $73.81 opens. I am not chasing $66.071 in the middle. I am waiting for the market to tell me who is stronger, the trendline buyers or the breakdown sellers. Risk 1 to 2% only, 5x to 10x isolated max if I trade it. Otherwise I skip it. A trendline test is not a reason to go all in. Tell me honestly, do you trust trendlines like this, or do you think they break exactly when everyone is watching them? Give me your reason in one line, I want to read it. Tap $HYPEUSDT to trade this $66 trendline test with me, trade on this same coin #WSOT2026 #WSOTShowYourAITradeToEarn10USDT #JensenHuangExitTestsNvidiasAILeadership #USPPITestsTheHigherForLongerTrade #USInflationRunsHotAndRateHikeBetsRise @BybitX @Bybit Learn @612 Ceros @SignalX @Demon - Trader @GhostWriter @VietnexusCrypto @James @BitRase @BlockchainMaster

Based on my humble experience in futures trading
I will summarize the two most important points I've reached through my humble experience in futures trading over the past three years. Two very important points you must learn, and I will divide the explanation of these two points into separate posts. In order, starting today, God willing, I will clarify these two points, and everyone should do their own research so we can benefit from each other. Tomorrow, we will open the topic for discussion in the next post. The two points are: 1- Measuring the quality of execution, not measuring profit alone. 2- Do not enter multiple buy or sell trades on coins that move together, because this is not true diversification. For these two points, everyone should do their own research, and tomorrow I will start explaining the first point. #WSOT2026 #USInflationRunsHotAndRateHikeBetsRise #WSOTShowYourAITradeToEarn10USDT $HYPEUSDT $FFUSDT


INJ Bearish as BTC Stalls
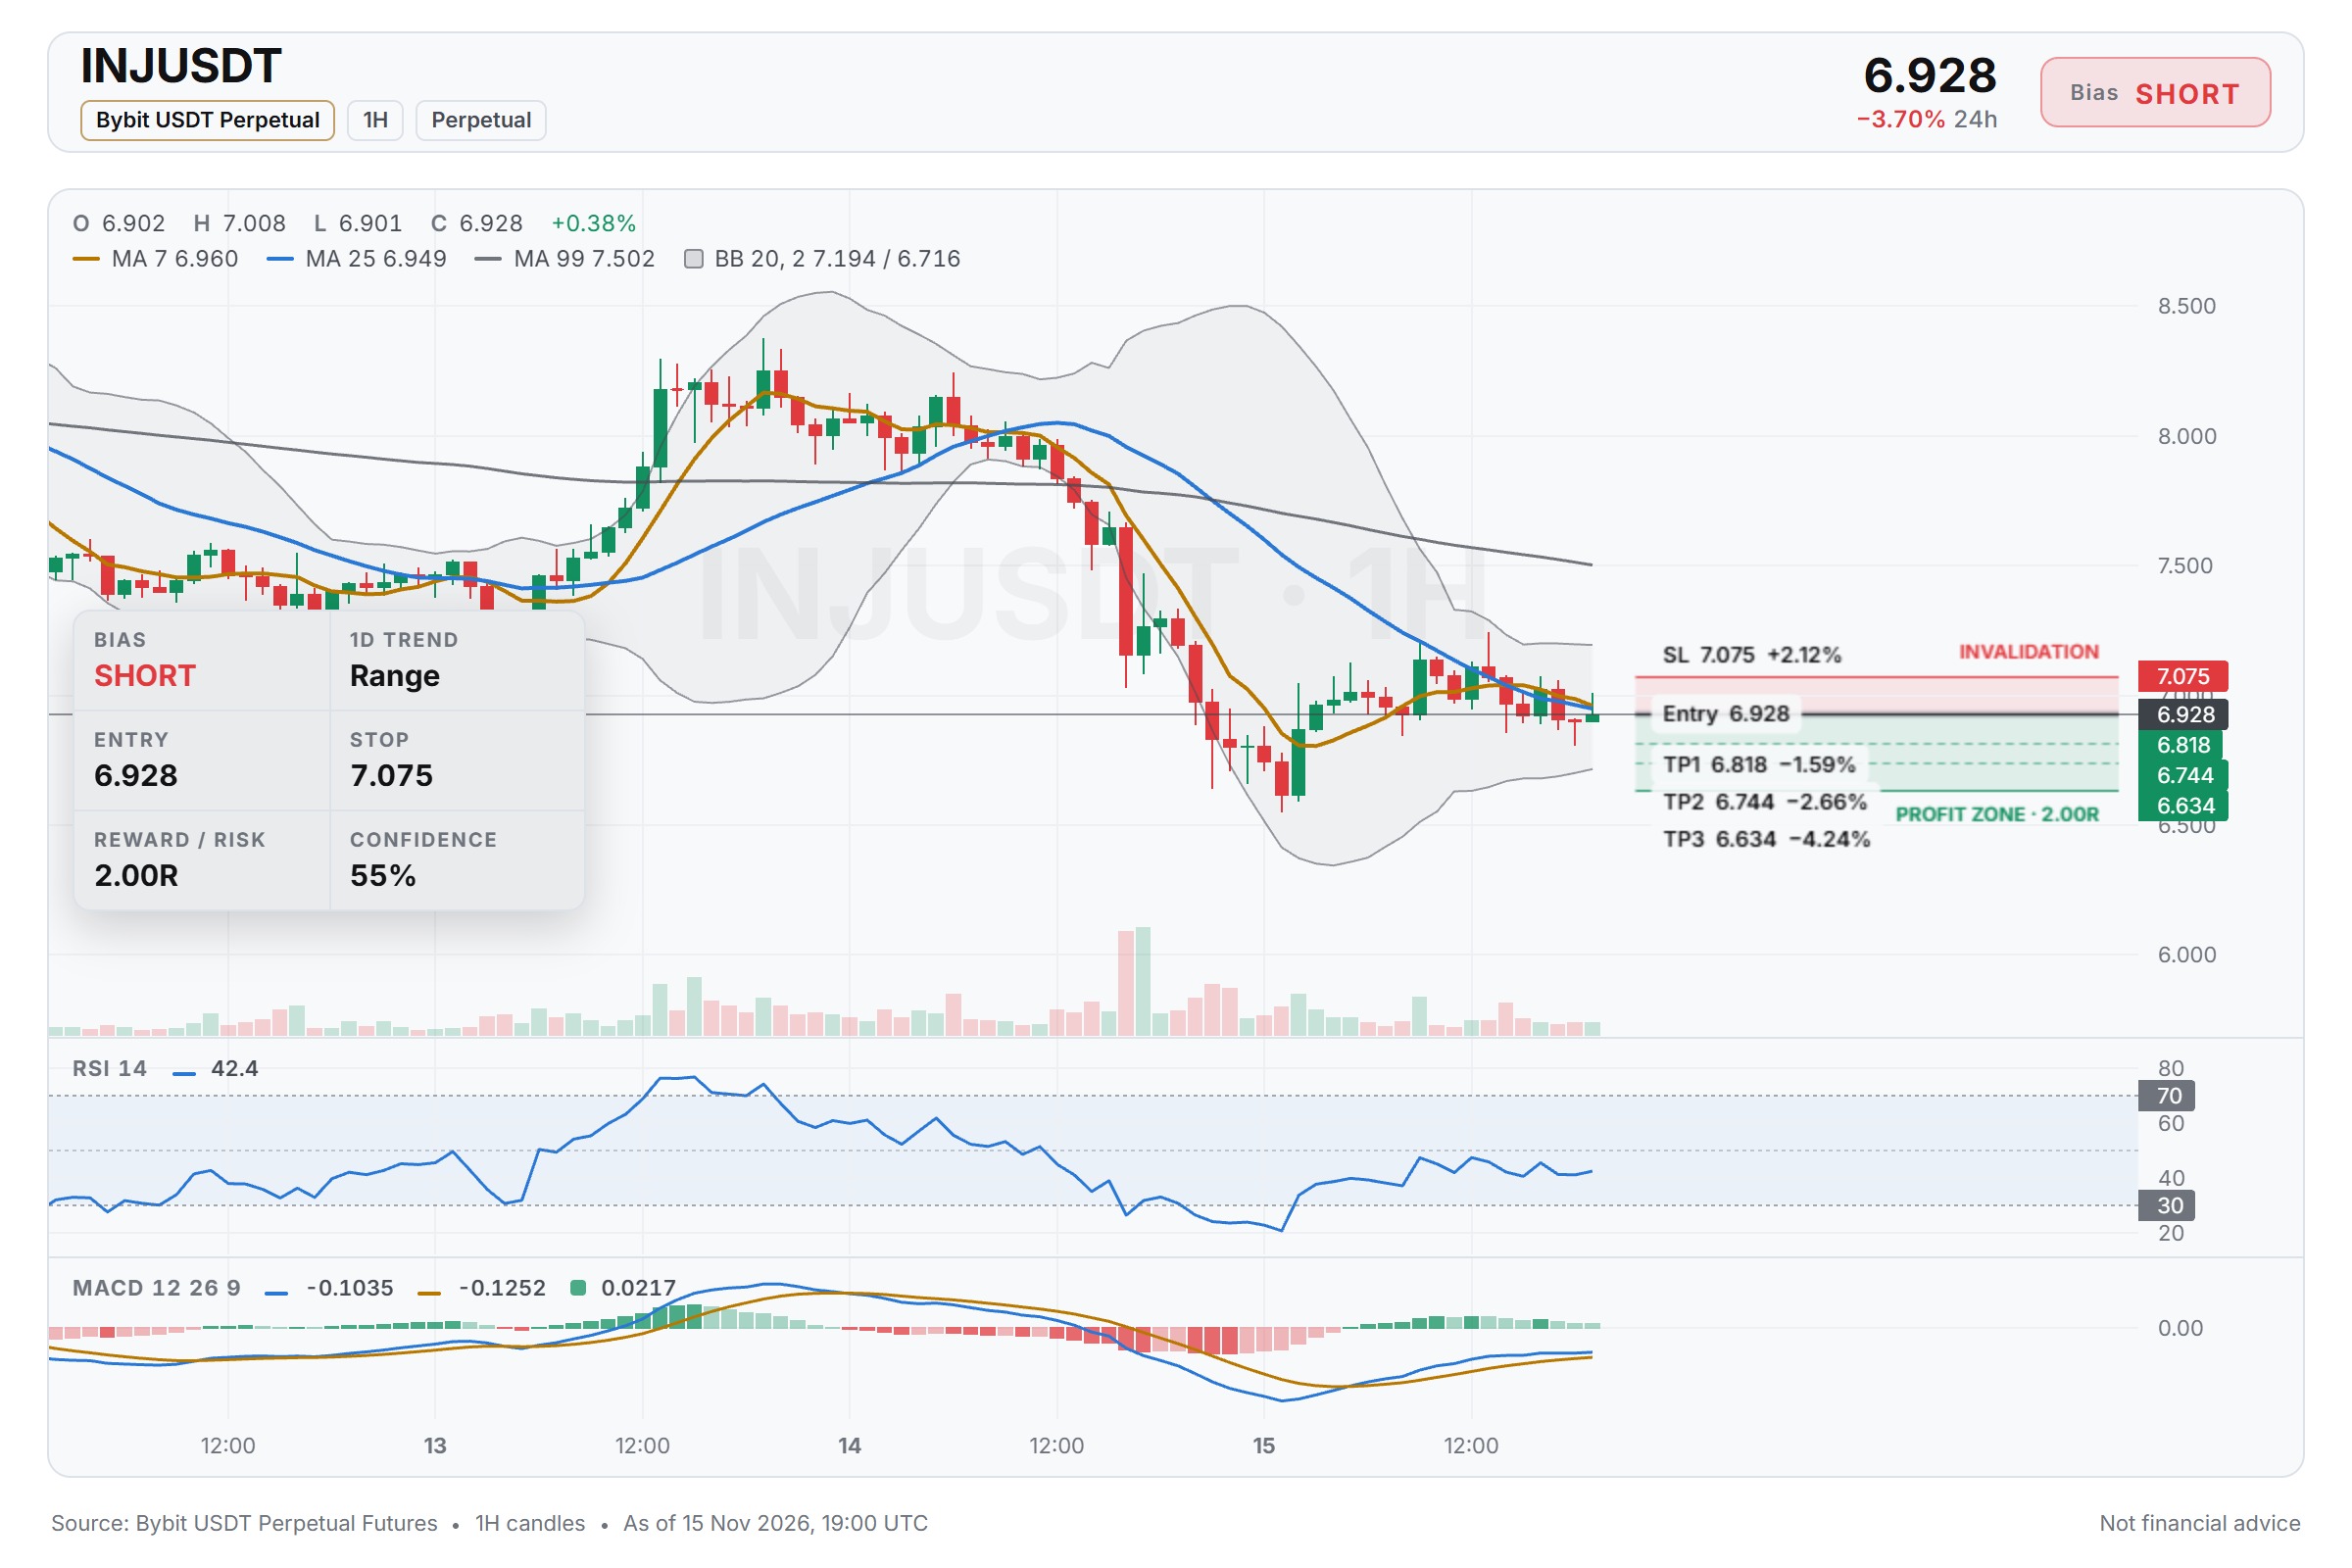
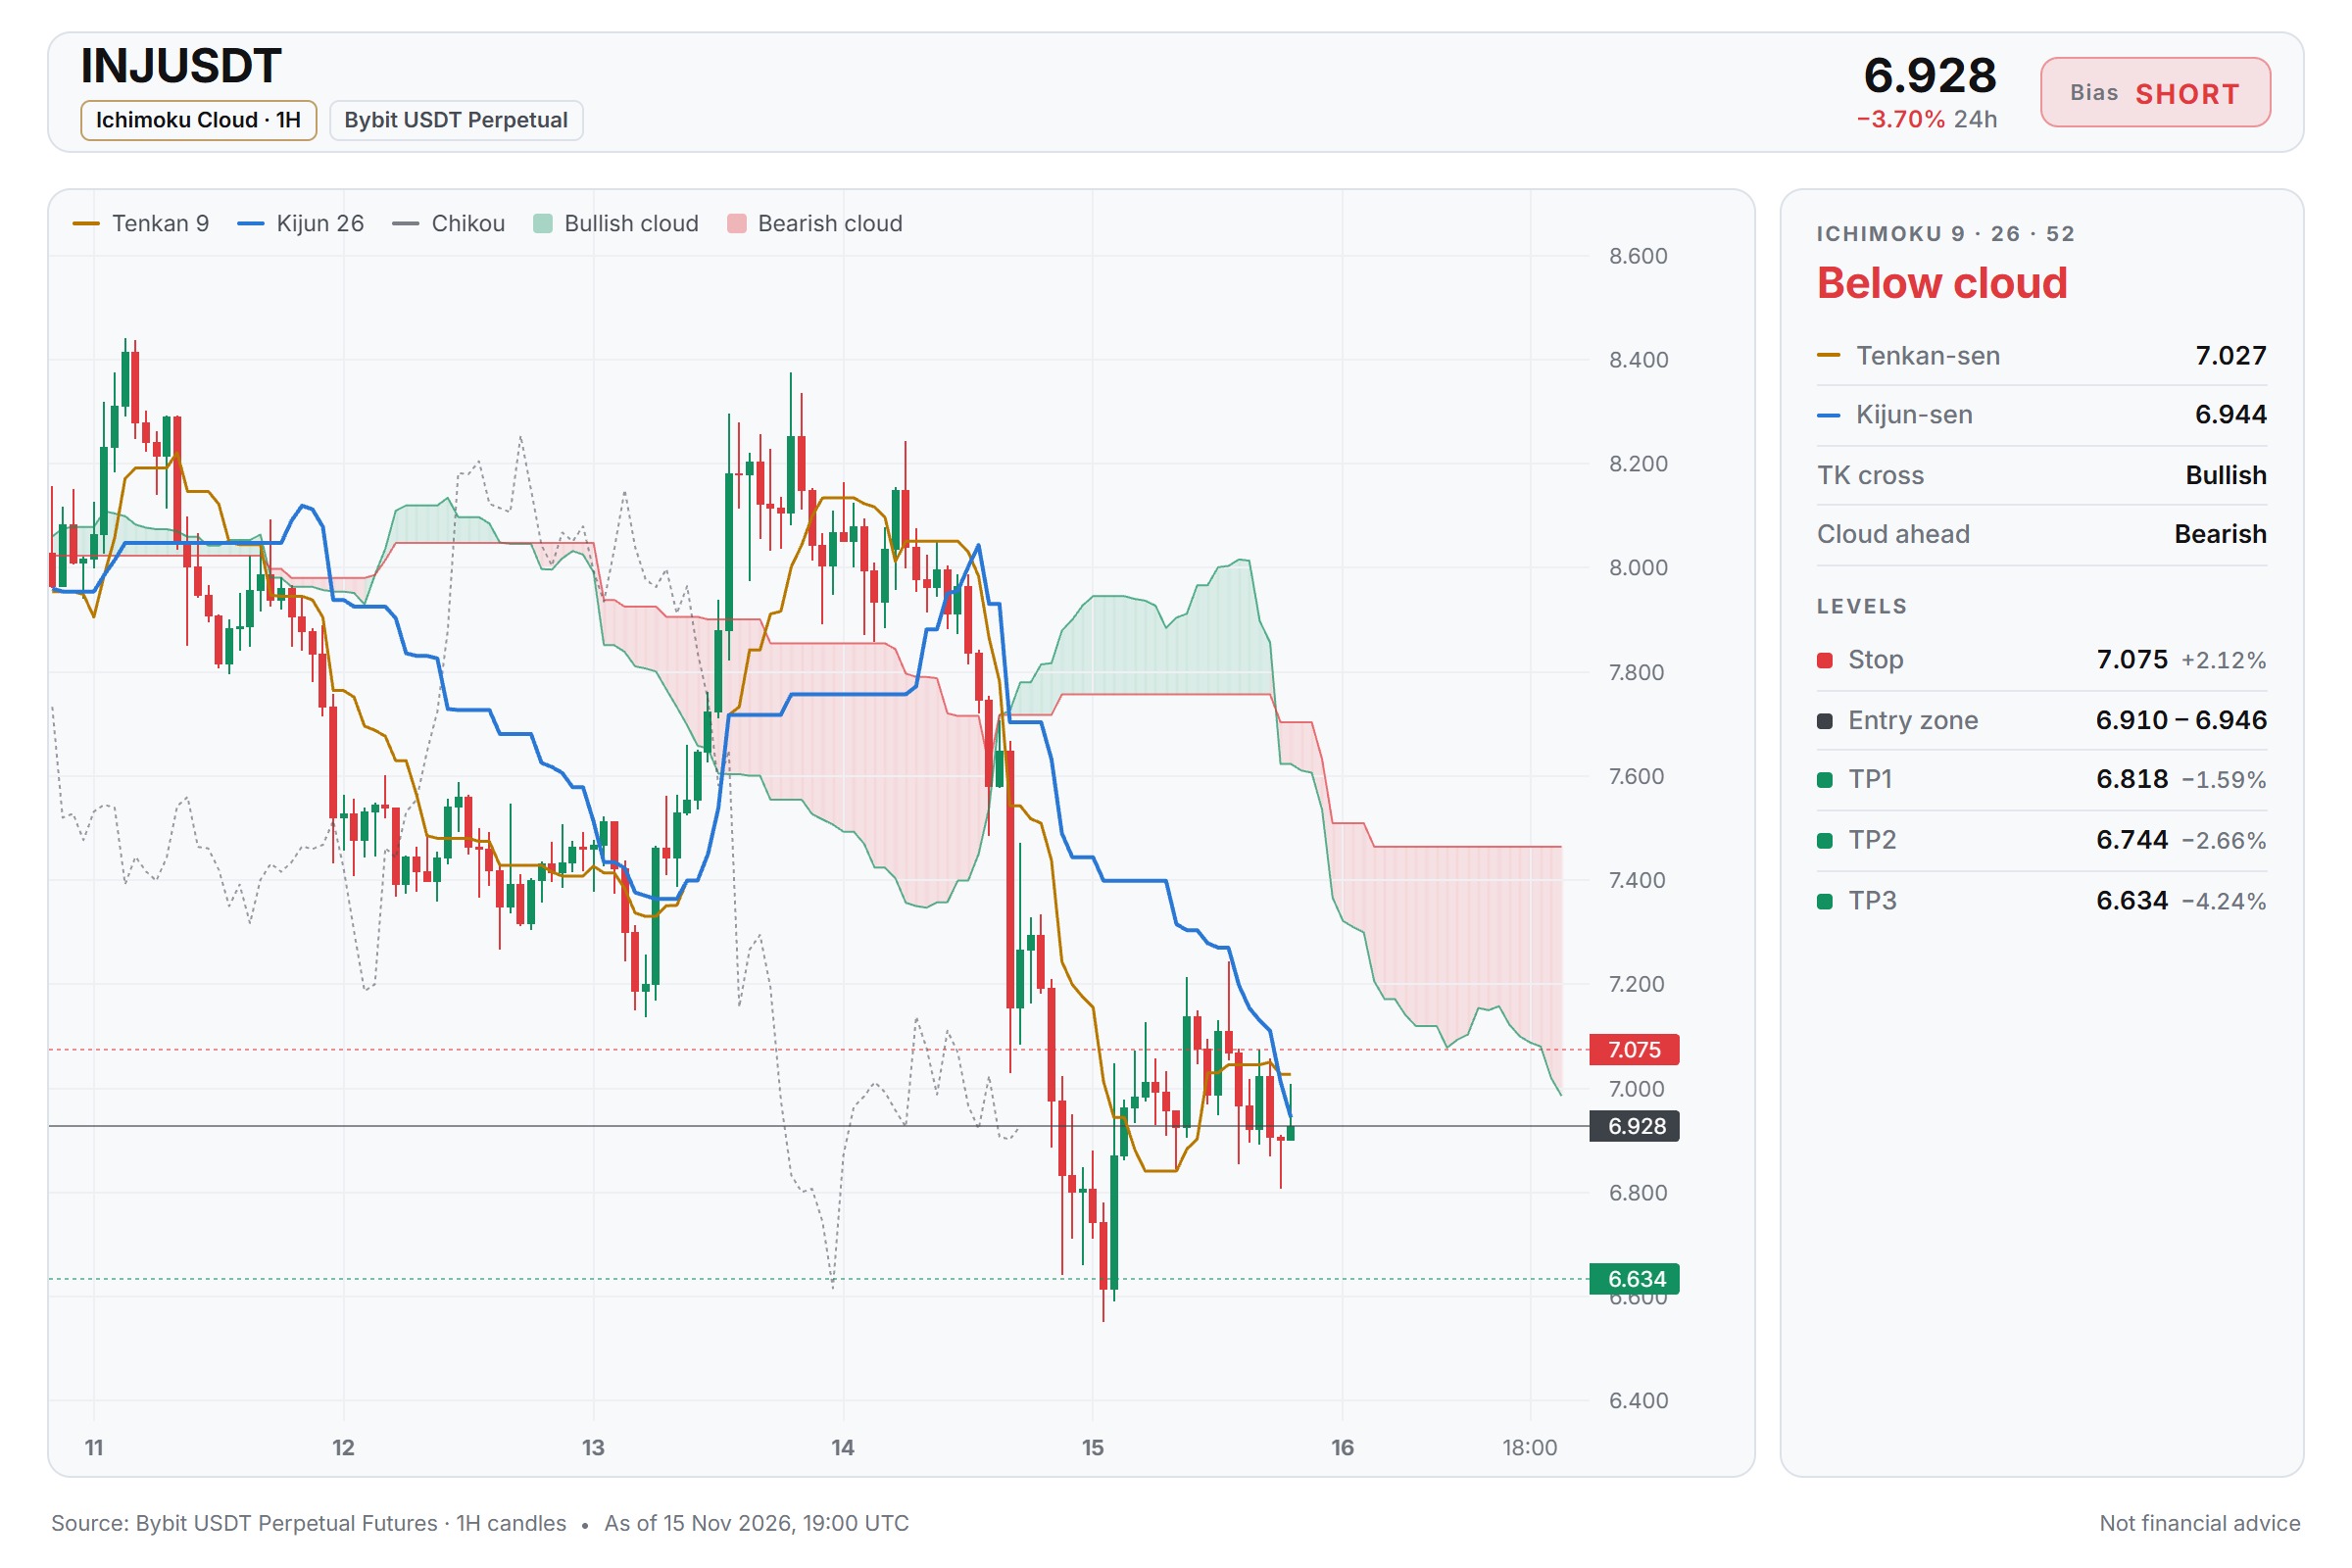
$INJ/USDT — SHORT Entry: 6.910 - 6.946 SL: 7.075 TP1: 6.818 TP2: 6.744 TP3: 6.634 From my view, the 15m RSI around 47 shows fading momentum while the short setup forms. With BTC trend neutral, a failure at 6.946 could open a path toward the TP2 and TP3 zones. I watch the SL at 7.075 as the key invalidation level. Do you think INJ will break the entry range before BTC gives a clearer direction? ⚠️ Personal market analysis only. NFA — manage risk and DYOR. Educational content, not investment advice or a recommendation to buy, sell, deposit, or withdraw any asset. No paid promotion or referral/affiliate links.$INJUSDT#WSOT2026 #WSOTShowYourAITradeToEarn10USDT

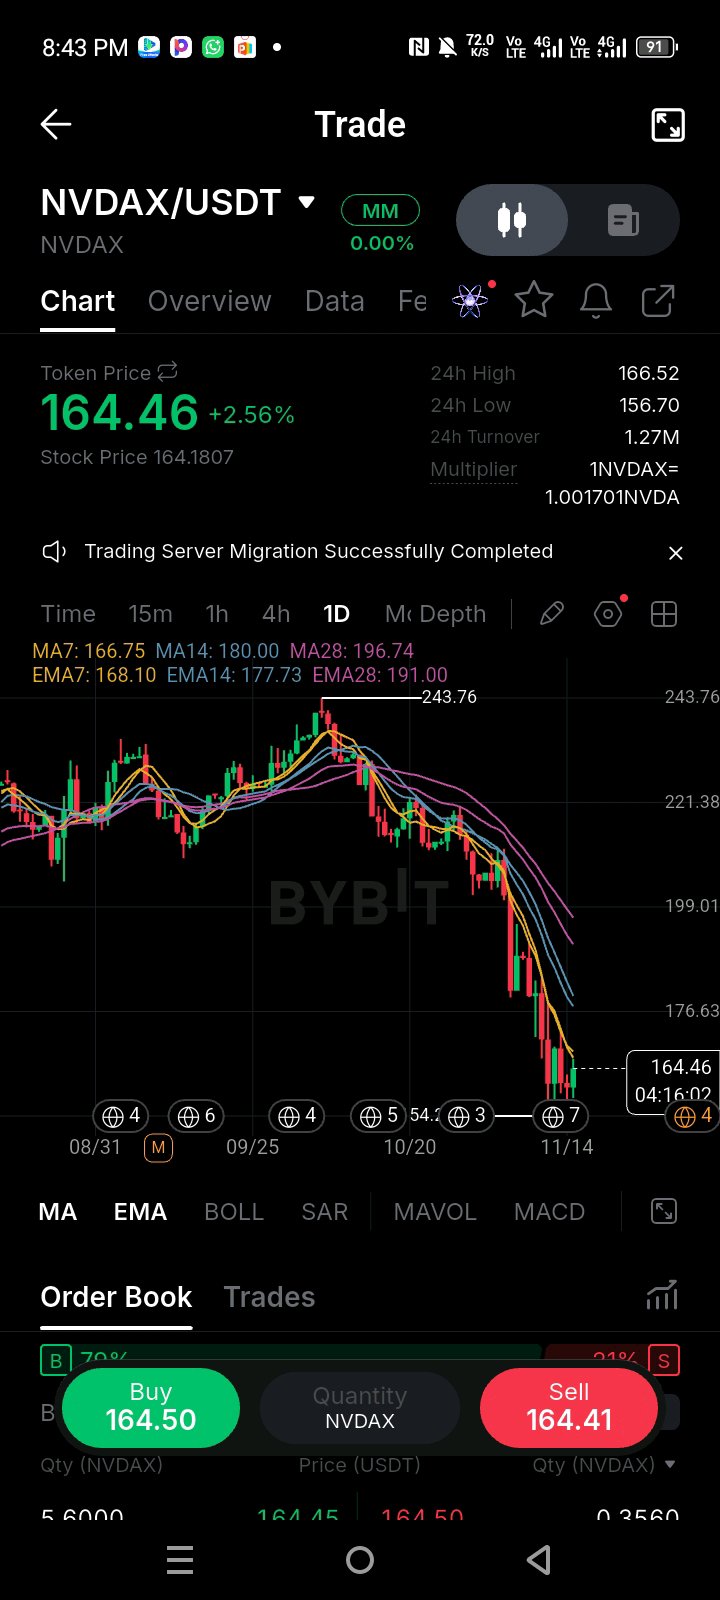
$NVDAXUSDT is trying to find a base after that brutal drop from 243, but the daily chart is flashing a warning sign. What caught my attention is the current price action: we are bouncing to 164.46, but we are running straight into the 7 EMA at 166.75. Look at the order book—there’s 70% buy pressure, yet the price is stalling. That’s a classic sign of absorption. My read here is that this is a weak relief bounce inside a heavy downtrend. The price is completely trapped below the 14 and 28 EMAs, which are sloping down hard. The 70% buy wall might look bullish on paper, but if it can't push price through the 7 EMA, the sellers will eventually eat through it. Key Levels: Resistance: 166.75 (7 EMA), 177.73 (14 EMA) Support: 156.70 (recent daily low) My Trade Plan: Bias: SHORT (Conditional) Entry: $165.00 – $168.00 (Fading the bounce right into the 7 EMA) Confirmation: I want to see a rejection wick or a bearish engulfing candle on the 4H chart right at this 166 level. If buyers step in and close a daily candle above 170 with volume, I step aside. Invalidation: $177.50 (A clean daily break above the 14 EMA kills the immediate bearish momentum). TP1: $156.70 (Retest of the recent low) TP2: $145.00 (Next major liquidity void) R:R: ~1:2.4 based on the stated levels. Why I'm taking this setup: Bounces into the first moving average after a steep drop are often the safest short entries. The buy pressure is trapped, and the trend is still firmly down. Selling this resistance gives us a tight stop and a clear path back to the lows. What would change my mind? If price reclaims 170 and flips the 7 EMA into support, the short thesis is dead. I’d wait for a higher low to form and look for a reversal trade. Until then, the bounce is just a setup for the next leg down. Are you fading this bounce at the 7 EMA, or waiting to see if 156 holds for a spot entry? #ByXIMPACT #WSOT2026 $BTCUSDT

ETH ??!!
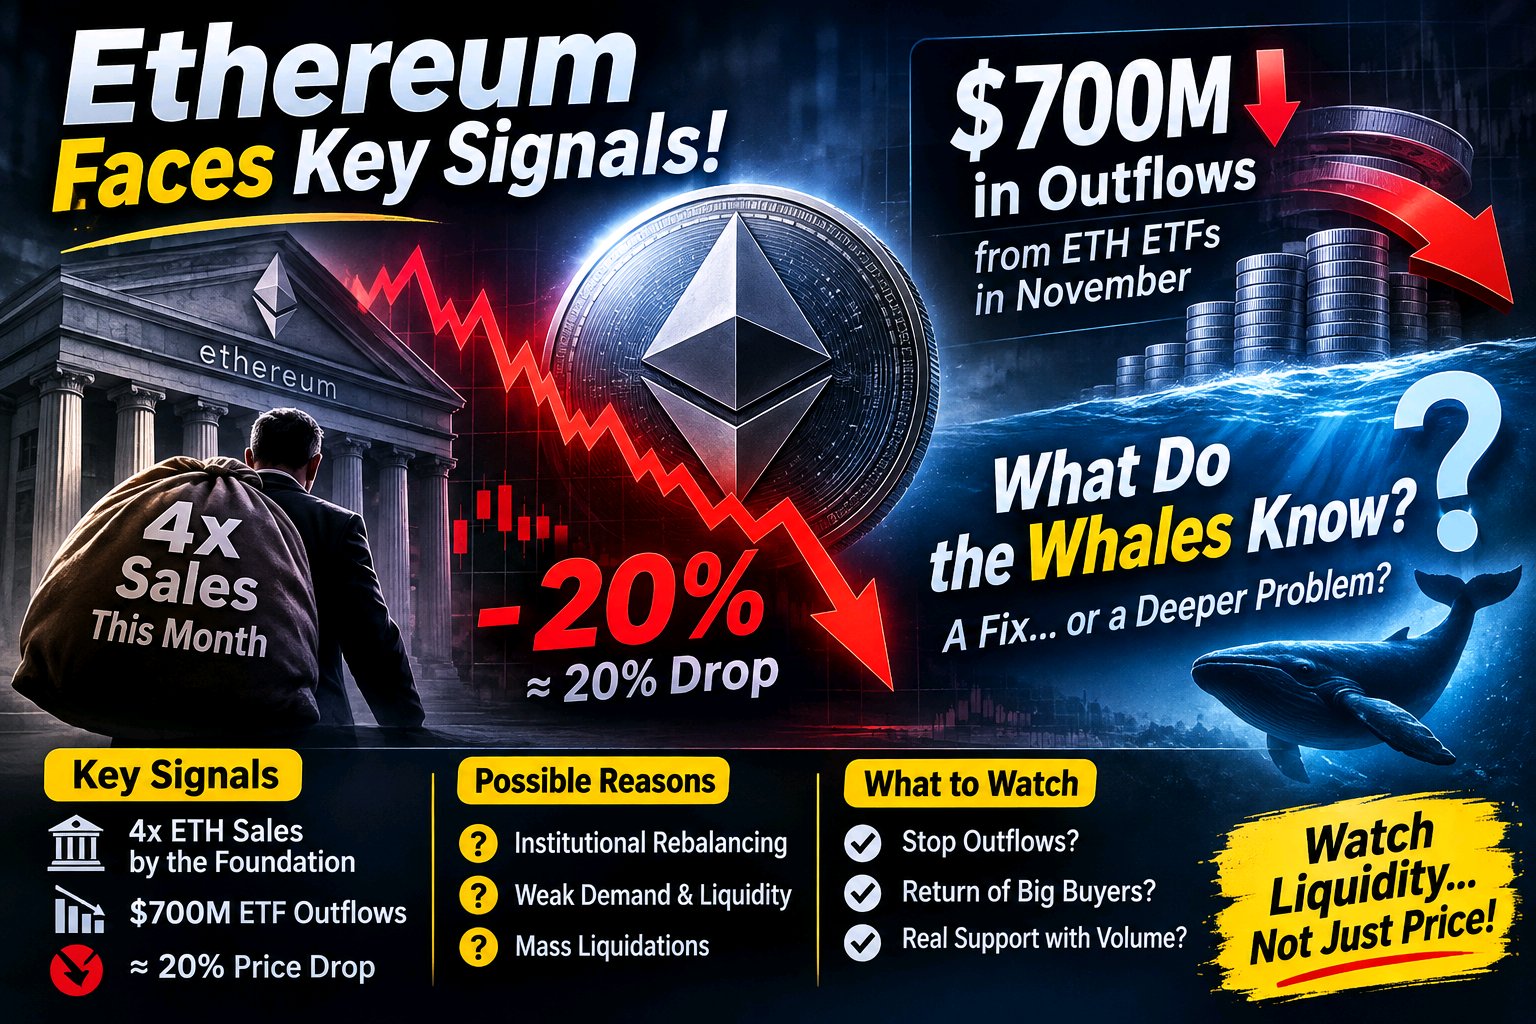
$ETHUSDT Things worth paying attention to in Ethereum! There are indicators that cannot be ignored: • Four rounds of selling from a wallet linked to the Ethereum Foundation. • Nearly $696 million in net outflows from ETH ETFs during November. • A drop of almost 20% during the recent pullback wave. The question here is: Are we facing a harsh correction and over-leveraged position liquidations, or are institutions re-evaluating the future of Ethereum? I don't have proof of any flaws or insider information held by big whales, but the coincidence of these indicators is worth monitoring. The market doesn't tell us everything, but money flows often reveal a lot. Watch the liquidity before chasing the price. #WSOT2026 #WSOTShowYourAITradeToEarn10USDT #USInflationRunsHotAndRateHikeBetsRise

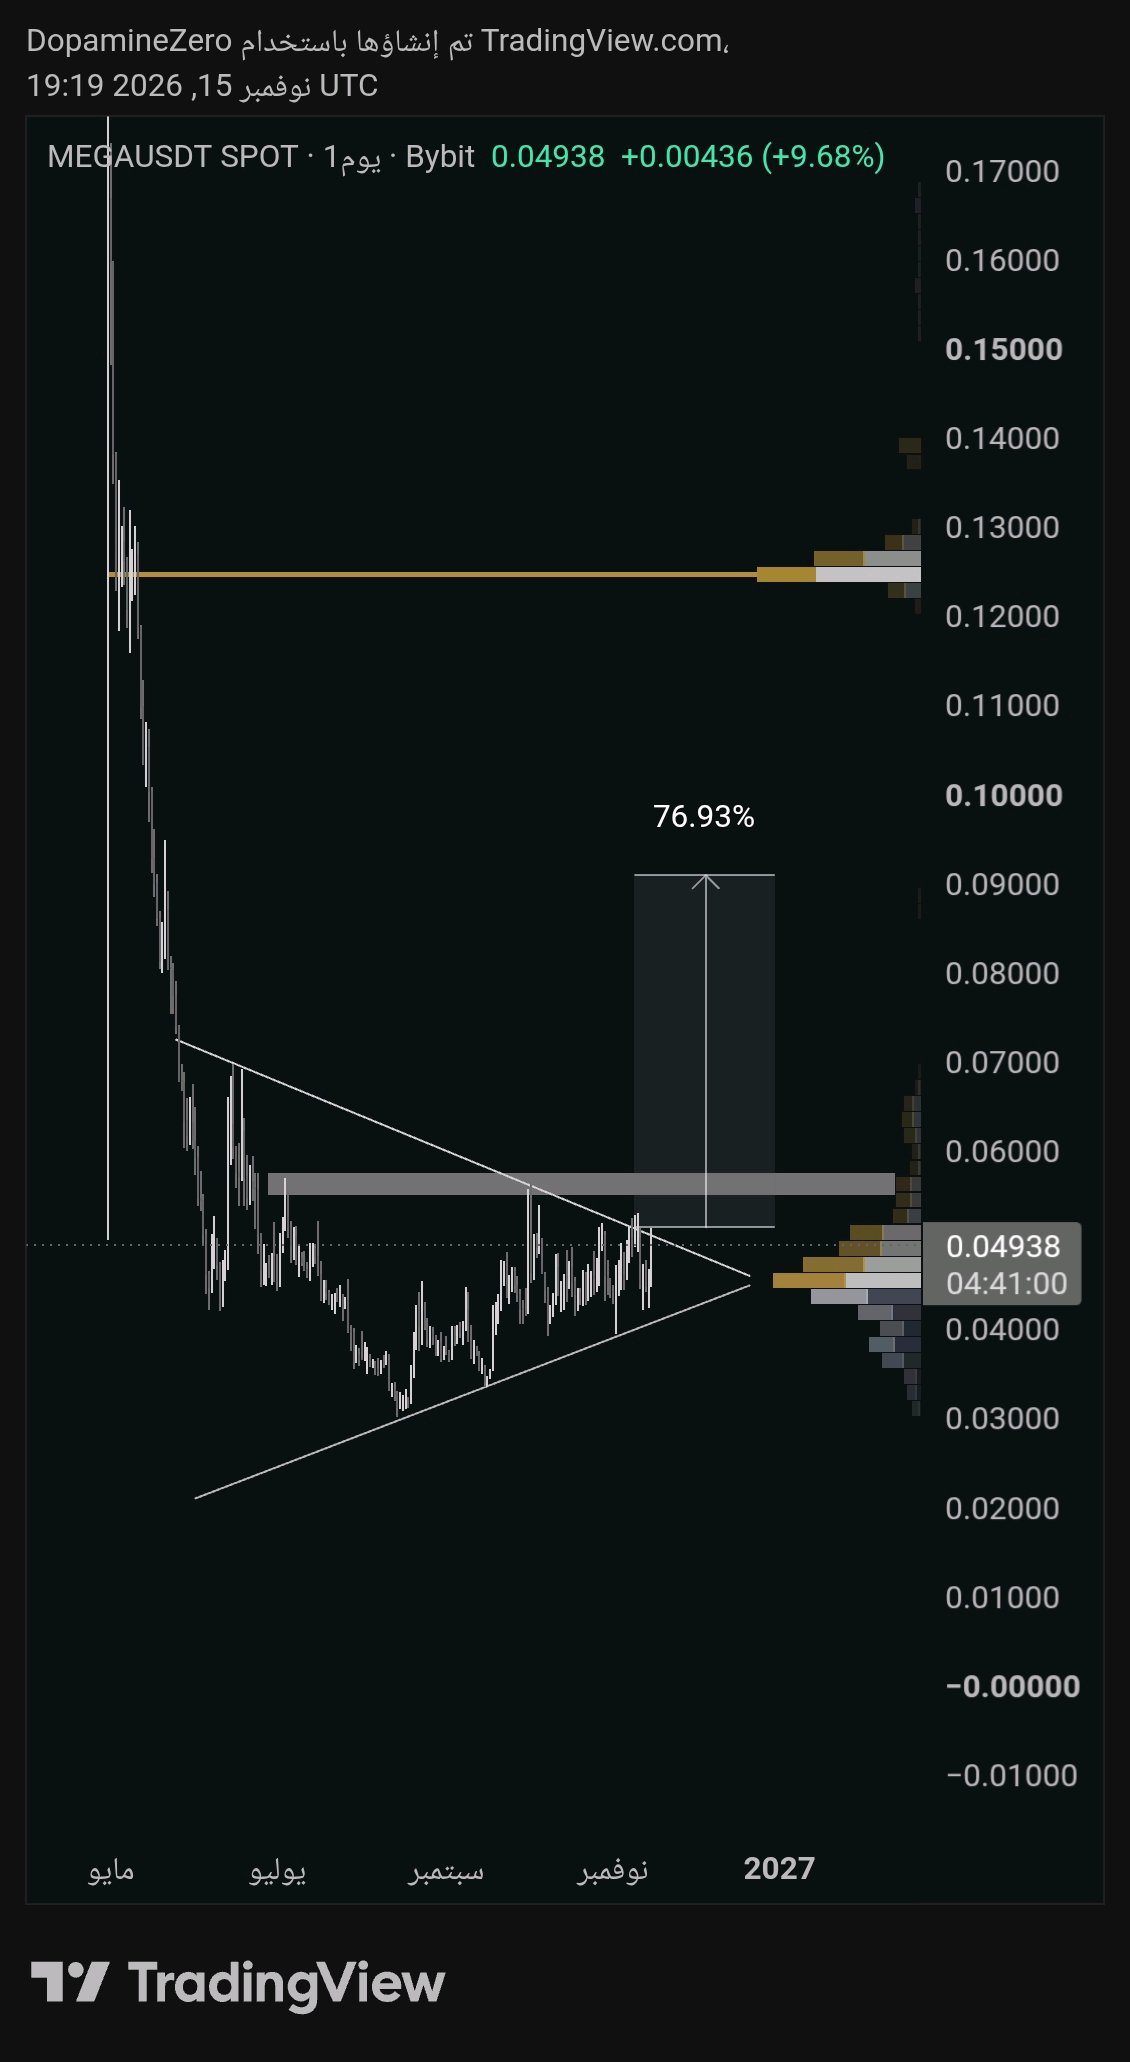
For this setup to be valid, we need a breakout above 0.053 backed by strong volume. No entry until confirmation. $MEGAUSDT #WSOT2026 #JensenHuangExitTestsNvidiasAILeadership

Market Update
Market Update $ONDOUSDT is trading near $0.304, facing bearish pressure. RSI around 30 indicates weak momentum, while MACD remains bearish. Support stands at $0.290 and $0.275. Resistance is near $0.320 and $0.335. Watch for a confirmed recovery before DCA accumulation. Manage your risk. #WSOT2026 #WSOTShowYourAITradeToEarn10USDT #JensenHuangExitTestsNvidiasAILeadership #USPPITestsTheHigherForLongerTrade #USInflationRunsHotAndRateHikeBetsRise

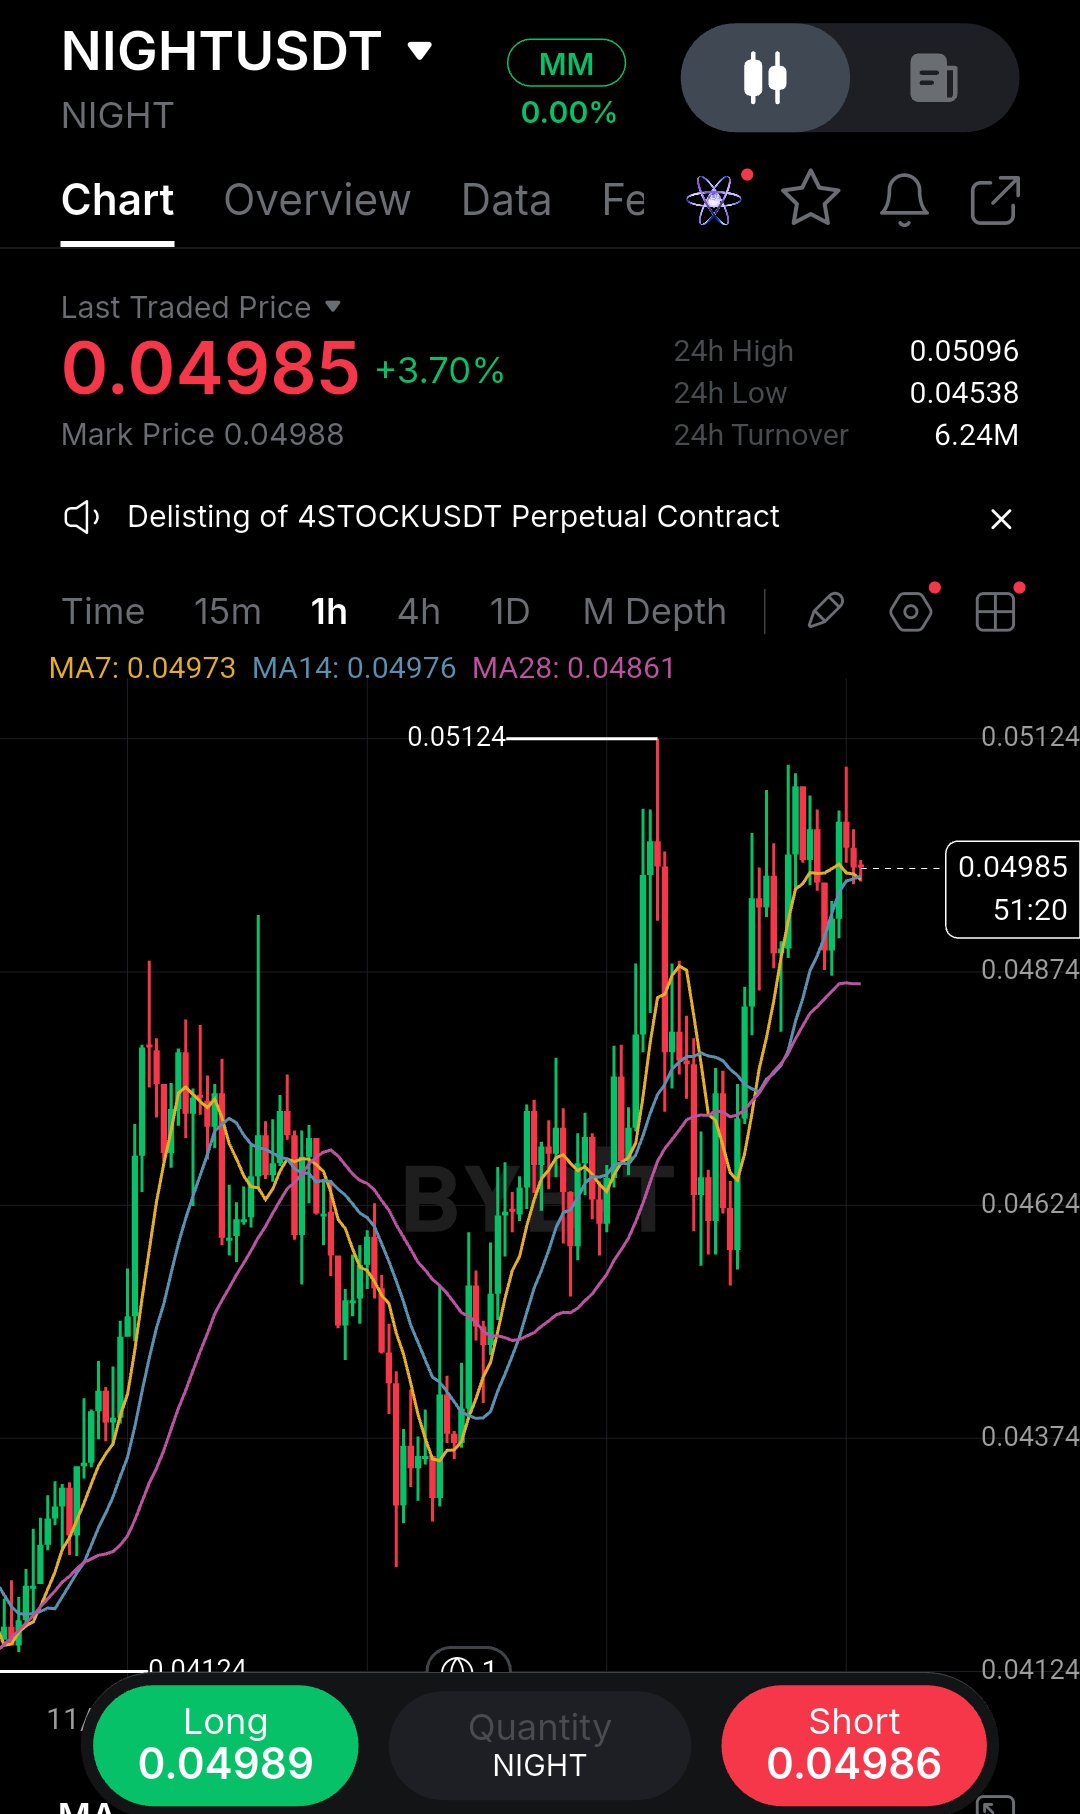
I’ve learned the hard way that buying right into a resistance cluster usually ends with me staring at a red candle, so this NIGHT 1h chart has my full attention. Price is pushing 0.04985, but it’s running directly into the 0.05124 swing high while the 7 and 14 MAs are flattening out. The real story is the 28 MA way down at 0.04861.Momentum is slowing, and buyers are losing their early drive. I’m not chasing this vertical move. Let me break down exactly what I see. The recovery from the 0.04124 low was aggressive and clean, but the rally is now stalling just beneath the previous swing high at 0.05124. That’s not a coincidence. That level was a rejection point before, and it’s likely to act as supply again. Meanwhile, the 7 MA at 0.04973 and the 14 MA at 0.04976 are curling over, which tells me short-term momentum has peaked. The 28 MA at 0.04861 is the true trend anchor, and it’s still rising, so the broader uptrend isn’t broken .it’s just overheated. This is a classic pullback setup waiting to happen, not a breakout entry. What supports the bullish case? The higher low structure is intact, the 28 MA is sloping upward, and the 24h low at 0.04538 shows buyers defended the dip aggressively. If price pulls back to the 28 MA and holds, that would be a textbook continuation setup with the trend. What supports the bearish case? The 0.05124 level is a clear rejection point, the short-term MAs are flattening, and the current candle is showing exhaustion near resistance. If buyers fail here, price could roll over and test the 28 MA as support or break through it entirely. My read is that the highest-probability trade is a long on the pullback, not a chase at current price. I’d rather wait for price to come to me, into the 0.04870–0.04900 zone where the 28 MA offers actual structural support. If we get a clear bullish rejection candle there, I’ll take the long. Entry: 0.04880 (on confirmation candle) SL: 0.04820 (below the 28 MA) TP1: 0.05050 TP2: 0.05120 Invalidation: A strong close below 0.04820 means the trend is broken and I step aside. I used to enter on the first green candle after a drop, and it taught me to let price prove itself. If it pumps without me, I accept it. Where are you watching for the retest? #ByXIMPACT #WSOT2026 $NIGHTUSDT $SPCXXUSDT

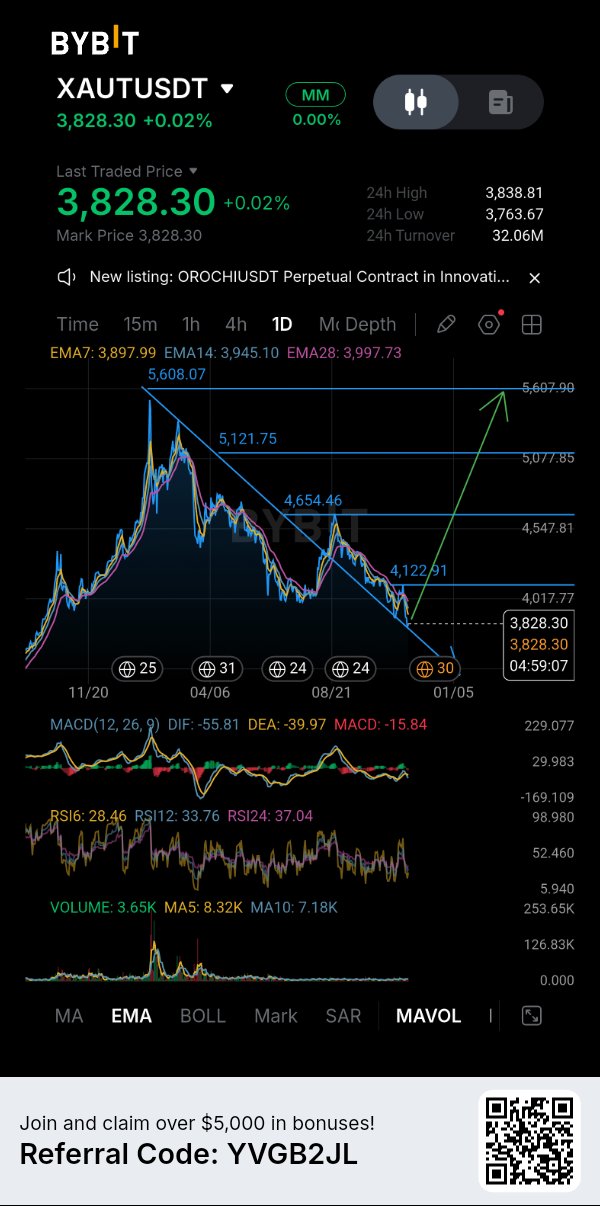
XAUT /GOLD 👉 BUY THE DIP 🚀
$XAUT UPDATE : GOLD IS LOSING MOMENTUM, BUT A RECOVERY COULD STILL BE ON THE TABLE. $XAUTUSDT is currently trading around $3,828, and the daily chart is showing some clear signs of weakness. The broader structure has been moving downward, with a sequence of lower highs and lower lows developing from the previous peak near $5,608. However, I don't think this is the right moment to completely dismiss a potential recovery. The price is aproaching an important short-term area, and I want to see how buyers react before making any strong directional assumption. Daily Market Structure📊 Most noticeable issue is that XAUT remains below all three visible EMAs. EMA7 is at $3,897.99, EMA14 at $3,945.10, and EMA28 at $3,997.73. This alignment tells me sellers still have the advantage, at least on the daily timeframe. descending trendline also remains an important obstacle. Until price breaks above it and establishes a stronger structure, I wouldn't consider the recovery confirmed. Momentum & Volume: RSI readings are worth watching. RSI6 is at 28.46, RSI12 at 33.76, and RSI24 at 37.04. short-term RSI is already in oversold territory, which could create room for a relief bounce. But oversold conditions alone don't guarantee a reversal. MACD is also still negative, with DIF at -55.81 and DEA at -39.97. The histogram remains below zero, suggesting bearish momentum hasn't fully disappeared. Volume is currently 3.65K, below both MA5 at 8.32K and MA10 at 7.18K. I would like to see stronger buying participation before trusting a sustained recovery. Bullish Scenario🟢 The first thing I want to see is buyers defending the recent low around $3,763.67. If that area holds and price starts reclaiming the EMA7 near $3,898, the next important recovery levels are $3,945 and $3,998. A stronger move above the EMA cluster, followed by a break of the descending trendline, would improve the daily outlook. Beyond that, $4,122.91 becomes an important higher resistance reference. Bearish Scenario🔴 If buyers fail to defend $3,763.67, another downward move becomes possible. In that situation, I wouldn't rush into buying simply because RSI is oversold. I'd rather wait for price to stabilize and show an actual change in momentum. For Traders Already Holding XAUT🎯 I'd personally pay close attention to the $3,898–$3,998 recovery zone. If price reaches this area, partial profit-taking could be worth considering depending on the entry and position size. I wouldn't assume the larger recovery projection toward $5,608 is guaranteed. That remains a possibility illustrated on the chart, not a confirmed target. Risk Management⚠️ recent low at $3,763.67 is the immediate level I'm watching. A breakdown below it would weaken the short-term recovery thesis. A bounce without confirmation is not a reliable entry. Entry, stop-loss, and risk-to-reward should be established before entering, with position sizing reflecting the risk involved. My overall view: XAUT is showing weakness, but oversold momentum could create an opportunity if buyers finaly step in. I'm more interested in confirmation than trying to catch the exact bottom. Would you consider buying a recovery above $3,898, or would you rather wait for a confirmed break of the descending trendline? #ByXIMPACT #WSOT2026 #WSOTShowYourAITradeToEarn10USDT #JensenHuangExitTestsNvidiasAILeadership #USPPITestsTheHigherForLongerTrade


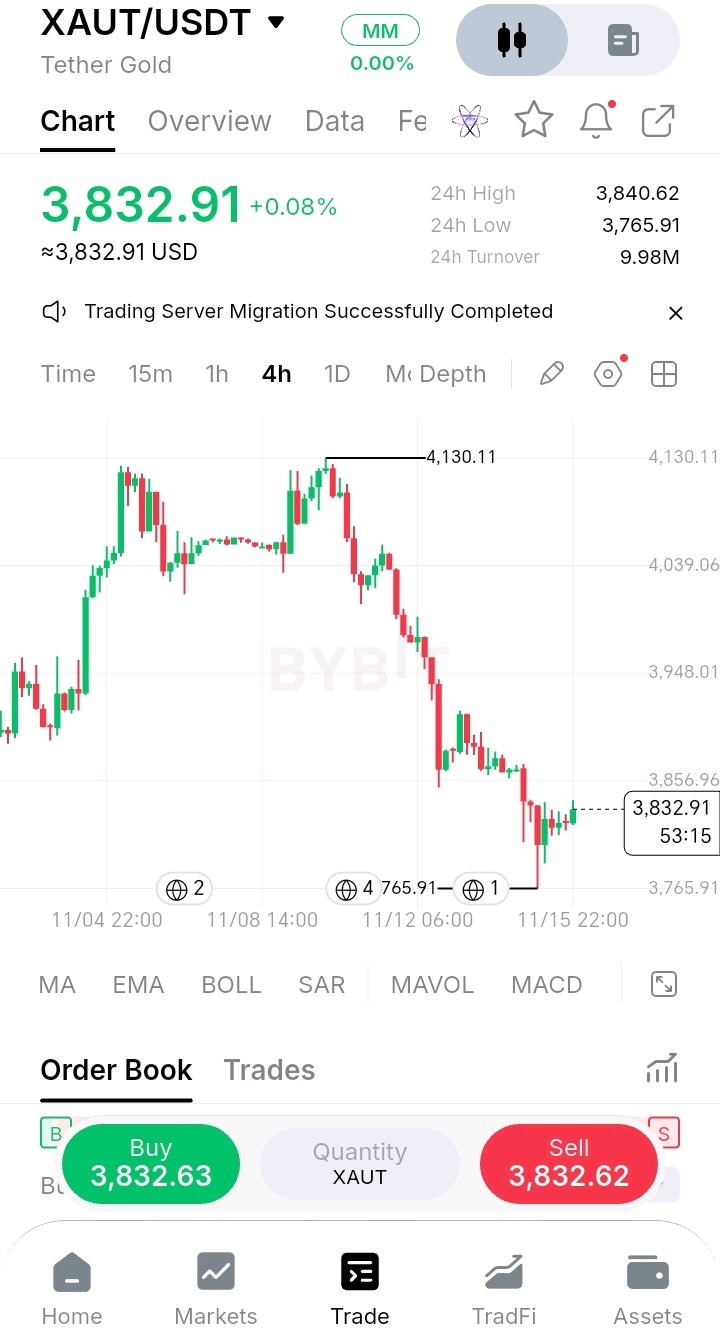
🏔️ The double top worked, and then it kept going. I don't want to call a bottom on $XAUT just because the first bounce looks tidy. I want to see a 4H close above 3,872.51, because that's the old base that is now acting as resistance. Here's what the 4H chart shows: 🔹 The double top: Gold peaked near 4,125, dipped to about 4,005, then came back and topped again at 4,130.11. Two highs at the same level with a dip between them is a classic double top. 🔹 The break: When price fell under the 4,005 neckline, the pattern was confirmed. The usual measured target from a pattern this size is roughly 3,880. 🔹 The overshoot: Gold went well past that, to a low of 3,765.91, about 8.8% under the 4,130 high. The move ran further than the textbook target. 🔹 The bounce: From the low, price has recovered about 1.8% to 3,832.91. The first bounce reached the 3,910 area, then 3,870, and the latest ones are smaller and tighter. 🔹 The old base: The 3,872.51 level from earlier is now above price. Broken support often turns into resistance on the first retest. 🔹 The range: 24H high 3,840.62 and low 3,765.91, with turnover at 9.98M. The market has calmed compared to the sell-off. 🟢 Bullish: a 4H close above 3,872.51, then 3,948. That would show buyers reclaiming the area the breakdown started from. 🔴 Bearish: a 4H close under 3,765.91, with no marked support below it on this chart. Patterns give targets, not guarantees. Once price overshoots one, the next level to read is the one it just lost. Are you watching $XAUT or another coin? #XAUT #Gold #Crypto #BinanceSquare #WSOT2026 #WSOTShowYourAITradeToEarn10USDT #JensenHuangExitTestsNvidiasAILeadership #USPPITestsTheHigherForLongerTrade #USInflationRunsHotAndRateHikeBetsRise $XAUTUSDT $BTCUSDT

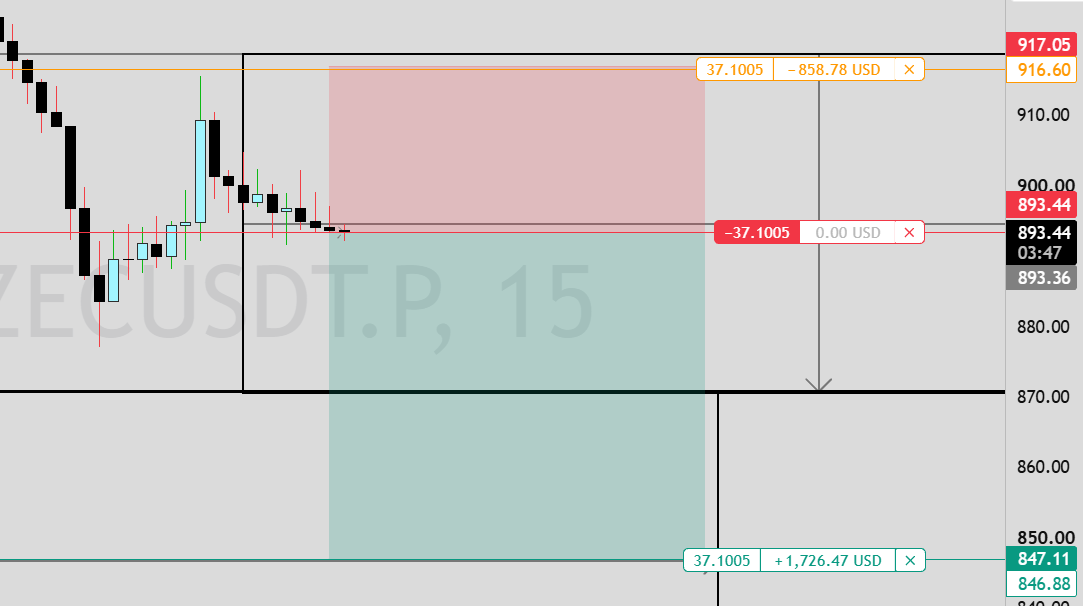
ZEC Short setup. 15m chart. 📉
Price is showing rejection after a pullback. I'm expecting a move down toward the target. Entry: 893.44 SL: 916.60 TP: 847.11 Trade is active now. Are you taking this short? $zec $BTCUSDT$VELOUSDT#WSOT2026 #WSOTShowYourAITradeToEarn10USDT #JensenHuangExitTestsNvidiasAILeadership #USPPITestsTheHigherForLongerTrade #USInflationRunsHotAndRateHikeBetsRise

NVIDIA (NVDA‑USDT): Bears Remain in Control as Price Faces Downside Pressure NVIDIA is showing continued weakness on the 4H timeframe, with price currently trading around $179.0, down approximately 2.9%. Technical Market Overview 🔹 Bearish Structure: Price continues to form lower highs and lower lows. 🔹 EMA Alignment: EMA 5 ($183.11), EMA 10 ($184.64), and EMA 20 ($187.76) are all above the current price; this confirms a bearish downward trend so far. 🔹 Super Trend: The Super trend indicator crossing below at $179.26, reinforcing bearish outlook at present. Key Price Levels ‑ Immediate res: $183‑$185 ‑ Stronger res: $187‑$188 ‑ Major support: $169 ‑ Current price zone: $178‑$180 What to Watch Next: If sellers maintain pressure and price breaks below the $169 support zone, further downside toward $153 could become possible. However, a recovery above $183, followed by a sustained move above $185, could signal improvement by bullish momentum. My Market Outlook: The 4H condition remains bearish, and buyers have no immediate signs to consider a reversal. Patience is essential — wait for confirmation before considering any entry. Always manage risk and avoid chasing the market. What is your expectation for NVDA? Will bears push price toward $148.80 or will buyers defend the current support zone? #NVDA #NVDA‑USDT #Technical‑Analysis #CryptoTrading $NVDAXUSDT #ByXIMPACT #WSOT2026 #WSOTShowYourAITradeToEarn10USDT
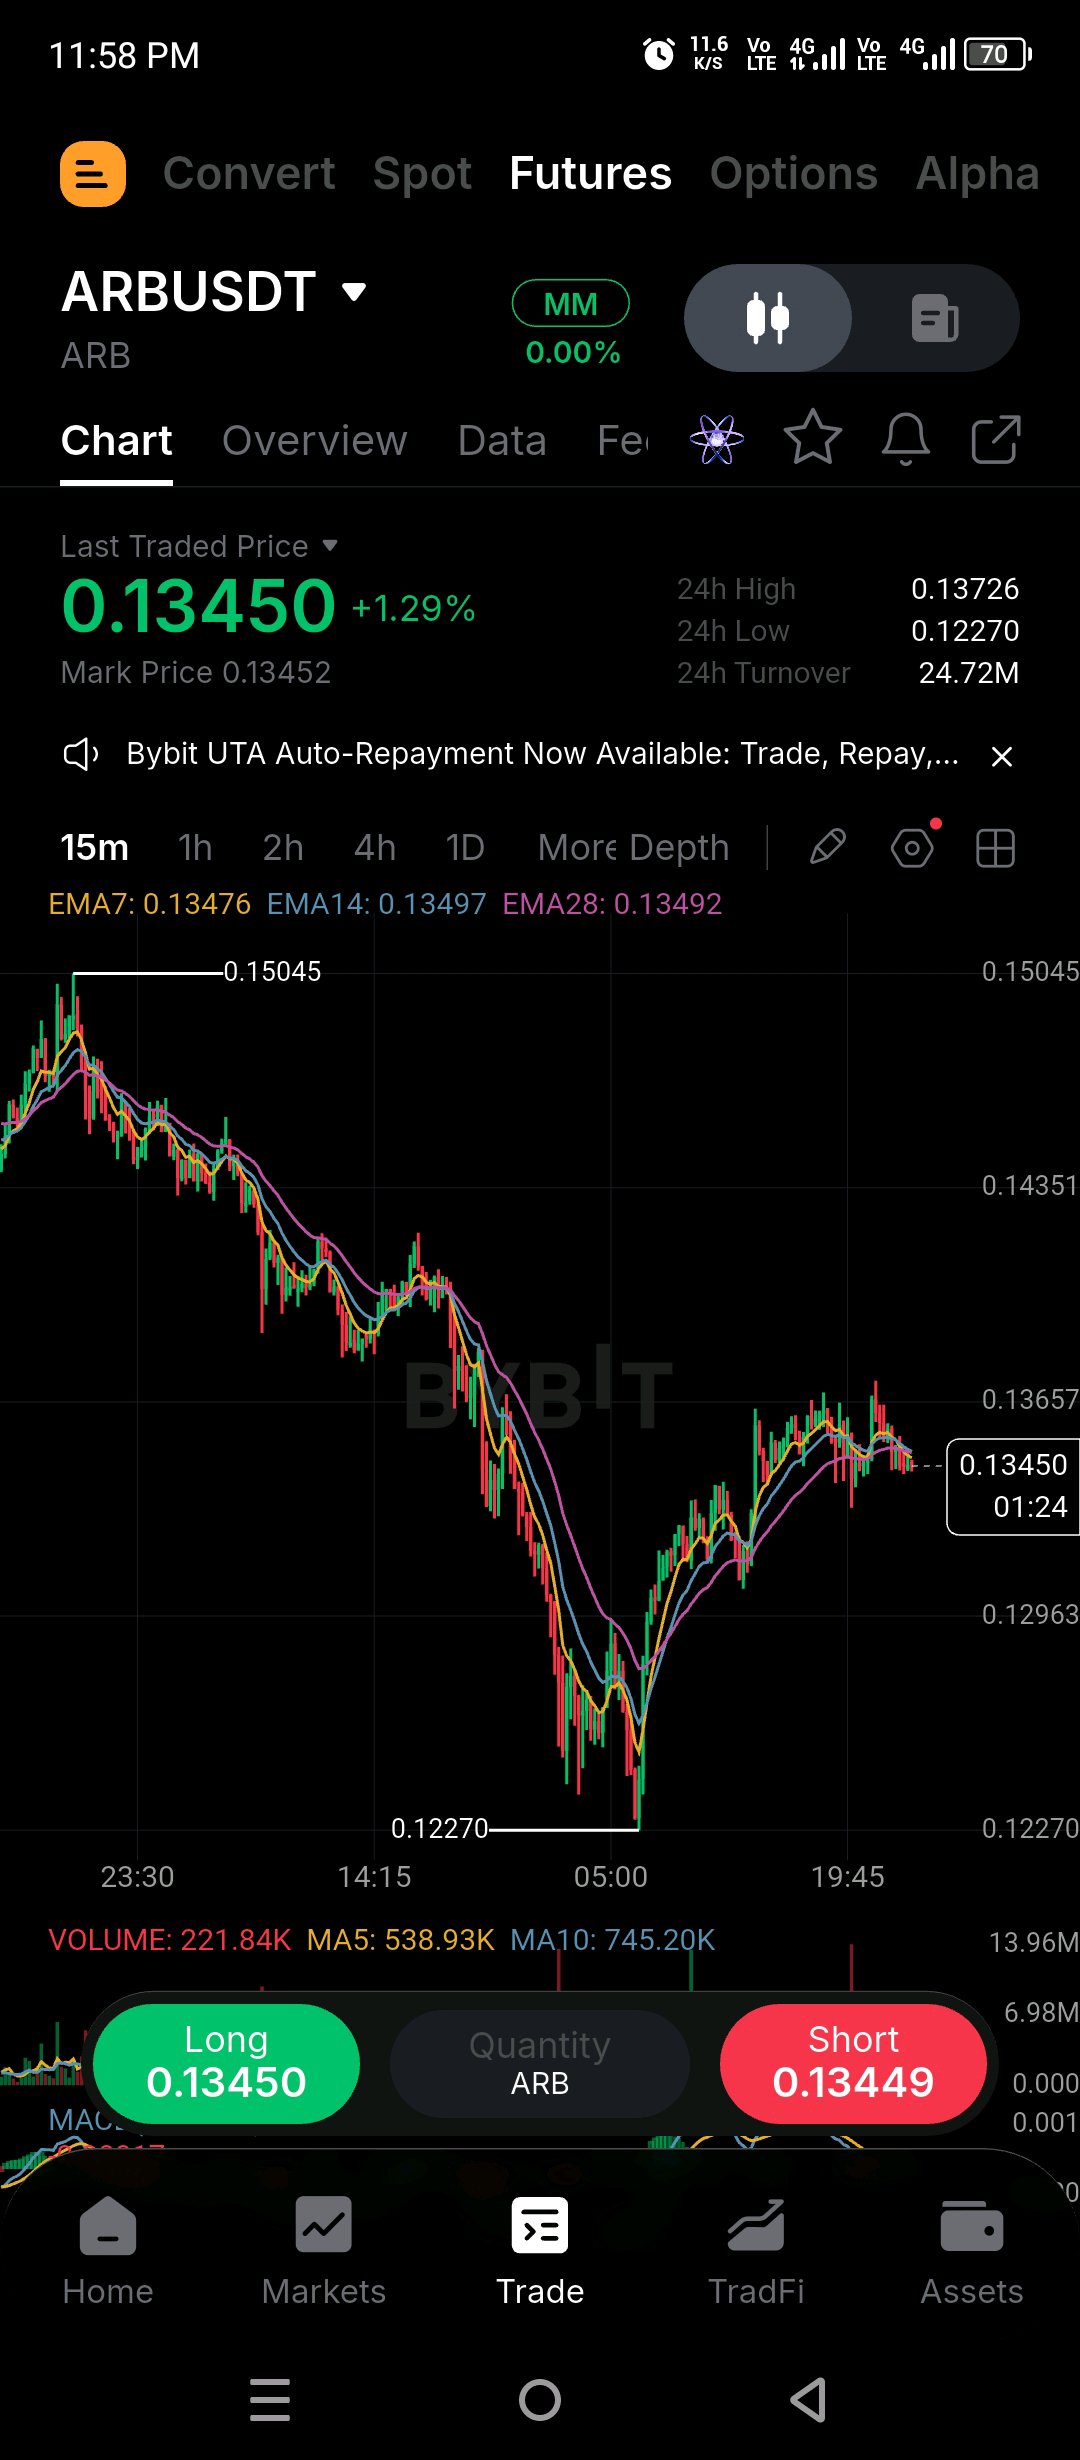
Arbitrum network is growing, but $ARBUSDT token is falling. That gap is the whole trade for me. I am looking at ARB at $0.13450 and I am confused in a good way. On one side, the network looks strong. DeFi TVL is around $1.306B, stablecoin supply is $3.804B, up 8.64% in 7 days, and tokenized real-world assets are around $1.013B. Capital is coming in. On the other side, ARB is down 21.99% in 7 days and 32.57% in 30 days. So why is price not following the network? I think the answer is simple and most people miss it. ARB is mainly a governance token. More people using Arbitrum does not automatically mean more people buying ARB. Network usage and token demand are two different things. Until ARB captures more value from that usage, strong fundamentals alone will not push price up. Then there is November 16. Two separate events are happening on the same day and people are mixing them up. First, about 92.65M ARB is scheduled to unlock, around 1.34% of circulating supply, worth around $12.6M. About 56.13M for team and contributors, 36.52M for investors. Unlock does not mean they will sell tomorrow, but timing is bad because price is already near lows. Second, the DAO is voting on whether to release 74.56M ARB and about 8,426 ETH that were frozen after the Oct 29 Binance hot-wallet exploit, to return them to Binance. Voting ends Nov 16. This is not new supply, it is a recovery decision. But it is a test of whether Arbitrum can handle emergency situations. Derivatives are also telling me a story. OI is only around $9.7M, funding is still positive near 7.09% annualized, and in the last 24h around $1.9M got liquidated, with about 92% from longs. That tells me leveraged bulls are still getting trapped while price stays low. My plan is not to buy $0.13450 in the middle. If ARB reclaims $0.1417 and holds above $0.1450 with real spot buying, that would be my first proof buyers are back, then $0.1500 to $0.1550 opens. If we lose $0.1245 and fail to get it back, then $0.1200 opens, then $0.1150 if selling speeds up. Risk 1 to 2% only, 5x to 10x isolated max if I trade it. Otherwise I skip it. I do not want to be long into an unlock with longs already crowded. Tell me what you think, does strong network growth mean ARB should go up, or is ARB just a governance token so it does not matter? Give me your reason in one line, I want to read it. Tap $ARBUSDT to trade this $0.1245 to $0.1450 range with me, trade on this same coin. #WSOT2026
$BTC (BTC) is trading around $64,000–$65,000, facing strong selling pressure. The overall short-term trend remains bearish, but oversold conditions could trigger a temporary recovery. Key Levels: Current price: ~$64,000 Support: $62,100 Strong support: $60,100 Resistance: $67,300 Next resistance: $70,300 Future Outlook: If BTC breaks above $67,300, a recovery towards $70,300 is possible. However, a breakdown below $62,100 could increase selling pressure. My View: Wait for confirmation before entering a trade. Watch support and resistance carefully.$BTC $BTCUSDT #ByXIMPACT #WSOT2026 #WSOTShowYourAITradeToEarn10USDT
Altcoins are testing a key support level for the 5th time. $ETH $BCH $SNX This level has held through the Yen carry trade unwind, October 10 crash, US-Iran war, and CLARITY Act delay. Let's hope for another bounce from here. $ETHUSDT $BCHUSDT #ByXIMPACT #WSOT2026 #WSOTShowYourAITradeToEarn10USDT

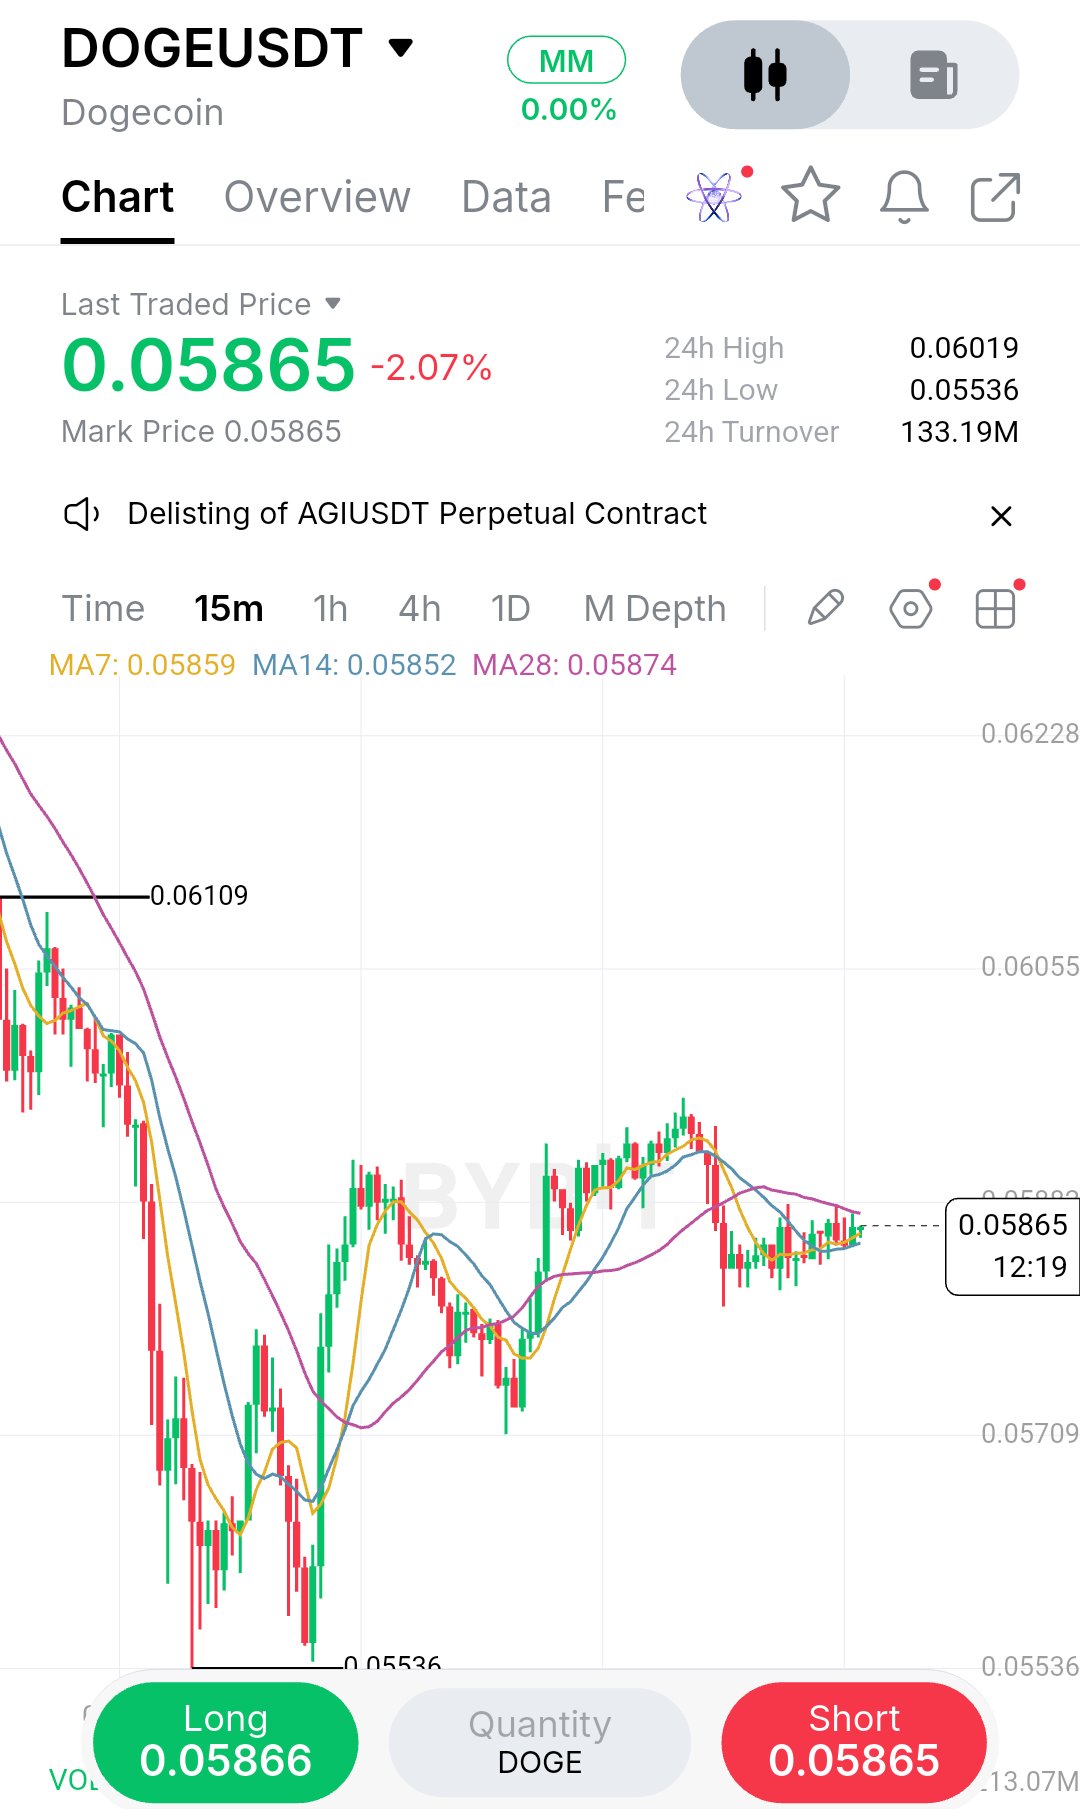
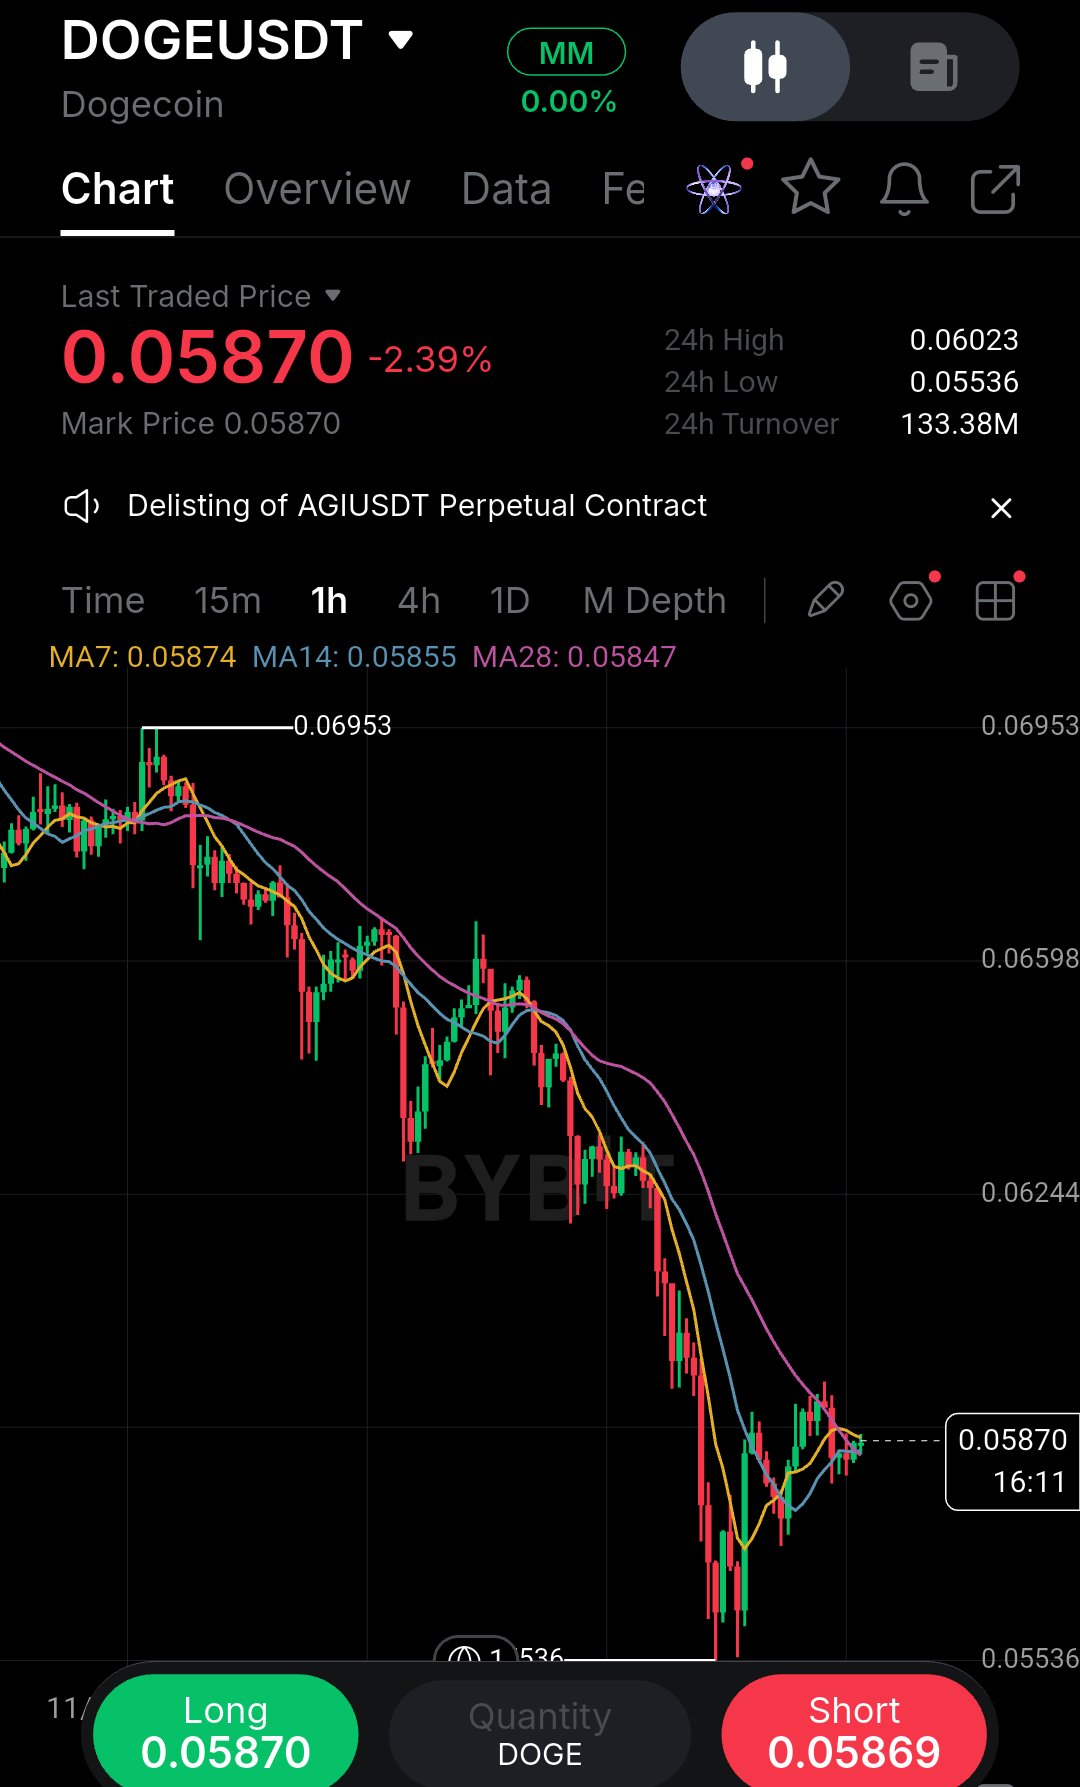
What caught my attention here is how DOGE is quietly coiling under the 28 MA after that violent flush to 0.05536. Everyone wants to catch the bottom, but this 15m chart still hasn’t proven a structural shift. I’m watching 0.05874 closely.Price is trapped between the flat 7 and 14 MAs and the 28 MA, which is acting like a ceiling. The bounce off the low was aggressive, but the lower high near 0.06109 keeps the broader downtrend intact. The market structure here is messy. We have a sharp sell-off, a V-shaped recovery, and now a tight consolidation right beneath a key moving average. That compression tells me the market is deciding its next move, and it hasn’t made up its mind yet. The 7 MA at 0.05859 and the 14 MA at 0.05852 are practically flat, meaning short-term momentum has stalled. The 28 MA at 0.05874 is the real gatekeeper. Until price reclaims that level with conviction, every rally is just a bounce inside a downtrend. Let’s look at both sides honestly. The bullish case is that the 0.05536 low held firmly, the recovery was fast, and the MAs are flattening, which often precedes a breakout. If buyers can push through 0.05880 and close above it, the trapped sellers above will be forced to cover, and that fuel could carry price toward 0.06050 and then the 0.06109 high. The bearish case is that the trend is still down, the bounce is weak relative to the drop, and the 28 MA has rejected price repeatedly. If sellers defend that level again, the low at 0.05536 becomes the obvious liquidity target. My read is neutral until we see a clean break. I’d rather wait for confirmation than guess which side wins. If price reclaims 0.05880 with a strong candle close, I’d consider a long scalp toward the previous supply zone. But if sellers defend that MA and price rolls over, the 0.05536 low becomes the next target, and I’d stand aside rather than chase a breakdown. Bias: WAIT (long on confirmation) Entry: 0.05885–0.05900 Confirmation: 15m close above 0.05900 Stop / Invalidation: 0.05780 TP1: 0.06050 TP2: 0.06100 R:R: 1.6 to 1 The biggest risk is a fakeout at the 28 MA. I’ve been burned entering before the candle closes.Now I wait for the retest. If price rejects and closes back under 0.0585, I cancel the idea and watch the low get swept. Are you waiting for the same reclaim, or fading this bounce? #ByXIMPACT #WSOT2026 $DOGEUSDT $HYPEUSDT
I’ve learned to distrust perfectly clean bounces after a hard dump, so I’m watching this DOGE 1h chart with patience rather than excitement. Price is clinging to 0.0587 after a brutal slide, but the structure is still a series of lower highs. The 7 and 14 MAs are flat, yet the 28 MA at 0.0584 is the real battleground.it’s acting as immediate overhead pressure. I can see the trapped buyers from the 0.062 breakdown, and I have no intention of adding myself to that crowd. Here is the honest read: this is not a reversal yet. It is a bounce inside a downtrend. The drop from 0.06953 to the 0.05536 low was fast and heavy, and fast drops usually leave a trail of unfinished business above. Those buyers who entered near 0.062 are now underwater, and every small rally gives them a chance to exit at break-even or with a smaller loss. That creates a wall of selling pressure right where the 28 MA sits. Until price reclaims that level and holds it, the path of least resistance remains down. What supports the bullish case? The wick at 0.05536 shows buyers defended that zone aggressively, and the short-term MAs are flattening, which means selling momentum is cooling. If price can reclaim 0.0590 with a strong close, the trapped sellers above may start covering, and that fuel could push us toward 0.0620. What supports the bearish case? Everything else. The trend is down, the structure is lower highs, and the bounce is weak relative to the drop. A failure at the 28 MA would likely send price back to test 0.05536, and a break there opens the door to deeper levels. My execution plan is simple. I want a decisive reclaim and close above 0.0590 to confirm buyers are actually stepping in. If that fails, a lower high is the signal to stay out and wait. Entry: 0.0591 (confirmation) SL: 0.0575 (below recent wick) TP1: 0.0620 TP2: 0.0650 Risk/Reward is roughly 1:1.6 to TP1, which is acceptable for a counter-trend bounce but not a trade I would oversize. Invalidation is a clean break below 0.0575.If that happens, the bounce thesis is dead and I step aside. I used to jump on these early reversals and get stopped out by the retest. Now I let the candle close first. Discipline beats FOMO every time. Where’s your line in the sand? #ByXIMPACT #WSOT2026 $DOGEUSDT $SPCXXUSDT
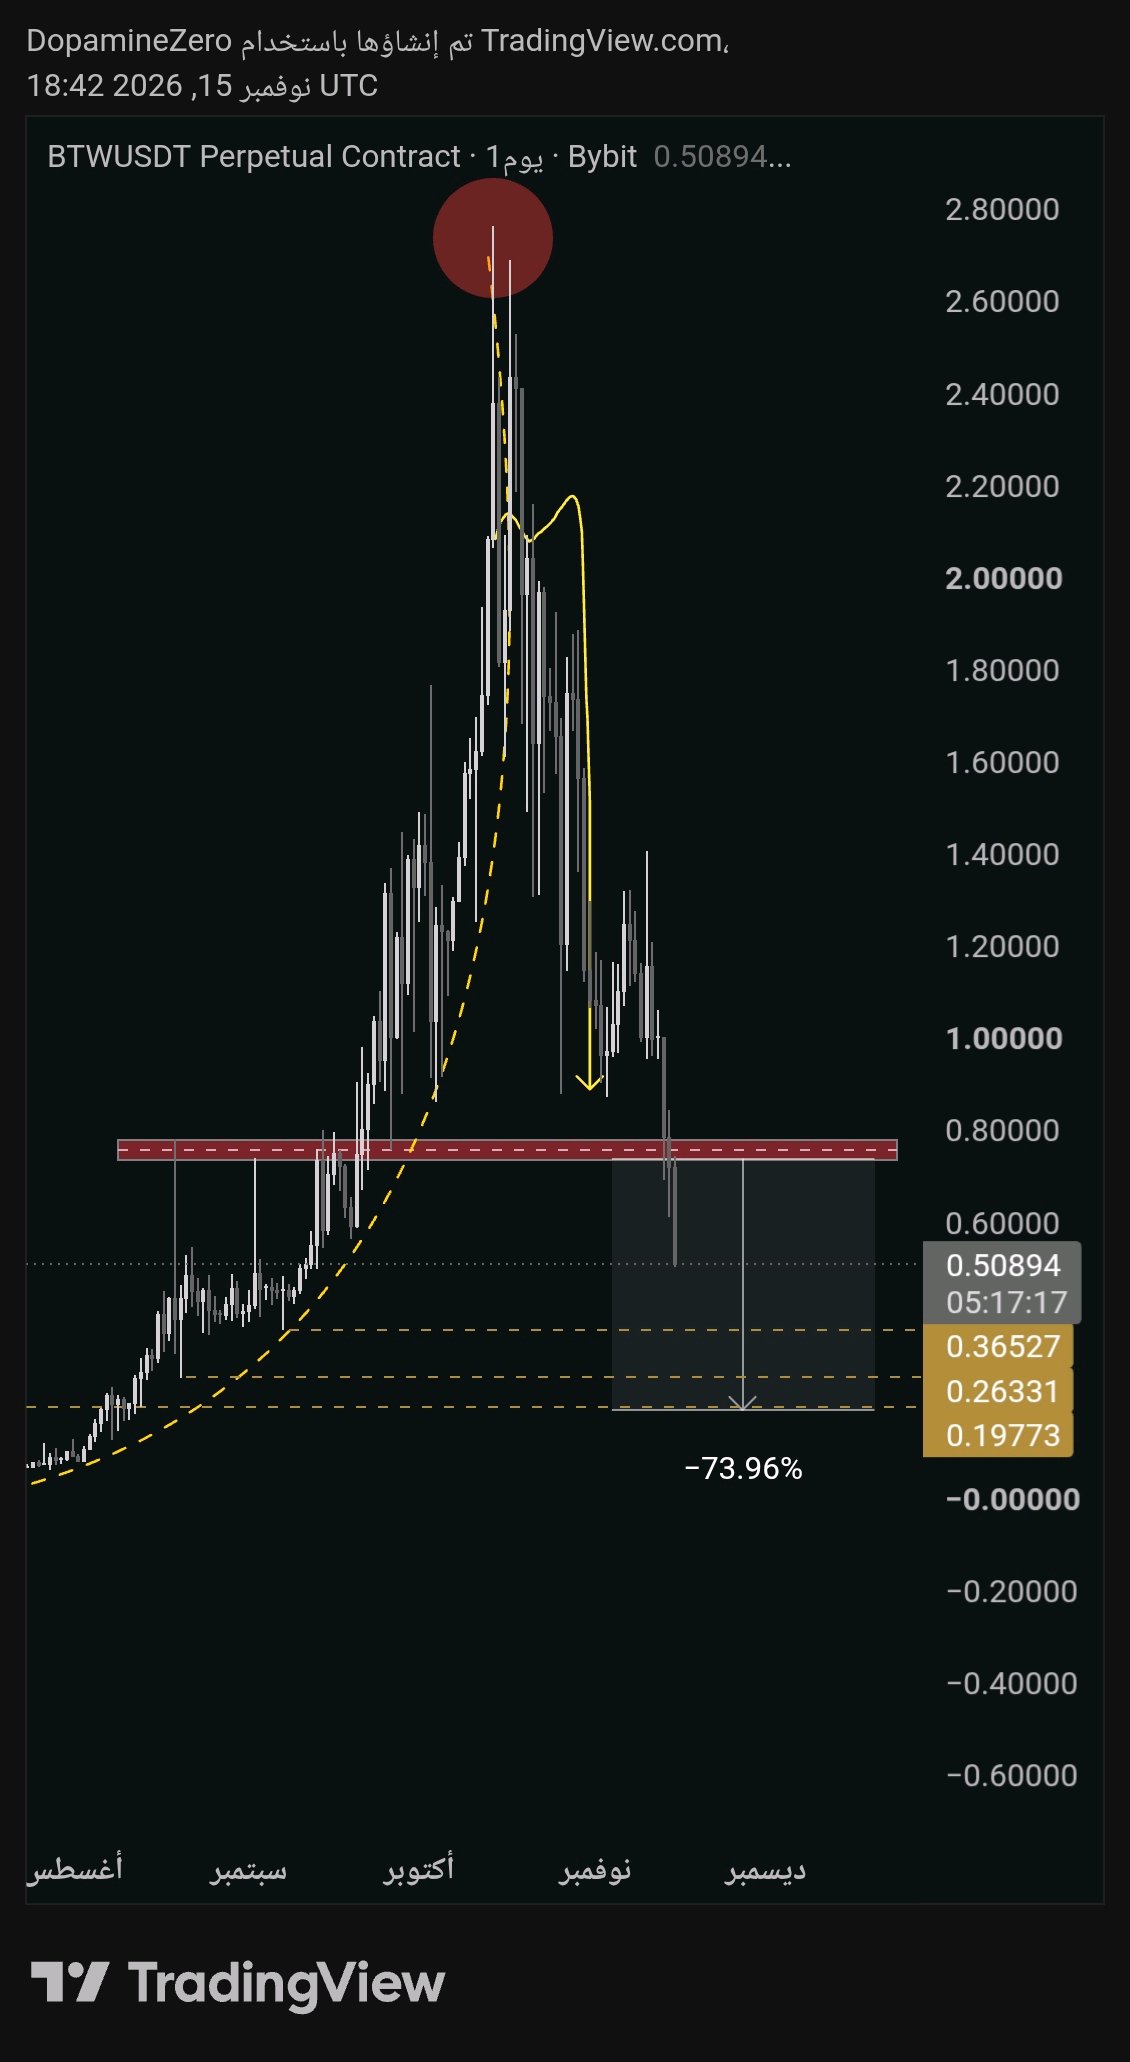
$BTW
Do you remember this? now send to zero #WSOT2026 #WSOTShowYourAITradeToEarn10USDT
🤌🤌🤌

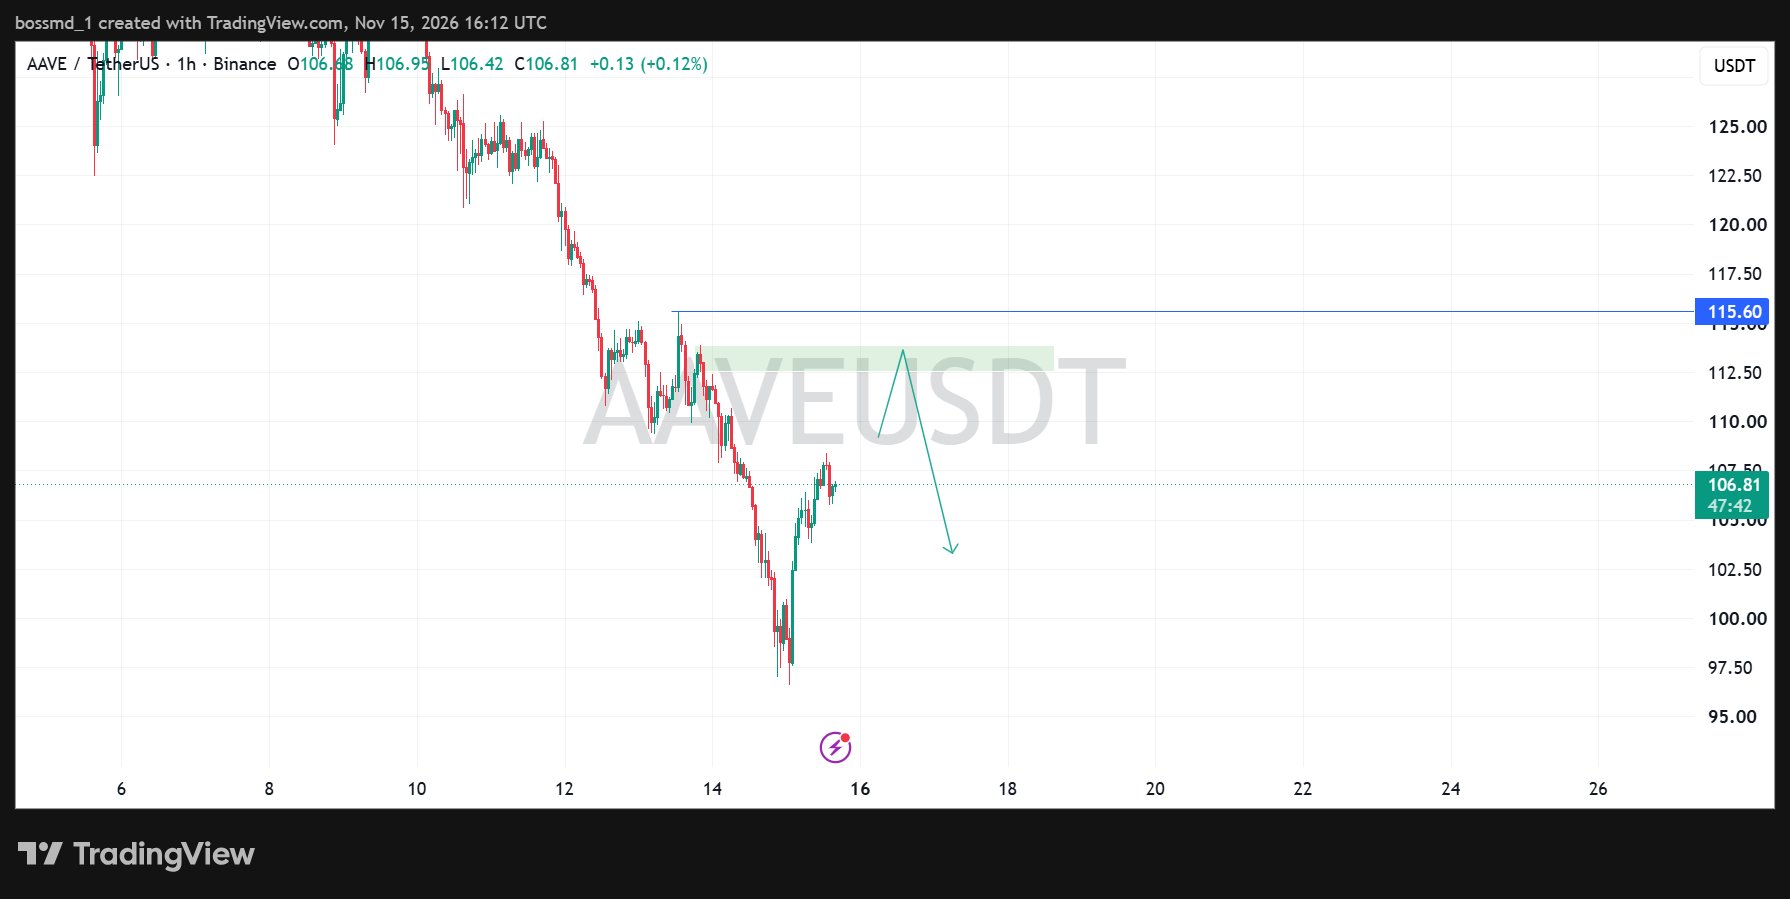
#AAVE
#AAVE is showing signs of a short-term recovery after a heavy sell-off, but the larger picture still looks cautious. The price bounced from the $97-$100 level and is currently trading around $106.8. However, there is a strong resistance zone around $112-$114 that could attract sellers if the price rises higher. I am watching for a possible move up to this resistance zone, which could be followed by another pullback to $103. To talk about a significant trend reversal, buyers need to demonstrate enough strength to break through the resistance. #WSOT2026
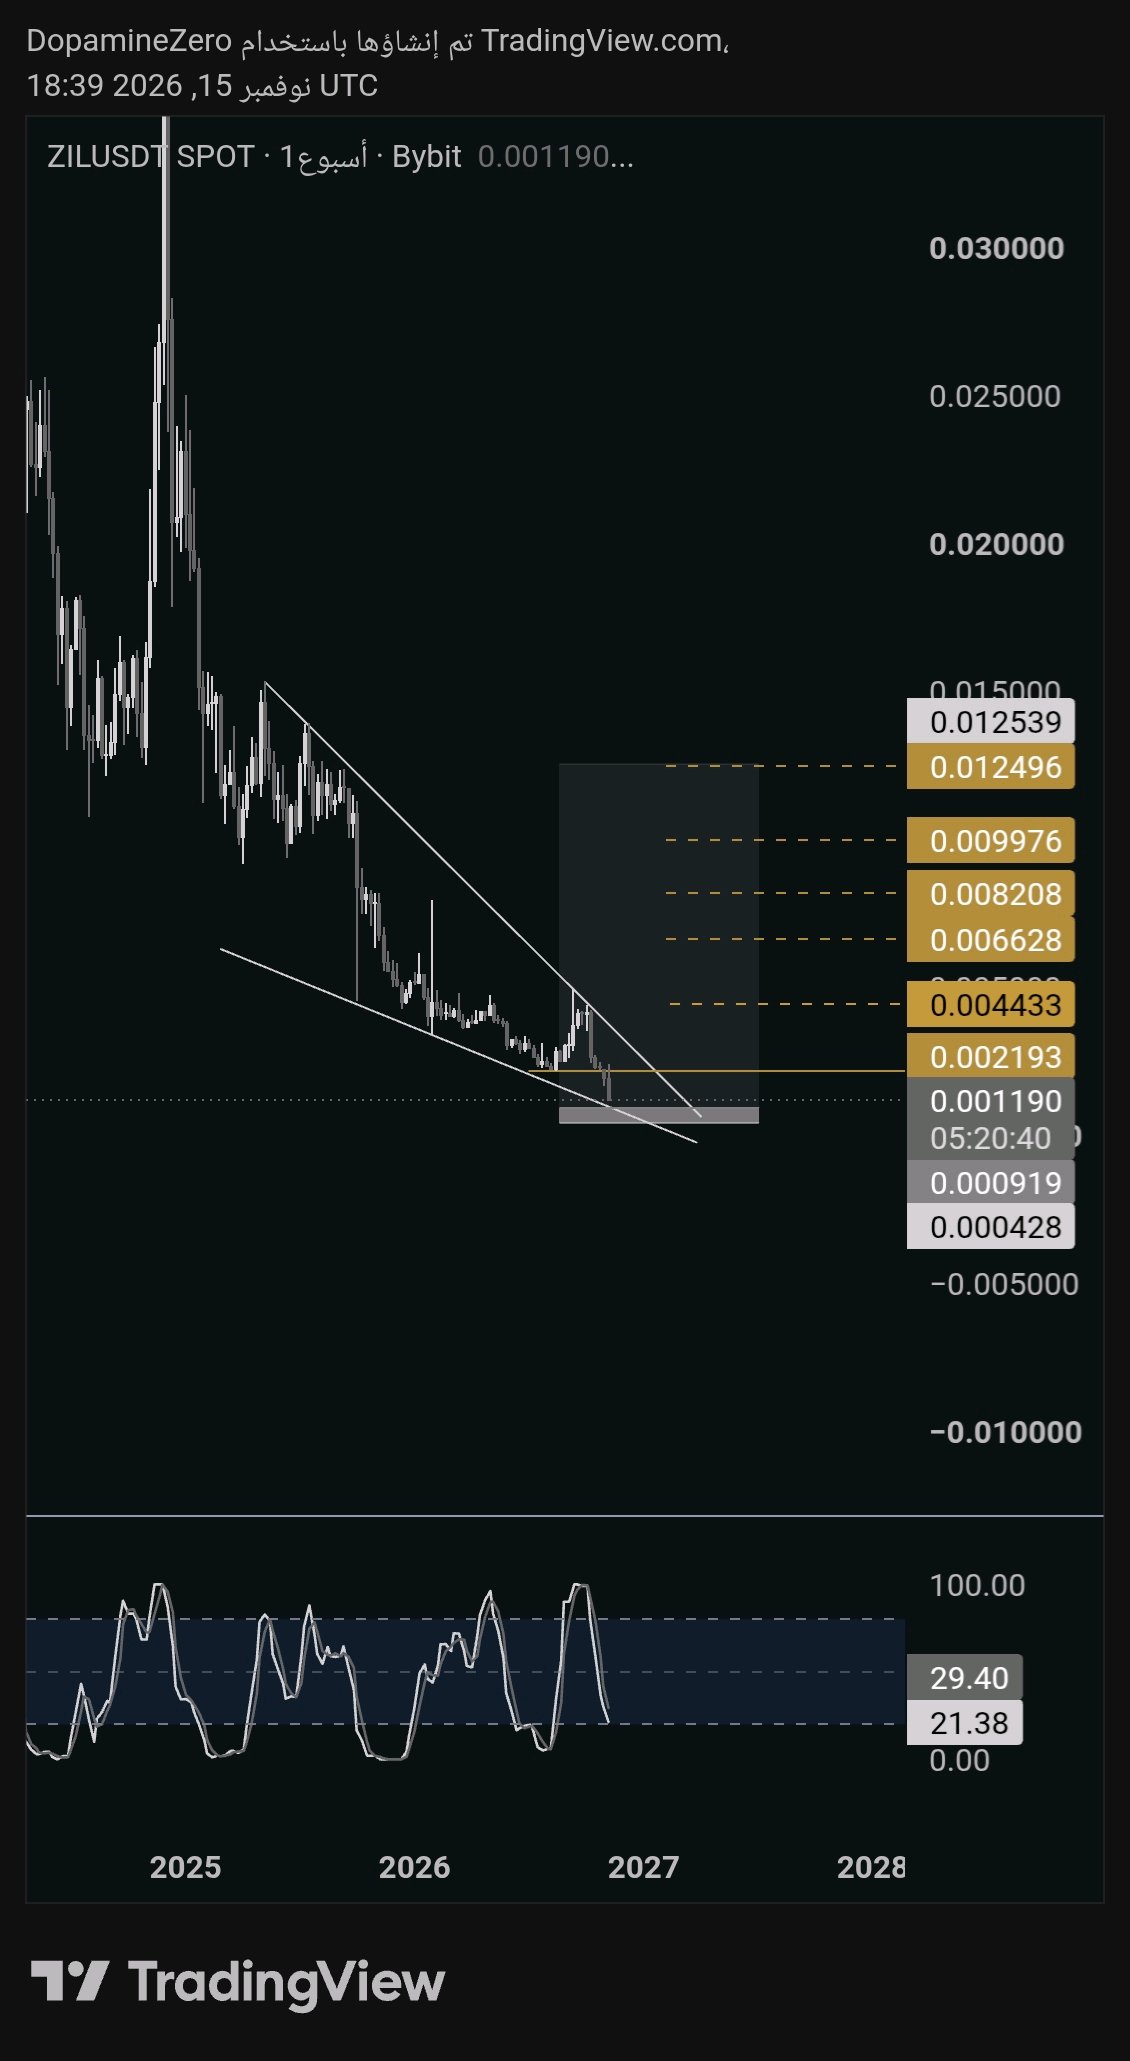
This is a spot trade setup on the weekly timeframe. Price is moving within a clean falling wedge pattern and is now attempting to test the lower trendline. The indicators are showing extremely oversold conditions. Suggested entry zones: 0.000980 0.000950 The stop-loss is marked on the chart, and the post-breakout targets are indicated by the golden lines. Since this is a weekly timeframe setup, I recommend scaling into the position gradually and increasing the position size only if a breakout occurs. We’ll monitor price action and I’ll provide updates when necessary. Please manage your risk carefully. $ZILUSDT $BTCUSDT #WSOT2026

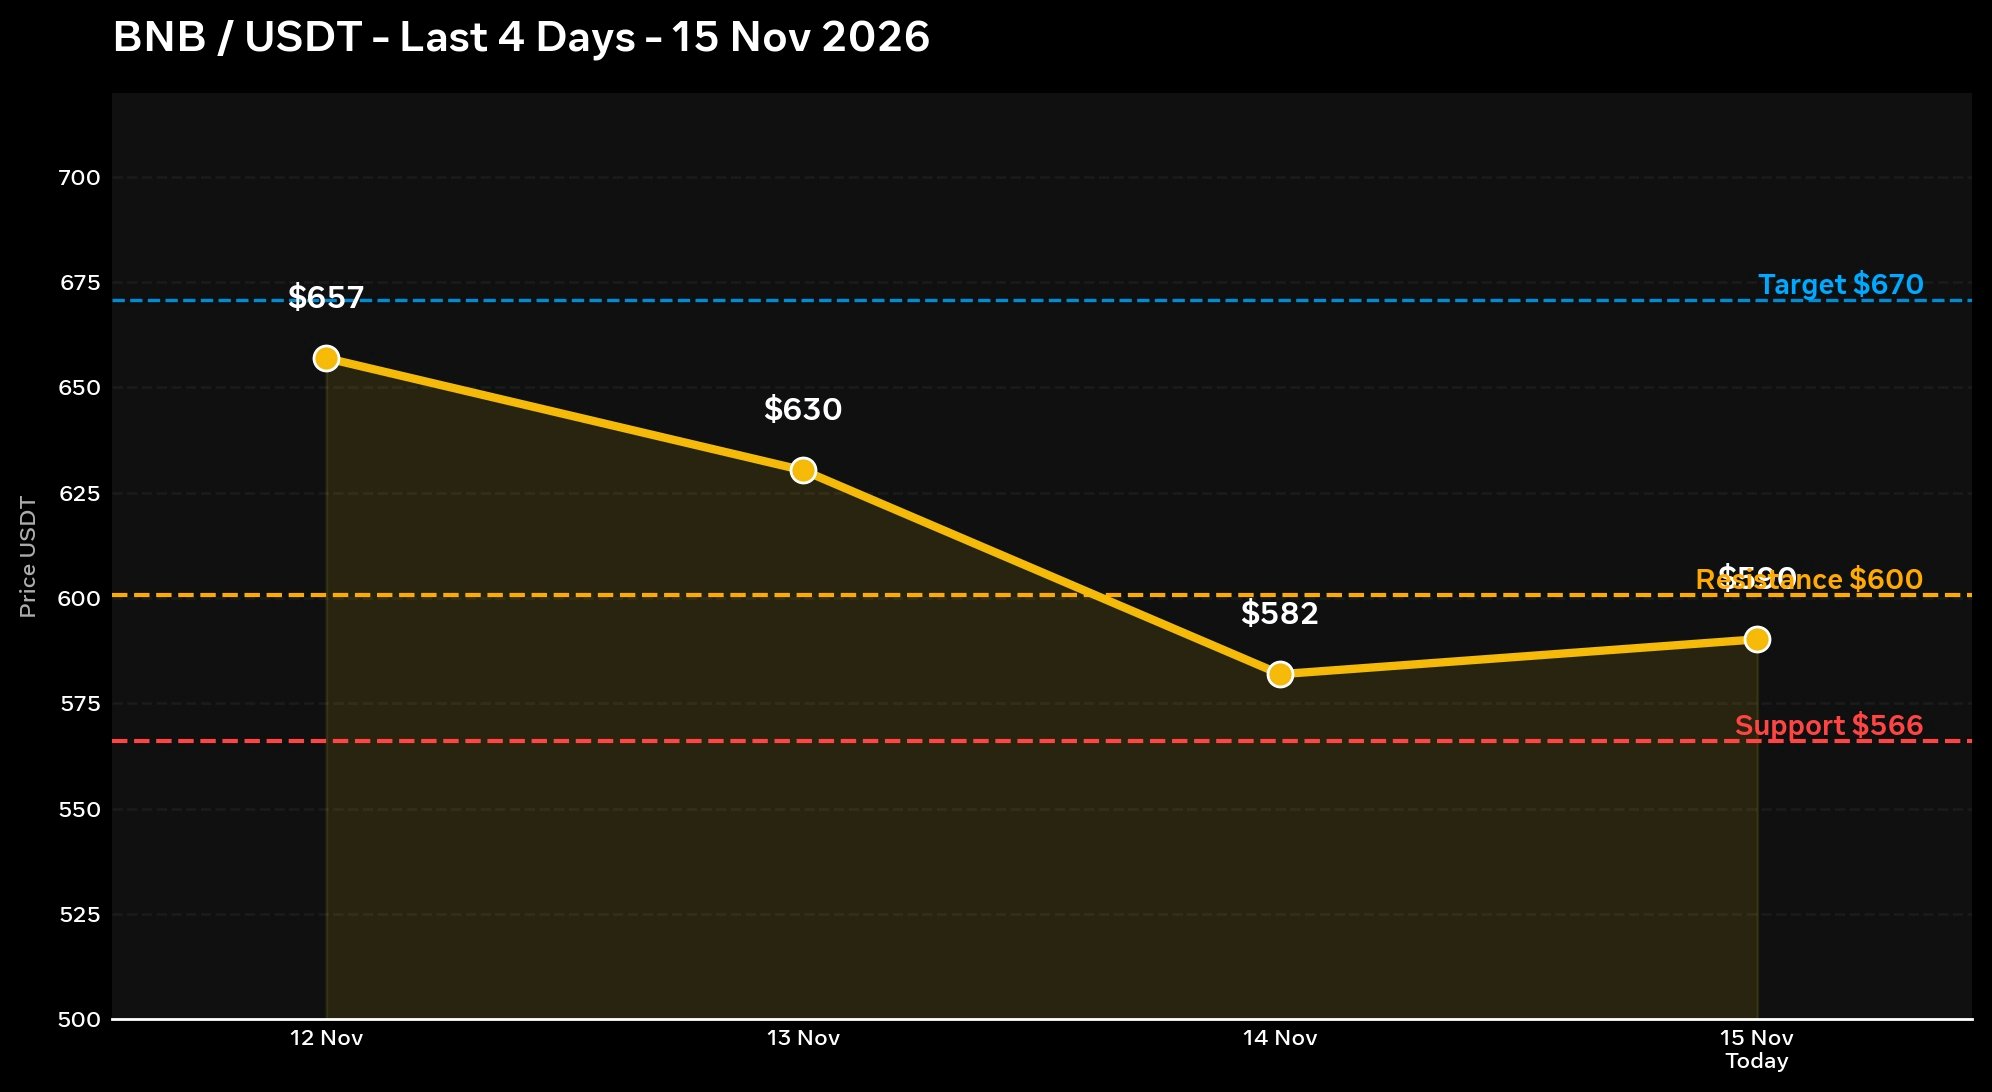
BNB coin analysis today, November 15, 2026
Current Price: $590.19 Status: 24h: Down -0.2% - almost stable 7 days: Down -14.6% 1 month: Down -17.3% From ATH: Down -55% from $1,307 Why is it down? It dropped below all moving averages - SMA 20, 50, 200 are all above it Daily RSI: 20.6 - very oversold, strongest oversold level in 90 days MACD is negative and SuperTrend has been bearish since October 15 It dropped below the Bollinger Lower Band at $601 - meaning the selling was aggressive Important Levels: Strong Support: $566 - $570 - this is yesterday's bottom, if it breaks we will head to $542 - $537 First Resistance: $600.60 Second Resistance: $619 - $622 Major Target: $670.77 - accumulation zone Stop Loss: Below $501.99 Conclusion: BNB is the strongest one in the market today, standing firm and holding above $590. If it gets back above $600, it will bounce to $670, if $566 breaks it will go to $542. $BNBUSDT $ETHUSDT #WSOT2026 #WSOTShowYourAITradeToEarn10USDT #JensenHuangExitTestsNvidiasAILeadership #USPPITestsTheHigherForLongerTrade #USInflationRunsHotAndRateHikeBetsRise

ELON MUSK MAKES A SURPRISING NVIDIA STATEMENT! 👀 Elon Musk has reportedly called for NVIDIA to reinstate Jensen Huang as CEO. 🔥 Jensen Huang has become one of the most influential figures in the global AI and semiconductor industry. 📊 Any leadership speculation involving NVIDIA is likely to attract major attention from investors. ⚠️ Is this a serious proposal or just a headline grabbing comment? What do you think about Jensen Huang's leadership at NVIDIA? #WSOT2026

BREAKING: NVIDIA AI CHIPS UNDER INVESTIGATION! U.S. authorities are reportedly investigating whether NVIDIA's advanced AI chips were illegally diverted to China. Key points: 🔹 The investigation focuses on potential chip diversion. 🔹 NVIDIA's AI technology is at the center of U.S.–China tech tensions. 🔹 The developments could bring renewed attention to AI chip export restrictions. ⚠️ No conclusion of illegal activity has been established. 👀 Could this investigation create more uncertainty for NVIDIA and the global AI industry? #WSOT2026
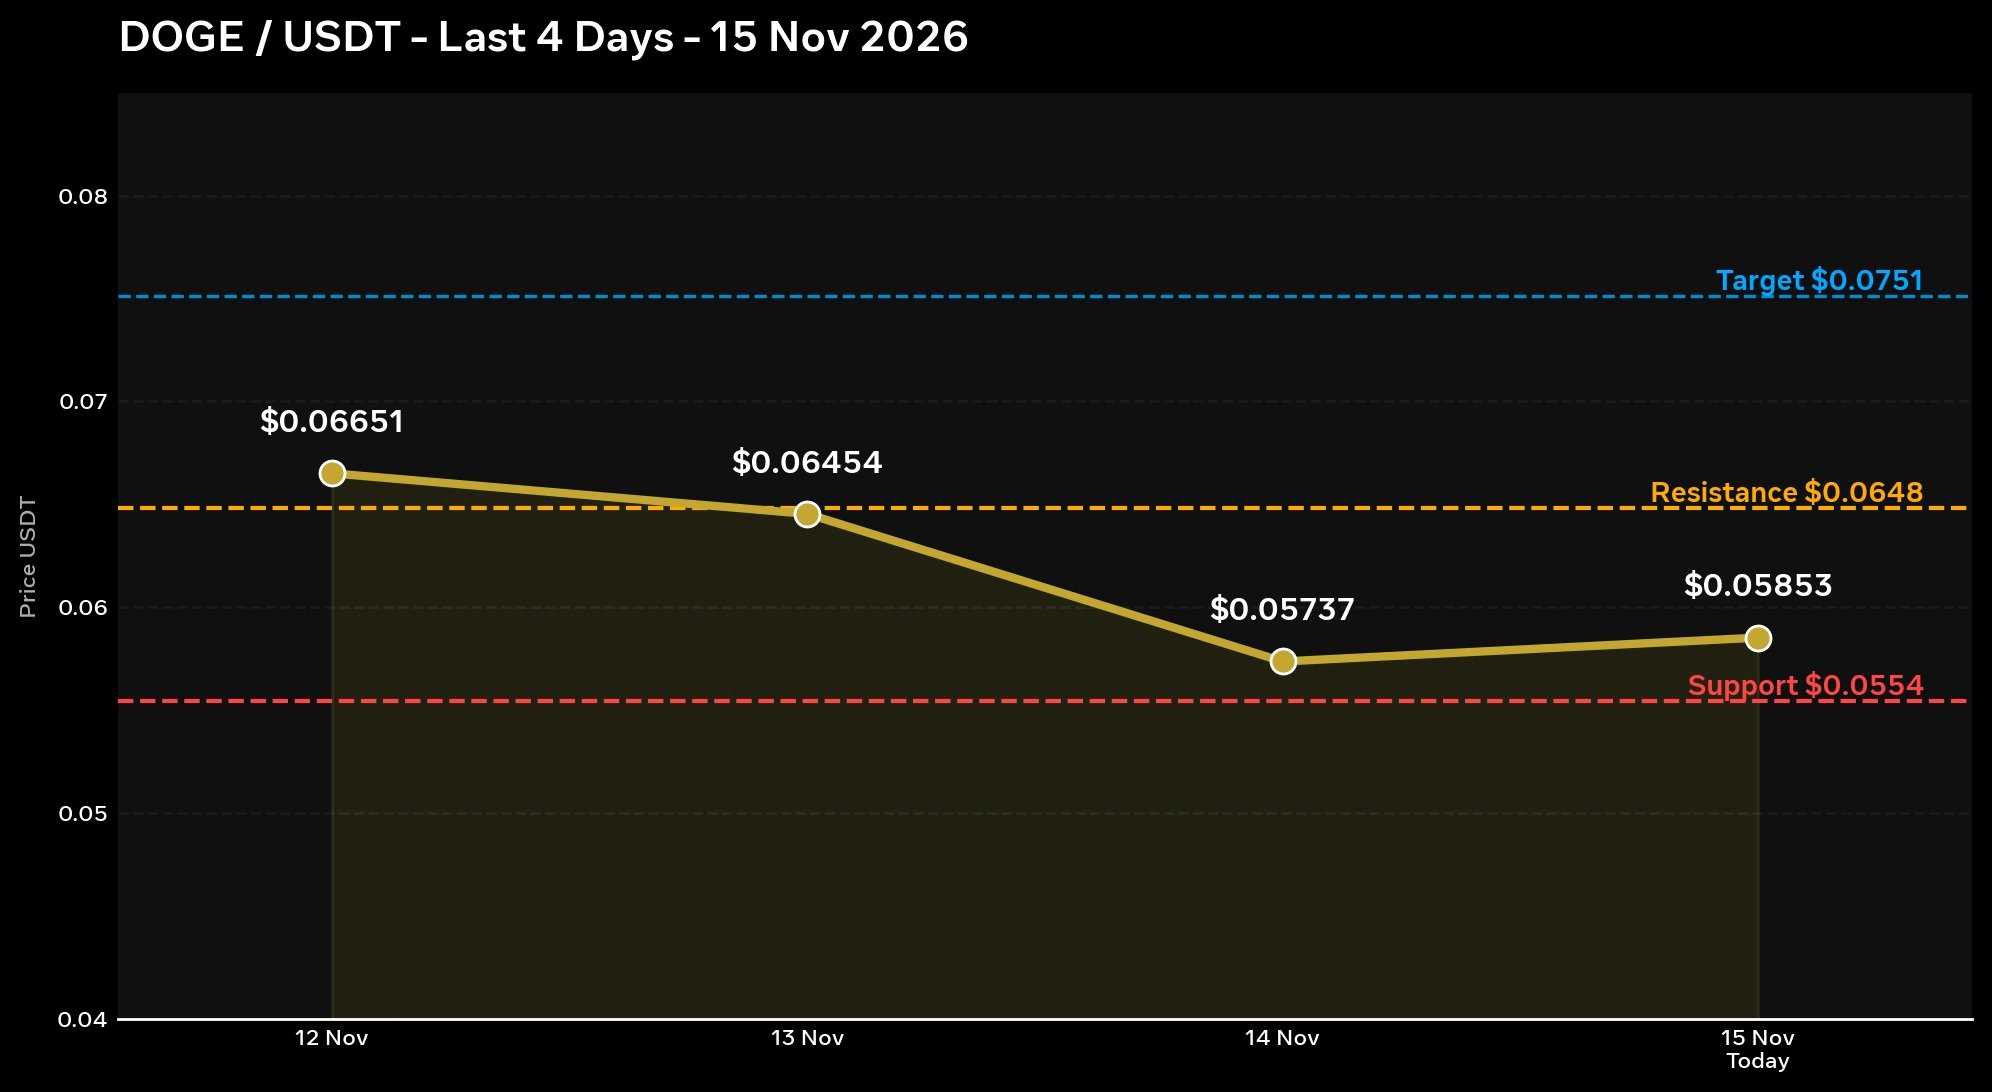
DOGE coin analysis. Today, Sunday, November 15, 2026
Current Price: $0.05853 Status: 24h: Down -2.9% 7 days: Down -18% 1 month: Down -26.7% From ATH: Down -92% from $0.7376 Why is it down? Dropped out of Top 10 - fell to #13 with a Market Cap of $9B Down -40% since September 22nd DOGE ETF: No movement in a month - last time was October 13th Selling: Binance saw 265.5M DOGE sold more than bought Daily RSI: 19.6 - heavily Oversold Important Levels: Strong Support: $0.0554 - $0.059 - We are currently right on top of it, if it breaks we're heading to $0.04 First Resistance: $0.0648 - Flip Zone Second Resistance: $0.0751 Major Target: $0.08 - $0.10 Summary: DOGE is currently at a critical point. If it holds $0.055 it will bounce to $0.075*, if it breaks downwards it will go to *$0.04. Any bounce from here should be treated with suspicion until it rises above $DOGEUSDT $XRPUSDT #WSOT2026 #WSOTShowYourAITradeToEarn10USDT #JensenHuangExitTestsNvidiasAILeadership #USPPITestsTheHigherForLongerTrade #USInflationRunsHotAndRateHikeBetsRise 0.064
NANCY PELOSI'S STOCK PORTFOLIO IS MAKING HEADLINES! A reported breakdown shows that around 60% of her portfolio is concentrated in just five stocks. The first major holding: 1️⃣ $NVDA – 16.0% of the portfolio. 👀 Heavy exposure to major tech stocks is drawing attention from investors. More holdings to follow as the portfolio breakdown becomes available. ⚠️ Remember: Reported congressional portfolio disclosures may be delayed and don't necessarily reflect real-time positions. Would you invest in a portfolio this concentrated? #WSOT2026
BINANCE SAYS IT WILL STAND STRONG! Binance's Yi He sends a strong message to the crypto community: 🗣️ “No matter how much FUD we face Binance will stand strong. Despite market uncertainty criticism and ongoing challenges Binance remains confident in its commitment to the crypto ecosystem. 💛 FUD or not, confidence is key! Do you still trust Binance as a leading crypto exchange? 👀 #WSOT2026
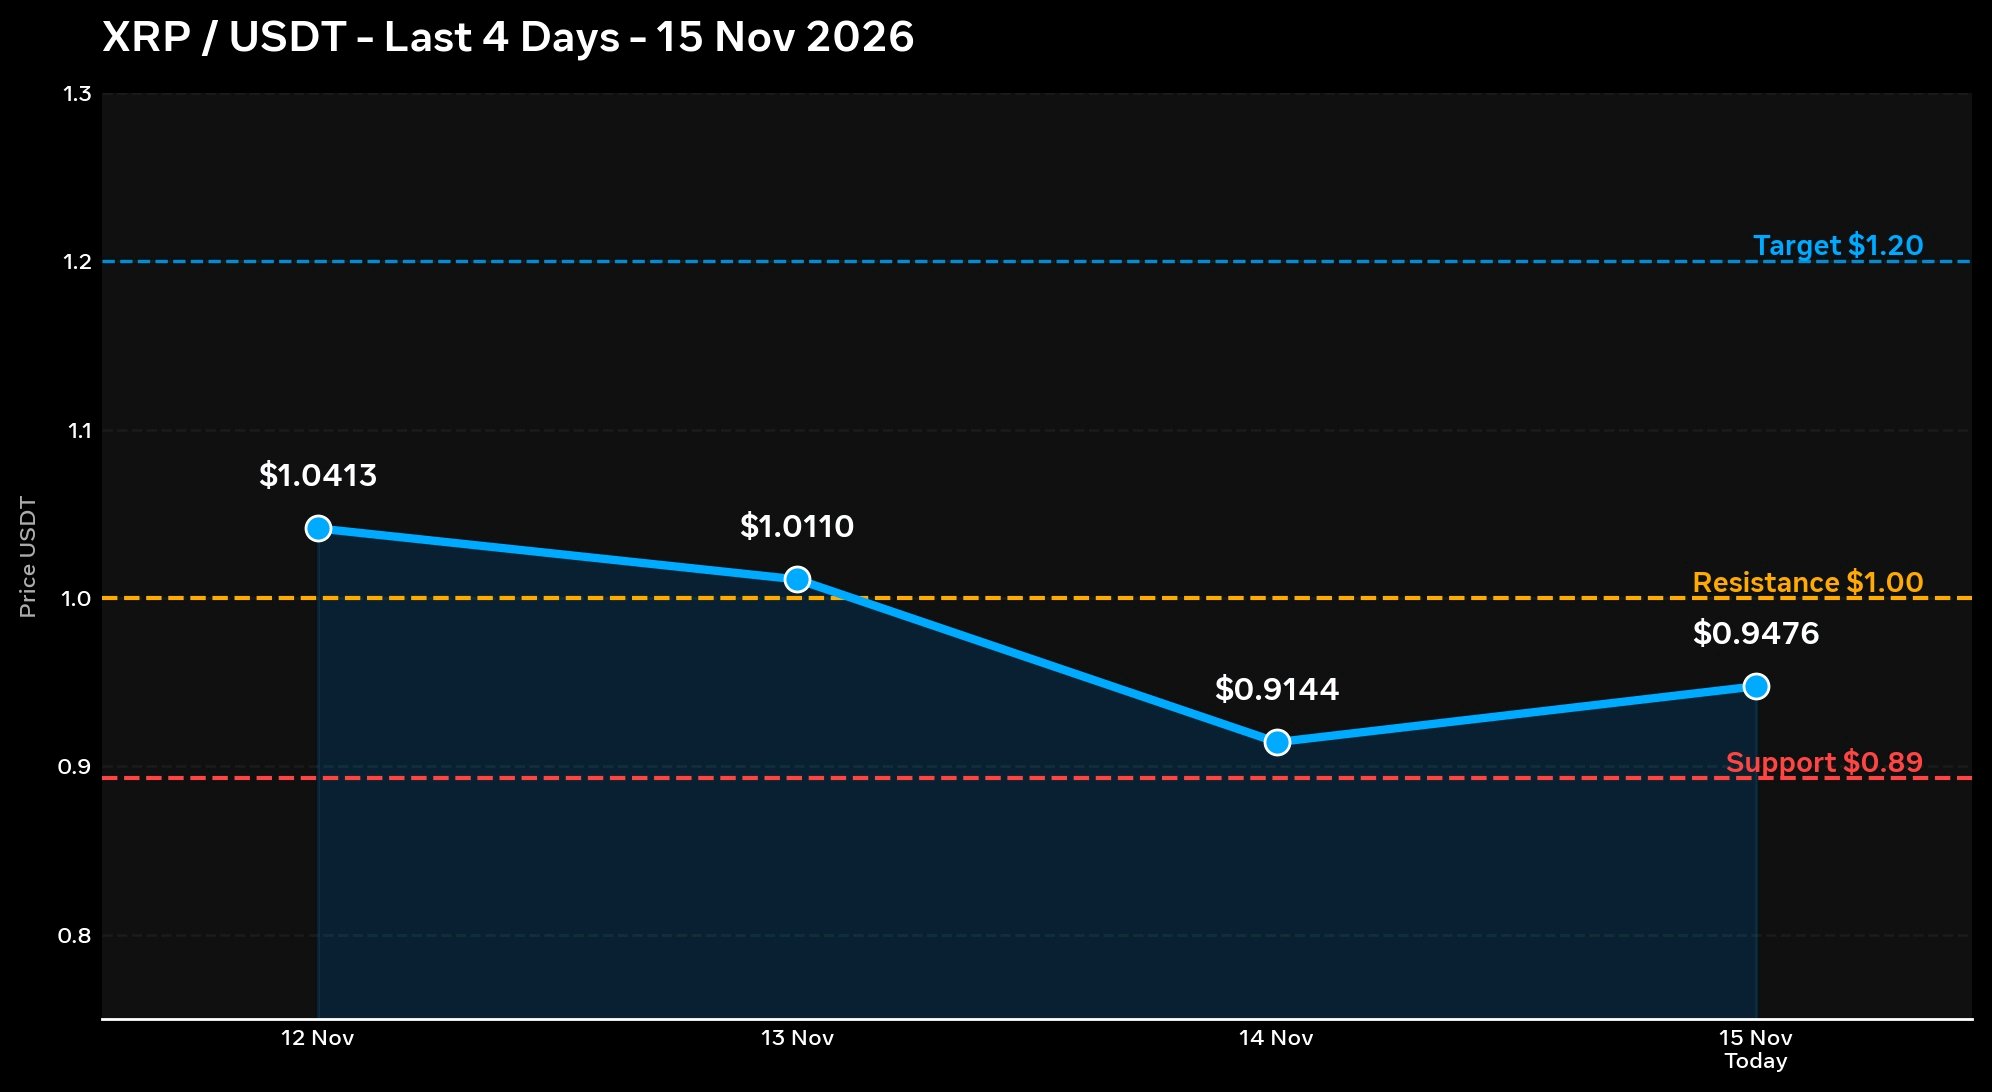
XRP analysis for today, Sunday, November 15, 2026
Current Price: $0.9476 Status: 24h: Down -1.1% 7 Days: Down -17.3% 1 Month: Down -26% From ATH: Down -74% from $3.65 Why is it down? Dropped yesterday to $0.893 - the lowest price in two years (since November 2024) XRP ETF: $19.13M outflows this week - the largest outflow since March Liquidations: $51.6M liquidated, including $43.1M in Longs Daily RSI: 16.1 - Very, very oversold But there are positive signals: Whales bought 65.32M XRP in 4 days Network activity is up +154% - active accounts 42,300 Payment volume reached 1.1 billion XRP Important Levels: Strong Support: $0.89 - $0.90 - This is yesterday's bottom; if it breaks, we're going to $0.85 then $0.77 First Resistance: $1.00 - Needs to get back above this to stabilize the situation Second Resistance: $1.05 - $1.12 Big Target: $1.20 Summary: XRP is currently standing on historical support at $0.89. If it holds here, it will bounce back to $1.00*, if it breaks below, it will head to *$0.85. $XRPUSDT $PEPEUSDT #WSOT2026 #USPPITestsTheHigherForLongerTrade
SATOSHI-ERA BITCOIN WALLET MAKES A $7 MILLION MOVE! A Bitcoin wallet that had reportedly remained inactive for around 15 years has sold approximately $7 MILLION worth of $BTC. 👀 What's making this move stand out? 🔹 The wallet reportedly survived major market events like Mt. Gox COVID LUNA and FTX. 🔹 After years of inactivity it has finally moved its Bitcoin. 🔹 The transaction is raising questions across the crypto community. ⚠️ But an old wallet moving coins doesn't necessarily mean the holder knows something or that a crash is coming. Why do you think this long-term Bitcoin holder decided to sell now? #WSOT2026
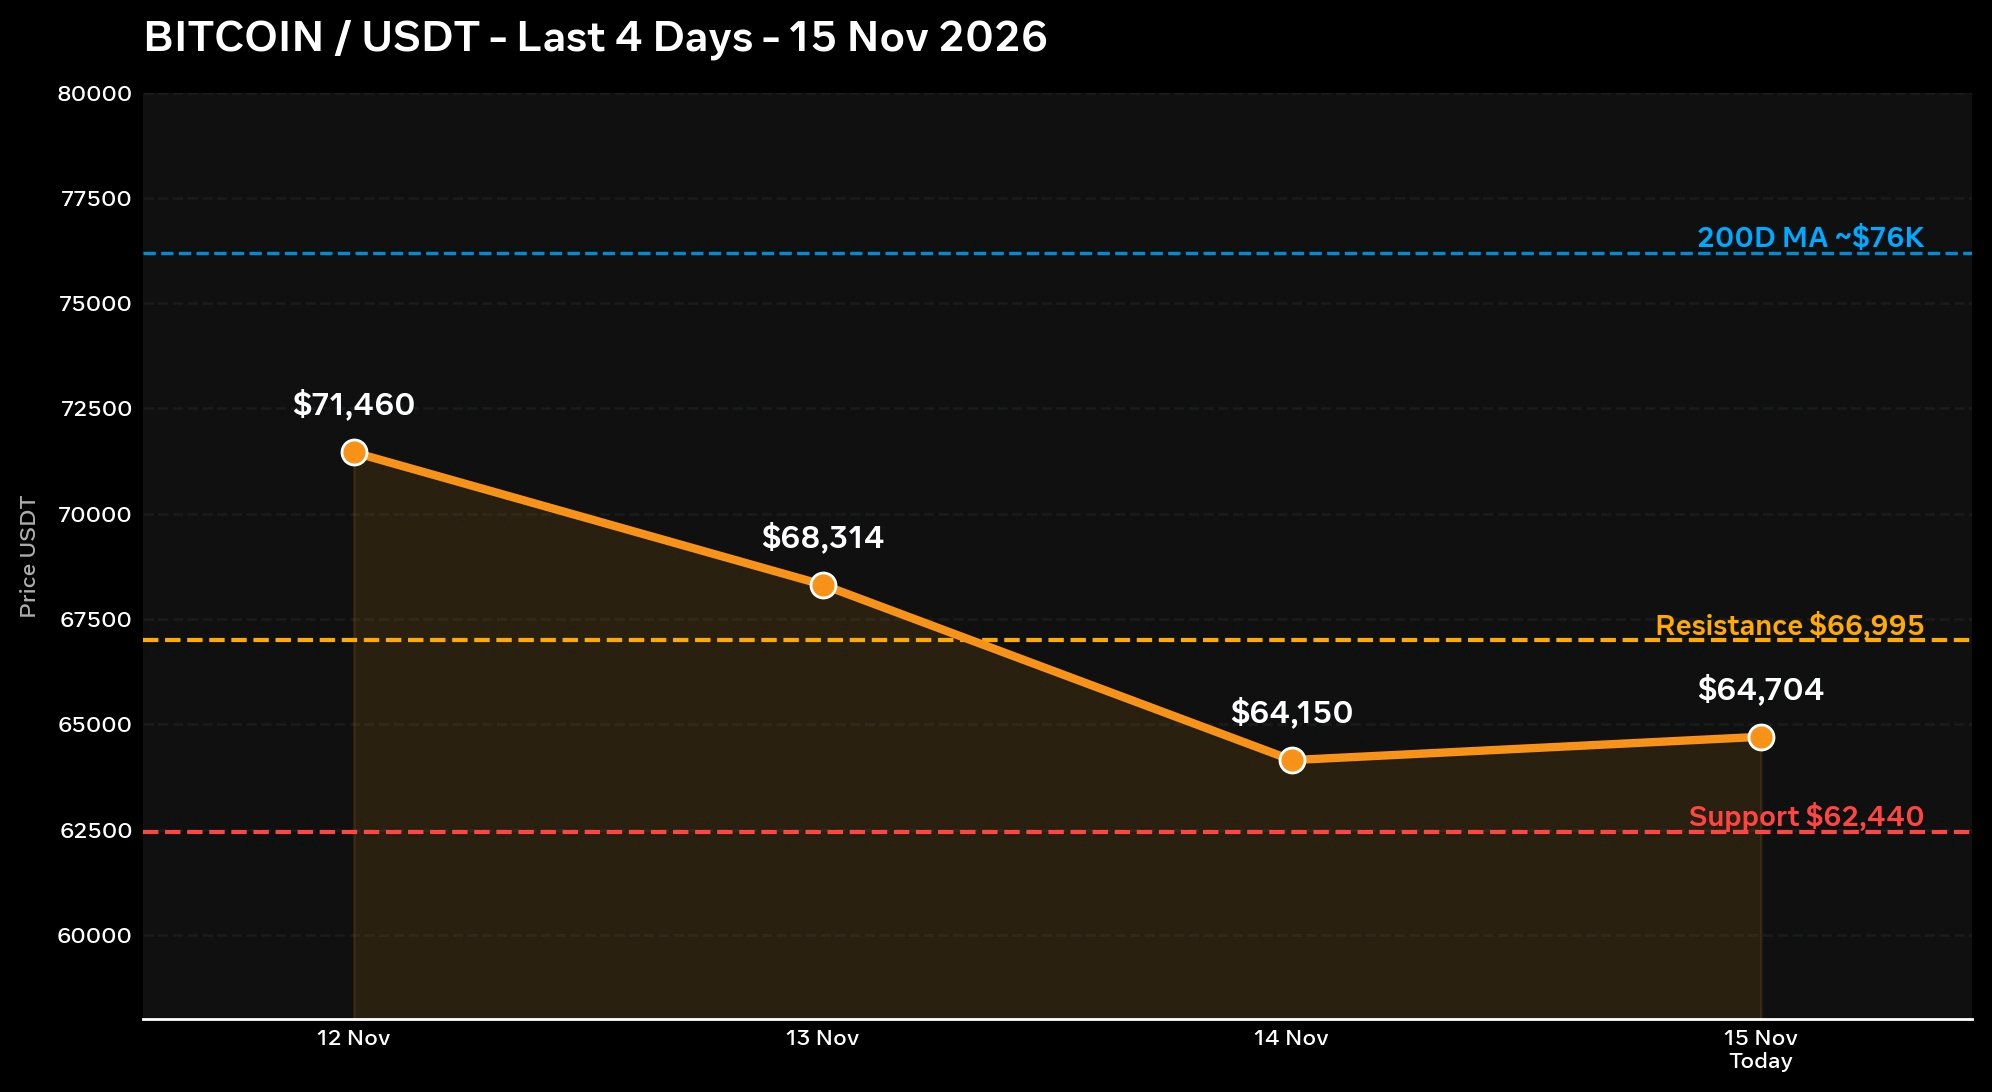
Bitcoin analysis for today, November 15, 2026
Current Price: $64,704 Status: 24h: Down -1.7% - from $65,824 to $64,704 7 days: Down -15.4% 1 month: Down -19.9% From ATH: Down -48.7% from $126,210 Why is it down? ETF: $185M flowed out on Friday, with BlackRock IBIT alone seeing $143M in outflows - this is 11 consecutive days of outflows. Fear & Greed: 10/100 - Extreme Fear RSI: 19 - Heavily oversold, people have been panic selling. Liquidations: $262.9M liquidated in 24h Key Levels: Strong Support: $62,440 - $62,006 - This is today's bottom, if it breaks we're heading to $60,100 where the biggest liquidation sits. First Resistance: $66,995 Second Resistance: $70,147 Major Target: $76,000 Bottom Line: BTC is currently sitting on support, and this area is a Deep Value Zone as analysts say. If it holds $62,440 it will bounce to $67,000*, if it breaks below, it will head to *$60,000. $BTCUSDT $SOLUSDT #WSOT2026 #WSOTShowYourAITradeToEarn10USDT #JensenHuangExitTestsNvidiasAILeadership
#LINK
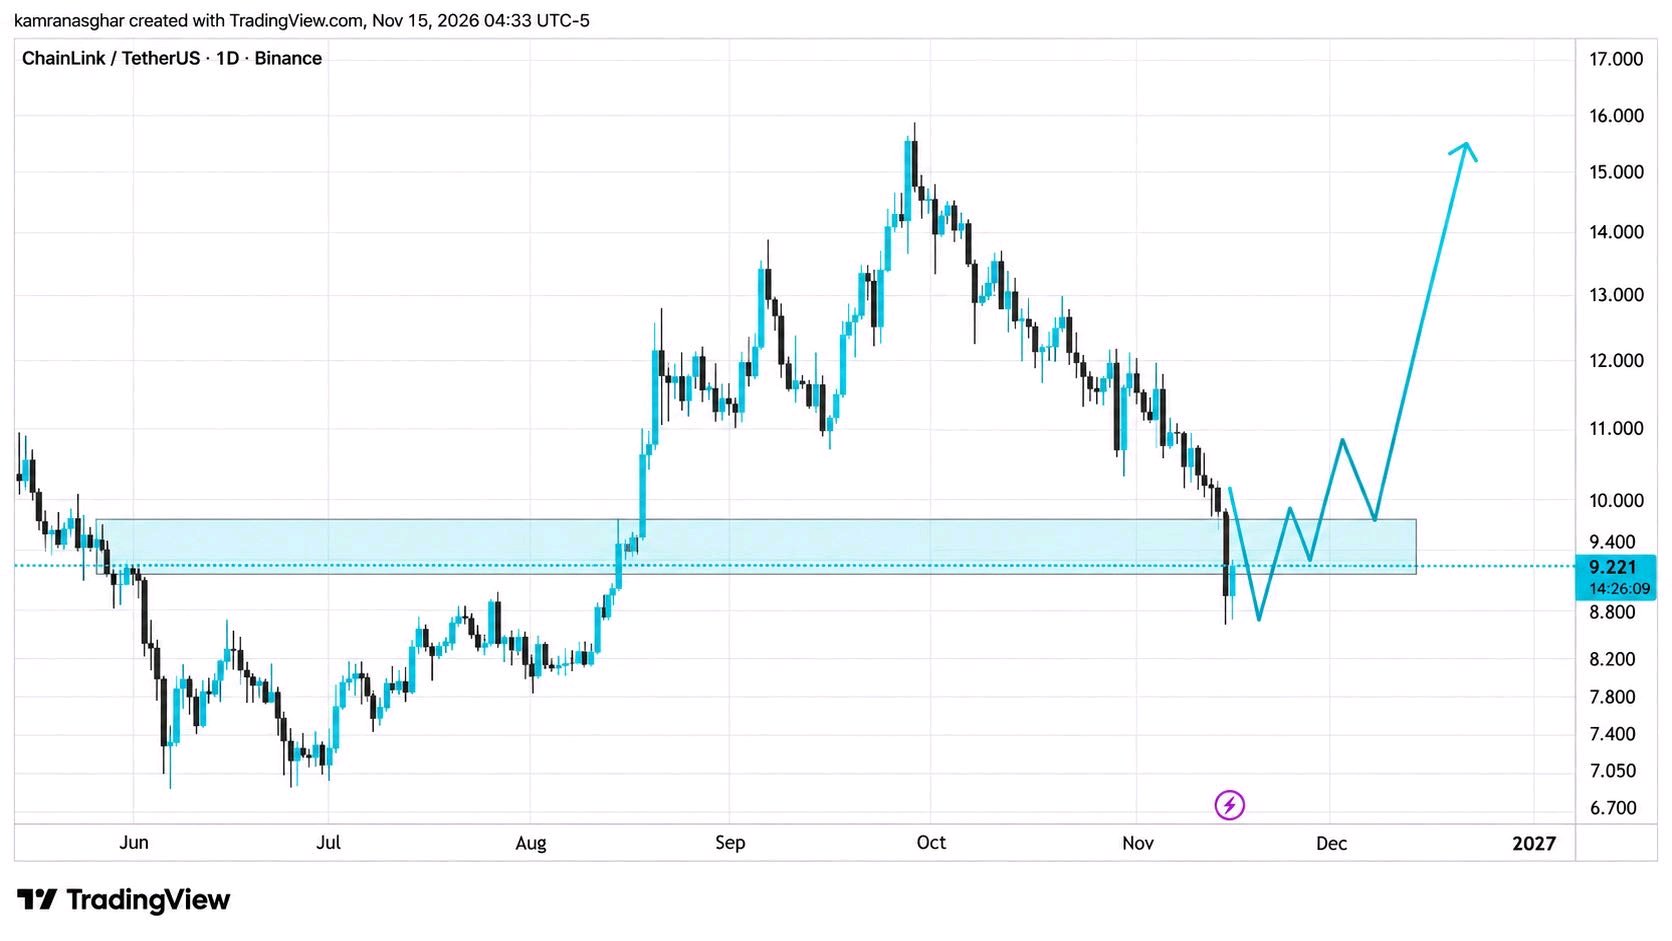
#LINK is testing a key demand zone after a sharp drop in liquidity. A strong bounce here could pave the way for a reversal to higher levels. Watching this zone very closely. #WSOT2026
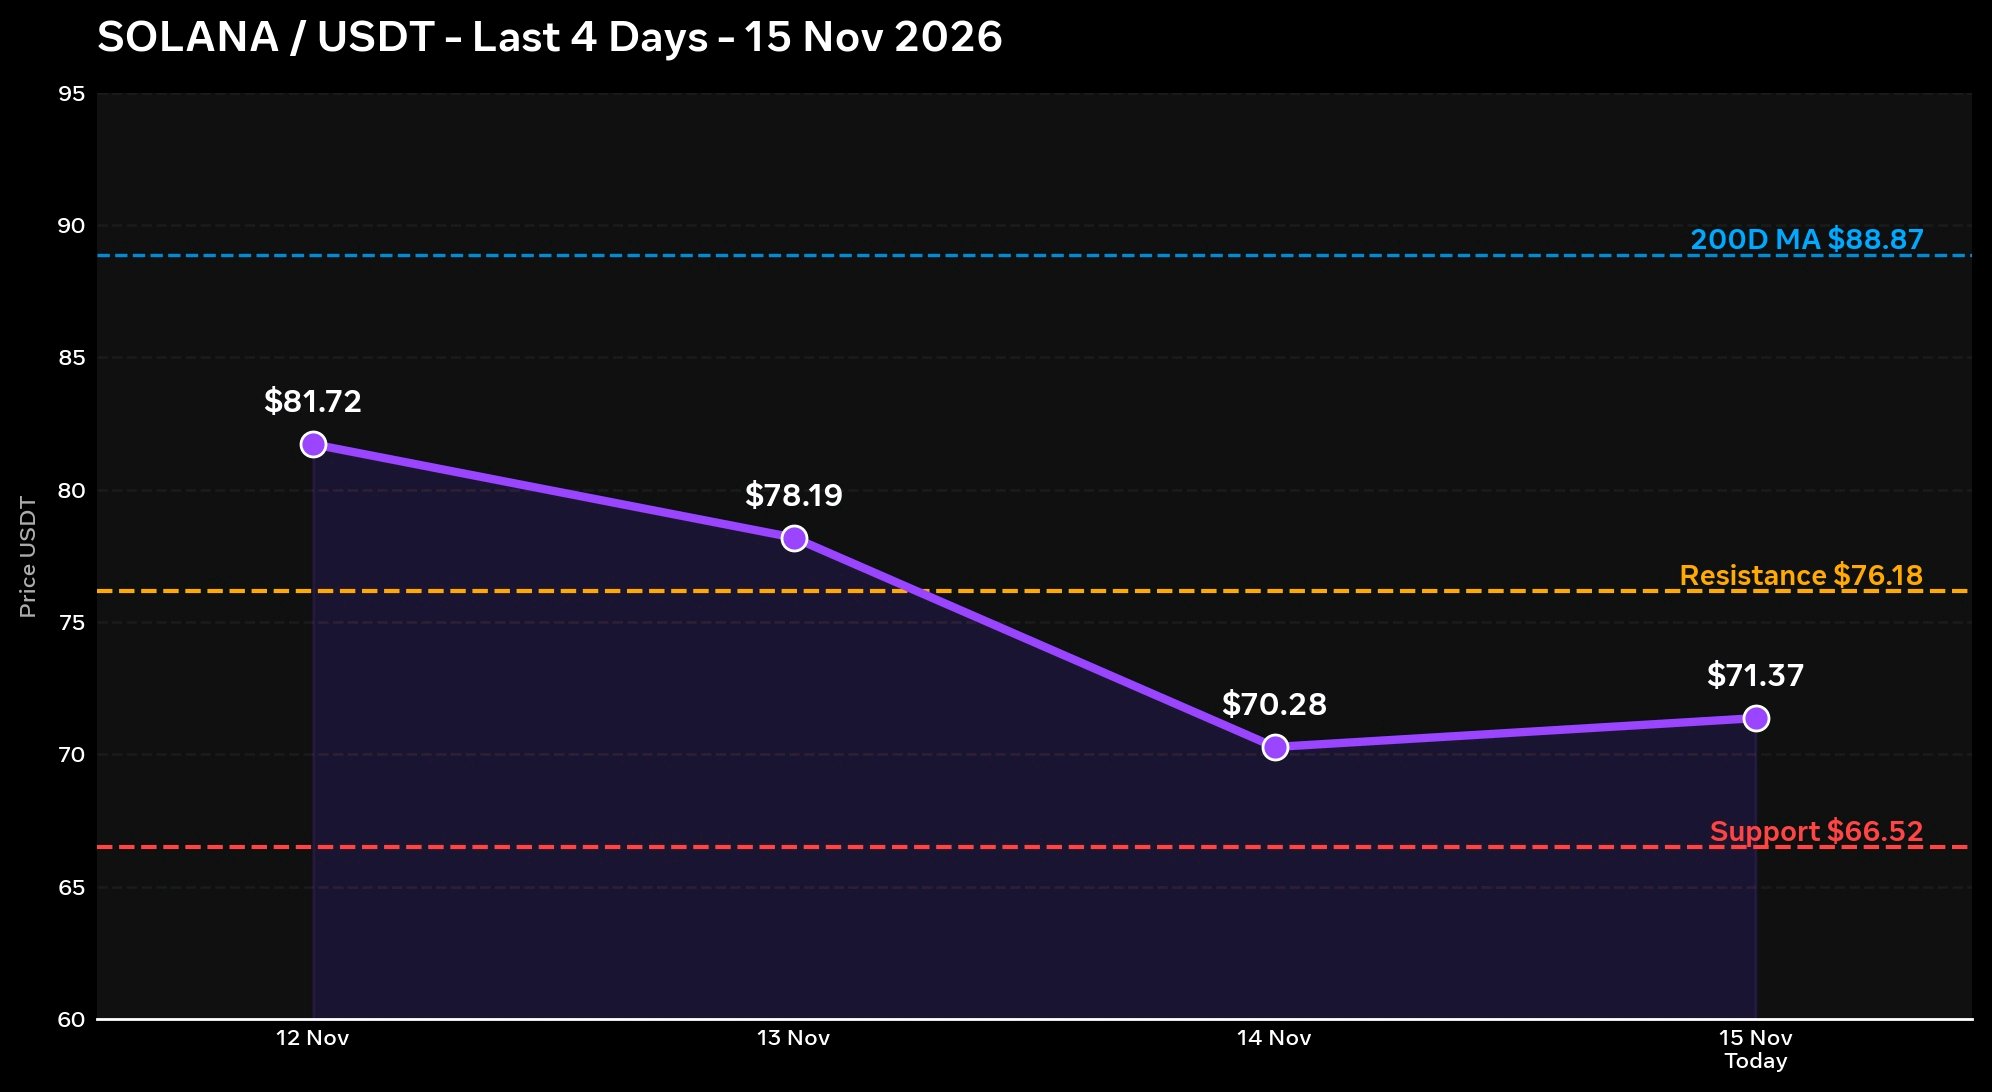
Analysis of SOL coin today, Sunday, November 15, 2026
Current Price: $71.37 Status: 24h: Down -1.5%, but it dropped a lot yesterday 7 days: Down -21.3% 30 days: Down -33.6% From ATH: Down -76% from $293 Why is it down? The whole market is in Extreme Fear SOL ETFs have seen 7 consecutive days of outflows, $58M It dropped below the 200-day moving average of $88.87 - this is a major negative signal Key Levels: Strong Support: $66.52 - $67.40 - this was yesterday's bottom, if it breaks we're heading to $60 First Resistance: $72.46 - needs to get back above this Second Resistance: $76.18 Major Target: $88.87 Indicators: Daily RSI: 14.6 - Extremely oversold, meaning there's been too much selling and a rebound is near Staking: Still 69% of SOL is staked, people haven't run away Summary: SOL is in a dangerous zone right now, but also an opportunity. If it holds $67, it will bounce back to $76, if $67 breaks, it will go to $60.SOLUSDT $PEPEUSDT #USPPITestsTheHigherForLongerTrade #WSOT2026 #WSOTShowYourAITradeToEarn10USDT
PEPE coin analysis for today Sunday
Current price: About $0.00000388 - $0.00000391 a2d8 Status: 24h: Down -12.2% 7 days: Down -19.6% 30 days: Down -5.4% b9d5 Meaning the whole market is down, and PEPE is following. Why is it down? The market entered 'Extreme Fear' - 19/100*, and RSI reached *39 - oversold, meaning people have been selling heavily. Key levels for today: Strong Support: $0.000003689 - If it breaks below this, it will continue to drop. Resistance: $0.000005684 - If it rises above it and closes above it, only then can we say it's starting to go up. Buying Zone: $0.00000355 - $0.00000403 - We are in this zone right now 8437 My summary for you: PEPE is currently in a *Hold / Watch* zone, not the time to panic sell, and not the time to go all in. If you want to buy, split your entry, and your stop loss should be below $0.00000284$PEPEUSDT $XRPUSDT #WSOT2026 #WSOTShowYourAITradeToEarn10USDT #JensenHuangExitTestsNvidiasAILeadership #USPPITestsTheHigherForLongerTrade
Join the WSOT 2026 Preheat Quest. https://i.bybit.com/8MWabqL#WSOTShowYourAITradeToEarn10USDT #WSOT2026

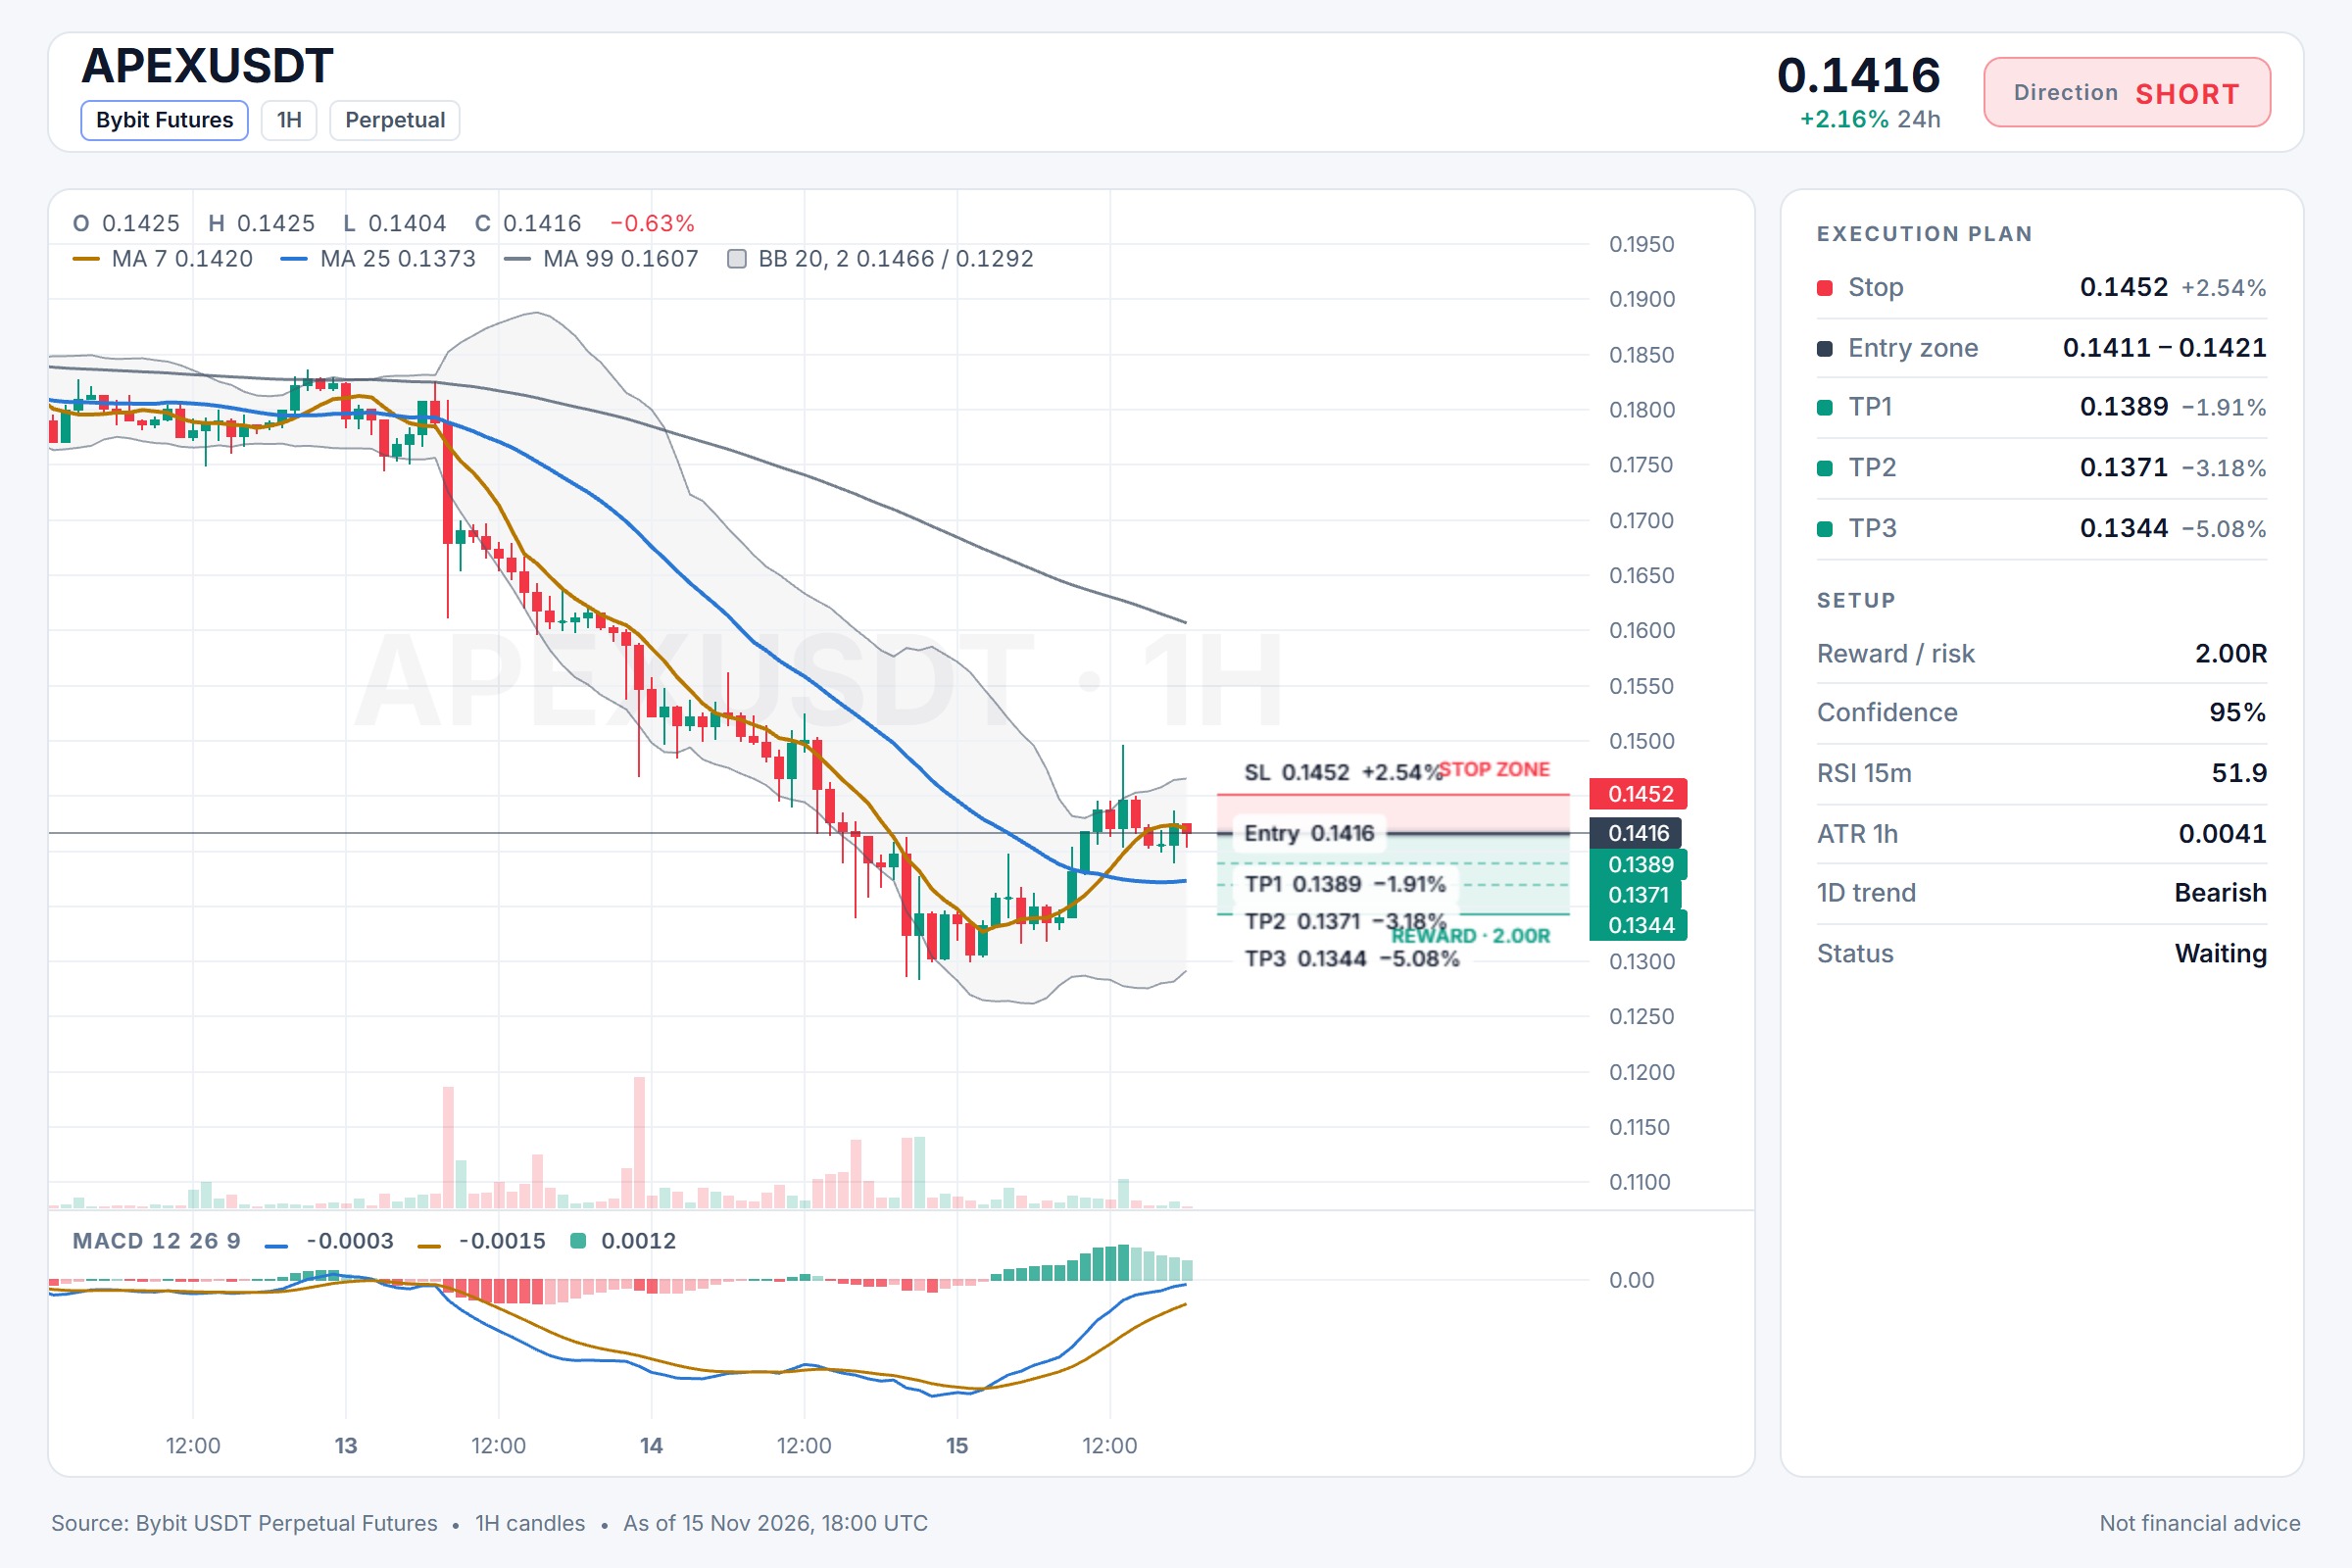
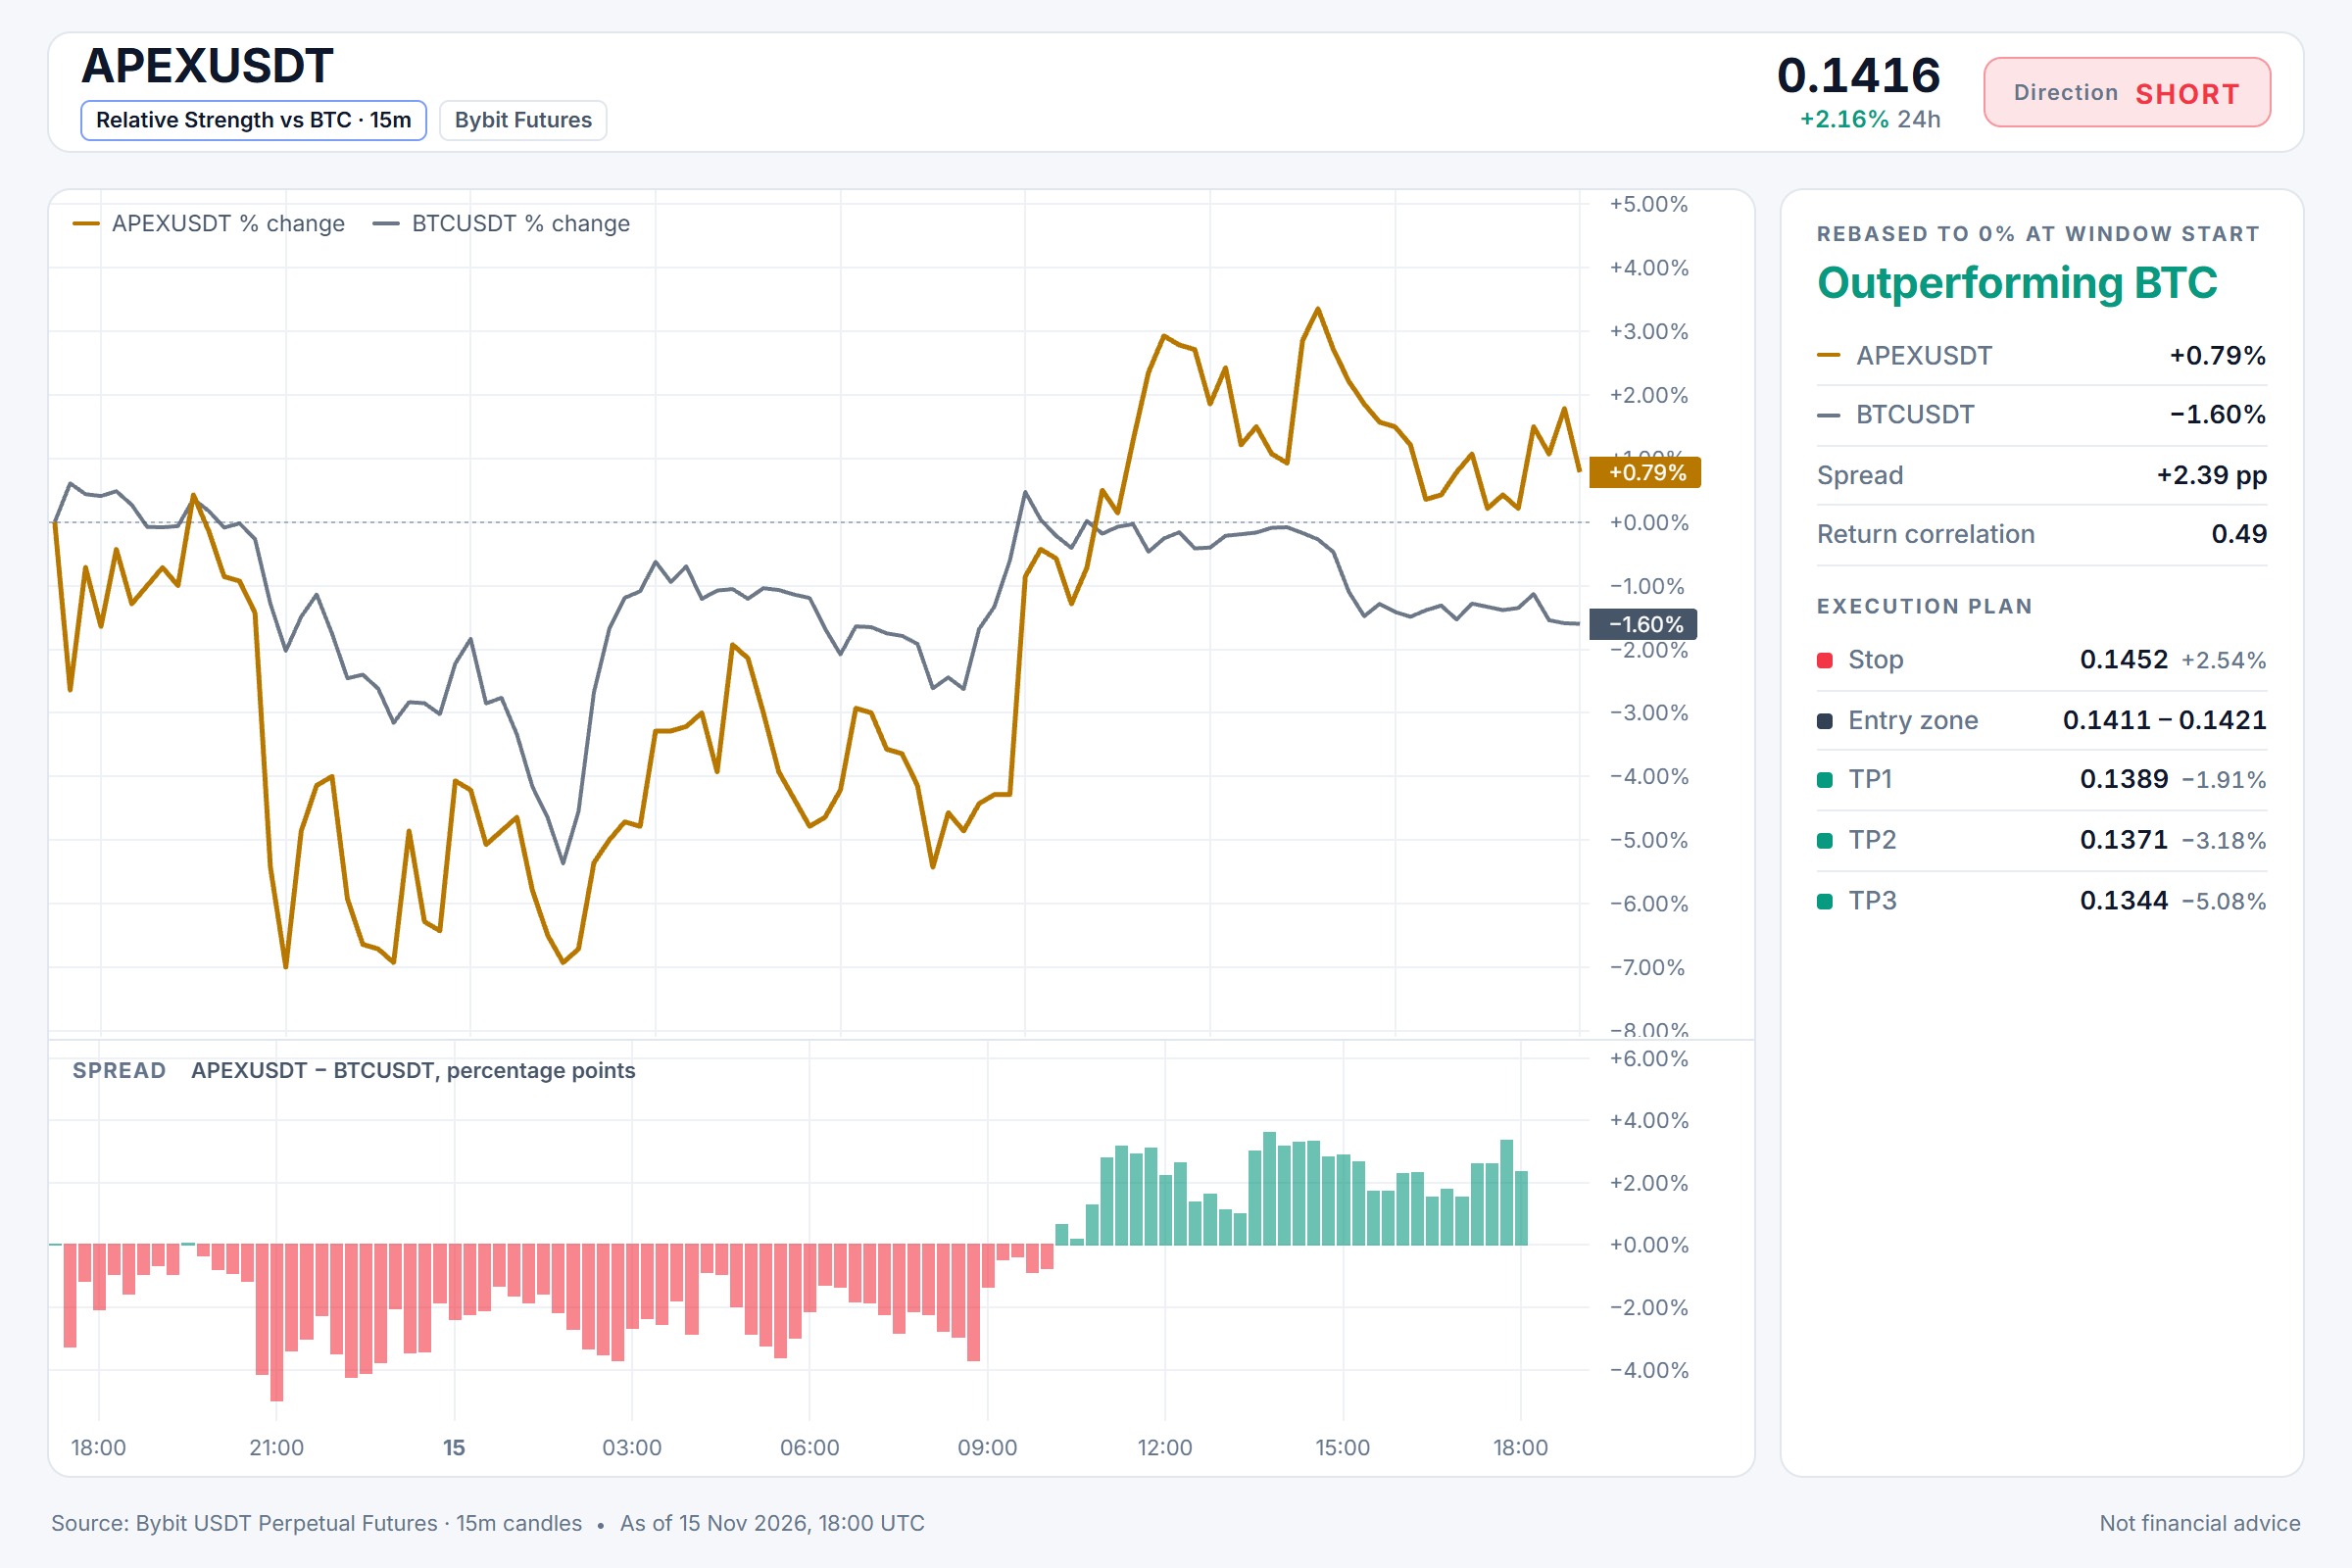
Why this APEX dip might keep descending soon.
$APEX/USDT — SHORT Entry: 0.1411 - 0.1421 SL: 0.1452 TP1: 0.1389 TP2: 0.1371 TP3: 0.1344 With BTC trending bearish and 15m RSI sitting at 51.88, momentum here feels hesitant. APEX drifting into the 0.1411 to 0.1421 entry area could offer a short path toward 0.1371 and possibly 0.1344 if sellers step in. Do you agree this short setup has enough follow-through, or would you wait for a deeper pullback? ⚠️ Personal market analysis only. NFA — manage risk and DYOR. Educational content, not investment advice or a recommendation to buy, sell, deposit, or withdraw any asset. No paid promotion or referral/affiliate links.$APEXUSDT#WSOT2026 #WSOTShowYourAITradeToEarn10USDT
Join the WSOT 2026 Preheat Quest. https://i.bybit.com/8MWabqL#WSOT2026 #WSOTShowYourAITradeToEarn10USDT

XRP
Can Real-World Payments Drive the Next Growth Phase? XRP remains an important project to watch because of its focus on cross-border payments and financial infrastructure. Long-term growth will depend on real adoption, transaction demand, regulatory clarity, and overall market conditions. Short-term price movements can still be volatile, so patience and risk management matter. Do you think payment utility can become a major driver for XRP's future? $XRP #XRP #Crypto #Bybit This is my personal market analysis, not financial advice. Always do your own research (DYOR). $XRPUSDT #WSOT2026 #WSOTShowYourAITradeToEarn10USDT #JensenHuangExitTestsNvidiasAILeadership #USPPITestsTheHigherForLongerTrade #USInflationRunsHotAndRateHikeBetsRise

joiny referl link
https://i.bybit.com/abdqTjI?share_to=link #WSOT2026 #WSOTShowYourAITradeToEarn10USDT #JensenHuangExitTestsNvidiasAILeadership