IMPACTbyTrade
リアルな取引。リアルなインサイト。より大きなIMPACT。 関連する場面では、キャッシュタグを付けてあなたのポジション、取引履歴、そして市場に関する見解を共有しましょう。投稿数よりも、独自のインサイトと真摯なエンゲージメントが重視されます。 対象となるクリエイターは、毎週実施されるTop 100 USDT報酬に参加できます。参加資格、最低IMPACTスコアおよびイベント規約が適用されます。

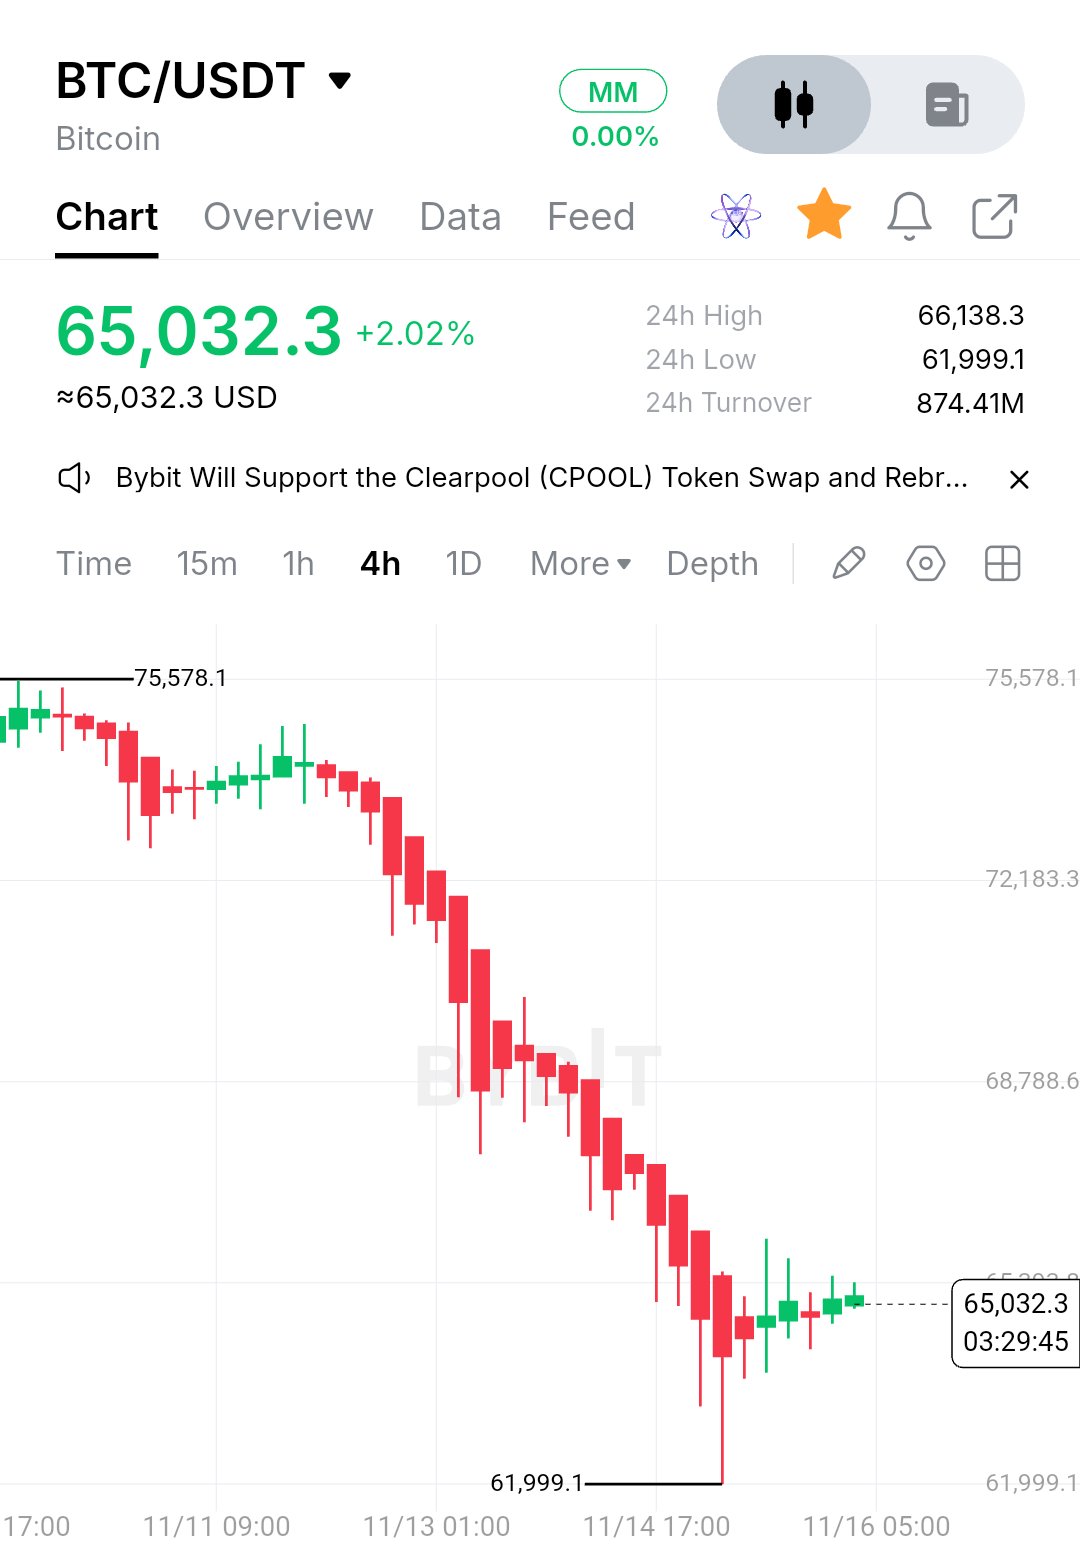
$BTCUSDT — The sell-side expansion has slowed, but Bitcoin has not yet proven a structural reversal. Bitcoin is currently trading around $65,032, showing a short-term recovery of approximately 2.02%. However, looking at the 4H chart, the broader structure remains under pressure after an aggressive bearish displacement from the $75,500 region. 1. MARKET CONTEXT & PRICE ACTION BTC experienced a sustained downside move, breaking through several intermediate support areas without establishing meaningful bullish reactions. Previous demand failed to absorb the selling pressure, allowing sellers to maintain control and push price toward the $61,999 liquidity zone. The reaction from $61,999 is now worth watching. Price has recovered toward $65,000, suggesting that buyers are beginning to respond after the recent sell-side expansion. Nevertheless, this recovery currently looks more like a relief bounce than a confirmed change of market structure. On the 4H timeframe, the dominant structure remains bearish, with lower highs and lower lows still defining the broader move. The immediate objective for buyers is to reclaim nearby resistance and establish a higher low. 2. BUYER VS. SELLER BEHAVIOR The $61,999 area represents an important downside reference. The sharp rejection from this region suggests that sell-side liquidity may have been taken before buyers stepped in. But one bullish reaction does not automatically establish a reversal. For buyers to regain control, BTC needs to: • Maintain acceptance above the $64,000–$65,000 region. • Break and hold above the $65,400–$66,150 resistance area. • Form a higher low on the 4H timeframe. • Demonstrate bullish displacement rather than weak, overlapping candles. If these conditions develop, the recovery could gain structural credibility. On the other hand, repeated rejection around $65,400–$66,150 would indicate that sellers are still defending the supply area. 3. TARGETS & UPSIDE CHECKPOINTS If buyers successfully reclaim nearby resistance, these are the important structural checkpoints: 🎯 $65,400–$66,150: First resistance and immediate recovery confirmation zone. 🎯 $68,000–$68,800: Next major upside checkpoint, approximately 4.6%–5.8% above the current price. 🎯 $70,000–$72,180: Broader recovery objective, approximately 7.6%–11% upside if bullish momentum continues. 🎯 $75,500: Previous major swing region and a potential larger-scale recovery objective. These are conditional technical objectives, not guaranteed price destinations. Each level requires acceptance and confirmation before considering the next. 4. RISK MANAGEMENT & INVALIDATION The bullish recovery thesis depends heavily on BTC maintaining the demand established around $61,999. A decisive 4H breakdown below $61,999, particularly if followed by a failed retest, would invalidate the immediate recovery setup and expose Bitcoin to further downside price discovery. Likewise, rejection from $65,400–$66,150 without a successful reclaim would weaken the short-term bullish argument. Avoid chasing green candles into resistance. Let price establish its direction, identify the liquidity sweep, and wait for confirmation through market structure. 5. FINAL THOUGHT Bitcoin has shown its first meaningful reaction after a substantial bearish expansion, but the market still needs to prove that buyers can do more than temporarily slow the decline. The distinction between an asset's long-term potential and a trade's immediate probability is important. Believing in Bitcoin does not mean ignoring bearish structure, and respecting bearish structure does not mean abandoning bullish opportunities. Trade the confirmation, respect the invalidation, and let price action determine the bias. #IMPACTbyTrade

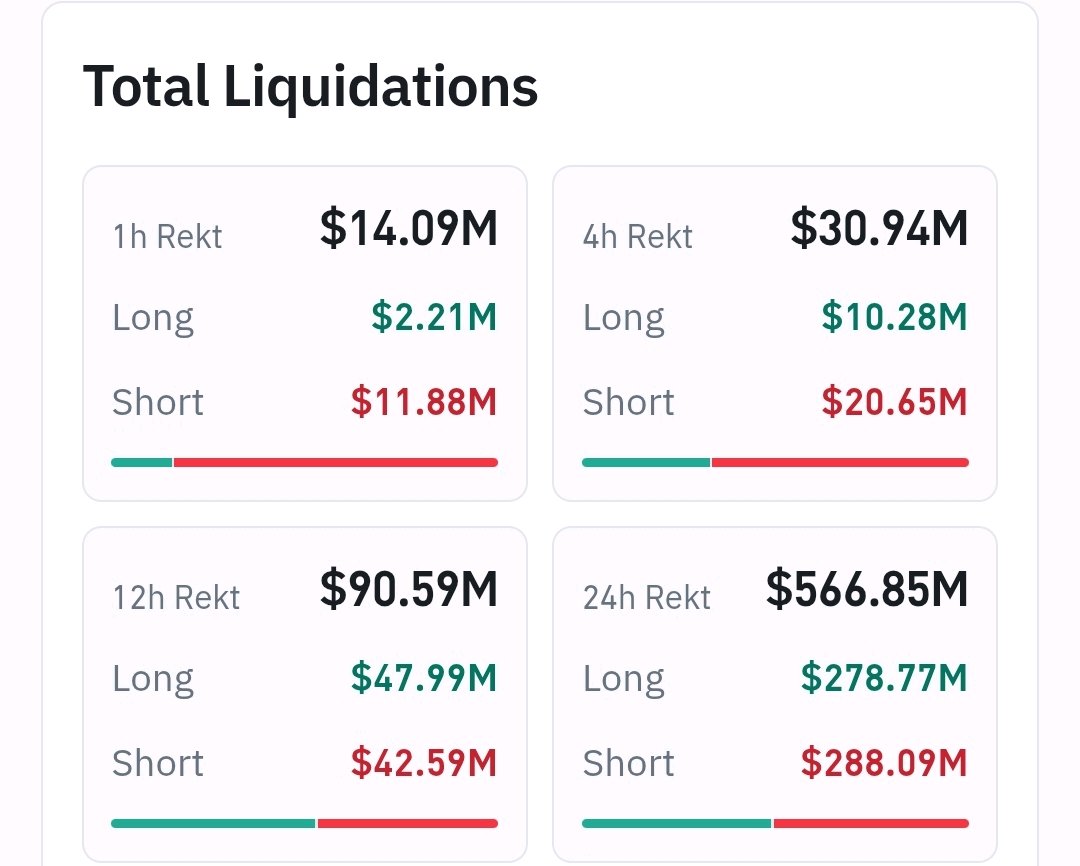
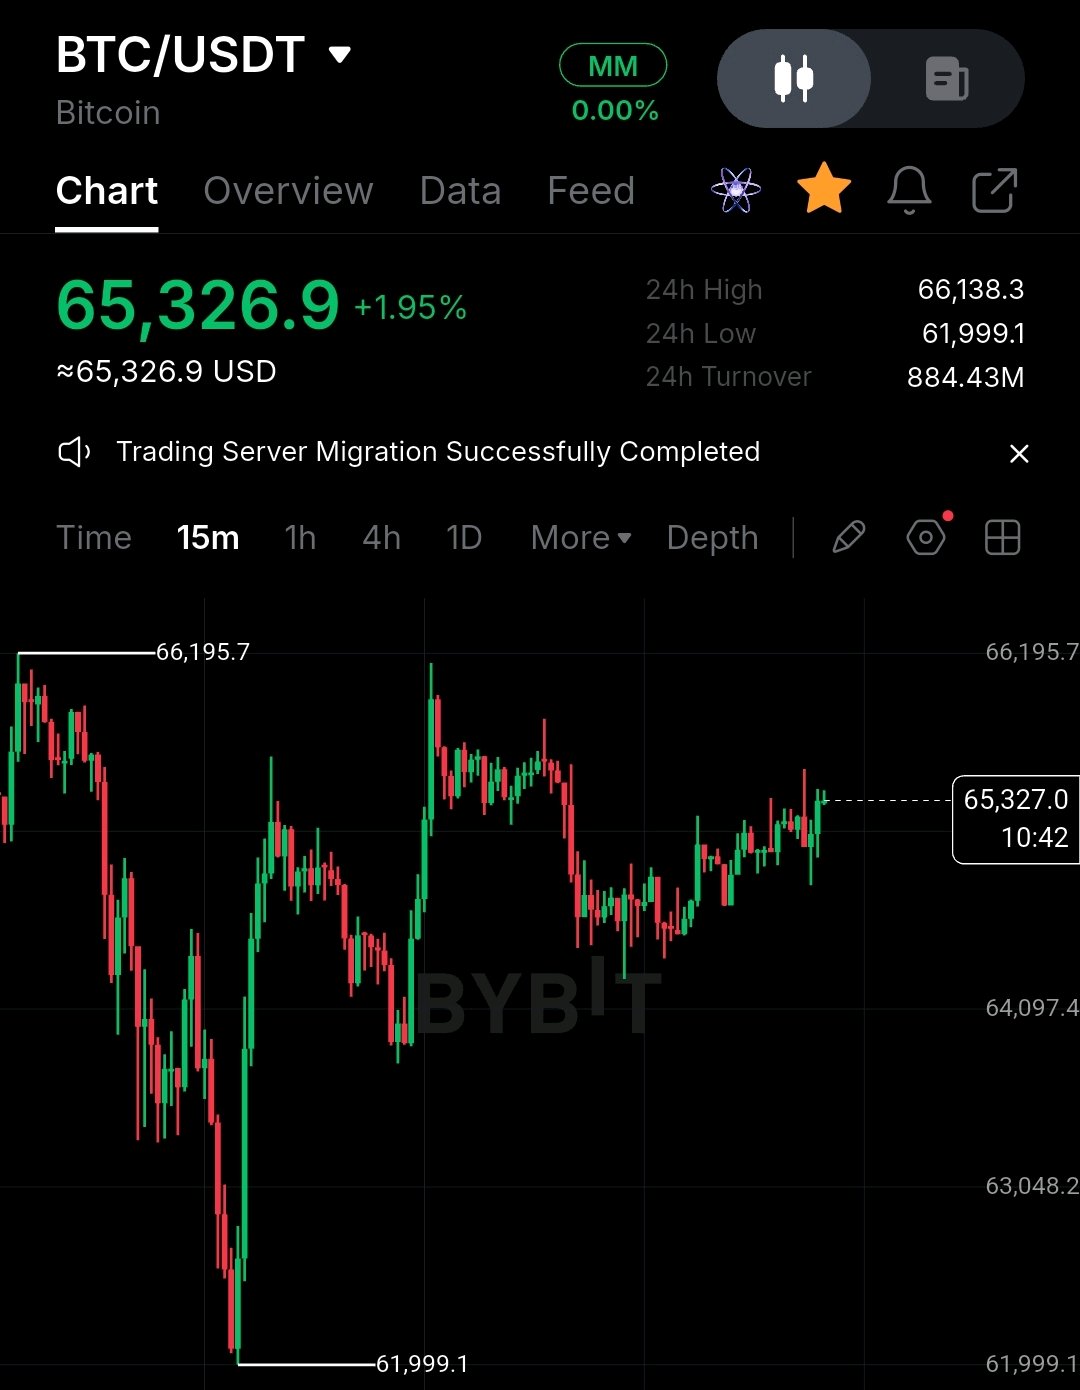
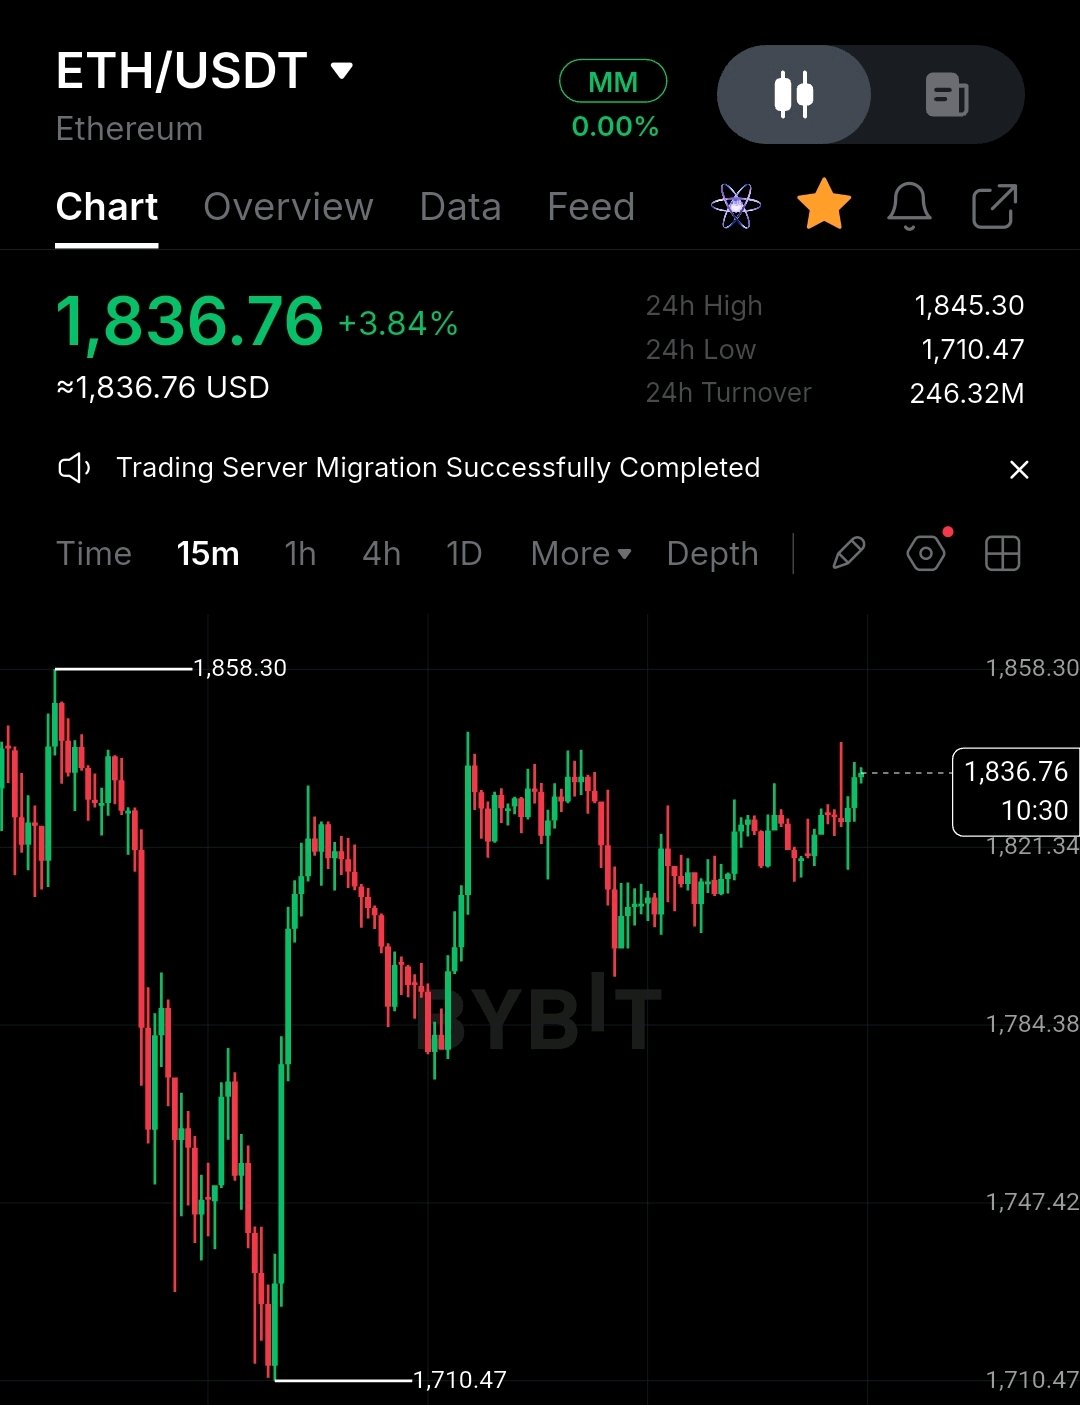
昨日、私が相場について書いた時点では、約19億3000万ドル相当の暗号資産先物ポジションが清算されており、その大部分はロングポジションでした。 今日、過去24時間で約5億6000万ドルが清算され、ロングとショートの割合は現在同程度となっています。これは市場が小幅に回復したことを受けての動きです。$BTC は約62,000ドルから66,000ドル近くまで反発し、現在は65,300ドル付近で推移しています。一方、$ETH は約1,710ドルから1,830ドルまで回復しました。 #IMPACTbyTrade $BTCUSDT $ETHUSDT

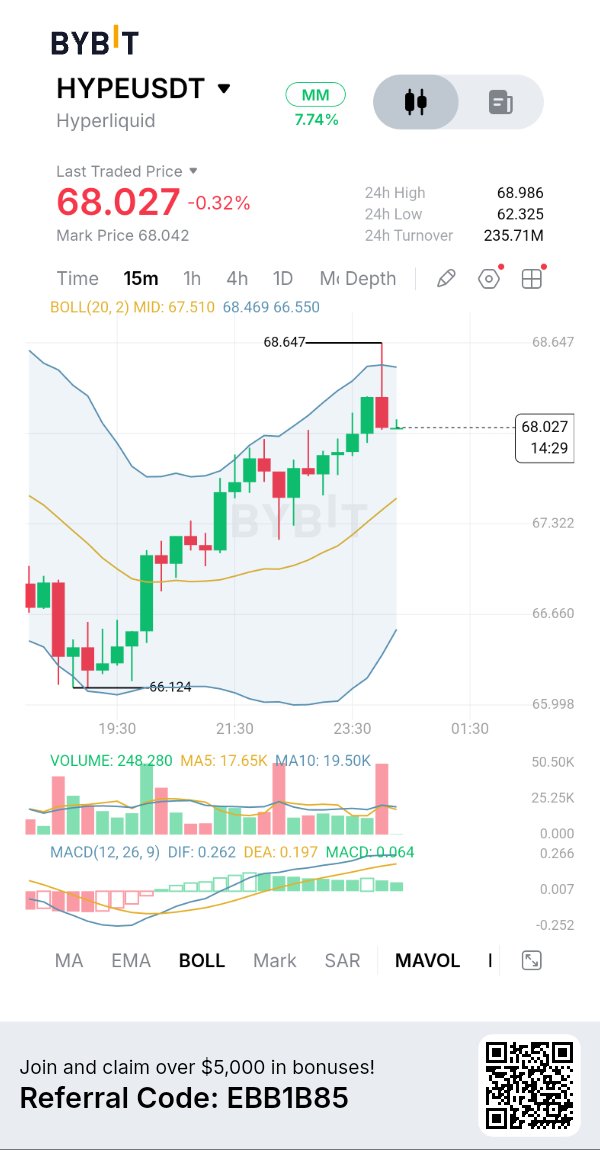
If you think $HYPEUSDT has permanently topped just because the rest of crypto is digital trash, take a hard look at its ever expanding fundamentals Why does this matter? Because Hyperliquid is a revenue machine where every dollar of collateral and every dollar of trading volume contributes to deflationary $HYPEUSDT buybacks More adoption → less circulating $HYPE overtime. Its that simple and no other asset has this. $TSLA ran hard off its early-November low, broke the prior swing high, and is now pulling back. I'm leaning long, but I'm not buying here. I want price to come down into a specific pullback zone first. Chasing the middle of a pullback is how you get a bad entry. The drop from the recent high looks like a retracement inside the up-leg, not a trend change. The 12h still prints higher lows. Why the zone matters: - The 4h, 12h and daily moving averages stack at the same level - The 62% retracement of the last up-leg lands there too - Recent equal lows sit just below it Four separate reasons on one shelf make a bounce there mean more. The ICT read: those equal lows hold a pool of stop orders. A sweep through them that snaps back into the discount zone is the setup I'd take. Targets are the liquidity resting above the recent swing highs. Where I'm wrong: if price gives up the 12h swing low, the daily 200-day average and the bottom of the optimal retracement band together, the pullback read is dead and I step aside. Risks: Nvidia earnings on Nov 18 and December rate-hike worries could shake AI and high-beta names. Thin weekend pricing means the Monday open can gap. Not investment advice. All decisions and responsibility are your own. $BTC has only been oversold on the weekly 4 times in it's entire history 📉 But, an oversold weekly RSI hasn't always marked the final bear-market bottom. 📉 2015: BTC bottomed 210 days later. 📉 2019: Oversold RSI coincided with the bottom. 📉 2022: BTC bottomed 147 days later. 2026: Already 280 days since the initial oversold signal, with a definitive bottom still to be confirmed. When BTC first became oversold this cycle, it was trading around $60,000. Yesterday's flush saw BTC trade as low as $62,000, meaning price has spent 280 days without establishing a sustained recovery. This is the longest period between an initial weekly oversold RSI signal and a confirmed cycle bottom among the historical examples examined. Only in 2019 did the oversold RSI coincide with the final bottom. The other examples tell us, an oversold weekly RSI doesn't guarantee an immediate reversal. Historically, it has often been followed by months of further consolidation or downside before a definitive bottom forms. #IMPACTbyTrade
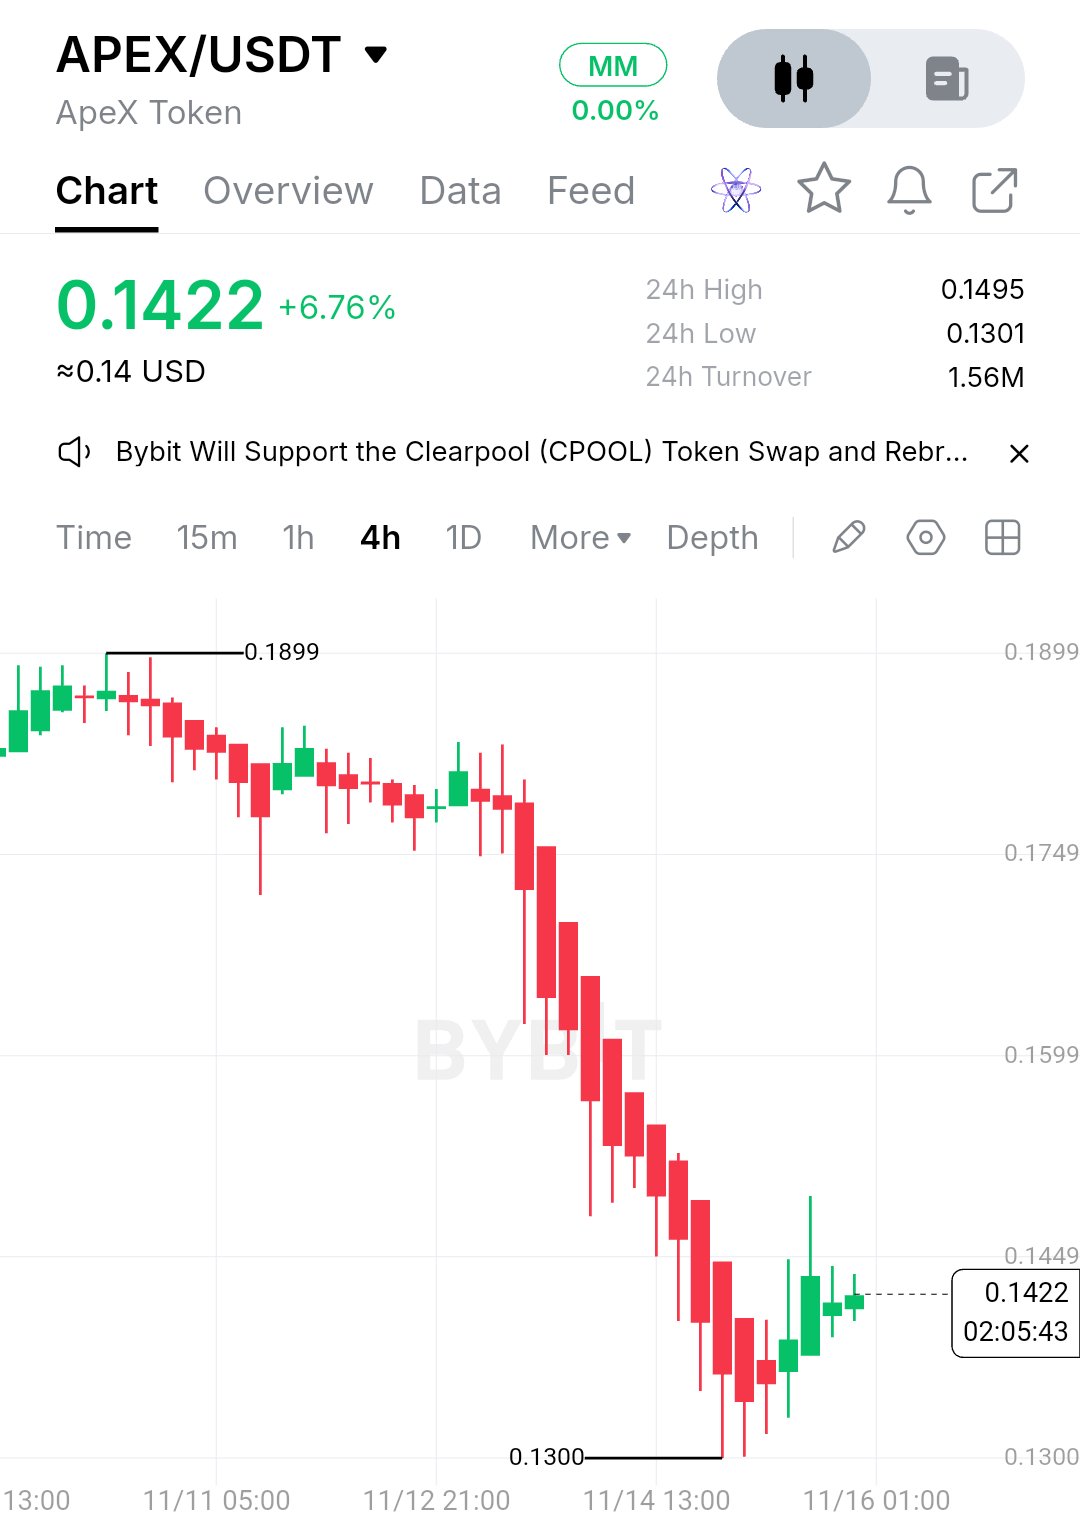
$APEXUSDT はEthereumベースのトークンであり、独立したブロックチェーンではありません。この違いは経済性を見る上で重要です。APEXには独自のネットワーク上のトランザクション数や、中央値のトランザクションサイズ、マイナーの手数料収入、ハッシュレートといった、ブロック報酬と比較可能な数値は存在しません。 したがって、決済手段としての利用状況は、この資産を評価する適切な指標ではありません。APEXは分散型デリバティブ取引エコシステムであるApeX Protocolに紐付いています。 APEXにはステーキング、ガバナンス、そしてプロトコルインセンティブとしての有用性があり、それこそが重要な点です。トークン保有者はAPEX報酬を得ることができますが、現在のバリデーター収入、ステーキング利回り、手数料に対する報酬比率は、入手可能なデータからは個別に算出されていません。APEXにはマイニングの半減期や、価格に織り込むべき独自のブロック報酬削減の仕組みはありません。 私はこれを設計上の欠陥だとは思いません。誰かがトランザクション数を引き合いに出すとき、このトークンにとって重要なのは別の数字、つまり実際のプロトコル活動、手数料の発生、そしてその活動がAPEXへの持続的な需要を生み出しているかどうかです。 直近の市場データによると、APEXは約0.1422ドルで、24時間で約6.8%上昇していますが、7日間では依然として22.6%の下落となっています。4時間足チャートを見ると、0.18ドル付近からの急激な売り越しが0.1300ドル付近まで続き、その後の回復が見て取れます。 その背景には、仮想通貨、米国株、予測市場を含む無期限市場へのApeX Omniの拡大があります。また、ApeXは10月22日のDEX市場比較において、30日間の取引高が116億6,100万ドルに達したと報告されています。これが注目を集めている理由であり、トークン価格の確実な上昇要因ではありません。 この規模の動きの後では、レンジの中間から方向性を判断するのは時期尚早です。以下の水準に注目すべきです。 0.1495ドル以上:この水準を上回って日足が確定すれば、直近の上値抵抗線がサポートとして機能するかが試されます。次の主要な抵抗帯は0.1599ドル〜0.1749ドル付近です。 0.1300ドル以下:この水準を下回って日足が確定すれば、回復が失敗したことを意味します。次の下値領域では新たな価格発見が必要です。 0.1300ドル〜0.1495ドル:目先のレンジで、幅は約15%です。 期間:今後数日間の日足の確定に注目。APEXが回復を維持するには、持続的なプロトコル活動とより強い買い圧力が必要です。0.1300ドルを割り込んで定着した場合、ブレイクアウトのシナリオは無効となります。 #IMPACTbyTrade

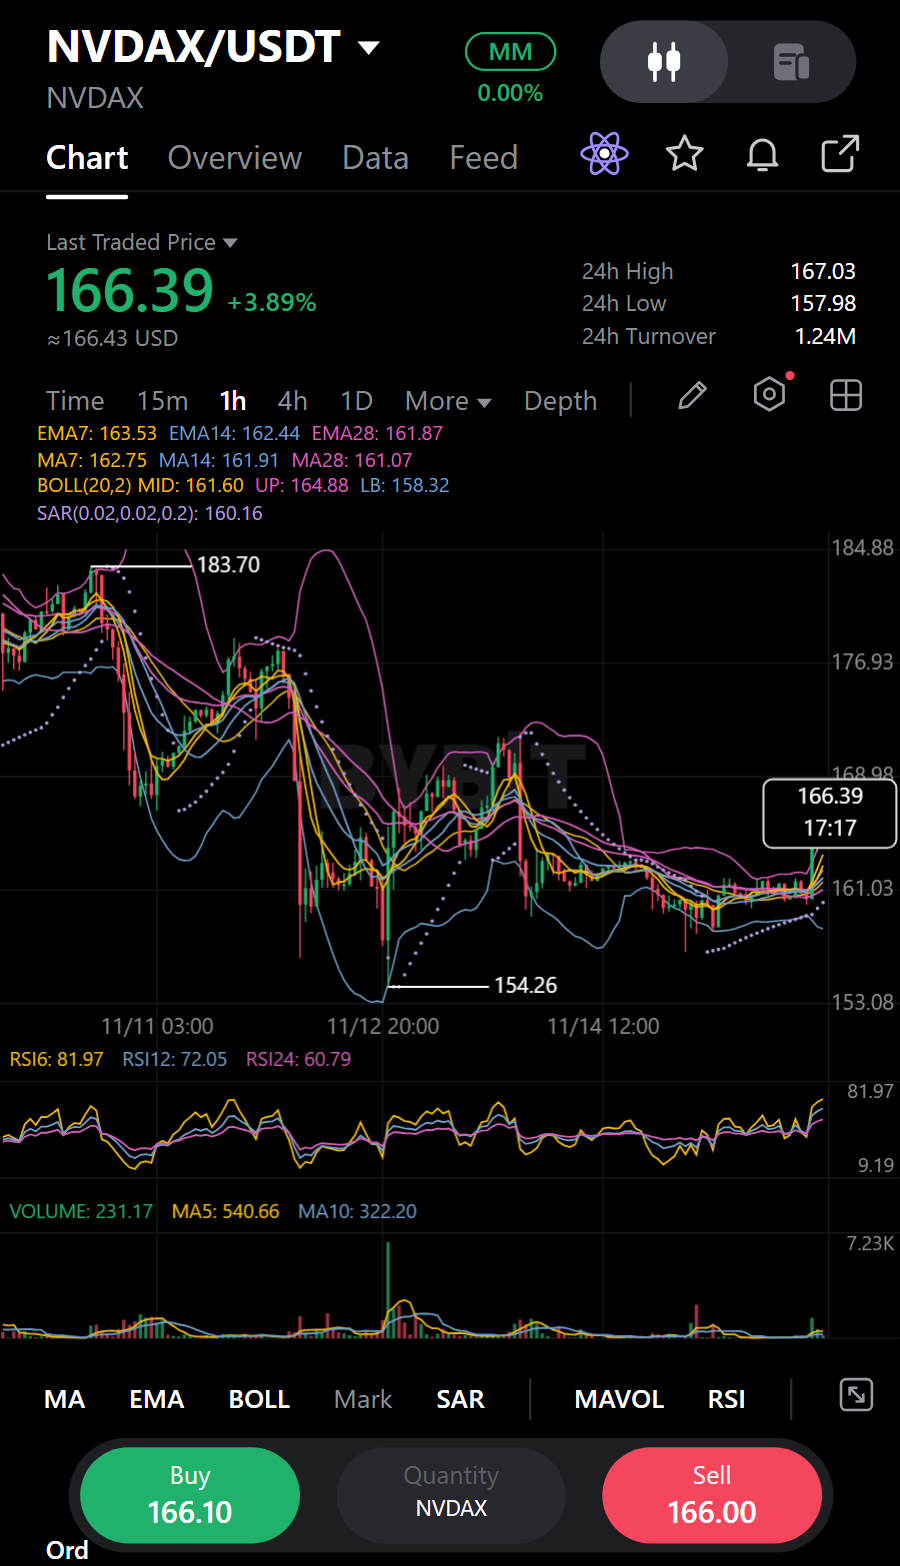
NVDAXUSDT:買い手が守るべき奪還ポイント
鋭い緑の1時間足の急騰により、$NVDAXUSDTは再び移動平均線のクラスターの上に浮上しました。01:00の赤色のローソク足は160.39で引けましたが、02:00のローソク足は160.39から166.52まで急騰し、164.04で引けました。続く03:00の緑色のローソク足は165.4で引けています。これは買い手が力強く参入し、上昇分をすべて吐き出すのではなく、圧力を維持しているように見えます。 価格は現在、MA7、MA14、MA28の上にあり、強気な見方を支持していますが、各移動平均線は大きく乖離しておらず、密集したままです。24時間の値動きはプラスで、出来高は前日より増加しており、この上昇に市場参加が加わっています。この背景は好ましいですが、以前の小さなローソク足は出来高が少なかったため、このブレイクアウトが維持できることを確認したいところです。 私のロングセットアップは、価格が165.8575~166.7625のエントリーゾーンを維持、または再テストするのを見ることです。私はNVDAXの現物を保有しており、ネイティブの保有カードにポジションの詳細が記載されています。163.595のストップロスを下回る動きがあれば、この試みは無効となります。TP1は168.5725、TP2は170.835で、ゾーンの中央値からのリスク・リワード比はそれぞれ約0.8対1および1.7対1です。 価格が損切りレベルを上回り、買い手が再テストを守っている限りは強気派を支持しますが、そのレベルを割り込むと、セットアップが少し崩れるだけでなく、見通し自体を変更することになります。また、急騰はボラティリティのリスクを高めるため、板が薄い中での約定には注意し、最初の突き上げがそのまま走り続けるとは仮定しないつもりです。 トレードプラン(ロング / 強気): • サポート: 157.98 / 154.26 | レジスタンス: 167.03 / 178.7 • エントリーゾーン: 165.8575 - 166.7625 • ストップロス (SL): 163.595 • ターゲット: TP1 168.5725 | TP2 170.835 あなたはこの高出来高のブレイクアウトを信頼しますか、それともエントリーゾーンのより明確な維持を待ちますか? あくまで私個人の見解であり、助言ではありません。#IMPACTbyTrade


BARDは24時間で14%以上下落し、0.0996ドル~0.1274ドルのレンジで推移しており、0.1038ドル近辺で取引されています。価格はセッション安値付近に戻っており、11月18日の供給解除を前に、買い手は0.100ドルを死守する必要があります。 マーケット・スナップショット CoinGlassの最新データによると、時価総額は約4169万ドル、完全希薄化後評価額(FDV)は約1億380万ドルです。循環供給量は約3億9656万ドルと推定され、最大供給量は10億で固定されています。現物取引高は約1406万ドルである一方、先物取引高は1億948万ドルに達しており、現物取引の約7.8倍となっています。 短期的な値動きの大部分はデリバティブが主導しており、現物の流動性は薄い状態です。主に無期限先物主導のリバウンドは、現物の買い手が戻らなければ失速する可能性があります。また、BARDは2026年3月の高値1.716ドルから約94%下落しており、広範なトレンドは深刻なダメージを受けています。 デリバティブとポジション状況 総建玉(OI)は約1953万ドルで、24時間で25.16%減少しました。資金調達率(ファンディングレート)は-0.2183%付近と深くマイナスになっており、これはショート勢がロング勢に支払っていることを意味します。清算額は合計約33万4600ドルで、そのうち約25万1400ドルがロング勢によるものです。現物フローは約120万ドルのマイナス、先物フローは約370万ドルの流出を示しました。 BybitのBARDUSDT無期限先物のスナップショットでは、価格は0.1042ドル付近、OIは約477万ドル(26.2%減)、資金調達率は4時間ごとに-0.0937%付近でした。資金調達率は取引所によって異なるため、集計レートをその契約の正確な数値として扱うのではなく、Bybitのライブフィードをトレードの参考にしてください。ロングポジションは強制決済させられており、ショートポジションを持つコストは高くなっています。これはスクイーズの可能性を生む可能性がありますが、OIの低下と現物フローのマイナスは、新規の買い集め(アキュムレーション)を確認するものではありません。 テクニカル構造 目先の防衛ラインは0.1000ドル~0.0996ドルです。CoinGlassも0.1000ドル付近に先物の買い壁を特定しています。ここが維持され、価格が0.1070ドルを奪還すれば、安定化の最初の兆候が見えてきます。その上では、0.1100ドルと0.1139ドルが次のレジスタンスエリアとなります。 もし0.0996ドルを明確に割り込んだ場合、0.0964ドル、続いて0.0930ドルを注視してください。下ヒゲをつけた後に0.1000ドルを素早く回復すれば弱気シグナルは弱まりますが、この水準を下回る終値が続けば売り手が主導権を握り続けるでしょう。 ファンダメンタルズ Lombardは、ビットコインに特化したオンチェーン金融インフラを構築しています。主力製品であるLBTCは、BTCを売却することなくDeFiにアクセスできるように設計されたリキッドビットコイン資産です。DeFi統合を通じて、ビットコインを生産的な担保にすることを目指しています。 LBTCはビットコイン連動型資産であり、BARDは別のガバナンストークンです。BARDはビットコインに裏打ちされておらず、BTC準備金の所有権を表すものでもありません。LombardのLBTCイールド戦略は進化しており、公式ドキュメントでは、以前のビットコインステーキングモデルに依存するのではなく、オプションプレミアムを生成するカバードコール戦略であると説明されています。利回りは変動制であり、保証されていません。 このテーゼは、LBTCの採用、流動性、およびプロトコル手数料に依存しています。TVL(預かり資産)だけでは十分ではなく、プロダクトの成長が自動的にBARDへの需要を生むわけではありません。 トークンのユーティリティとトークノミクス BARDはLombardのガバナンストークンであり、そのユーティリティはプロトコルの発展とともに進化するように意図されています。以前のステーキングプログラムは終了しており、エアドロップの請求も終わっています。BARDを保有していても、自動的に利回りやプロトコル収益の分配が得られるわけではありません。 公式の割り当ては、エコシステムに35%、主要な貢献者に25%、財団に20%、初期投資家に20%となっています。最大供給量は10億で固定されており、残りのトークンはローンチ後48ヶ月かけて段階的にアンロックされる予定です。そのため、比較的小規模な時価総額においては、供給タイミングが重要となります。 次回のアンロックリスク Tokenomics.comによると、次回のリリースは11月18日です。約2281万BARDが放出され、これは総供給量の2.3%に相当し、現在の評価額での時価総額の約5.6%に相当します。受け取り手にはインサイダー、コミュニティ、プライベート投資家、財団が含まれます。必ずしも売り圧力がかかるとは限りませんが、短期的な供給過剰懸念を生じさせます。 トレードシナリオ 強気:0.0996ドル~0.1000ドルを死守し、0.1070ドルを奪還し、現物出来高を伴って0.1139ドルをクリアする。深いマイナスの資金調達率がショートカバーを加速させる可能性があり、その場合は0.1200ドルが次のターゲットになります。 弱気:0.0996ドルを割り込み、奪還に失敗する。これにより0.0964ドル、続いて0.0930ドルが意識されます。アンロックに向けて現物売出が続けば、先物主導のリバウンドも打ち消されるでしょう。 私が監視しているレベルマップは以下の通りです: - 直近のサポート:0.1000ドル~0.0996ドル - レジスタンス:0.1070ドル、次いで0.1100ドル~0.1139ドル - 強気の確認:0.1139ドルを現物出来高の増加を伴って明確に上抜けること - 弱気のシグナル:0.0996ドルを割り込み、奪還に失敗すること 私のスタンスは守勢ですが、スクイーズの可能性は残っています。資金調達率は極端にマイナスで、OIは急激に縮小しましたが、現物フローは依然として弱く、11月18日のアンロックも迫っています。0.100ドルが維持され、買い手が0.107ドルを奪還するまで待ち、その後でリカバリーを検討したいと考えています。あなたはサポートライン付近で早めにエントリーするリスクを取りますか、それともアンロック後に確認してからエントリーしますか?BARDUSDT #IMPACTbyTrade

$XRPUSDT これは買いのチャンスか、それとも警告のサインか? XRPは大きな売り圧力にさらされており、市場の確認が特に重要になっています。 私は以下を注視しています: XRPが直近の安値を維持できるかどうか。 買い手がより強い出来高を伴って戻ってくるかどうか。 仮想通貨市場全体が回復の兆しを見せ始めるかどうか。 確認なしに下落相場で拾おうとするのはリスクを伴います。 賢明なトレーダーは感情に従うのではなく、プライスアクションを見ます。 XRPホルダーの皆さん、辛抱強く待っていますか?それとも、より強力な回復のシグナルを待っていますか? #IMPACTbyTrade

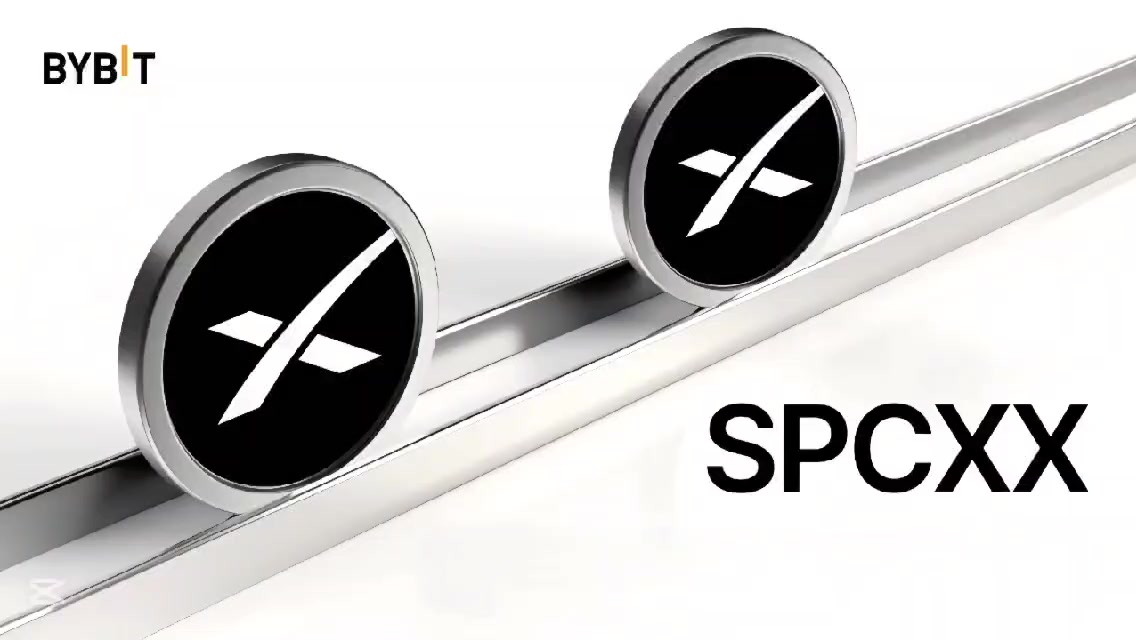
🚀 SpaceX xStockのチャートは、ヘッドラインが出る前から複雑なシグナルを点滅させていました。最近の調整局面において、$SPCXXUSDTの日足チャートで重要な動きがありました。167.05の高値から急落した後、価格は120.55で強力なサポートを形成しました。 その安値からの回復はアグレッシブなものでしたが、テクニカル分析が示唆していた通り、フィボナッチ・エクステンションの1.0レベルである135.35と、1.618レベルの138.61で正確に失速しました。 EMA50は144.05とより高い位置にあり、依然として上値を抑える天井として機能しています。 チャートは139.13付近の価格を捉えており、日足ローソク足はまだ確定しておらず、RSIは50台半ばまで回復しています。 しかし、本当のストーリーは流動性マップ(リクイディティ・マップ)にあります。 CoinglassのSPCXX清算ヒートマップを見ると、現在の価格のすぐ上に2つの巨大なレバレッジ・クラスターが存在していることがわかります。 140に厚い流動性が集中しており、そのすぐ下の138にも別の高密度な帯があります。これらはレバレッジ・ポジションが積み上がっているゾーンであり、プライスアクションを引き寄せる磁石のように機能します。 価格がこのようなクラスターに接近すると、市場はしばしばその流動性を狩りにいき、ストップロスを巻き込み、清算を強制してから本格的な方向性を決定します。 最近のヘッドラインがボラティリティにコンテキストを加えました。SpaceXはインサイダーによるロックアップ解除の波に直面しており、最近市場に出回った5,910万株の放出に加え、さらに大規模な3億1,900万株のロックアップ解除がありました。 同社はまた、米国宇宙軍向けの機密国家安全保障ミッションを立ち上げましたが、これが市場にファンダメンタルズ的なノイズを加えています。 しかし、ここで最も興味深いのは 🤔 138〜140ゾーンでのチャートの拒絶と清算ヒートマップが、ロックアップ解除のニュースが出る前から同じストーリーを語っていたという事実です。 だからこそ、プライス構造とポジショニングの両方を常にセットで分析すべきなのです。プライスアクションは買い手がコントロールを失っている場所を明らかにし、ヒートマップは市場がどこで最も脆弱であるかを明らかにします。 チャートは特定のイベントを予測することはできませんが、激しい動きを引き起こす可能性が高い方法でレバレッジが積み上がっている時に、私たちに警告を発してくれます。 本日のトレーディングの視点 SPCXXは現在、2つの力に挟まれています。ヒートマップが示唆するのは、価格が140を突破してその上で維持できれば、上方の流動性が燃料となり、EMA50の144.05およびフィボナッチ・エクステンション2.618の143.88に向けたショートスクイーズが発生する可能性があるということです。 しかし、より大きなチャンスは下方にあると考えています 🙂↕️ もし138のサポートが失敗し、ヒートマップの下方流動性クラスターが掃討されれば、134〜135ゾーン、そして究極的には売圧が加速した場合の主要な需要ブロックである120.55への明確な道が見えます。 そこが、私がロングセットアップを検討する際に特に興味を持つポイントです。 単に価格が私のボックス圏内に達したという理由だけで買うつもりはありません。 意味のある強気な反応、マーケット構造の変化、そして買い手が新たな高値圏(Higher Low)を守れるという証拠を確認したいのです。 その時初めて、153〜167の領域に向けた回復、そしてファンダメンタルズのカタリストが一致すればそのエリアを超えて新たな高値をつける可能性を視野に入れてポジションを取ります。 リスク管理 ⚡️ 現時点ではまだ確実なロングエントリーはありません。私のストップロスとリスク・リワード比は、実際の強気の確認とエントリー価格次第です。 134.75を下回り、説得力のある回復がないまま維持されれば、私の強気セットアップは無効となり、無理にトレードせずに静観します。 また、SPCXXは実際のSpaceX株ではなく、トークン化されたデリバティブであることも重要です。24時間365日の価格エクスポージャーを提供しますが、株主権利や配当は伴いません。そのため、エントリー時にはトークン独自の流動性と、マクロ経済の不確実性がもたらす広いスプレッドを考慮する必要があります。 私は、条件が満たされる前に資金を投じるよりも、回復の初期段階を見逃す方を選びます。正確な底値を捉えることよりも、忍耐の方が重要なのです。 Nvidia最新アップデート 🖥 Nvidia $NVDAXUSDTに関しては、最近のヘッドラインリスクを考慮し、慎重な姿勢を維持しています。 Nvidia株は非常にボラティリティが高く、CEO関連の調査報道により一時8.8%下落して170.24となりましたが、その後は損失を縮小し179.35付近で推移しています。 リテール投資家が積極的に買い向かっており、セッション開始30分間で1億1,100万ドルの純買いが報告されたことは、依然として強い押し目買いの関心があることを示しています。 私はNvidiaの長期的なAIポテンシャルには強気ですが、有望なビジネスストーリーと確実なトレーディング・エントリーを混同するつもりはありません。 株価はいくつかの指標で売られすぎの状態にあり、リリーフラリー(自律反発)の可能性はありますが、ヘッドラインによる上値圧力が残っているため、構造は依然として脆弱です。 現時点では、新たなポジションを取る前に、より強力な価格構造を確認しようと考えています。 確認を待つことを選んだからといって、チャンスが消えるわけではありません 😏 #IMPACTbyTrade #ジェンスン・ファン、NvidiaのAIリーダーシップを試す出口戦略

xmlmusdt
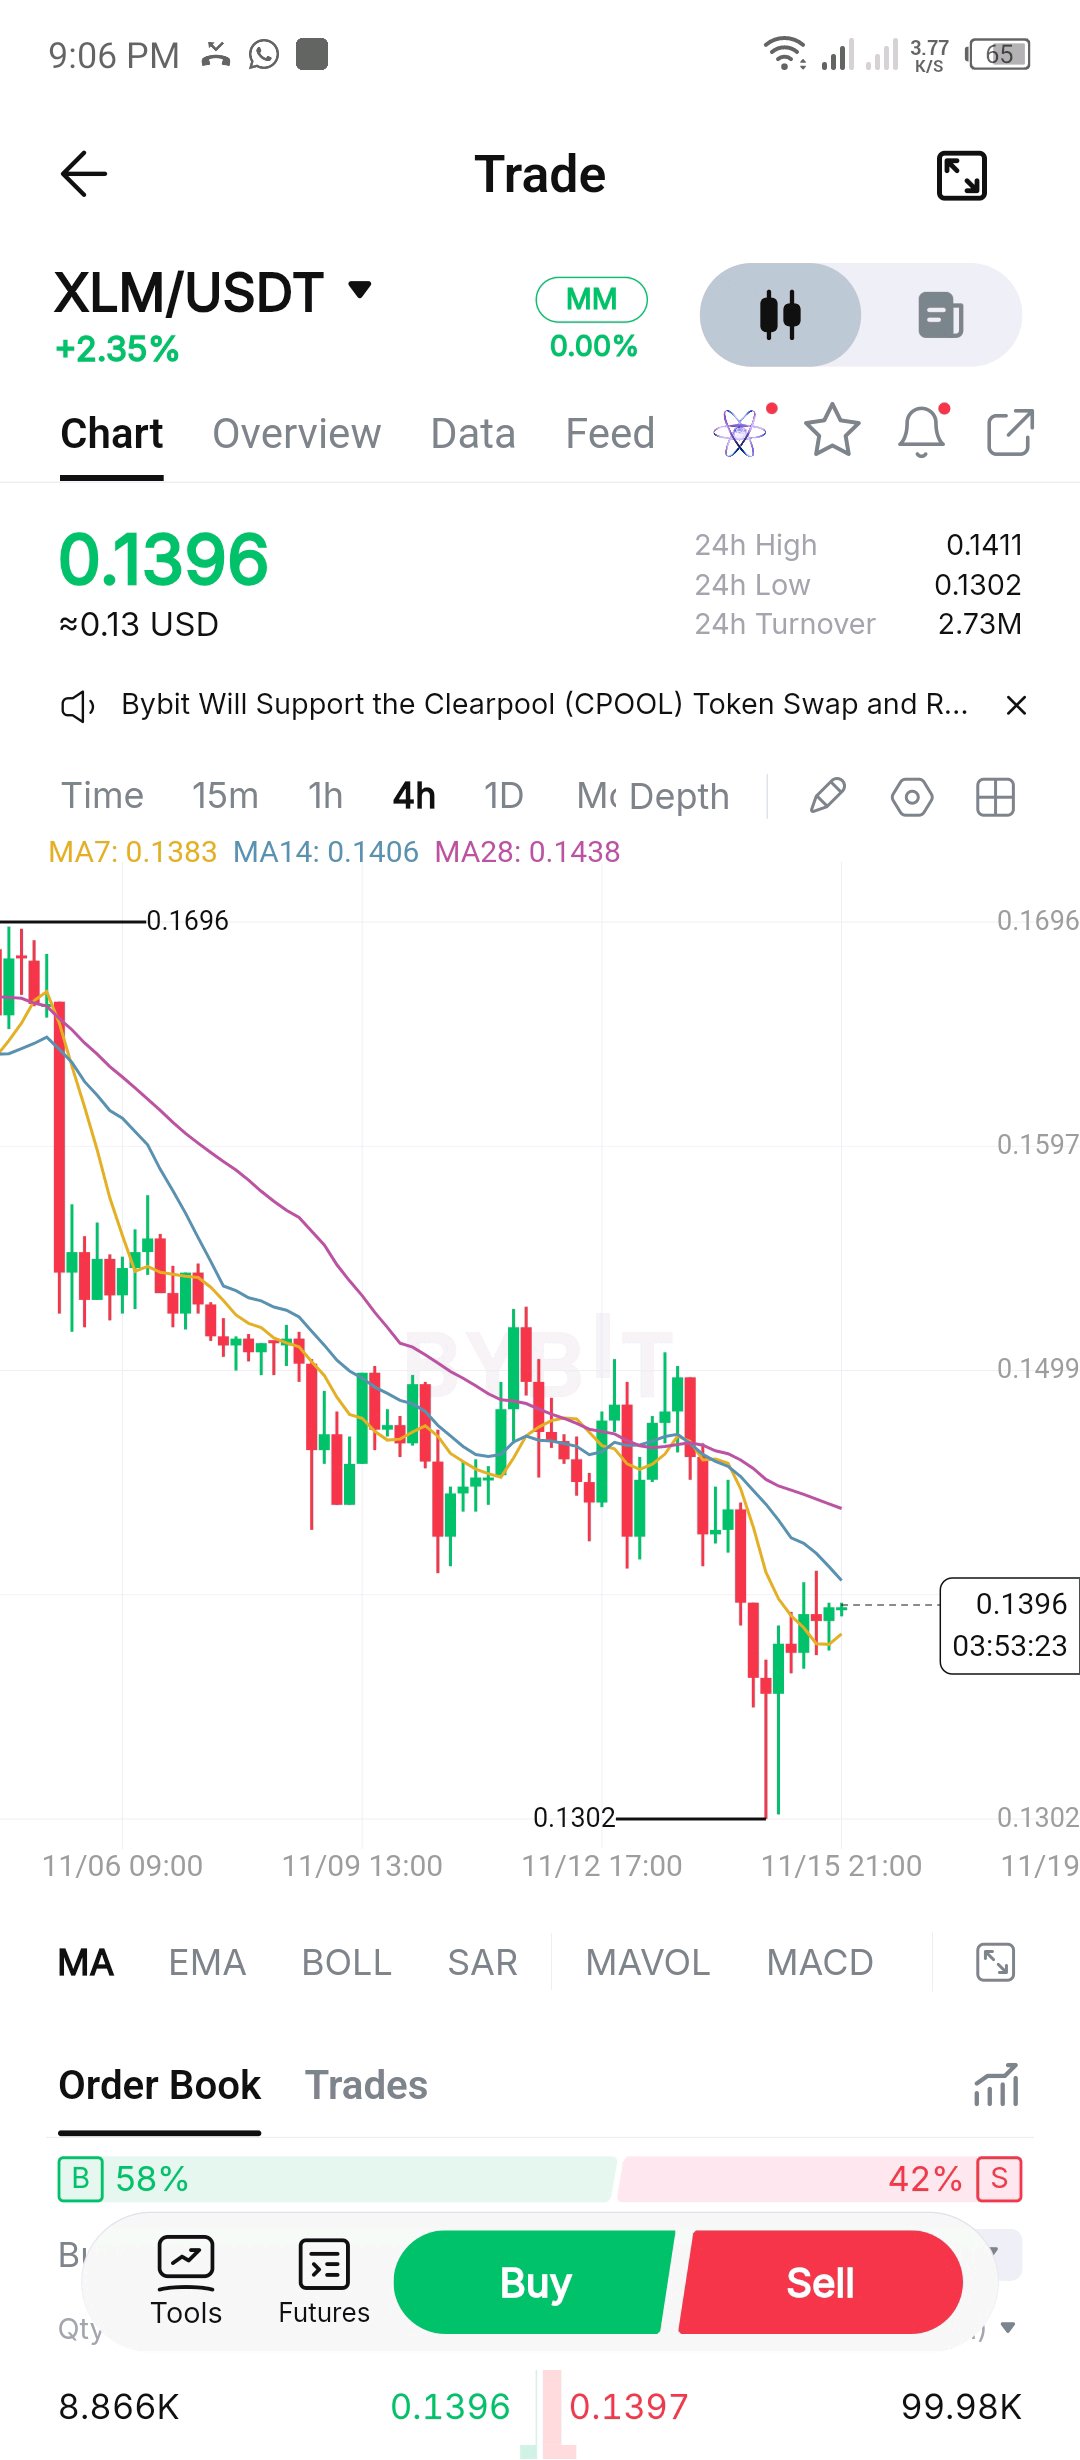
$XLMUSDT $XLMUSDT テクニカル分析 時間足: 4H 現在価格: $0.1396 24時間変動: +2.35% 1. 市場トレンド 全体的なトレンドは依然としてベアリッシュ(下落)です。 MA7: 0.1383 MA14: 0.1406 MA28: 0.1438 価格はMA7を上回っていますが、MA14およびMA28を下回っています。これは、大きな下降トレンドの中での短期的な回復を示唆しています。 2. サポートライン $0.1380 – 直近のサポート $0.1350 – 第2サポート $0.1302 – 主要サポート 3. レジスタンスライン $0.1406 – 第1レジスタンス $0.1438 – 強力なレジスタンス $0.1499 – 主要レジスタンス 4. 今後の市場の方向性 ブルシナリオ: XLMが$0.1406を上回って4時間足で確定した場合、$0.1438に向けて上昇する可能性があります。 ベアシナリオ: 価格が$0.1406付近で拒否された場合、$0.1380や$0.1350に向けて下落する可能性があります。 5. 私のトレードバイアス 短期: やや強気な回復。 全体: 弱気(ベア)。 私の推奨は、トレードを開始する前に確認を待つことです。 焦って買いや売りをしないこと。ブレイクアウトの確認が重要です。 結論: XLMが$0.1438を明確に上抜けるまでは、下落バイアス(DOWN)を継続。 #IMPACTbyTrade

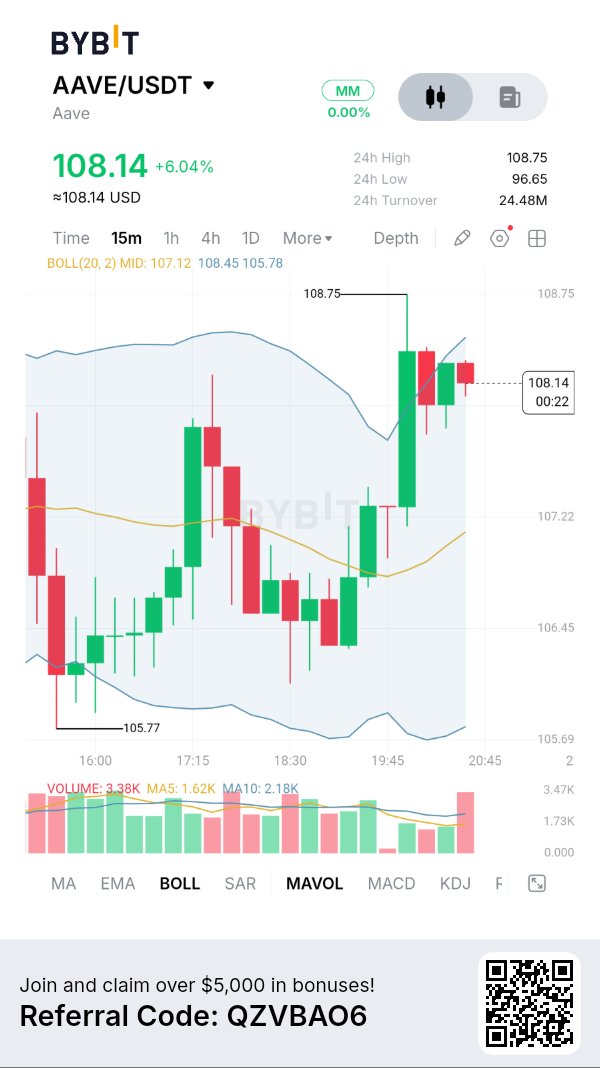
AAVE ($AAVE): バイヤーが価格を108ドル以上に押し上げ、回復の勢いが強まる ファンダメンタル分析 Aaveは依然として主要な分散型レンディングプロトコルの一つであり、ユーザーは資産を供給して利息を得たり、暗号資産を担保に借り入れを行ったりすることができます。 最新の重要な開発はAave V4であり、流動性管理、資本効率、リスク分離を向上させるためにハブ・アンド・スポーク・アーキテクチャが導入されました。 Aaveの10月の開発アップデートによると、V4の預かり資産は15億ドルを超え、プロトコル全体の累計貸出額は1.1兆ドルに達しました。これらのマイルストーンはDeFiにおけるAaveの地位を強化するものですが、プロトコルの成長が自動的にトークン価格の上昇を保証するわけではありません。 トークノミクス AAVEの最大供給量は1,600万トークンです。そのユーティリティには、プロトコルのガバナンスへの参加やセーフティモジュールへの参加が含まれます。 また、DAOはプロトコル収益を原資としたバイバック(自社株買い)プログラムも運営しており、これが市場における需要の潜在的な源泉となっています。 ただし、バイバック、ステーキング、プロトコルの成長は、循環供給量、流動性、およびより広範な市場状況と合わせて評価する必要があります。 チャートとインジケーター 提供されたBybitの15分足チャートによると: - 現在価格: 108.14ドル - 24時間変動率: +6.04% - 24時間高値: 108.75ドル - 24時間安値: 96.65ドル - 24時間取引高: 2,448万ドル - ボリンジャーバンド中央線: 107.12ドル - 上限バンド: 108.45ドル - 下限バンド: 105.78ドル - 直近チャート安値: 105.77ドル $AAVEUSDT は105.77ドルから力強く回復し、ボリンジャーバンド中央線を奪還しました。価格は現在、108.45ドル付近の上限バンドを試しています。 取引高は3.38Kで、MA5の1.62KおよびMA10の2.18Kを上回っています。これは、最近の回復局面でより強い参加があったことを示唆しています。 しかし、価格はレジスタンスに近づいているため、反落の可能性も残っています。 強気シナリオ 108.45ドルを超えて維持し、その後のリテストに成功すれば、108.75ドルへ向かう道が開ける可能性があります。 108.75ドルを明確に上抜ければ、回復基調が強化され、さらなる買いを呼び込む可能性があります。 弱気シナリオ ボリンジャーバンド上限を突破できなければ、107.12ドルへの調整が引き起こされる可能性があります。 中央線を割り込めば、短期的強気構造が弱まり、さらなる下落修正で再び105.78ドルが意識される可能性があります。 私のトレードプラン 現在の陽線を追うような取引は避けたいと考えています。 強気のロングエントリーとしては、108.45ドルの明確なブレイクアウト、取引高の増加、そして成功するリテストを確認したいです。 もし価格が拒絶された場合は、107.12ドル付近での反応を見守り、次のチャンスを検討します。 ポジションサイジングと損切り設定は、市場のボラティリティを考慮する必要があります。 私の見解 AAVEは、取引高の増加とボリンジャーバンド中央線の上抜けに裏打ちされた、勇気づけられる回復の勢いを見せています。 ファンダメンタルズは依然として興味深く、特にV4の拡大とプロトコル活動の増加は注目に値します。 しかし、目先の技術的な課題は、買い手が108.45ドルを克服し、108.75ドルより上で支持を確立できるかどうかです。 AAVEはさらなる高値を目指しているのでしょうか、それとも買い手が売り手に支配権を奪い返されかねないレジスタンスゾーンに近づいているのでしょうか? #IMPACTbyTrade


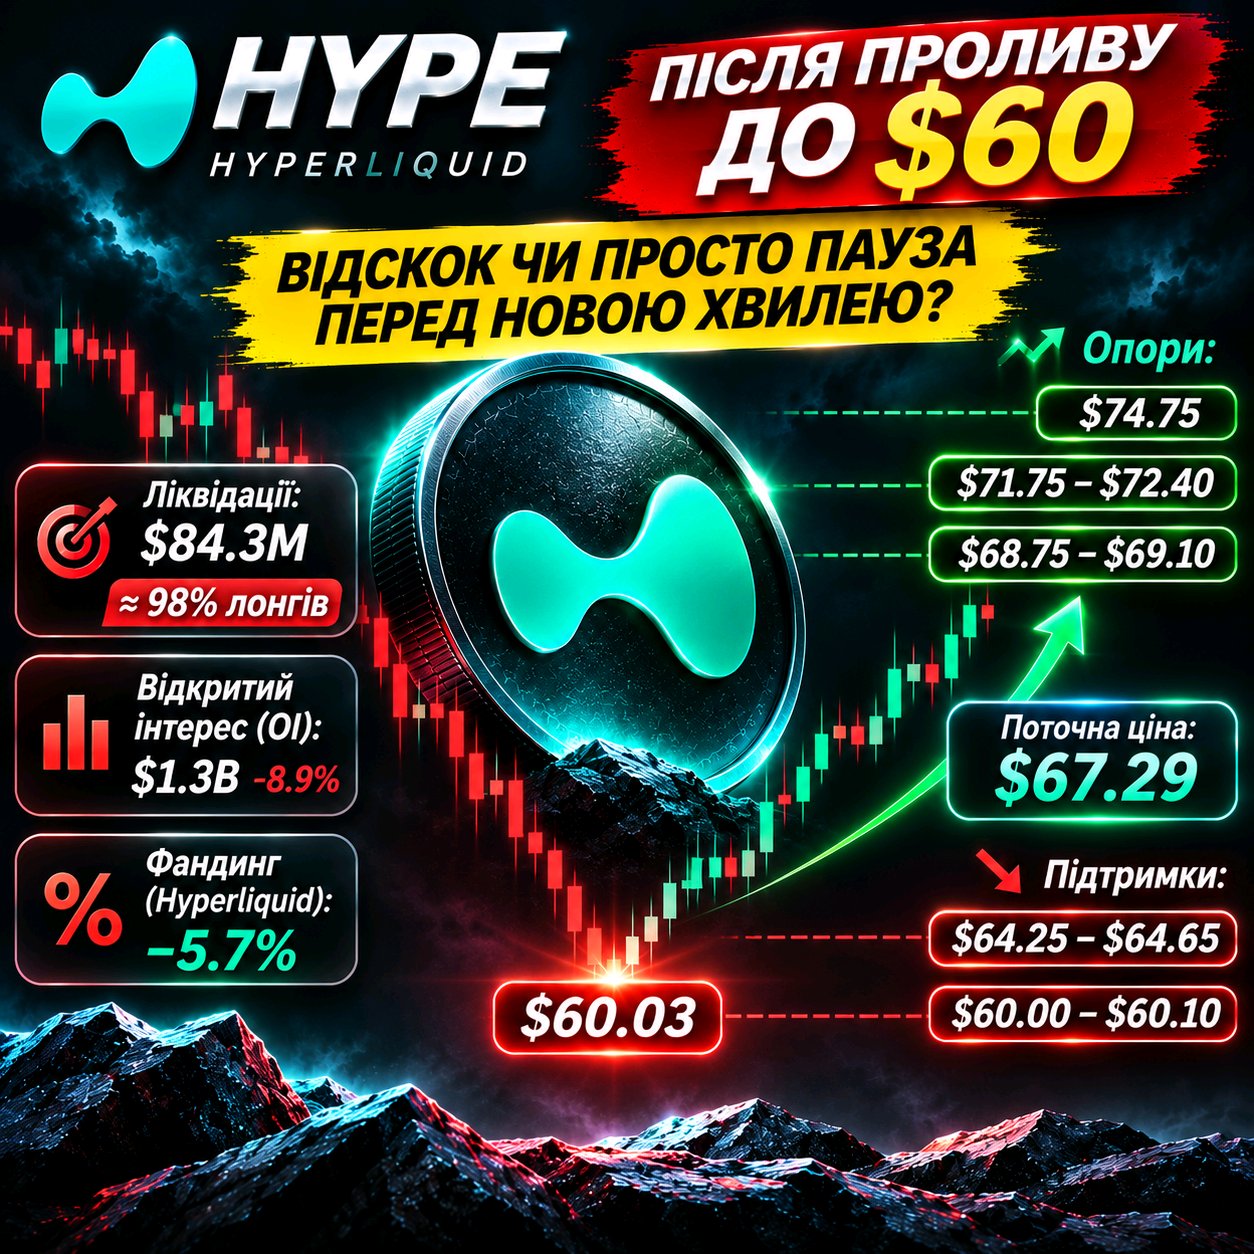
$HYPEUSDT відскочив від $60. Але чи справді продавці втратили контроль? Після різкого падіння HYPE показав сильну реакцію покупців. Ціна піднялася від $60,03 до області $67, але я поки не поспішаю називати це розворотом. Причина моєї обережності — структура ринку. 98% ЛІКВІДАЦІЙ ПРИПАЛО НА LONG За останнім доступним зрізом за добу на HYPE було ліквідовано близько $84,3 млн позицій. Із цієї суми приблизно $82,7 млн припало на LONG. Це масштабне очищення плечових покупців, які намагалися втримати попередній висхідний рух. Водночас відкритий інтерес на Hyperliquid скоротився на 8,9% — до приблизно $1,3 млрд. Для мене це важливий сигнал: частина спекулятивного капіталу вже залишила ринок. FUNDING ПОКАЗУЄ ЦІКАВУ РОЗБІЖНІСТЬ На Hyperliquid ставка фінансування перейшла в негативну область, тоді як на Binance та Bybit вона залишалася позитивною. Така різниця показує, що позиціонування трейдерів на різних біржах суттєво відрізняється. Негативний funding може створювати умови для закриття SHORT, але сам по собі не гарантує зростання. ДЕ ЗАРАЗ ЗОСЕРЕДЖЕНА ЛІКВІДНІСТЬ? Я виділяю такі області: - $68,75–69,10 — найближча перешкода для покупців. - $71,75–72,40 — важлива зона опору та потенційного закриття SHORT. - $74,75 — наступний орієнтир відновлення. - $64,25–64,65 — значний кластер ліквідацій LONG. - $60,00–60,10 — локальне дно останнього розпродажу. Особливо цікава асиметрія ліквідності: за доступною картою ліквідацій нижче ціни зосереджено значно більше потенційних ліквідацій LONG, ніж найближче зверху SHORT. Це означає, що ризик повторного зниження залишається. МОЯ ПОЗИЦІЯ Я бачу перші ознаки стабілізації, але ще не бачу підтвердженого розвороту. Повернення вище $69 із формуванням вищого мінімуму стане першим аргументом на користь покупців. Наступна перевірка — $72,40. Якщо HYPE зможе закріпитися вище цієї області, картина стане значно цікавішою. Якщо ж ціна втратить $64,60, увага знову переміститься до мінімуму $60. Найцікавіше зараз — не сам відскок HYPE, а те, чи зможуть покупці втримати його після того, як ринок уже ліквідував більшість плечових LONG. #IMPACTbyTrade $BTCUSDT
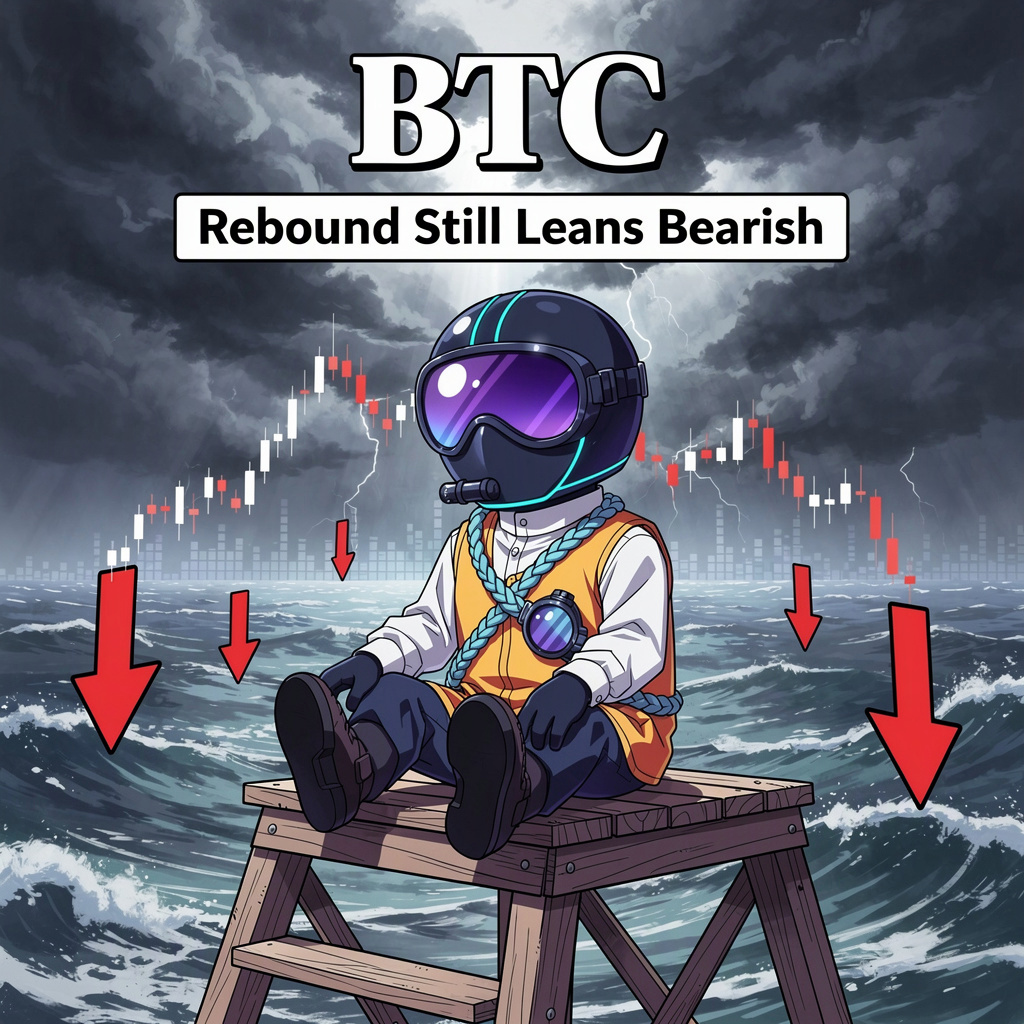
BTCUSDT:リバウンドは依然として弱気傾向
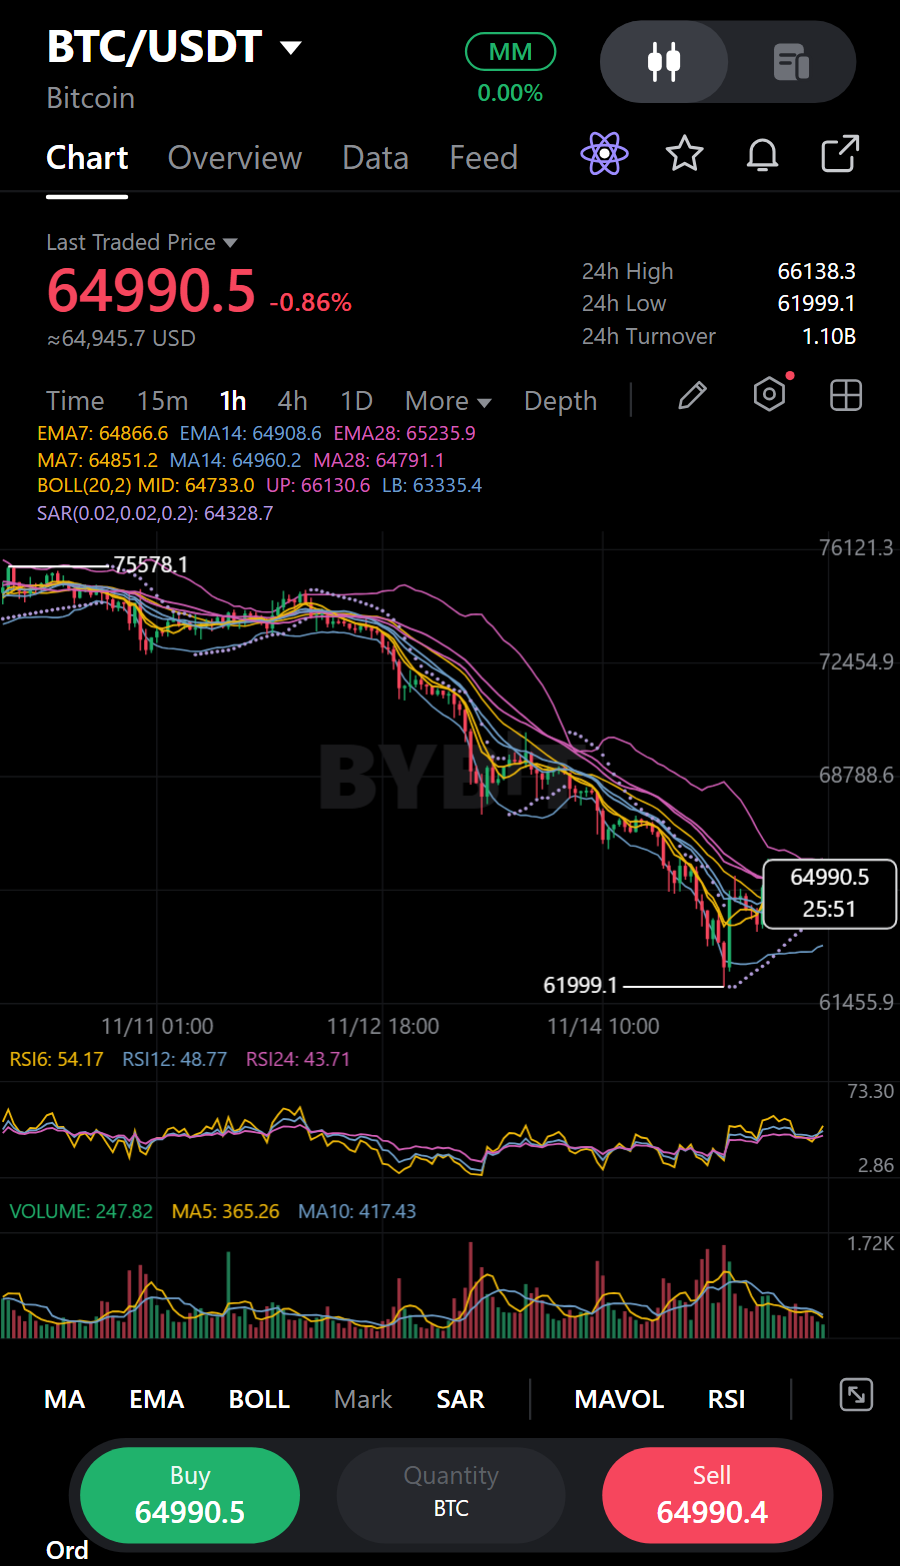
小さな陽線が出ましたが、これはあくまで一時的な中断であり、トレンド転換ではありません。01:00時点のBTCUSDTは64,735.30で引けましたが、出来高は12本のローソク足平均のわずか0.6倍です。その前の21:00の陰線は64,769.40で引け、23:00と00:00の陰線で価格は64,704.60および64,571.60まで押し下げられました。この流れを見ると、リバウンド後も売り手が圧力をかけており、最後のわずかな上昇も参加者が少ないことがわかります。直近の取引価格は64,980.60で、MA7(64,925.11)、MA14(64,926.05)、MA28(64,818.47)をわずかに上回っています。買い手にとっては足場となりますが、これらの平均線が密集しており、直近の1時間足の弱さを払拭するまでには至っていません。 あるストラテジストは、レバレッジが売りを誘発したと分析し、2027年に向けたビットコインの回復シナリオと、その見通しを支持・無効化する水準を提示しました。私にとってそれは長期的な対照意見であり、BTCUSDTの短期的なトリガーにはなりません。この局面では、依然として買い手が移動平均線の密集帯付近で追随の動きを見せる必要があり、出来高の少ない一本の陽線だけでは不十分です。 市場の状況から、私の直近のバイアスは依然として弱気(ベア)です。BTCUSDTは24時間のティッカーウィンドウで1.03%下落しており、取引高は前日の約1.26倍です。下落局面での活発な動きは、売り手が主導権を握り続けることを完全に保証するものではありませんが、確実な回復よりもショート戦略と整合性が取れています。この見方を変えるには、1時間足が移動平均線の上に形成されるのを確認したいところです。 ショート(売り)を狙う場合、弱気相場を追いかけるのではなく、64,773.64〜65,187.56のレンジでの停滞を見守ります。66,222.36の損切りライン(Stop Loss)を上回った場合は、シナリオが崩れたと判断します。エントリーゾーンの中間値から、TP1(利益確定1)の63,945.80でリスクリワード比は約0.8:1、TP2の62,911.00で約1.7:1となります。最初のターゲットはリスクに対する利幅が限定的なため、慎重に判断します。方向感が明確になる前に、急激なスイングや1時間足のヒゲでエントリーやストップが狩られる可能性があります。 トレードプラン(ショート / 弱気): • サポート: 61,999.10 / 61,999.10 | レジスタンス: 66,138.30 / 74,822.90 • エントリーゾーン: 64,773.64 - 65,187.56 • 損切り (SL): 66,222.36 • ターゲット: TP1 63,945.80 | TP2 62,911.00 出来高を伴わずに価格が一時的に移動平均線を奪還した際、皆さんは何をもってその反発が本物だと確信しますか? あくまで私個人の見解であり、投資助言ではありません。#IMPACTbyTrade

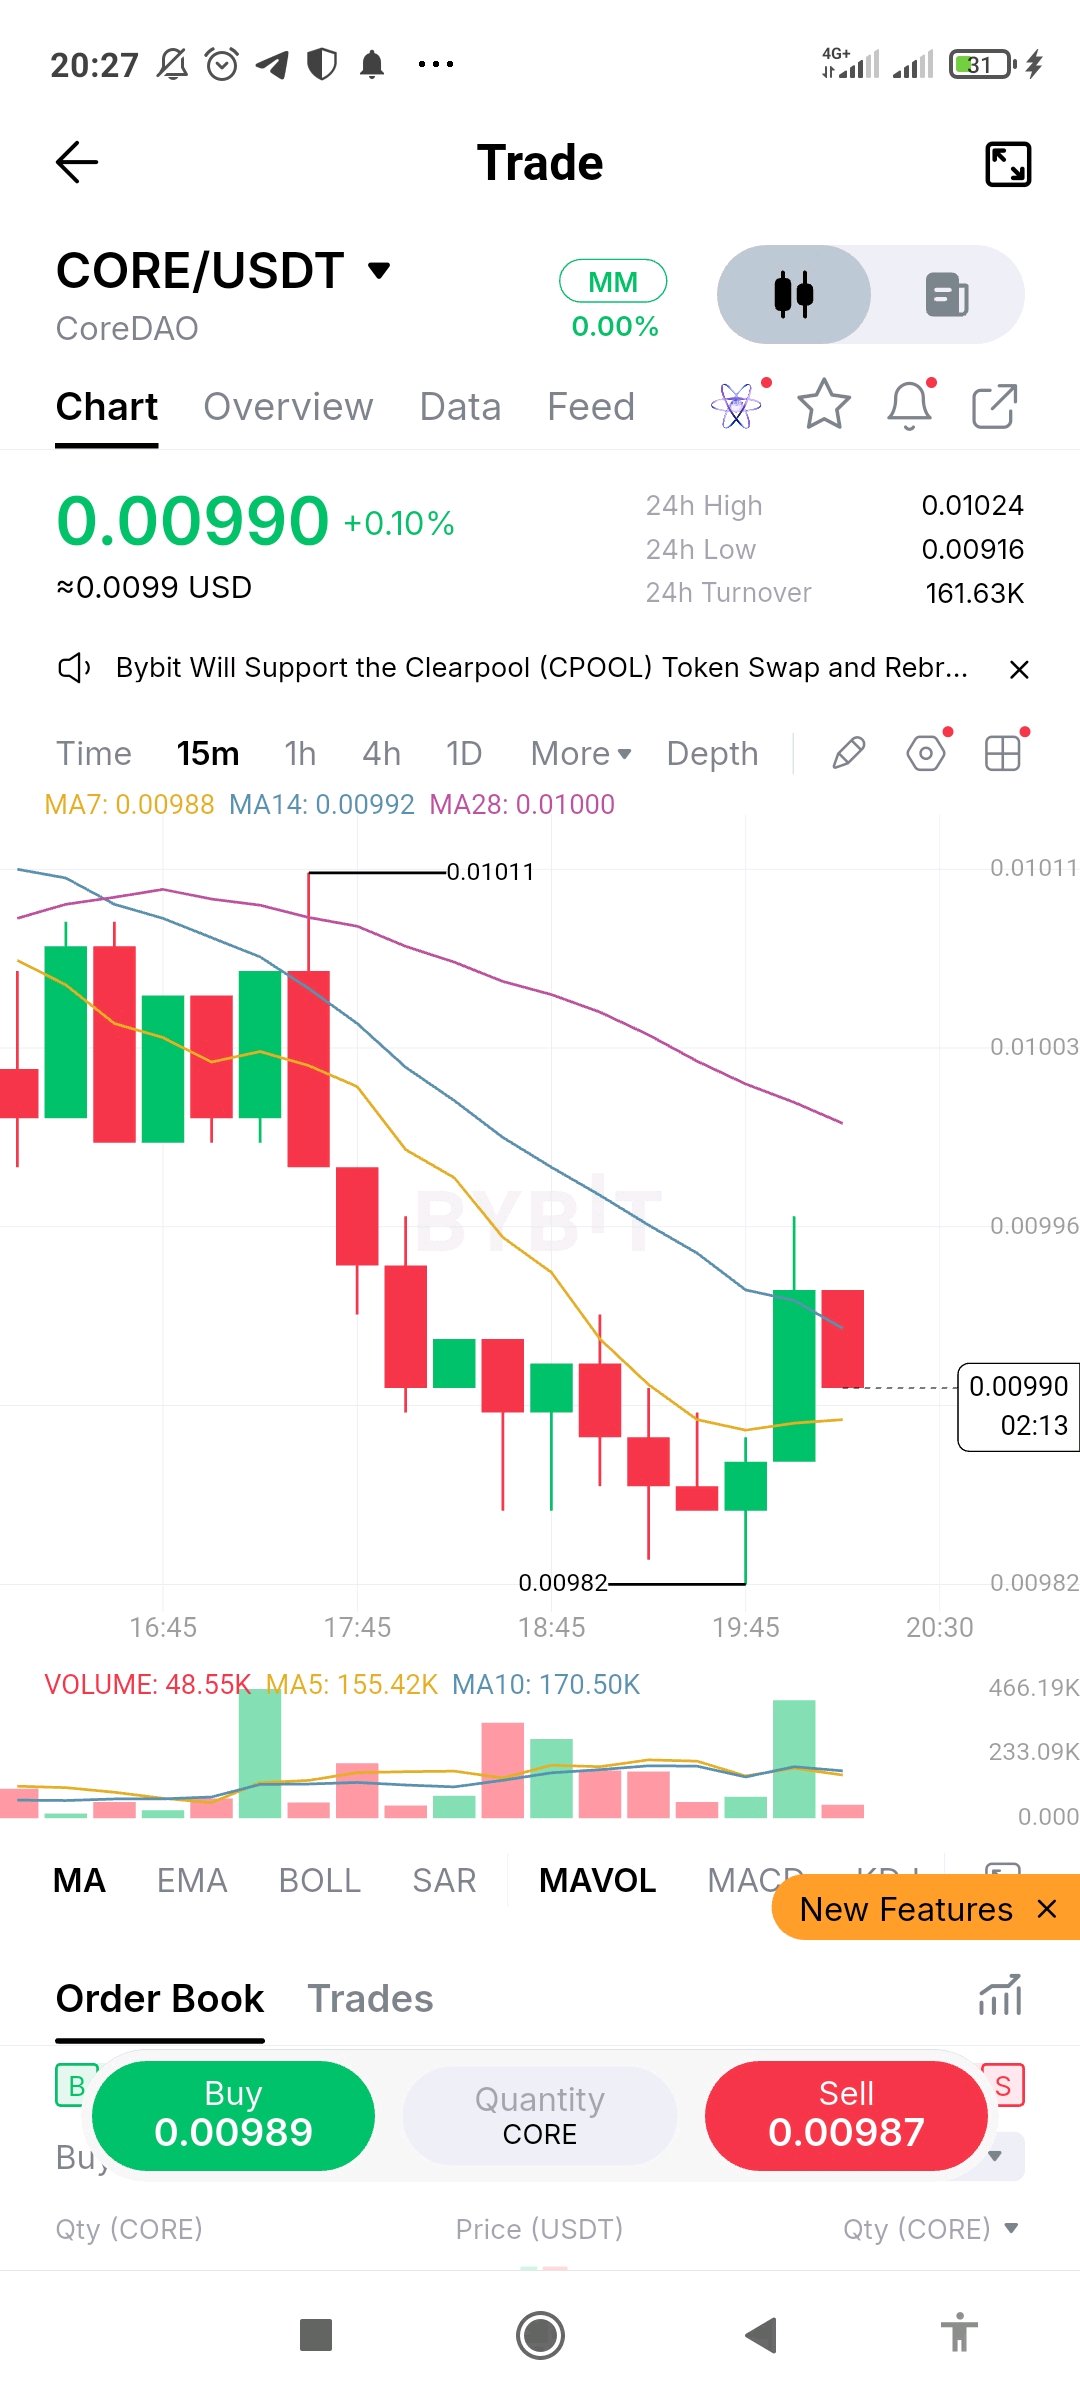
$COREUSDTは15分足チャートで0.00990、本日の上昇率はわずか0.1%ですが、短期的なトレンドは下降です。価格は0.01011付近から0.00982の安値まで下落し、一度力強い陽線で反発したものの、下向きの移動平均線のすぐ下で陰線を形成しました。MA7(0.00988)、MA14(0.00992)、MA28(0.01000)は弱気な順序で並んでおり、下降傾向にあります。 0.00982の安値が注目のラインです。ここを割り込めば売り圧力が依然として強いことを示唆しますが、0.00992付近のMA14を上回って引ければ、反発が継続する最初のサインとなります。反発したローソク足では出来高が急増しましたが、その後の陰線では出来高が減少しており、買いが続いていません。現時点では何も確定していません。 教訓:1日の騰落率がフラットでも、高値を切り下げ続けているチャートが隠れていることがあります。下降トレンドの中での単なる陽線は「反発の試み」であって「トレンド転換」ではないため、押し目を確認し、ポジションサイズは小さく抑えましょう。 #IMPACTbyTrade $COREUSDT $BTCUSDT

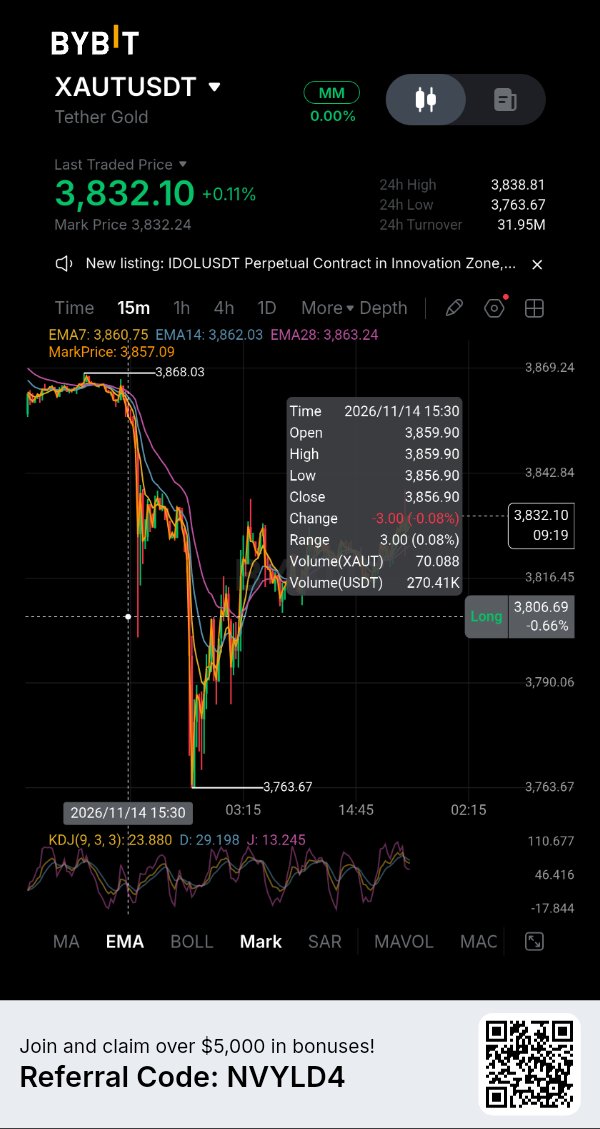
XAUT:ゴールドの安全資産としての需要が圧力を受けている
テザーゴールド(Tether Gold)は、投資家が米国の金利を再評価する中で試練に直面しています。金スポット価格は金曜日に1オンスあたり約3,880ドル付近で取引を終えましたが、週間では約4.5%下落し、6月初旬以来最大の週間下落幅を記録しました。生産者物価指数の軟化を受けて一時的に回復しましたが、木曜日の3%の大幅な売りを反転させるには至りませんでした。 この圧力の要因は金融政策にあります。米国の消費者物価指数と生産者物価指数の詳細により利上げ観測が根強く残る一方、10年物米国債利回りは5%を超えて上昇しました。連邦準備制度理事会(FRB)のジェフ・シュミッド総裁は11月15日、インフレ率は依然として2%の目標を上回っていると述べました。利回りの上昇は、利息を生まない金を保有する機会費用を高めます。地政学的な不確実性が高まっても金が売り圧力を免れなかったのは、このためです。 BybitのXAUTUSDT無期限契約は、直近の取引所データによると、24時間で約1%下落し、3,823ドル付近で提示されました。24時間の契約出来高は約4,336万ドルで、資金調達率は4時間ごとに+0.0012%でした。資金調達率がプラスであることはロング勢がショート勢に支払いを行っていることを意味しますが、その料率は緩やかであり、ロングポジションが過熱していることを示すものではありません。無期限契約の価格は、取引時間、流動性、および契約価格の設定方法の違いにより、金スポット価格の参照値と異なる場合があります。 チャート以外で注目すべき動きが別にあります。テザー社が9月30日に発表した準備金レポートによると、827,417.63 XAUTが流通しており、同量の金(トロイオンス)が保管されています。これは約25.7トンの金に相当します。11月11日、アンカレッジ(Anchorage)は、XAUTを保有する適格クライアント向けに、機関投資家向けの保管、取引、担保サービスを提供すると発表しました。この拡大により機関投資家のアクセスは改善する可能性がありますが、すべてのトークン保有者が発行者から直接償還を受けられるようになるわけではなく、即時の現金流動性が保証されるわけでもありません。 今のところ、XAUTの方向性は、金利やドルに対する金の反応に左右されたままです。金地金が3,900ドル台を回復し維持できればセンチメントの安定に寄与しますが、さらに下落すればトークンには引き続き圧力がかかるでしょう。機関投資家によるアクセスのニュースは進展していますが、マクロ経済リスクを打ち消すには至っていません。 重要な問い: 1. 米国債利回りが高止まりする中で、金は3,900ドルを回復できるか? 2. 機関投資家の参入は、XAUTのより深く信頼性の高い流動性につながるか? 3. 現在の下落は調整か、それとも金のより長期的な価格再評価の始まりか? IMPACTbyTrade


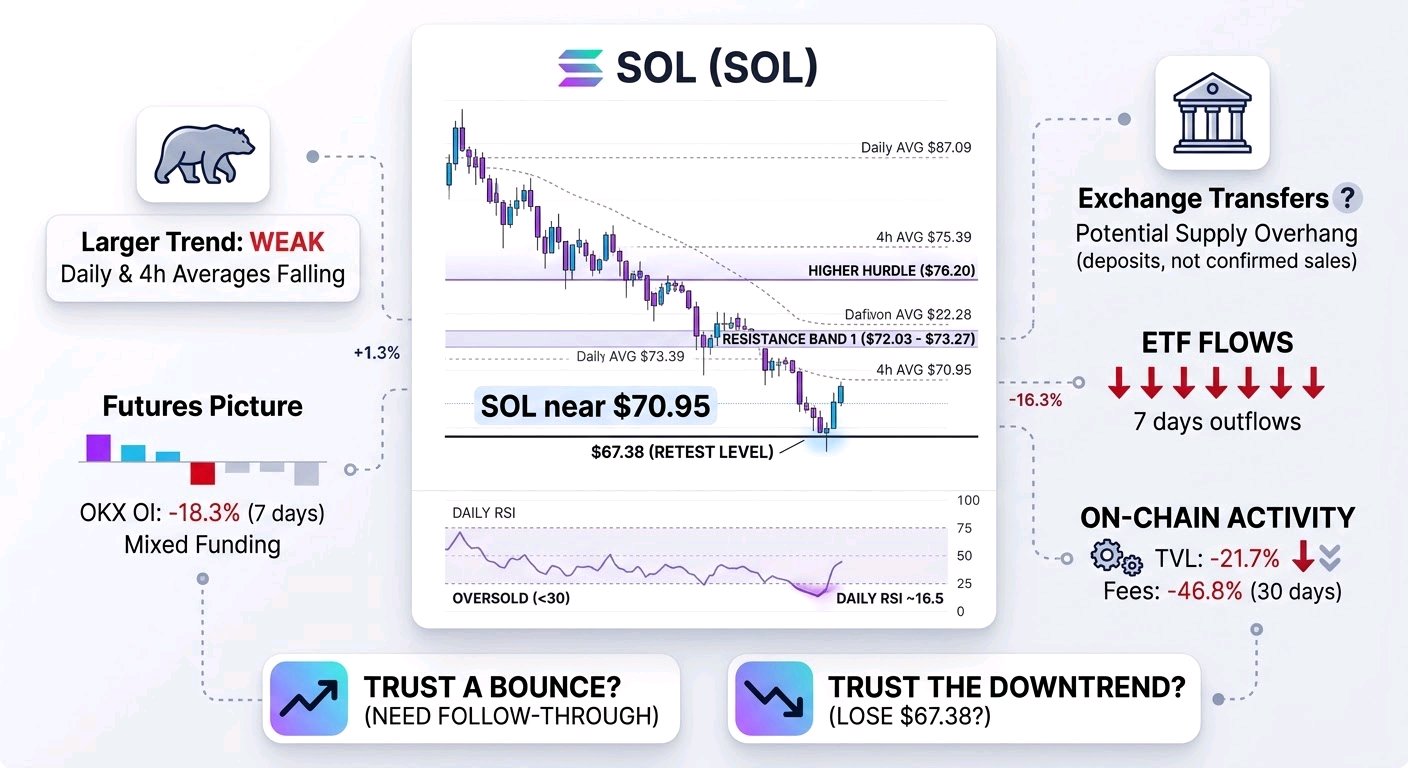
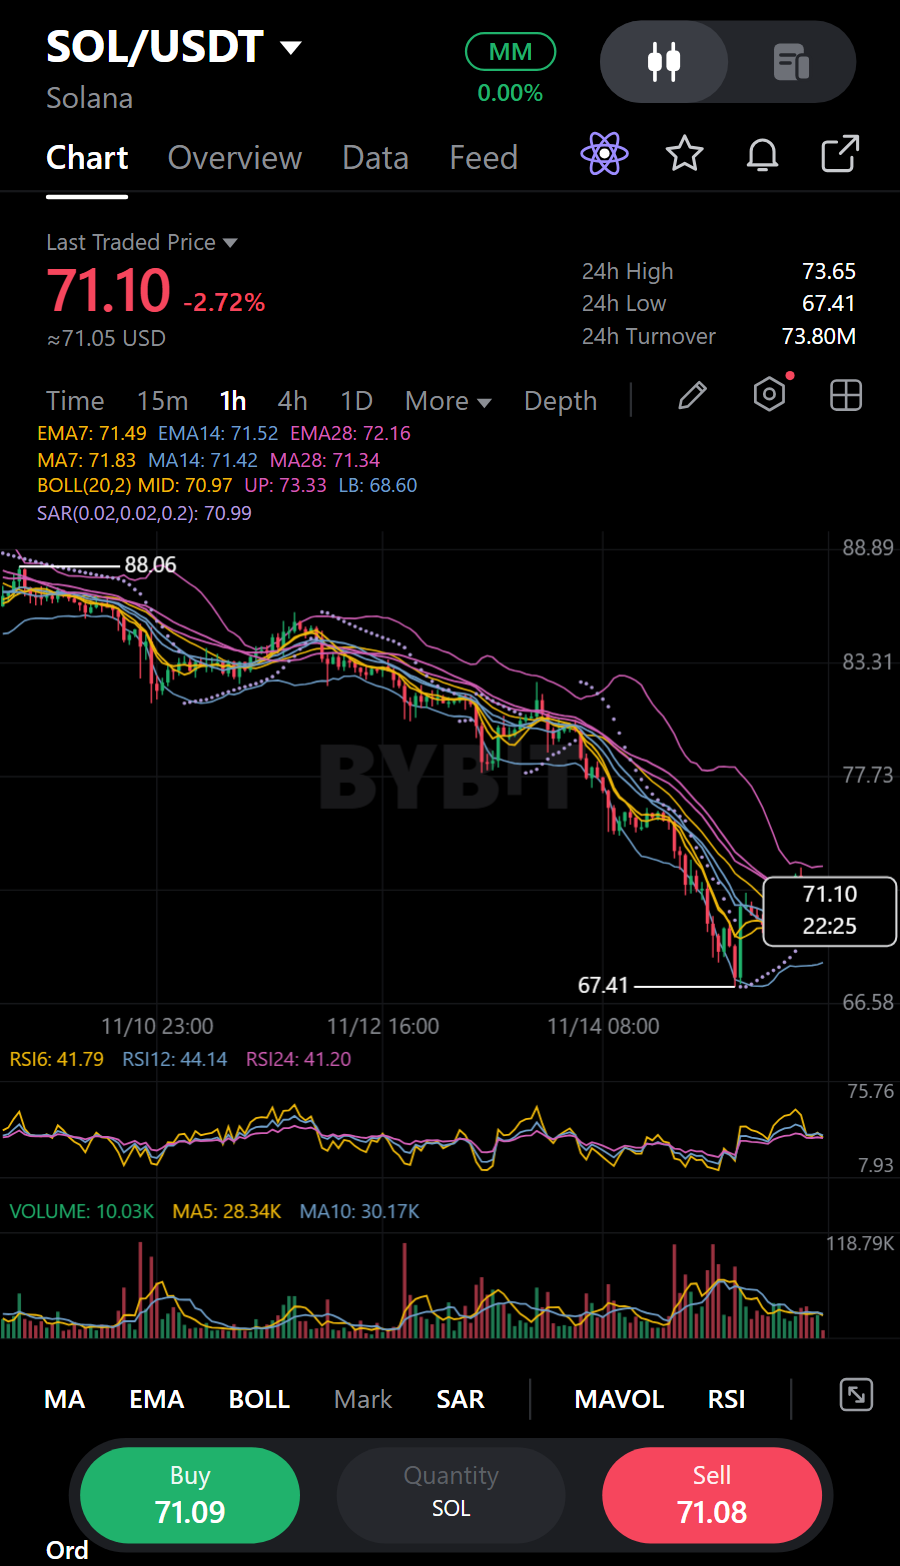
$SOLUSDT は7日間で20.3%下落した後、70.95ドル付近で推移しています。6月下旬以来の安値となる67.38ドルにタッチした後、反発しました。この安値は、目先における最も明確な試金石です。ここを維持できれば短期的な底固めが可能ですが、割り込めば、反発は一連の安値更新を止めるには不十分だったことになります。現時点では、どちらの結果も確定していません。 全体的なトレンドは依然として明らかに弱含みです。SOLは4時間足の下降トレンドラインにあたる75.39ドルと80.85ドル、および日足の移動平均線である87.09ドルと95.48ドルを下回っています。日足のRSIは約16.5で、通常では考えられないほど売られすぎの水準です。これは自律反発の可能性を示唆しますが、売りの勢いが収まったと判断する材料にはなりません。1時間足チャートを見ると、SOLは直近の高値によって形成された最初のレジスタンスゾーンである72.03ドル~73.27ドルを維持するのに苦戦しています。このゾーンを突破し、その後のリテストで底堅さを示すことの方が、単なる一時的な急騰よりも説得力があります。76.20ドルはより高いハードルであり、ここを奪還できれば短期的な構造は改善しますが、広範な下降トレンドを打ち消すには至りません。 私が反発を信頼するための条件は何でしょうか?それは「売られすぎ」という指標だけでなく、その後の追随する動きです。直近のローソク足は67.38ドルからの反発を示していますが、価格は直近のレジスタンスを上回る形を確立できていません。ここで利用可能なデータには、信頼できる15分足チャート、MACD、ローソク足ごとの出来高、板情報(オーダーブック)、あるいは清算ヒートマップが含まれていません。そのため、反発の背景に強力な現物買いがあったのか、正確な清算クラスターはどこか、あるいは特定のレベルが強制的な買いや売りを誘発するかどうかを検証することはできません。 先物市場の状況はまちまちです。主要取引所全体で資金調達率(ファンディングレート)はわずかにマイナスであり、ショート勢がロング勢に支払っている状況です。OKXの建玉(OI)は7日間で18.3%減少しています。これは市場からレバレッジがある程度解消されたことを示唆しており、価格が上昇すればショートカバーの余地があることを意味します。しかし、ポジションの偏りは一方的ではありません。OKXの口座はロング寄りですが、トップトレーダーのポジションはショート寄りです。建玉の減少は、必ずしも蓄積や差し迫ったスクイーズ(踏み上げ)を意味するわけではなく、レバレッジ解消を反映している可能性があります。現物取引は活発で、63の取引所で24時間に約54.5億ドルが取引されていますが、合計額だけでは、買い手が供給を吸収したのか、売り手が取引を支配したのかを判断することはできません。 報告された取引所への送金には注意が必要ですが、劇的な結論を下すべきではありません。ニュース報道ではForward Industriesに関連する動きを含め、SOLの大量入金が報じられていますが、同社は報告された送金の一つについて所有権の帰属を否定しています。オンチェーン上の動きは事実かもしれませんが、入金が必ずしも売却を証明するわけではありません。そのため、これは「確認された売り」ではなく、「潜在的な供給過剰」と見るべきです。より広範な市場もプレッシャーにさらされており、暗号資産市場の時価総額は24時間で5.2%減少し、恐怖指数は「10」と極端な水準にあります。SOLの弱さは主に独自の供給や活動によるものなのか、それとも市場全体の「リスクオフ」の動きによって増幅されているのか?その両方が当てはまる可能性があります。 長期的なポジティブ材料は存在しますが、それらは短期的な取引の結論を出すには至りません。DTCCのトークン化計画にはSolanaが含まれており、ネットワークでは「Breakpoint」カンファレンスが開催されています。これらの進展は長期的には重要かもしれませんが、今のところ価格の反転にはつながっていません。一方で、より直近の数値は軟調です。ETFのフローは7営業日連続の流出となっており、5日間で3,200万ドル、20日間で1億2,000万ドルの流出です。30日間で見ると、預かり資産(TVL)は21.7%減、ステーブルコインの供給量は7.1%減、手数料収入は46.8%減となっています。これらはフローや活動が弱まっていることを示す確実な兆候ですが、次の数セッションを予測できると決めつけることはできません。 私の見解は意図的に条件付きです。67.38ドルを上回っている限り、特に72.03ドル~73.27ドルの水準を参加者の支持を得て奪還できれば、自律反発は依然として考えられます。このスイング安値を割り込めば、弱気な見方が重みを増すでしょう。状況を好転させるものは何でしょうか?現物需要がリテストで底堅さを維持すること、価格上昇に伴って建玉が積み上がること、そしてETFの流出が緩和されることです。レジスタンスで再び跳ね返される、あるいは引き続き流出が続く、またはテクニカルな崩壊が起きれば、売られすぎの状態でも下降トレンドを止めることはできなかったという議論が強まるでしょう。現時点では、どちらの側も必要とされる確証を得ていません。#IMPACTbyTrade
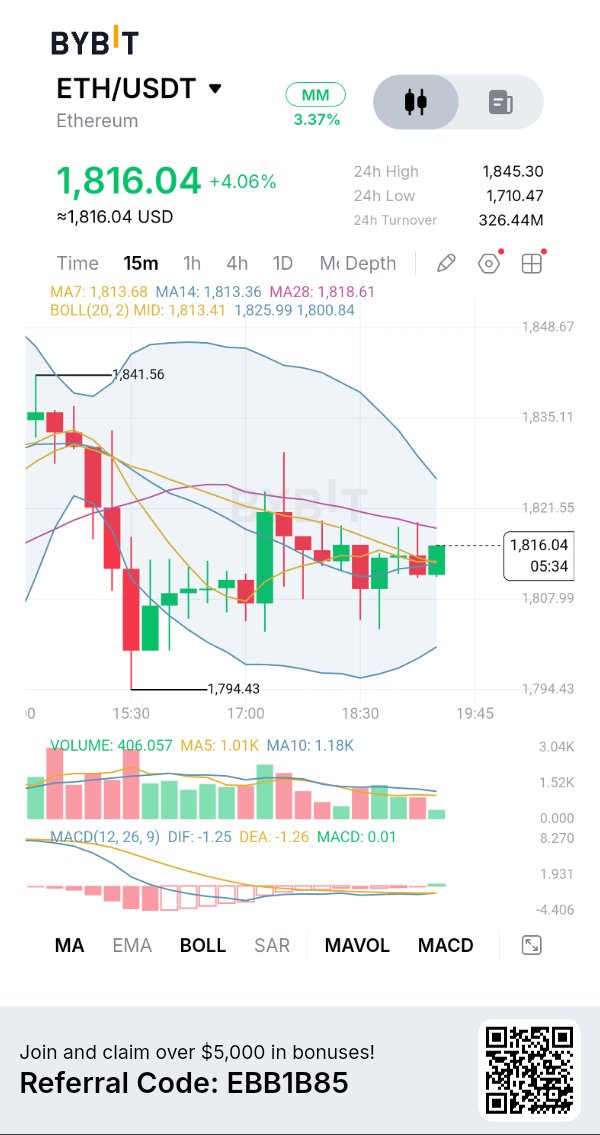
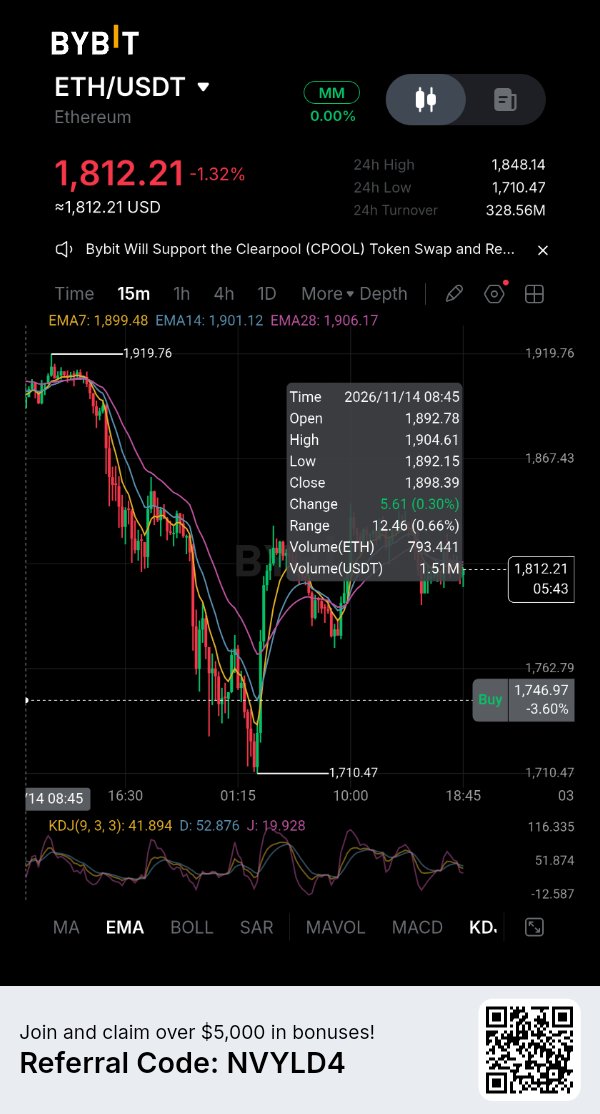
ETHが1,816ドル超への回復を試みる:買い手は力強い反転への準備をしているか? イーサリアムは、かなりの売り圧力に見舞われた後、短期的な安定の兆しを見せていますが、現在の回復にはまだ確認が必要です。ETHは1,794.43ドルへの下落の後、何とか1,800ドル台を回復しており、現在は1,816ドル付近で勢いを取り戻そうとしています。 重要な疑問は、この回復が持続的な上昇トレンドに発展するのか、それとも売り手がこの反発を主導権を取り戻すための新たな機会として利用するのかということです。 チャート+テクニカル分析 私のBybit $ETHUSDT 15分足チャートによると、ETHは1,816.04ドル前後で取引されており、約4.06%上昇しています。24時間の高値は1,845.30ドル、安値は1,710.47ドルです。 直近のプライスアクションは、急落後の回復と調整を示しています。買い手は1,794.43ドルのスイング安値を守りましたが、価格は依然として複数の上値抵抗線に近づいています。 移動平均線は興味深い状況を示しています。MA7は1,813.68ドル前後、MA14は1,813.36ドル前後、MA28は1,818.61ドル前後です。ETHは短期平均線を上回って推移していますが、MA28よりは下にあるため、1,818.61ドルが重要な目先の抵抗線となります。 ボリンジャーバンドは、ミドルバンドが1,813.41ドル付近、アッパーバンドが1,825.99ドル付近、ロワーバンドが1,800.84ドル付近となっています。ミドルバンドを上回って推移し続ければ回復が強まる可能性がありますが、アッパーバンド付近で拒絶されれば、買い手が依然としてかなりの抵抗に直面していることを示唆することになります。 MACD+出来高分析 MACDは初期の改善を示しており、DIFは-1.25、DEAは-1.26、ヒストグラムは約+0.01です。 わずかにプラスのヒストグラムは、弱気モメンタムが緩和していることを示唆しています。しかし、両方のMACDラインは依然としてゼロを下回っており、完全な強気モメンタムへの反転はまだ確認されていません。 出来高は現在約406.057で、MA5(1.01K)およびMA10(1.18K)を下回っています。この回復は強い参加を伴わずに展開しているため、重要な懸念事項です。 この動きを確信的な反転と判断する前に、上方向へのブレイクアウト時に出来高が拡大するのを確認したいところです。 強気シナリオ ETHが1,813ドル〜1,814ドルのサポートを維持し、1,818.61ドルを首尾よく奪還した場合、1,821.55ドルへの続伸を注視します。 より強いブレイクアウトがあれば、ボリンジャーバンドの上限と一致する1,825.99ドルへの道が開ける可能性があります。 私個人のエントリー手法としては、抵抗線を上回る決定的な15分足の終値を待ち、その後の出来高を伴った健全なリテストを確認するのを好みます。 1,807.99ドルを割り込んで推移し続ければ、この目先の強気セットアップは弱まるでしょう。 私のトレードプラン ETHがサポートとレジスタンスの間で取引されている間は、現在の回復を追うことはしません。 ロングポジションについては、買い手が1,818.61ドルを奪還し、ブレイクアウトを確認し、より強い出来高を示すのを見届けたいと思います。 ショートポジションについては、1,807.99ドルを下回るブレイクダウンの確認と、回復の失敗を待ちます。 $IMPACTbyTrade

Hyperliquid was built to pull leveraged trading away from centralized exchanges. So what does it say that its own token now trades on a centralized venue with a 10x leverage tag? That tension is the real fundamental question. HYPE is the native asset of Hyperliquid, a decentralized perpetual futures platform. The screenshot shows it at 66.365, up 1.18%, beside a 67.95M figure that isn't labeled, so I won't assume what it measures. What is visible is enough to ask where the token's value actually comes from. The project's strength is focus. Rather than a general-purpose chain searching for a use case, Hyperliquid is organized around one proven source of demand: leveraged derivatives trading. A token placed at the center of that activity has a clearer economic story than most Layer 1 assets. The hidden contradiction is that token price and protocol economics are different things. A modest daily gain on a leveraged listing reflects speculative flow, not platform revenue. Traders can push HYPE higher elsewhere without a single additional user touching Hyperliquid itself. Price discovery is happening off-platform, so the market may be pricing the narrative faster than fundamentals can confirm it. For monetization, the key issue is whether platform trading activity converts into durable token demand through fees, buybacks or staking utility. None of that is verifiable from this screenshot, and no revenue, supply or unlock data is shown, so I am leaving tokenomics out rather than guessing. The bullish case is a focused product, strong brand recognition and listings on major venues that widen access and liquidity. The bearish case is cyclicality. Perpetual futures volume depends on volatility and appetite for leverage, and when traders step back, both activity and the token's value proposition thin out. The critical risk is competition. Derivatives traders move wherever liquidity and fees are best, and that includes centralized exchanges, which are the very venues Hyperliquid set out to displace. My view: the thesis is credible but concentrated. HYPE is effectively a claim on one business line, and that purity cuts both ways. It deserves serious attention, not blind enthusiasm. The milestone that would change my assessment is evidence that platform revenue translates into measurable, recurring token demand independent of price momentum. Until that link is visible, price strength is a sentiment signal rather than a fundamental one. If a token's price is set mostly on centralized venues, how much of its value does the protocol itself actually control? $HYPEUSDT #IMPACTbyTrade
HYPERLIQUID (HYPE): Is the Market Underestimating Its Potential? Hyperliquid is an interesting project to watch in the decentralized trading sector. My focus is on three factors: 1. Growth in platform activity. 2. User adoption and ecosystem development. 3. Whether HYPE can regain market strength. Long-term potential and short-term price action are two different things. I want to see real ecosystem growth before becoming overly bullish. What matters more to you: HYPE's technology, adoption, or price performance? $HYPEUSDT #IMPACTbyTrade


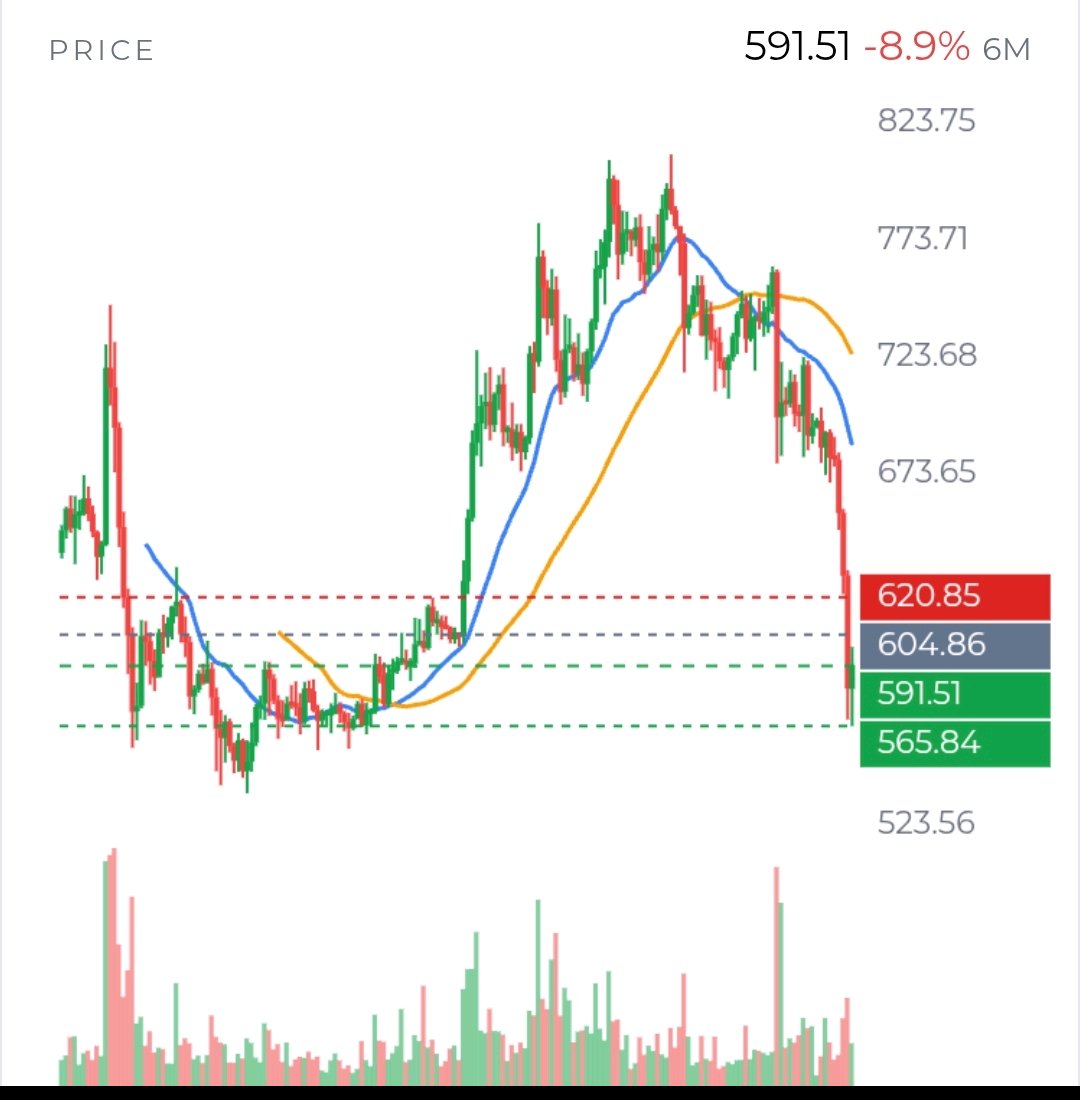
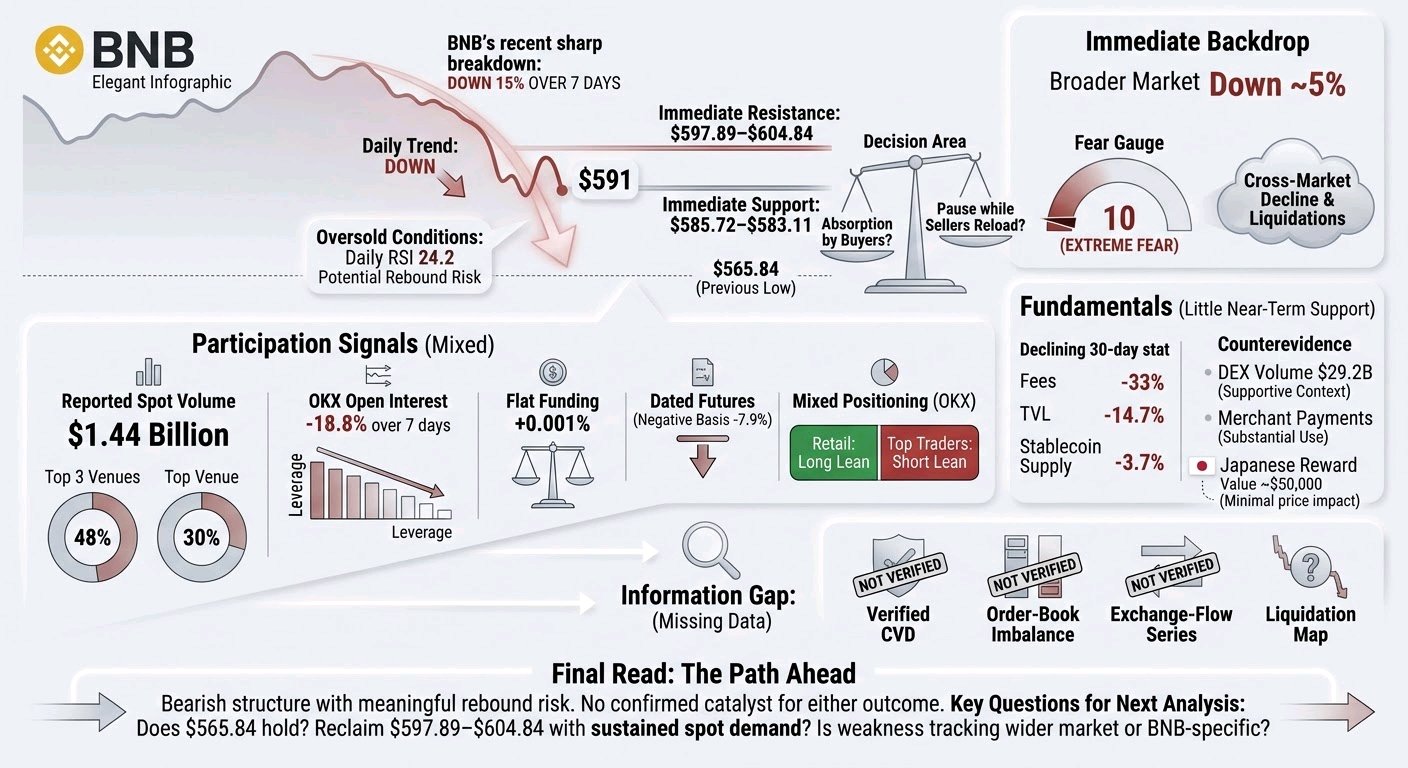
$BNBUSDT is not giving a clean signal yet. The important question is no longer simply “Is it oversold?” It is whether the market can turn a sharp drop into a stable base—or whether each bounce is an opportunity for sellers to exit. The verified picture is weak, but not one-sided. BNB is around $591, down about 15% in 7 days and 18% in 30 days. It remains below its daily EMA20 near $675 and EMA50 near $703; the hourly trend is also down. Daily RSI is 24.2, a level commonly called oversold. That tells us the decline has been forceful. It does not tell us the decline is finished. The levels closest to price matter most. Buyers have a first test at $585.72–$583.11, with the recent low at $565.84 below that. If price breaks the nearby support and cannot reclaim it, the low becomes a plausible retest. But if price holds support, could this be the beginning of a base? I would look for follow-through, not just one green candle. On the upside, $597.89–$604.84 is the first meaningful reclaim area, including the hourly EMA50. BNB has traded above part of that zone, but has not established a sustained hold. $620.60–$620.85 is the next important hurdle. Holding above it would weaken the immediate bearish interpretation; failing there would suggest the rebound has not yet changed the trend. A move all the way back to the daily EMA20 near $675 would require a much larger recovery, not merely a short-covering pop. Participation offers clues, but not a verdict. Reported spot volume is about $1.44 billion across 62 venues, though the top 3 account for 48%, including one venue at 30%. That concentration makes the aggregate number less convincing as evidence of broad buying. Perpetual open interest is reported at $563 million across 4 tracked venues; OKX open interest is down 18.8% over 7 days. That points to leverage coming out on that venue, but does not tell us what happened across the whole market. Funding is nearly flat, at roughly +0.001% per 8 hours. OKX accounts lean long, while top traders’ positioning measures lean short. The disagreement matters: it does not look like a clear, market-wide pile-up of shorts that must be squeezed, or longs that are certain to be liquidated. We also do not have verified liquidation levels, taker-flow data, or order-book evidence. So I would not claim that a particular price is a liquidation magnet or that a squeeze is underway. The wider market is a real part of this story. Total crypto market value is down about 5% in the latest snapshot, and fear is at 10, compared with 28 a week ago. Recent coverage described broad market stress and liquidations. That makes BNB’s fall look partly connected to risk aversion across crypto, not necessarily to a single BNB-specific event. If Bitcoin and the wider market stabilize, BNB could benefit; if they weaken again, local support may be less reliable. BNB Chain’s fundamentals are mixed over different timeframes. Over 30 days, fees fell 33%, TVL fell 14.7%, and stablecoin supply fell 3.7%. Those declines are a genuine headwind, though they do not identify the cause of the current selloff or time a trade. In the other direction, reported 30-day DEX volume is $29.2 billion, and a 12-month merchant-payments report found BNB Chain and Tron handled 75% of merchant USDT pay-ins. That is evidence of use, but not proof that buyers are stepping in now. My analytical view: the downtrend remains intact, while oversold conditions and nearby support make an immediate bearish continuation less certain. The most informative evidence next will be whether $565.84 holds on a retest, whether price can sustain a reclaim above $604.84, and whether any recovery comes with broader-market stability. Until those questions are answered, both a relief bounce and another leg down remain plausible. #IMPACTbyTrade
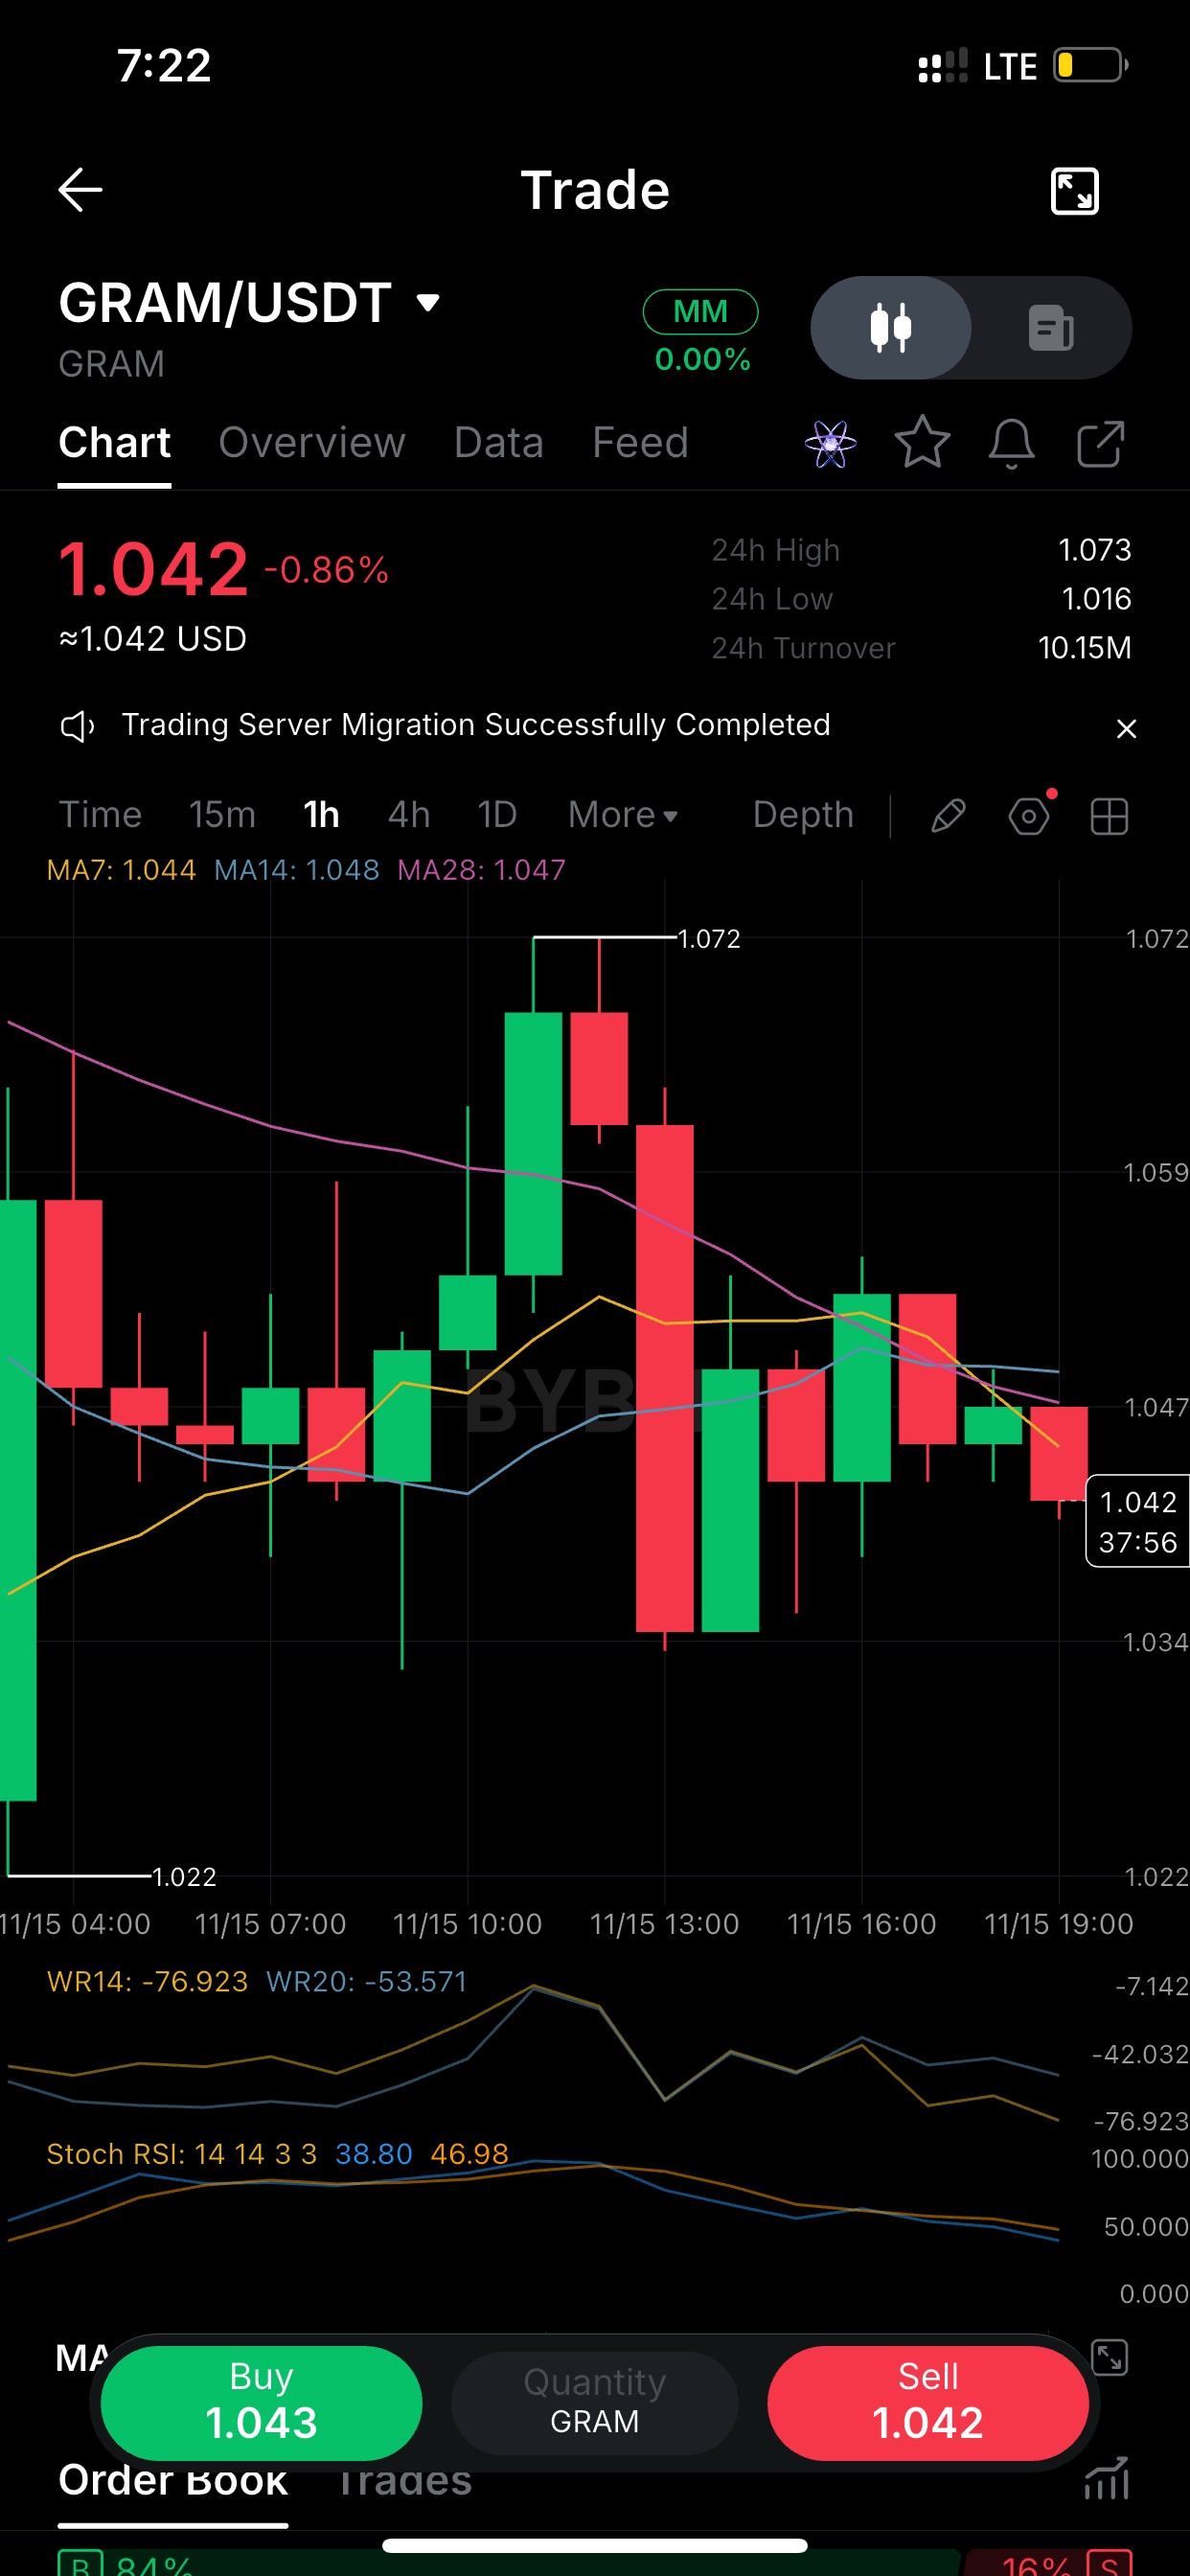
$GRAMUSDT printed 1.072 around 10:00 UTC and got sold straight back down. The red candle that followed erased almost the whole move and wicked to 1.034. Since then it's been lower highs, and price now sits at 1.042 under all three MAs (7/14/28 clustered at 1.044-1.048). That cluster is the first thing bulls need to reclaim. Until then I treat bounces as rallies into resistance, not a trend change. GRAM/USDT, 1h. Range is clean: 1.022 low, 1.072 high, and price is chopping in the lower half at 1.042. Momentum read: Stoch RSI is mid-range (about 39/47), so it's not oversold and there's room to slide further. Williams %R(14) is at -77, leaning weak but not washed out. If 1.034 (the last swing low) breaks on a closing basis, I'd expect a retest toward the 1.02 area. If buyers push back above 1.048, the bias flips neutral. Waiting on one of those two. 24h turnover on $GRAM is about 10M with a 1.016-1.073 range, so it's moving, but the 1h structure says sellers have the upper hand right now. Not chasing either side here. The setup I'd watch: a 1h close back above the MA cluster near 1.048 with a green candle that holds. Without that, every pop is just noise inside the range. One heads-up: the GRAM/USDT screen shows an MM tag and 0.00% fee badge. If this is a zero-fee or market-maker pair, trades on it are excluded from the trading impact part of the score. Your posts can still earn points on content quality, engagement and consistency, so make sure to use the coin tag or trading widget on each post. Also, spread these out over the day rather than posting all three at once, since high-frequency posting can get muted. #IMPACTbyTrade
$BNBUSDT is trying to stabilize after a sharp breakdown, but I don’t yet see evidence that the market has changed character. The key distinction is whether buyers are absorbing supply—or merely taking a pause while sellers reload. Verified: BNB is near $591, down 15% over 7 days. It fell to $565.84 and rebounded as high as $599.63, but recent hourly closes failed to hold above $597.89. The 1-hour, 4-hour and daily trends remain down. Daily RSI is 24.2, which signals oversold conditions, not a confirmed bottom. Price remains below the 1-hour EMA50 at $604.84, the 4-hour EMA20 at $615.86, and the daily EMA20 at $674.78. That leaves a nearby decision area. $585.72–$583.11 is short-term support; below it, the market would be testing $565.84 again. If that low breaks and price cannot quickly reclaim it, sellers retain control. On the other hand, a sustained move above $597.89–$604.84, followed by a successful retest, would be more meaningful than a brief intraday spike. The next substantial resistance is around $620.60–$620.85. Could BNB reclaim those levels while the broader market remains weak? That would be stronger evidence of demand than oversold readings alone. Participation signals are mixed. Reported spot volume is $1.44 billion across 62 venues, but the top 3 account for 48%, with one venue representing 30%. That makes the headline volume less persuasive as proof of broad-based buying. Perpetual open interest is $563 million across 4 tracked venues; OKX open interest is down 18.8% over 7 days. That suggests leverage has been coming out there, but it does not establish the direction of aggregate market-wide positioning. Funding is nearly flat at +0.001% per 8 hours, while dated futures trade at a negative 7.9% annualized basis. On OKX, retail accounts lean long, while top traders’ positioning leans short. Those crosscurrents do not point to an obvious, crowded short that must be squeezed. The important gap is what we cannot establish from these figures: there is no verified CVD, order-book imbalance, exchange-flow series, or liquidation map here. So we cannot confidently say whether spot buyers absorbed the selloff, where forced liquidations clustered, or whether the rebound was driven mainly by short covering. A liquidation level, if identified, would be a possible volatility point—not a guaranteed turning point. The immediate backdrop also matters. The broader crypto market is down about 5% in the latest snapshot, with fear at 10, down from 28 a week ago. News on Nov. 13 described a sharp cross-market decline and forced liquidations as Bitcoin and other major assets fell. That supports the interpretation that BNB’s slide was amplified by general risk aversion, rather than being solely a BNB-specific event. But it raises a useful question: if the broader market stabilizes, does BNB recover with it—or continue to lag? Fundamentals give little near-term support for a bullish reversal. Over 30 days, BNB Chain fees fell 33%, TVL fell 14.7%, and stablecoin supply fell 3.7%; these figures reinforce a weaker activity backdrop, though they do not prove what caused this week’s price move. There is counterevidence: reported 30-day DEX volume is $29.2 billion, and a recent merchant-payments report described substantial use of BNB Chain. Those are supportive context, not evidence of new buying pressure. A Japanese company’s announced BNB shareholder reward is worth watching, but its reported value is only about $50,000 and the reference date is Dec. 31. It does not look large enough to explain this selloff or reverse it by itself. My read: bearish structure, meaningful rebound risk, and no confirmed catalyst for either outcome. The next analysis should answer three questions: does $565.84 hold on a retest; can BNB reclaim $597.89–$604.84 with sustained spot demand; and is the weakness still tracking the wider market, or becoming BNB-specific?#IMPACTbyTrade

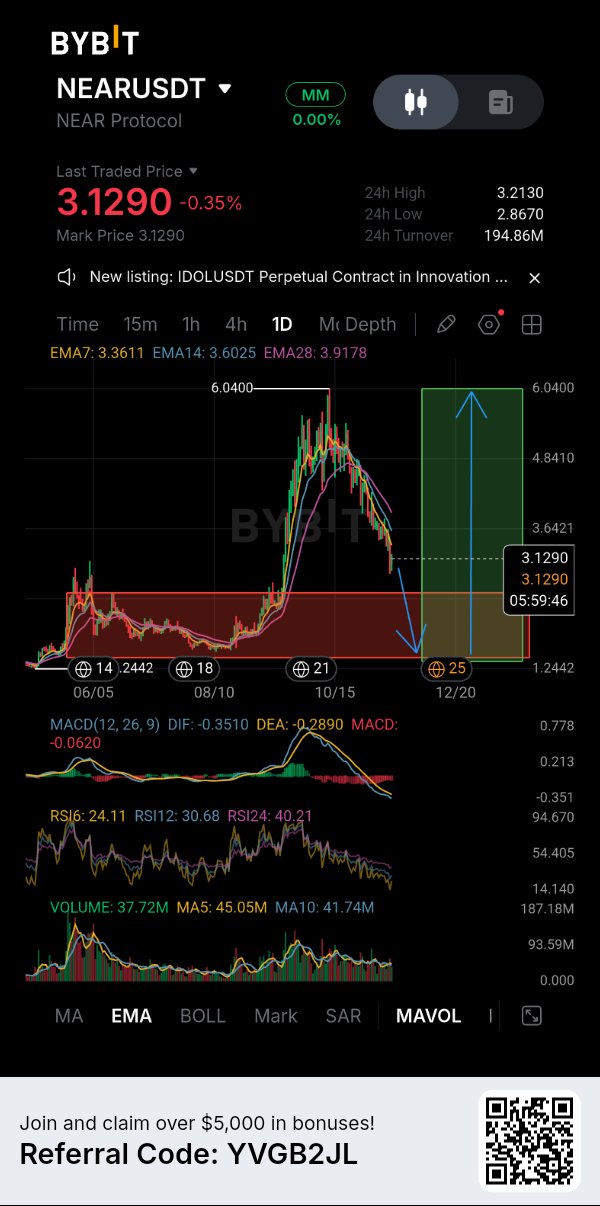
NEAR現物買い 🟢 絶好のチャンス
$NEAR 緊急アップデート:ダウントレンドが深まっていますが、より大きなチャンスを注視しています💯 $NEARUSDTは現在3.129ドル付近で取引されており、日足チャートは明確な弱さのサインを示しています。6.04ドルに向けた力強いラリーの後、価格は徐々に勢いを失い、売り手が主導権を握っています。最も懸念しているのは、$NEARが現在、表示されている3本のEMA(指数平滑移動平均線)をすべて下回っていることです。EMA 7は3.3611ドル、EMA 14は3.6025ドル、EMA 28は3.9178ドルです。この弱気な並びは、回復が確実なものになるまで、買い手がまだやるべきことが残っていることを示唆しています。 MY BYBIT 👉 日足チャートが示していること📊 RSIも重要なポイントです。RSI 6は24.11、RSI 12は30.68、RSI 24は40.21です。短期的なモメンタムは明らかに売られすぎの領域に達しています。 一方、MACDは依然としてマイナス圏にあり、DIFは-0.3510、DEAは-0.2890です。ヒストグラムもゼロを下回っています。 そのため、リリーフバウンス(自律反発)の可能性はあるものの、売られすぎの状態をトレンド反転の確証と混同しないようにしたいところです。 注目している2つのシナリオ🟢🔴 強気シナリオ🟢 まず、$NEARが現在の安値圏を守り、買いの強さを確立するのを確認したいです。最初に注目している回復エリアは3.36ドル付近で、その次はEMAが位置する3.60ドルおよび3.92ドルです。これらのレベルを奪還できれば、日足構造は徐々に改善していくでしょう。より強力な回復が実現すれば、以前のスイングハイである6.04ドルが再び視野に入る可能性がありますが、それは直近のターゲットではなく、あくまで大きな可能性としての話です。 弱気シナリオ🔴 売り手が価格を押し下げ続けた場合、直近24時間の安値である2.867ドル付近が重要な参考ラインとなります。これを維持できずに下抜けた場合、1.24ドル付近に見られるより広範な歴史的サポート領域が試される可能性があります。チャートの注釈にも、より大きな回復の前にさらなる深い調整が起こる可能性が示されています。ただし、その予測を現実的なトレード戦略として扱う前に、実際の価格の確認が必要です。 $NEARを既に保有しているトレーダーへ🎯 RSIだけで判断するのは避けた方が良いでしょう。価格がEMAのレジスタンス帯に向かって回復し始めた場合、個々のエントリー価格に応じて一部利益確定を検討する余地があります。ポジションを拡大しようとしている人は、弱気相場が続く中で盲目的にナンピン(平均コストを下げていく買い増し)するよりも、回復が確認されるのを待つことをお勧めします。 リスク管理⚠️ 2.867ドルのエリアは、直近の日足安値として注目に値します。ここを割り込むと、下落圧力が強まる可能性があります。確認なしの反発は信頼できるエントリーではありません。流動性ゾーンだからといって、自動的に買いの機会になるわけでもありません。エントリー、ストップロス、ポジションサイズ、リスクリワードをすべて考慮した上でトレードを行うべきです。 私の最終的な考え🤔 私は依然として$NEARの大きな回復の可能性を感じていますが、現在の日足構造はまだ強気とは言えません。下落している相場に急いで飛び込むよりも、買い手が力を証明するのを待つ方が賢明だと考えます。弱い相場において資産を守ることは、時に最良のトレードとなります。 皆さんは現在の価格で$NEARを積み増していますか?それとも、さらなる調整を待ってからエントリーを検討していますか? #IMPACTbyTrade #WSOT2026 #WSOTあなたのAI取引を見せて10USDTを獲得 #ジェンスン・ファン、NvidiaのAIリーダーシップを試す出口戦略 #米PPIが「高金利長期化」取引を試す


⚠️ ZRO/USDT — Is This a Deeper Correction Before Recovery, or Has the Trend Broken? ZRO is trading near $1.3765, down 10.33% in 24 hours, after falling from the recent $1.5468 high. The 24H low is $1.3421. Both 4H and daily charts remain weak; oversold RSI alone is not a buy signal. On 4H, RSI(6) is 25.94, RSI(12) 31.68 and RSI(24) 37.43. Daily RSI readings are also weak: 25.27, 34.93 and 42.69. Oversold conditions can bounce, but timing is uncertain. MACD is negative on both timeframes. On 4H, DIF is around -0.0392 versus DEA at -0.0230, with a negative histogram near -0.0162. Daily DIF is -0.0863 and DEA -0.0605. Volume is 332.60K, below MA5 at 575.88K and MA10 at 663.76K. Sellers remain in control; volume does not show a clear capitulation spike. The moving averages reinforce the caution. On 4H, MA7/EMA7 sit near $1.4406/$1.4416, MA14/EMA14 near $1.5041/$1.4792, and MA28/EMA28 around $1.5326/$1.5140. Daily averages are even higher: MA7 $1.4974, MA14 $1.5957 and MA28 $1.6837. Price must reclaim these areas; one bounce will not erase the downtrend. The Fibonacci map is important. The 4H chart marks $1.5042 as the 0.0 reference and $1.3817 as 1.0. Between them are 0.236 at $1.4753, 0.382 at $1.4574, 0.5 at $1.4430, 0.618 at $1.4285 and 0.786 at $1.4079. ZRO is now below the 1.0 level, so the full measured retracement has been exceeded. These are reference zones, not guaranteed support. Fundamentals are more nuanced than the chart. LayerZero says its interoperability protocol connects 165 networks and has moved more than $260B in cross-chain value. Its June 2026 token explanation describes ZRO as the asset intended to capture value across LayerZero, Stargate and the planned Zero network. Stargate revenue is directed to ZRO buybacks, while a separate LayerZero protocol fee switch would require governance activation before it can generate buyback-and-burn demand. Zero is designed for institutional settlement, payments and capital markets, with partners including DTCC, ICE, Citadel Securities, Tether and Google Cloud. These ambitions matter, but planned economics are not yet fully realized token value. There is also a near-term supply event. DeFiLlama lists 23.63M ZRO scheduled to unlock on November 19, around 5.91% of current circulating supply, allocated to core contributors and strategic partners. Unlocks do not mean automatic selling. LayerZero says actual investor sales have been below headline unlocks and points to Foundation and Stargate-funded buybacks. Still, new supply arrives while the chart is weak. Levels I am watching: 🔴 $1.4079: First Fibonacci reclaim level (0.786). A recovery above it would be an early sign of stabilization. 🔴 $1.4285–$1.4430: Fibonacci 0.618/0.5 zone, close to the 4H MA7 area. Reclaiming and holding this band would improve short-term structure. 🔴 $1.4574–$1.4753: Fibonacci 0.382/0.236 resistance. Buyers need to defend a retest after a breakout. 🔴 $1.5042: Fibonacci 0.0 reference and near the 4H MA14. A sustained reclaim would be a more meaningful recovery signal. 🟢 $1.3817: Fibonacci 1.0 reference, now just above price and an immediate reclaim test. 🟢 $1.3421: Visible 24H low. A decisive break below would expose further downside and weaken the case for a near-term base. I prefer evidence over trying to call a bottom. First I want price to reclaim $1.3817, then hold $1.4079 and work back through $1.4285–$1.4430 with improving volume. If rallies keep failing below the moving averages, the downtrend remains intact. A break under $1.3421 would make me more defensive. I would not treat oversold RSI as a standalone long signal. ZRO has a credible cross-chain role, but adoption, buybacks, fee-switch activation and token demand must be proven, not assumed. Strong fundamentals cannot cancel weak market structure. 🔥 Will ZRO reclaim $1.4079 and build a base, or will the November unlock and bearish momentum push it below $1.3421? $ZROUSDT #IMPACTbyTrade
ETH: The Leverage Reset Is Incomplete
Ethereum is still trading under pressure after last week’s sharp liquidation cycle. The latest CoinGlass snapshot puts $ETHUSDT near $1,816.60, down 1.32% over 24 hours and 14.35% over seven days. The day’s range has stretched from $1,710 to $1,857.60. Buyers have defended the low, but have not reclaimed the upper end with conviction. Derivatives data show that some leverage has left, although the process is not finished. Aggregate ETH futures open interest stands near $21.90 billion, down 3.02% over 24 hours. At the same time, tracked liquidations reached about $360.82 million, with $279.74 million coming from long positions. Falling price alongside lower open interest points to positions being closed or liquidated, not necessarily new shorts entering. Bybit’s $ETHUSDC perpetual offers a useful cross-check. Its open interest is around $1.36 billion, down 2.55% over 24 hours, while the funding rate is approximately −0.0047% per eight-hour period. Negative funding means shorts are paying longs, suggesting the perpetual market is trading with a bearish premium. Bybit recorded roughly $37.13 million in ETH liquidations over the same 24-hour window, heavily skewed toward longs at $33.32 million versus $3.81 million in shorts. Exposure is falling, but longs are still being forced out. The imbalance between derivatives and spot activity is another warning. CoinGlass reports roughly $64.45 billion in ETH futures volume against $4.48 billion in spot volume, a ratio of about 14.4 to one. This suggests short-term moves may be driven more by leverage than durable spot accumulation. The latest US spot ETH ETF reading was a modest $2.30 million net inflow on November 13; too little to establish a sustained demand trend. For ETH to build a credible recovery, the evidence needs to improve beyond a bounce from the $1,710 area. Spot participation should strengthen, open interest should stabilise without funding becoming aggressively positive, and price should hold above the recent intraday recovery zone. If price slips back toward the low while long liquidations remain dominant, the reset may still be working through the market. Key questions: 1. Can ETH hold above the $1,710–$1,800 area after the latest liquidation wave? 2. Will spot volume expand enough to support a recovery beyond derivatives trading? 3. Does falling open interest signal a healthier reduction in leverage, or simply another stage of forced exits? #IMPACTbyTrade

ブロックチェーンデータのアクセスを誰にでも販売するネットワークは、そのトークン自体の市場取引がほとんどない状況で生き残れるのだろうか? これがLavaを取り巻く緊張感の正体だ。同プロジェクトは、独立したプロバイダーがRPCリクエストを処理し、アプリケーションが信頼性の高い接続に対して支払いを行う「分散型アクセスレイヤー」としての地位を確立しようとしている。この問題は現実的だ。多くの「分散型」アプリは依然として少数の集中型RPCベンダーに依存しており、それが結果として単一障害点を密かに再導入してしまっている。もしLavaが信頼できるマルチプロバイダーの代替案を提供できるなら、その技術には意味がある。 画面に映し出される状況はもっと狭い範囲のものだ。LAVAは0.01596 USDTで取引されており、セッションでは2.15%下落、ティッカーの横には574.58Kと表示されている。もしこれがLAVA建ての出来高なら、想定元本は約9,000 USDTとなる。これは私の計算であり、取引所が確定した統計ではないため、時間枠を確認することもできない。しかし、これは問いを投げかけている。インフラトークンというものは、その利用ストーリーが自信を持って価格に反映される前に、現実的な市場の厚みが必要なのだ。 矛盾は、顧客が誰であるかという点にある。データアクセスを購入する開発者は、トークンの値動き(エクスポージャー)ではなく、安価で予測可能なコストを求めている。トークンで支払うことは設計上の選択であって、必然ではない。もし需要が主にインセンティブに由来しており、プロバイダーがリクエスト処理の報酬を得るためのものなら、トークンは消費ではなく補助金を反映していることになる。収益、供給量、ロック解除、手数料データなどを示唆するものは何もないため、どちらが支配的かを決めつけるつもりはない。 強気論としては、RPCはすべてのオンチェーンアプリケーションにとって経常コストであるという点だ。トークン連動型の決済を通じてその支出のわずかなシェアでも獲得できれば、2セント未満の資産が過小評価されているように見える可能性がある。弱気論としては、集中型のプロバイダーがすでにレイテンシと価格の面で十分に競争力があるという点だ。開発者は、分散化が単なるトークテーマではなく購入基準になったときに初めて乗り換えるものだ。 決定的なリスクは、トークンのユーティリティが回避される可能性があることだ。定着した競合他社に加え、トークン決済が任意であるという組み合わせは厳しいものであり、流動性の低さがさらにそれを悪化させている。少額の注文で価格が動くような状況では、一日のパーセンテージの変化はほとんど意味をなさない。 私の見解:論旨はもっともらしいが、目の前にある証拠がそれを裏付けているわけではない。薄い取引高での2.15%の下落はノイズであり、ファンダメンタルズに対する結論ではない。 次のマイルストーンは、インセンティブによって賄われる活動とは別に報告される、手数料を支払うリクエスト量の検証可能な成長と、オーガニックな手数料によって賄われるプロバイダー報酬の割合だ。それこそが、利用が対価を得ているのか、それとも単に支払われているだけなのかを示すことになるだろう。 もしLavaの顧客がどんな通貨でも支払えるとしたら、そのトークンは依然として必要だろうか? $LAVAUSDT #IMPACTbyTrade

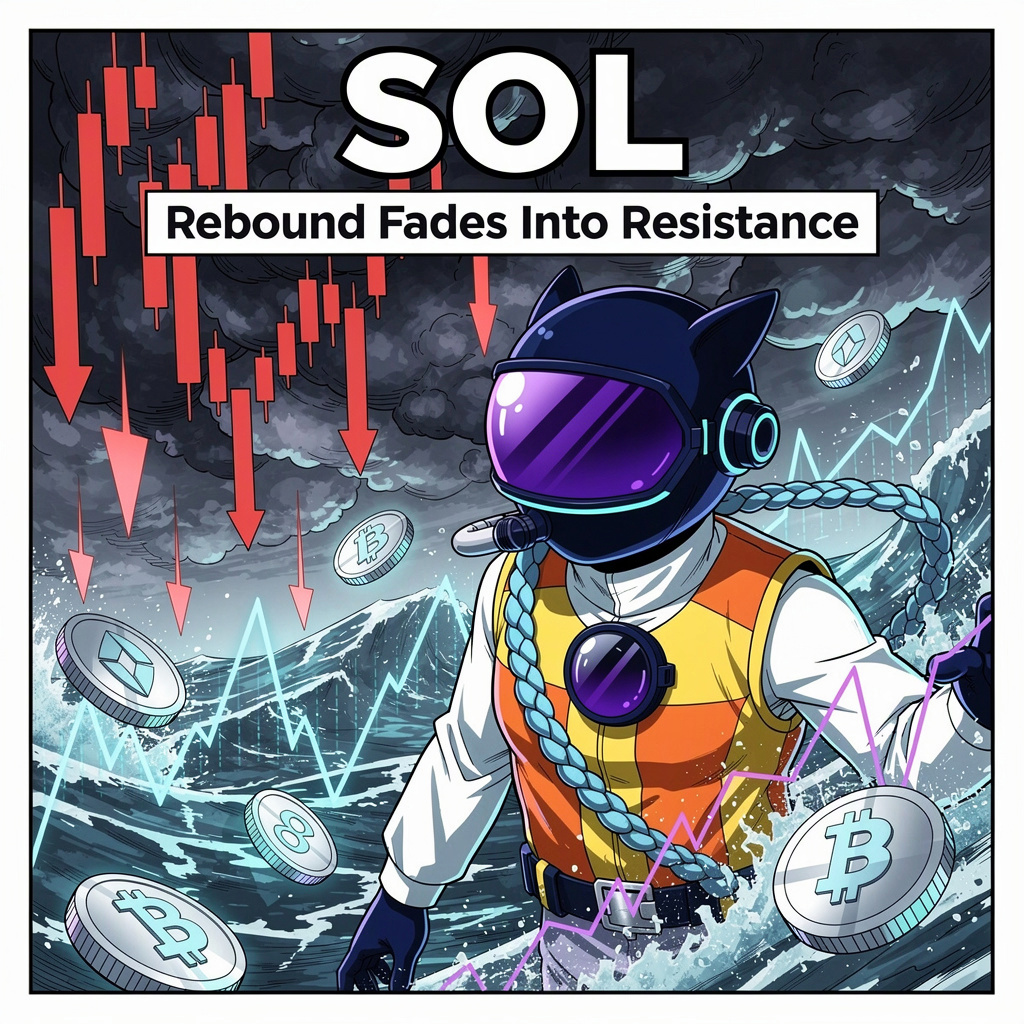
SOLUSDT:リバウンドが失速しレジスタンスへ
終盤の反発は、明確な回復に至らず足踏み状態です。$SOLUSDTは71.06ドルで、直近の確定足は71.42ドルでした。それ以前の12:00の陰線は70.76ドル、14:00の陰線は69.98ドルで引けており、買い手が介入する前に売り手が価格を押し下げている様子が伺えます。続く15:00の陽線は、この一連の流れの中で最大の出来高を伴い71.11ドルで引けました。これは明確な反応ですが、支配的なトレンドの持続的な転換とまでは言えません。 回復は19:00まで続き、陽線が72.87ドルで確定しましたが、その後の上昇は拒絶されました。21:00の陰線は、この一連の流れの中で最も広いレンジ幅で71.3ドルで引けました。23:00には、買い手は71.42ドルの終値をつけるのが精一杯でした。価格はMA7、MA14、MA28を下回っており、この反発だけでは時間足の構造は修復されていません。24時間変動はマイナス2.78%で、出来高は前日の約1.31倍です。下落に伴う活発な動きは、反発があったとしても依然として弱気な見通しを裏付けるものです。 私はSOLの現物を保有していますが、ショート戦略については、ここでの弱気相場を追うのではなく、条件付きで考えています。エントリーゾーンは70.748ドル~71.372ドルです。ここで試しに入り、近くの移動平均線を回復できずに失敗すれば、売り手にとってより有利な状況となるでしょう。ストップロスは72.932ドル、利確目標1(TP1)は69.5ドル、利確目標2(TP2)は67.94ドルです。ゾーンの中央から見たリスクリワード比は、TP1に対して約0.8対1、TP2に対して約1.7対1となっており、最初の目標値はリスクに対して控えめです。 価格がストップエリアを上回って維持されれば、この弱気な見方は弱まります。回復に失敗した後、再び地合いを崩すような動きがあれば、弱気な見方を裏付けることになるでしょう。24時間の値動きの幅や21:00の大きな陰線を見てもわかる通り、急激な動きの可能性があるため、各レベルを確実なものとして捉えるのではなく、執行やスリッページには注意を払うべきです。皆さんは、単なる「売り手に叩かれる反発」と「本物の時間足での回復」を見分ける際、何を重視しますか? トレードプラン(ショート / 弱気): • サポート: 67.41 / 67.41 | レジスタンス: 73.65 / 85.82 • エントリーゾーン: 70.748 - 71.372 • ストップロス (SL): 72.932 • ターゲット: TP1 69.5 | TP2 67.94 皆さんは、単なる「売り手に叩かれる反発」と「本物の時間足での回復」を見分ける際、何を重視しますか? あくまで私個人の見解であり、助言ではありません。IMPACTbyTrade

I've been watching $SUIUSDT closely, and what concerns me most right now is that the price is still struggling to build a strong recovery. Trading around $0.7168, SUI remains under selling pressure, and the overall market structure hasn't shown any convincing signs of a bullish reversal yet. There is a small recovery on the lower timeframe, but I don't think it's enough to change the bigger picture. Looking at the 6H chart, the downtrend is quite clear. SUI previously reached around $1.30, but since then, sellers have maintained control, pushing the price into a pattern of lower highs and lower lows. The moving averages support this bearish outlook. MA7 is around $0.7353, MA14 is near $0.7664, and MA28 stands at approximately $0.7981. With the current price trading below all three, buyers still have some work to do before the market can regain strength. Another level I'm paying attention to is the Bollinger middle band around $0.7847. If SUI manages to recover and hold above this area, it could be an early sign that buying momentum is improving. Until then, I would remain cautious. On the 15M chart, SUI has bounced after dropping toward $0.669. However, the recovery is facing resistance around $0.7235–$0.7370. This zone matters because it brings together the short-term moving averages and the upper part of the immediate recovery area. If buyers fail to reclaim it, the current bounce could simply develop into another lower high rather than the beginning of a new uptrend. The derivatives data adds another interesting perspective. The long-short ratio is approximately 1.99:1, showing that long positions are considerably higher than short positions. Meanwhile, 24H derivatives inflows are around 36.56M USDT, while outflows have reached 42.05M USDT, leaving a negative net flow of approximately 5.49M USDT. This suggests that more capital is leaving the derivatives market than entering it. With long positioning already elevated, another downward move could create additional liquidation pressure. For the downside, I'm watching $0.710–$0.700 first, followed by the previous 24H low at $0.6741. On the upside, $0.7386 is the first important level buyers need to reclaim. A stronger recovery would require sustained buying pressure rather than just a temporary bounce. Personally, I'm staying patient with SUI. I'm not treating this as an active long or short position. I want to see how price reacts around these levels before making a decision. Right now, protecting capital and waiting for confirmation makes more sense to me than rushing into a trade. #IMPACTbyTrade
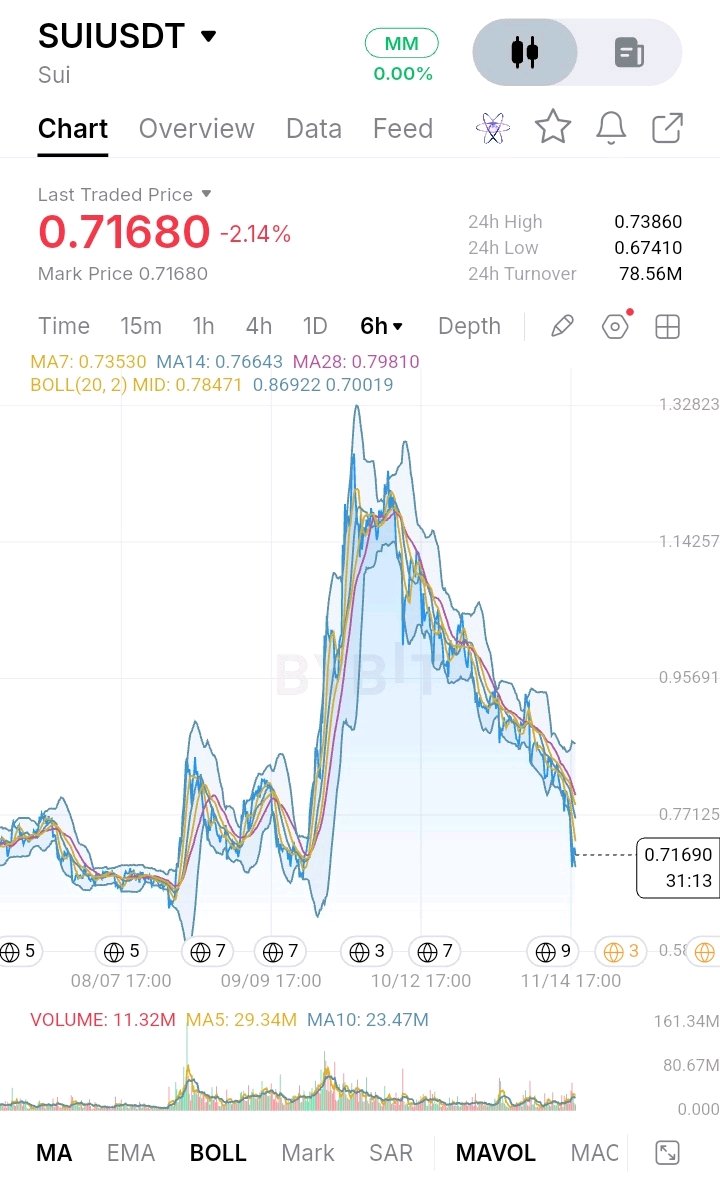
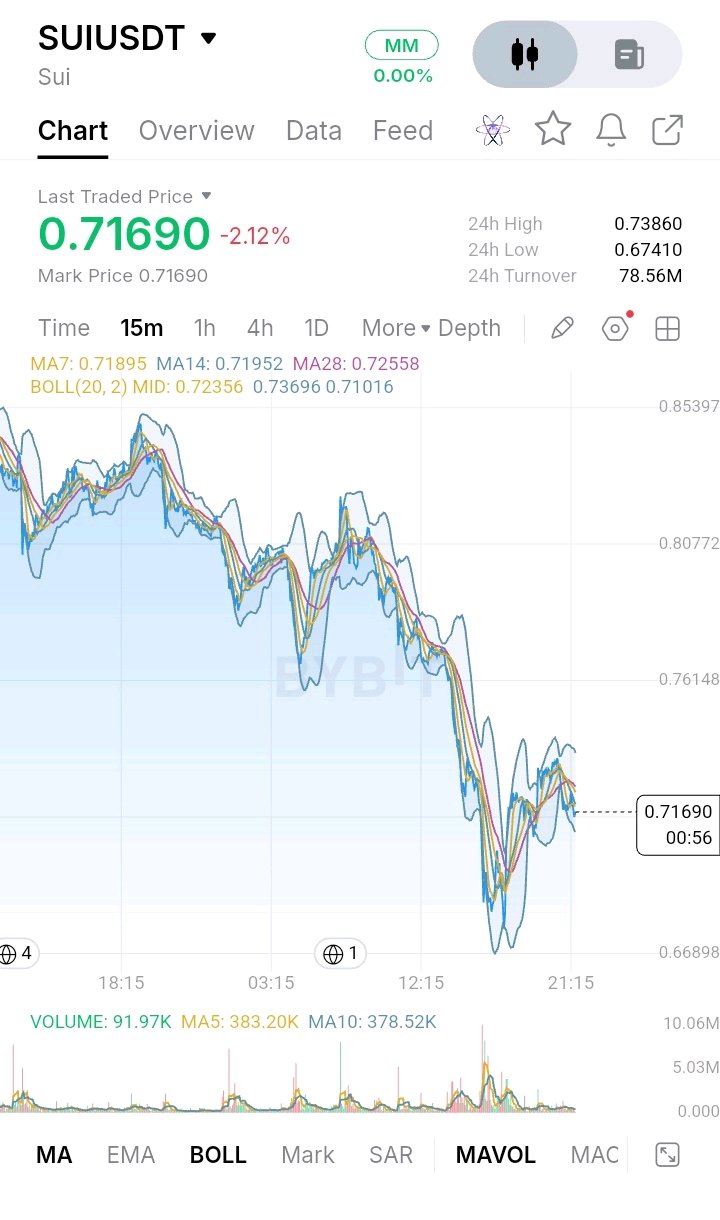
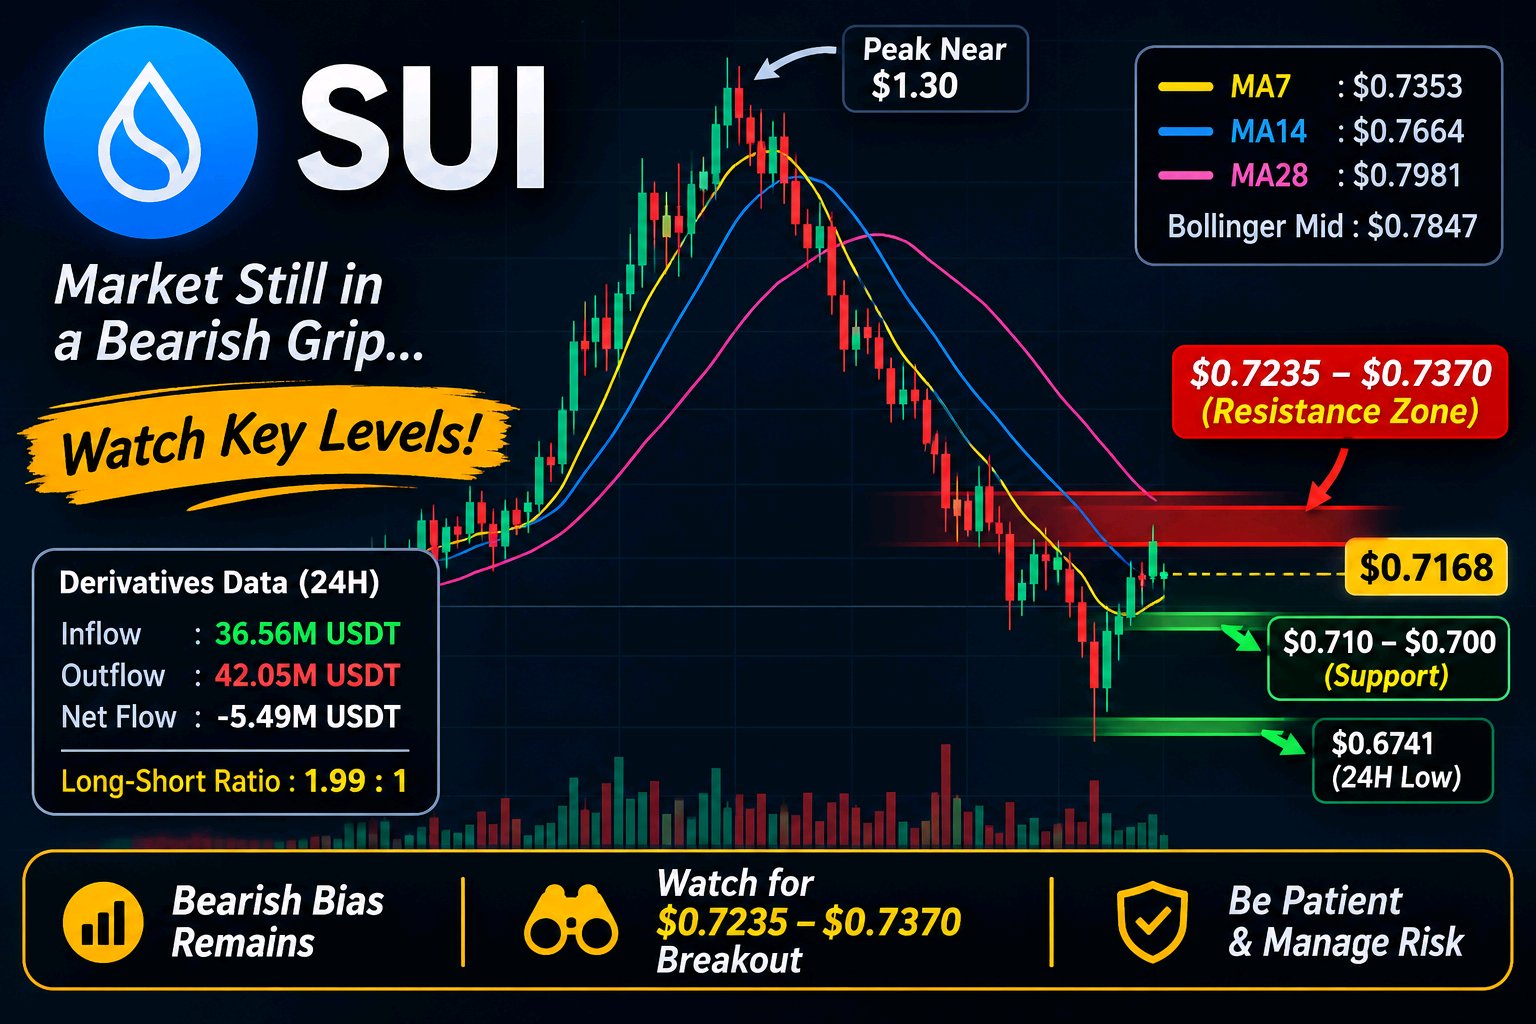

SUI Is Struggling to Hold $0.72 After Its Bounce From $0.6754 — Recovery or Another Breakdown? SUI has recovered sharply from $0.6754, but the rebound is now losing momentum around the $0.72 area. What makes this setup interesting is that buyers managed to recover a significant part of the drop, yet they have not reclaimed the resistance levels needed to change the broader trend. SUI/USDT: $0.7171 | -1.04% The 4H trend remains bearish The moving averages tell an important story: - MA7: $0.7181 - MA14: $0.7502 - MA28: $0.7816 Price is hovering around the 4H MA7 but remains well below MA14 and MA28. Both longer averages are still above the market, showing that sellers retain control of the broader structure. For buyers, reclaiming $0.7392 would be an early improvement. A stronger confirmation would require a sustained move above $0.7502. The 15-minute chart shows fading momentum The lower timeframe is also showing some weakness: - MA7: $0.7196 - MA14: $0.7201 - MA28: $0.7262 SUI is trading below all three short-term averages. The recent recovery has stalled, and the moving-average cluster around $0.7200–$0.7262 is now acting as overhead resistance. Volume adds another caution: current displayed 15m volume is 7.15K, compared with MA5 at 58.36K and MA10 at 55.71K. The rebound is not currently supported by strong trading participation. Key levels to watch Resistance - $0.7200–$0.7262: Short-term moving-average zone - $0.7392: 24H high and immediate breakout level - $0.7502: 4H MA14 - $0.7816: 4H MA28 Support - $0.7000: Nearby psychological and chart level - $0.6754: Recent low and major support Trading outlook Bias: WAIT — bearish structure, with a possible short-term recovery. A sustained breakout above $0.7392 could improve the recovery and bring $0.7502 into focus. Stronger confirmation would come if SUI reclaims the 4H MA14 with convincing volume. If price continues to struggle below $0.7262 and loses $0.7000, sellers could push it toward $0.6754 again. A decisive breakdown below $0.6754 would invalidate the current recovery structure and signal renewed downside pressure. I would avoid chasing either direction while price remains trapped between nearby support and resistance. The next confirmed move matters more than the temporary bounce. Do you think SUI can reclaim $0.7502, or will sellers push price back toward $0.6754 first? What are you watching on the 4H chart?$SUIUSDT #IMPACTbyTrade

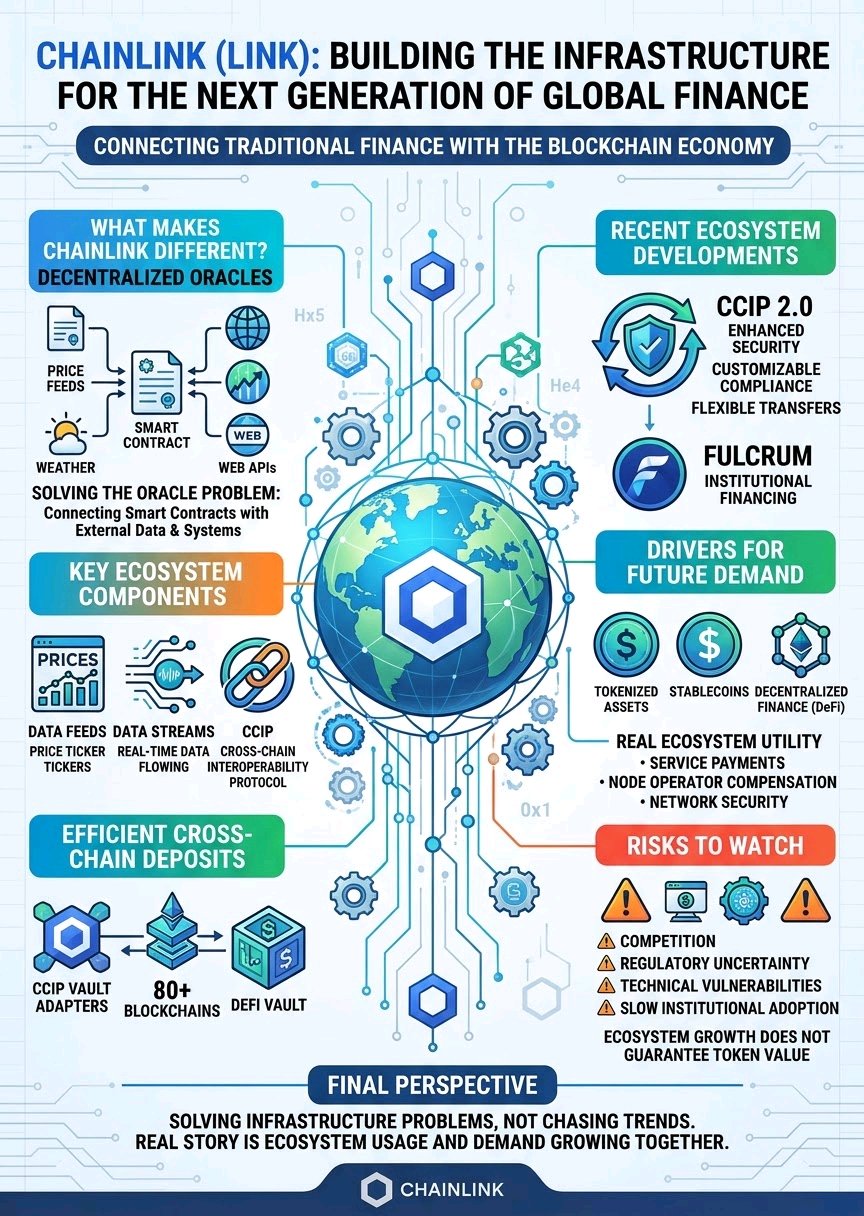
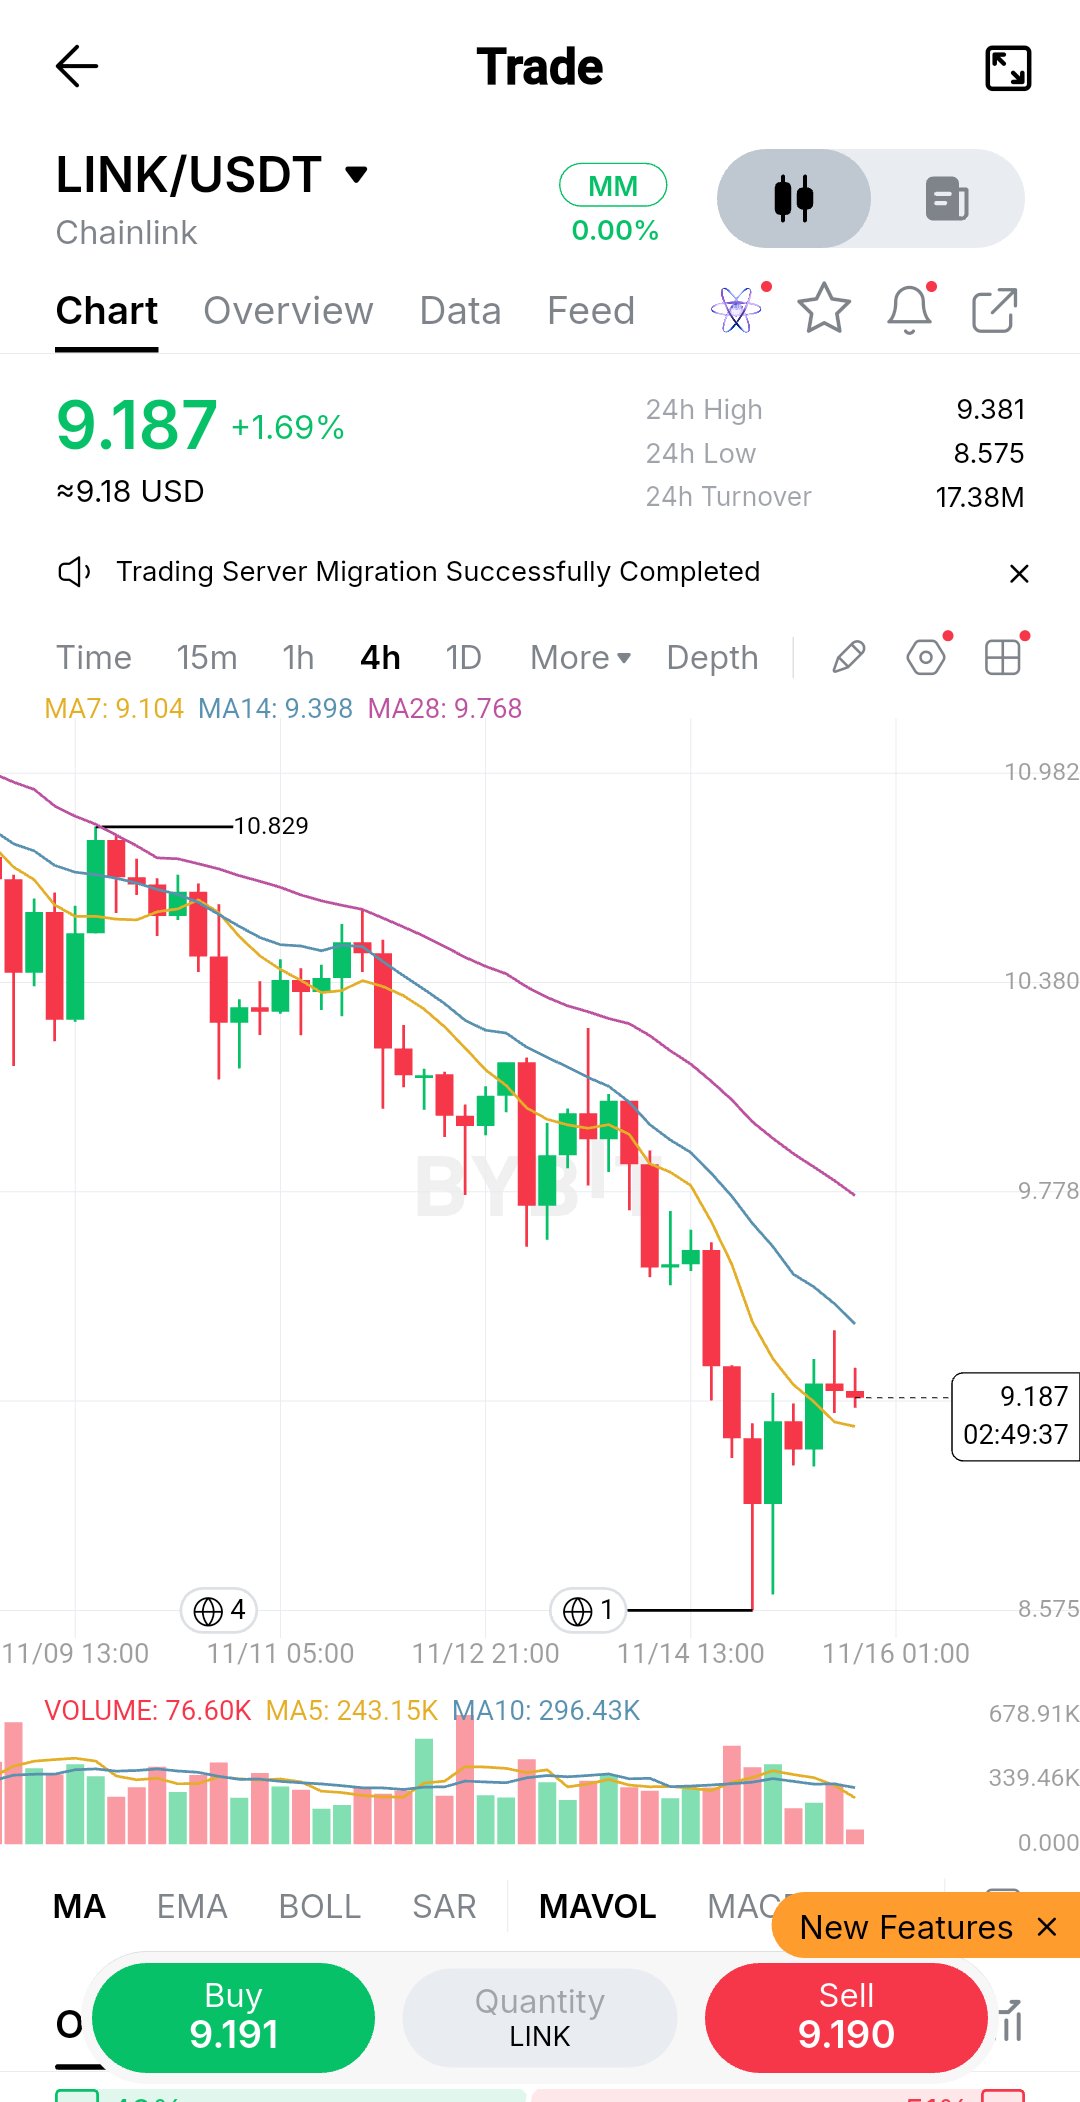
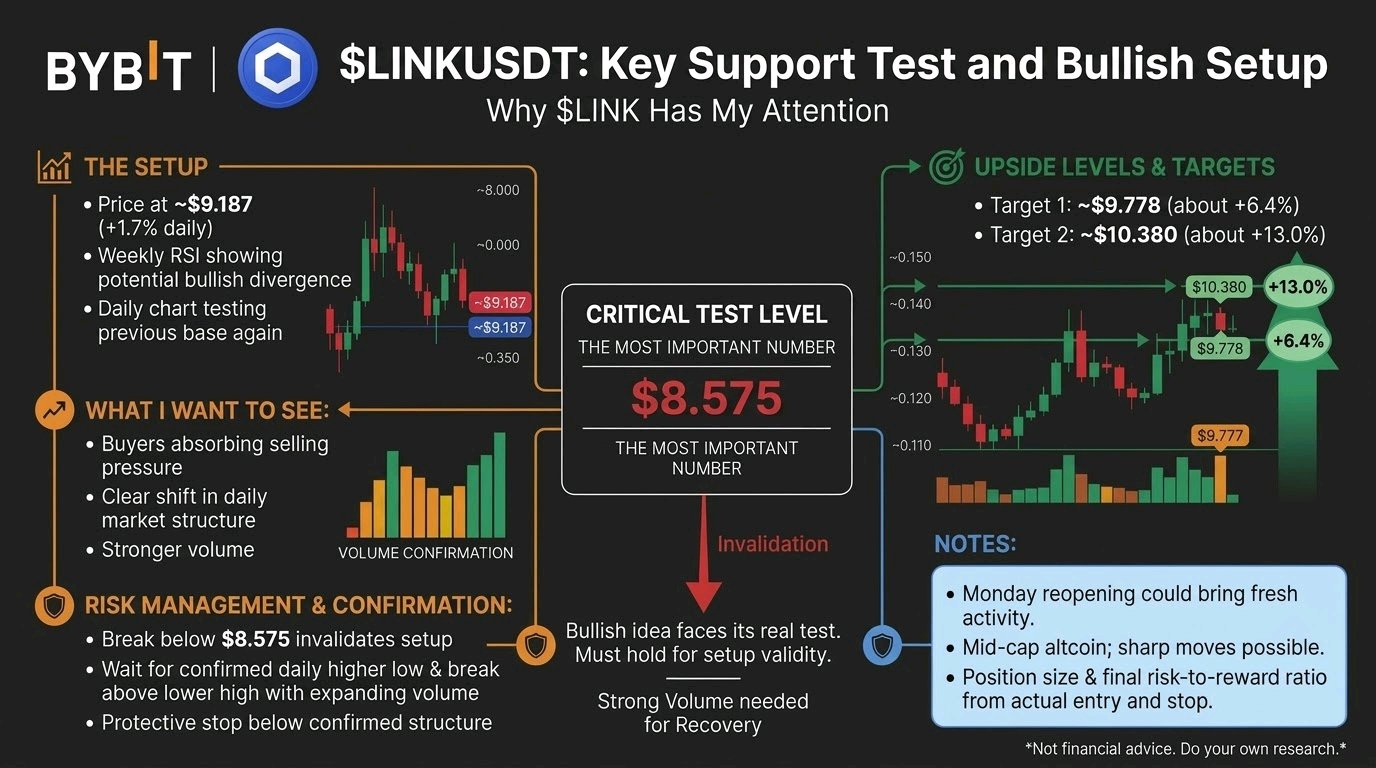
One red line. Two upside levels. This is why $LINKUSDT has my attention. The most important number on my chart is $8.575. That's where my bullish idea faces its real test. The setup $LINK is up about 1.7% on the day at roughly $9.187 after a bounce off the lows, and it is trading far below its prior highs after a steep multi-day slide. Weekly RSI analysis suggests a possible bullish divergence. The daily chart has already shown an initial reaction, and price is now testing that base again. What I want to see is buyers absorbing the selling pressure, followed by a clear shift in daily market structure. If that happens with stronger volume, I'm watching two swing levels: 🎯 Target 1: ~$9.778 (about +6.4% from $9.187) 🎯 Target 2: ~$10.380 (about +13% from $9.187) These are ambitious scenarios, not guaranteed returns. Monday's reopening of traditional markets could bring fresh activity, but $LINK needs its own buying volume to support a meaningful recovery. As a mid-cap altcoin, sharp moves can happen in either direction. Management: If price breaks below $8.575 and cannot recover that level, my bullish setup is no longer valid. For a new position, I want a confirmed daily higher low, a break above the latest lower high, and expanding volume. The protective stop belongs below the confirmed structure. Position size and the final risk-to-reward ratio must be calculated from the actual entry and stop, not assumed in advance. I'm heavily bullish on $LINK's recovery potential, but the next volume-backed move will determine whether this remains a promising chart or becomes a trade worth taking. Not financial advice. Do your own research and manage your risk. #IMPACTbyTrade

GLMR/USDT — Buyers Have Finally Stepped In, But Can They Turn This Bounce Into a Real Reversal? GLMR has caught my attention after the latest move. After spending weeks under selling pressure, buyers have suddenly stepped in and pushed the price toward $0.00790. The move is strong, and the volume makes it worth watching. But I don't want to confuse one powerful green candle with a confirmed trend reversal. There are still a few important levels that buyers need to overcome. What I'm seeing on the Daily chart GLMR is trading around $0.00778, with the latest daily candle showing a gain of nearly 38%. The first thing I noticed is that price has recovered above the EMA7 at $0.006862 and EMA14 at $0.007170. It is also approaching the EMA28 at $0.007711. However, the MA28 at $0.007912 is still an important overhead level. This means the recovery is improving the daily picture, but buyers haven't cleared every major resistance yet. Volume is particularly interesting. Daily volume has reached 46.39M, compared with the MA5 at 21.67M and MA10 at 20.71M. That's a meaningful increase in participation and gives this move more weight than a low-volume bounce. The daily RSI readings are also improving: - RSI6: 62.85 - RSI12: 52.26 - RSI24: 48.82 MACD is still slightly negative, with DIF at -0.000581 and DEA at -0.000554. So the daily momentum has not completely turned bullish yet. The 4H chart is showing something more encouraging This is where the recovery becomes more interesting. Price has moved above all the displayed short-term moving averages: - EMA7: $0.006765 - EMA14: $0.006479 - EMA28: $0.006519 - MA7: $0.006351 - MA14: $0.006203 - MA28: $0.006479 The 4H MACD has also moved into positive territory. DIF is at 0.000011, DEA at -0.000222 and the histogram at 0.000234. That's an improvement in short-term momentum. But there is one thing I wouldn't ignore: RSI6 has reached 76.59, while RSI12 is at 69.65 and RSI24 at 61.44. Short-term momentum is now quite stretched. Buyers may still push higher, but a pullback or consolidation wouldn't surprise me. The price levels I am watching Here are the areas that matter most to me: - $0.008385 — Recent high and immediate breakout resistance. - $0.00791–$0.00792 — Daily MA28 resistance zone. - $0.007823 — Important 4H Fibonacci reference level. - $0.00717–$0.00686 — Daily EMA14 and EMA7 support area. - $0.00675–$0.00620 — Important 4H moving-average support cluster. - $0.006034 — Additional downside reference from the displayed Fibonacci tool. - $0.005411 — Recent low and major structural support. What would make me more confident? I want to see GLMR hold above the $0.00782–$0.00792 region rather than simply touch it and fall back. If buyers manage to establish support above this zone, the next important test will be $0.008385. A convincing break above that high, supported by sustained volume, would make the recovery considerably more interesting. Beyond that, $0.00876 becomes the next visible chart reference. On the other hand, if price gets rejected around $0.00791–$0.008385 and starts losing $0.00717, I'll be watching for a deeper pullback toward the $0.00675–$0.00620 area. A move back below $0.005411 would seriously damage the current recovery structure. How I would approach a trade I wouldn't chase GLMR after a nearly 38% daily move. For a long setup, I'd rather wait for a pullback and see whether the $0.00782–$0.00792 region can hold as support. A confirmed breakout above $0.008385 followed by a successful retest would be another possible setup. For an invalidation level, the $0.00717 area is an important first reference, while a deeper structural failure below $0.00620 would weaken the recovery further. The actual stop should depend on the entry and position size. My view is that GLMR has finally shown buyers are willing to defend the market, and the 4H momentum supports that improvement. But the daily chart still needs confirmation. I want to see buyers prove they can hold the reclaimed levels, not just produce one impressive candle. The bounce is real. Whether it becomes a trend reversal is the next question. $GLMRUSDT #IMPACTbyTrade

BNBUSDT: A $1.19B Token Burn Couldn't Prevent the Sell-Off. Here's What Matters Now. BNB's latest correction is exposing an interesting contradiction: its token supply continues shrinking, but market demand is not strong enough to protect price. BNB is trading around $590–$599, following a sharp decline from the $680 region. On November 14, it dropped 7.68%, and the November 15 session has so far produced a rebound from approximately $566. That recovery deserves attention, but I wouldn't call it a trend reversal yet. The supply story is improving. The demand story is not. On October 19, BNB completed its 37th quarterly burn, permanently removing 1,646,196.44 BNB, worth approximately $1.197 billion at the time. This is more than a headline event. BNB's Auto-Burn mechanism gradually reduces supply toward a target of 100 million tokens. Additionally, BEP-95 burns a portion of gas fees generated through BNB Chain activity. There is a structural supply-reduction mechanism behind the asset. But here's the overlooked part: a token burn reduces available supply; it does not guarantee immediate buying pressure. Derivatives are revealing the weakness. Current aggregated market data shows: - Futures volume: approximately $1.33B. - Spot volume: approximately $193M. - Open interest: approximately $962M, down around 0.86% over 24 hours. - Funding: slightly positive at approximately 0.0008%. - Liquidations: approximately $13.4M, with roughly 97% coming from longs. Futures activity is almost seven times spot volume. More importantly, both spot and futures flows have recorded net selling over the past seven days. This suggests the correction isn't simply a temporary leverage reset. Actual spot demand also needs to improve. What the chart is telling me The $566–$582 region is becoming an important short-term demand area after the latest sell-off. The market has bounced from that zone, but buyers still need to establish control. My key levels: - $566: Recent session low. Losing this level would weaken the recovery attempt. - $582: Important short-term price reference from the previous daily close. - $600–$612: Immediate recovery territory where buyers need to demonstrate strength. - $630: A more meaningful resistance area following the recent breakdown. On the 15M, I want to see higher lows rather than another short-lived bounce. On the 1H, holding above $600 would improve the immediate structure. On the 4H, reclaiming $630 would provide stronger evidence that sellers are losing control. The broader market matters too. Binance Research's November report highlighted rising inflation, stronger expectations of a December Fed rate hike and weaker institutional demand as important pressures on crypto markets. BNB cannot completely escape that environment, regardless of its own token-burning mechanism. My approach is conditional: If buyers defend $582 and reclaim $612 with stronger spot participation, recovery toward $630 becomes more credible. If $566 breaks decisively, I would avoid assuming that the recent bounce represents a bottom. BNB's tokenomics are reducing supply, but the market is demanding something more important right now: evidence that real buyers are willing to absorb the available selling pressure. A burn supports the long-term supply story; demand must prove the short-term price story. $BNBUSDT #IMPACTbyTrade
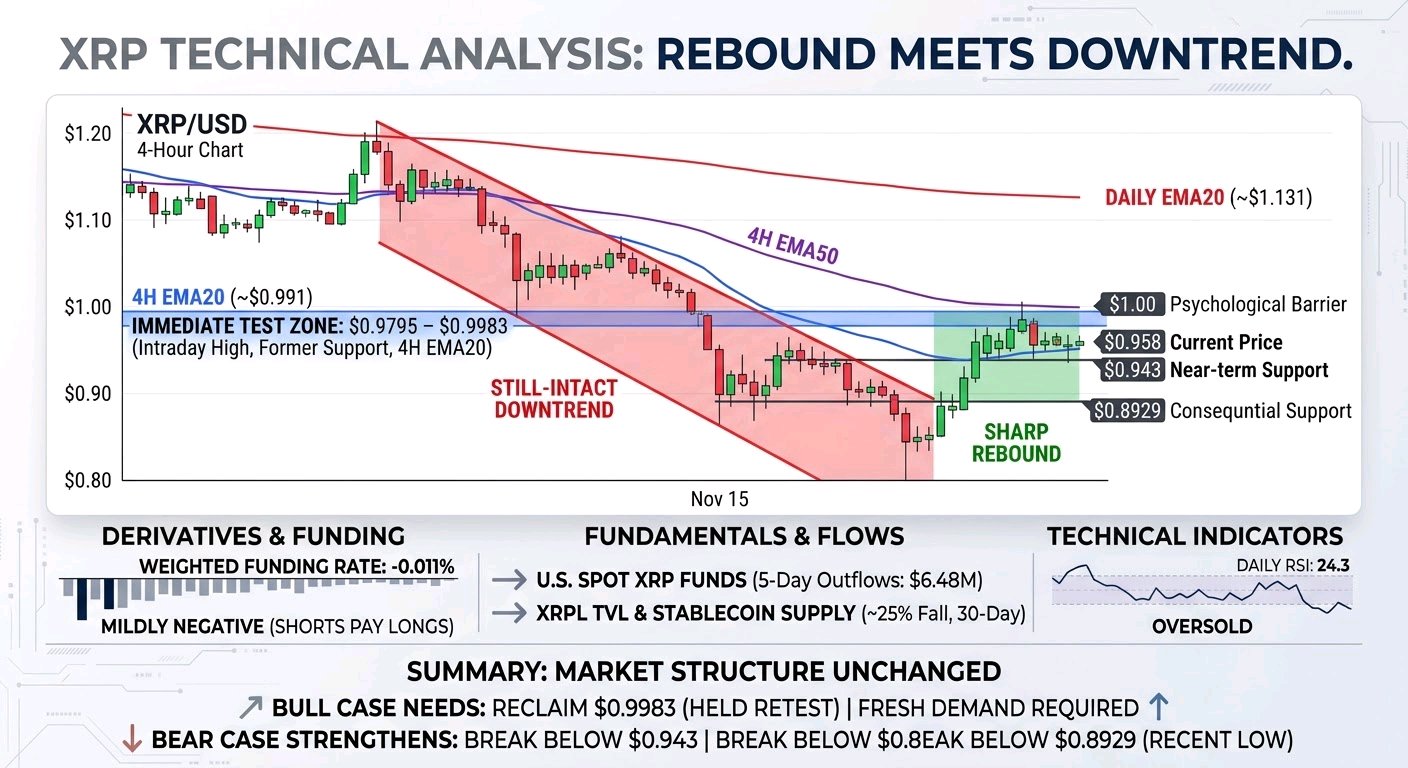
$XRPUSDT is caught between a sharp rebound from a two-year low and a still-intact downtrend. At about $0.958 on November 15, it is up 4.78% from the prior daily close, after trading as low as $0.8993. That bounce matters, but it has not yet changed the market structure: XRP remains below $1, below its 4-hour EMA20 near $0.991, and well below its daily EMA20 near $1.131. The market is asking whether buyers have found real demand—or whether they are simply responding to an oversold flush. The immediate test is $0.9795–$0.9983. That zone combines the recent intraday high, the former $1 support area, and the 4-hour EMA20. A brief move above it would not be enough by itself. I would want to see XRP hold above the zone on a retest, with meaningful spot buying and open interest rebuilding. Otherwise, a rally could be short covering or position adjustment rather than fresh demand. A break below $0.943 would weaken the near-term bounce; $0.8929, the recent low, is the more consequential support. If that level gives way, the market has not yet shown a strong nearby base. The broader technical picture is unambiguous, though not a timing signal. XRP is down 17.2% over 7 days and 28.0% over 30 days. The daily RSI is 24.3, an oversold reading, but oversold markets can remain weak. On the 1-hour chart, price is near the EMA20 and below the EMA50 around $0.976; on the 4-hour chart it remains below both the EMA20 and EMA50. These facts favor caution on the bounce, but a successful reclaim of $0.9983 would make the bearish interpretation less secure. The derivatives picture is mixed. Funding is mildly negative across the tracked venues, with the weighted rate at -0.011% per 8 hours; shorts pay longs, which can make short positions costly and leave room for a squeeze. Yet this is not evidence that a squeeze is underway. OKX open interest is down 9.4% over 7 days, but that is one venue, and dollar-denominated open interest can fall simply because the token price falls. Long/short data also conflicts: accounts are net long, while top traders’ positions lean short. Reported recent liquidations hit longs hardest, but the available figures do not establish precise liquidation clusters or prove broad market-wide deleveraging. We still need to ask: if price rises, does open interest grow with it, or do shorts merely close into thin demand? There are real fundamental headwinds, but their timing is less clear. U.S. spot XRP funds saw $6.48M in net outflows over 5 days and $1.18M over 20 days, though the latest reported session was positive. XRPL stablecoin supply and value locked each fell about 25% over 30 days. Those are signs of weaker marginal demand and network capital, not proof that they caused this week’s selloff. A reported 240M XRP transfer did not reach an exchange, and exchange-balance readings are disputed because newly tracked wallets changed the totals. Neither establishes a wave of sell-side deposits. No verified new announcement or token unlock in the retrieved recent news clearly explains the move; 36.5% of maximum supply remains outside circulation, a longer-term supply consideration, not evidence of an immediate release. My read is that broad crypto weakness, extreme fear, ETF outflows, and long liquidations explain the pressure better than any single XRP-specific event. But we lack spot CVD, order-book imbalance, and reliable whale-flow evidence, so claims of accumulation or distribution would be premature. The bull case needs a held reclaim of $0.9983, supported by spot demand; the bear case strengthens if $0.943 fails and especially if $0.8929 breaks. Which side is actually taking initiative—spot buyers or leveraged traders—and will the next move in open interest confirm it?#IMPACTbyTrade

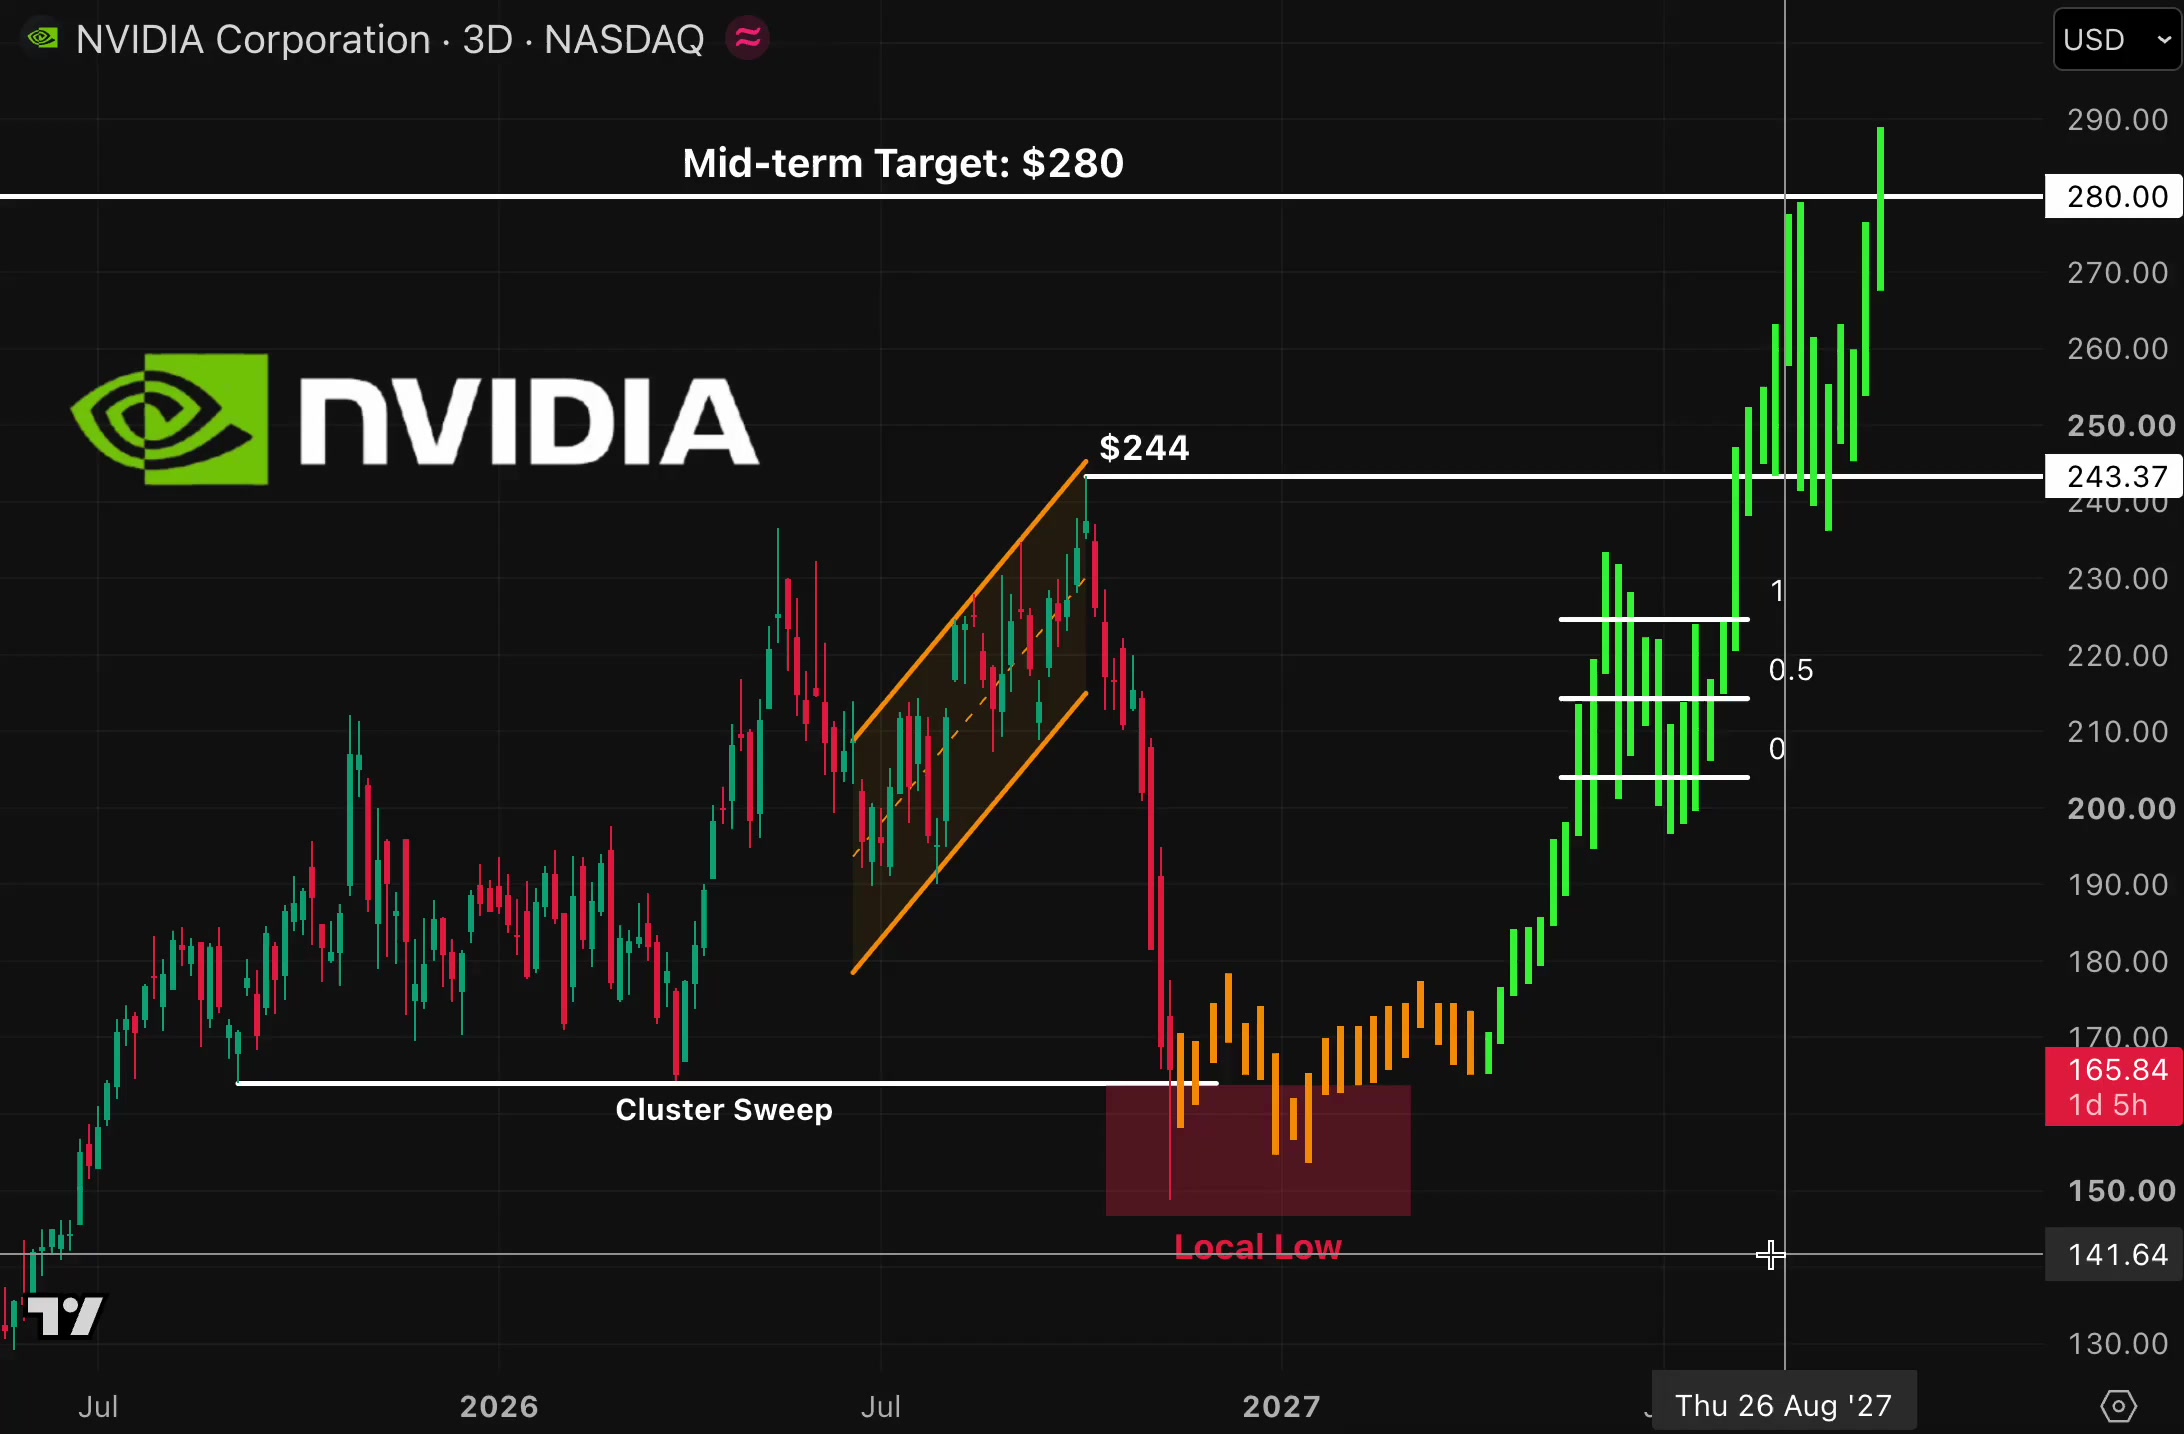
NVDA has gone from a hard slide to a quiet base, and a quiet base is the kind of chart where I'd rather buy a small dip than chase the high. The chart attached is only background on the bigger picture. The trade below stands on today's Bybit 1h and 15m charts alone. $NVDAXUSDT is at 161.55 (+1.12%), inside a 24h range of 156.15 to 161.74 That puts it 97% of the way up the range, 3.5% above the low and 0.1% under the high. Turnover is 54.23M. The levels I'm watching: Up: 161.74 (24h high) -> 163.99 (chart gridline, an area) -> 171.84 (1h chart high) Down: 160.89 (1h MA7) -> 160.80 (1h MA14) -> 160.70 (15m MA14) -> 160.35 (1h MA28) On the 1h, price is over MA7 (160.89), MA14 (160.80) and MA28 (160.35), by 0.4%, 0.5% and 0.7% The three have flattened and bunched after the slide from 171.84, so I read 160.35 to 160.90 as one support zone, and price is only now stepping away from it. On the 15m, price is over MA7 (160.85), MA14 (160.70) and MA28 (160.84), by 0.4%, 0.5% and 0.4% All three are tightly stacked and turning up, and the last candles are a clean run of green into the 24h high. I don't want to buy the top of that run, I want it to come back to the stack. I'm watching volume. The 15m bar is 2.79K against MA5 2.66K and MA10 2.38K with 06:42 left, so the push is above both averages but still forming. The 1h bar is 12.87K against 8.80K and 8.64K with 06:37 left, also above both. Participation is picking up on the way up, which is what I want from a base, but it is still small next to the flush earlier in the week. The trade, buying the dip into the stack: - Entry: 160.60 to 161.00 (limit, needs a 0.3% to 0.6% dip) - Stop: below 159.90 - Target 1: 162.30 (~1.7R from 160.80) - Target 2: 163.60 (~3.1R) Invalid if the 15m closes below 159.90, because that loses the 1h MA28 and the whole stack together. My thinking is to stay small, since this is a TradFi perp with thin liquidity and price is already at the 24h high. Limit orders, small size, and no dip, no trade. #IMPACTbyTrade
SOLANA ($SOLUSDT): Can Bulls Turn the Momentum Around? Solana is facing a challenging market environment, and traders are watching closely for signs of strength. Here are three things I am monitoring: Whether buyers defend the recent support area. Whether trading volume starts recovering. Whether SOL can build a stronger market structure. A recovery needs confirmation, not just hope. SOL community: Are you waiting for a bullish reversal or expecting more downside? #IMPACTbyTrade

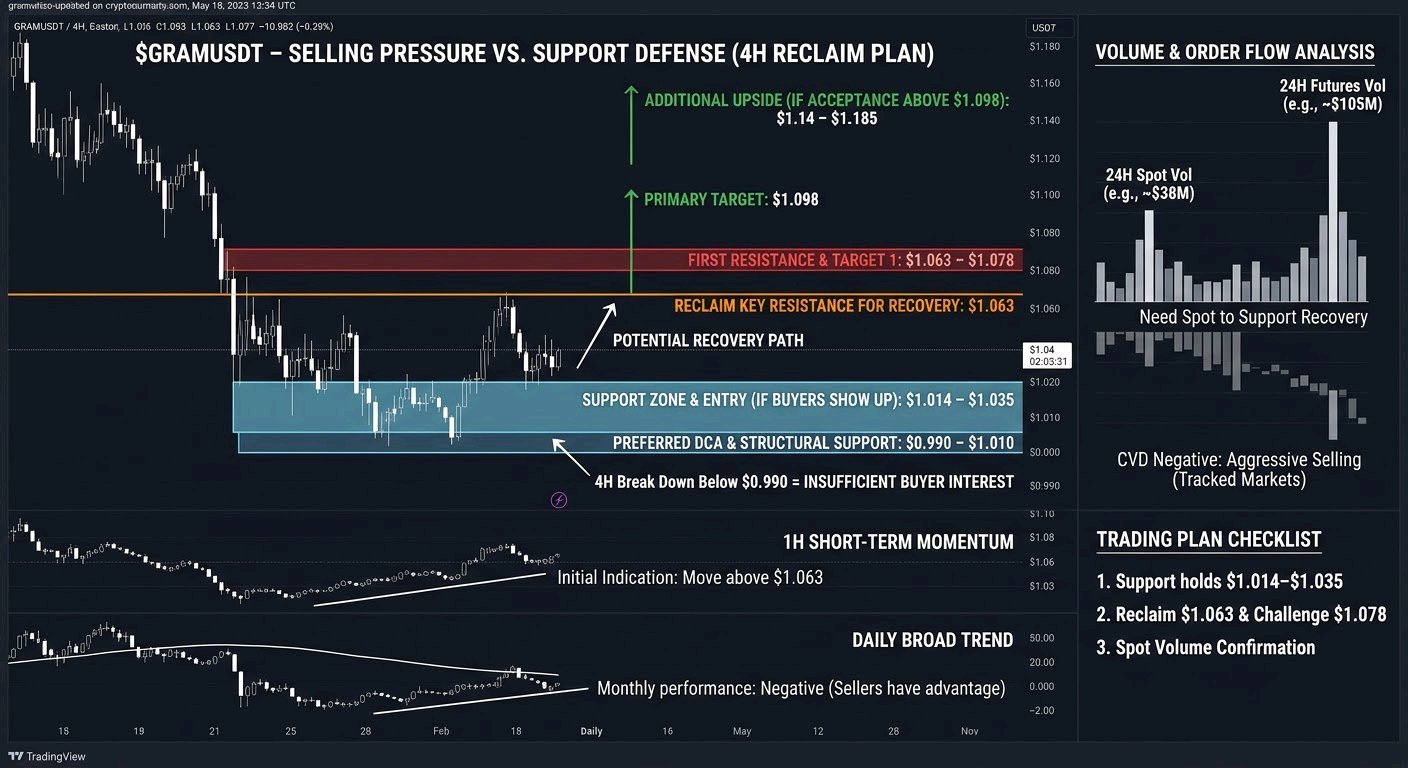
$GRAMUSDT – SELLING PRESSURE IS STILL PRESENT, BUT I'M WATCHING THE $1.06 RECLAIM FOR A POSSIBLE RECOVERY $GRAM is approaching an important decision zone, and I'm paying close attention to how price reacts around the $1.01–$1.04 support area. The market is showing mixed signals. While the 4H structure has some recovery potential, the 1H and daily trends remain under pressure. I don't want to assume a bullish reversal before buyers prove they can take control. Market Overview GRAM is trading around $1.04–$1.05, with recent price action showing continued weakness after a significant decline. On the broader timeframe, the monthly performance remains negative, suggesting that sellers still have the advantage in the bigger picture. I'm monitoring the 1H and 4H charts closely. A sustained move above $1.063 would be the first indication that short-term momentum is improving. The next important resistance sits around $1.078, followed by the $1.098–$1.14 region. Volume Analysis GRAM has maintained meaningful trading activity, with recent market data showing approximately $105M in futures volume and $38M in spot volume over 24 hours in one reported snapshot. However, trading activity alone doesn't confirm accumulation. Recent order-flow data also showed negative cumulative volume delta, indicating that aggressive selling has been outweighing buying across tracked markets. For me, the important signal will be whether spot buyers start supporting the recovery rather than relying entirely on futures activity. My Trading Plan I'm interested in a potential recovery setup, but I want confirmation before committing to a position. Initial Entry Zone: $1.014–$1.035 Preferred DCA Level: $0.990–$1.010, only if support holds and buyers show a clear reaction. First Resistance: $1.063–$1.078 Primary Target: $1.098 Additional Upside Potential: $1.14–$1.185 if momentum strengthens and price establishes acceptance above the previous resistance zones. My preferred confirmation is a strong 4H recovery followed by a successful retest. I don't want to chase a sudden green candle without evidence that buyers are taking control. What Could Go Wrong? The biggest risk is another breakdown below the $1.014 support area. If sellers push price below this level, the $0.990 region becomes an important structural support to watch. A sustained 4H breakdown below $0.990 would significantly weaken my recovery expectations and could open the door to another downward move. I also want to see improving spot demand. If futures activity increases while spot buying remains weak, any recovery could struggle to maintain momentum. Risk management remains essential. I would rather miss an entry than hold a position through a confirmed structural breakdown. My Perspective GRAM is interesting because price is approaching a major support region while trading activity remains relatively strong. However, I don't see enough confirmation to call this a confirmed bullish reversal yet. My focus is on three things: 1. Whether $1.014–$1.035 attracts genuine buying interest. 2. Whether GRAM can reclaim $1.063 and challenge $1.078. 3. Whether spot volume starts supporting upward price movement. My expectation is a possible short-term recovery if buyers defend the current support region. A move toward $1.098 and potentially $1.14 becomes more interesting after resistance is reclaimed. For now, I'm staying patient. The support reaction and the $1.063 breakout will tell me much more than simply guessing the next direction. $GRAMUSDT #IMPACTbyTrade

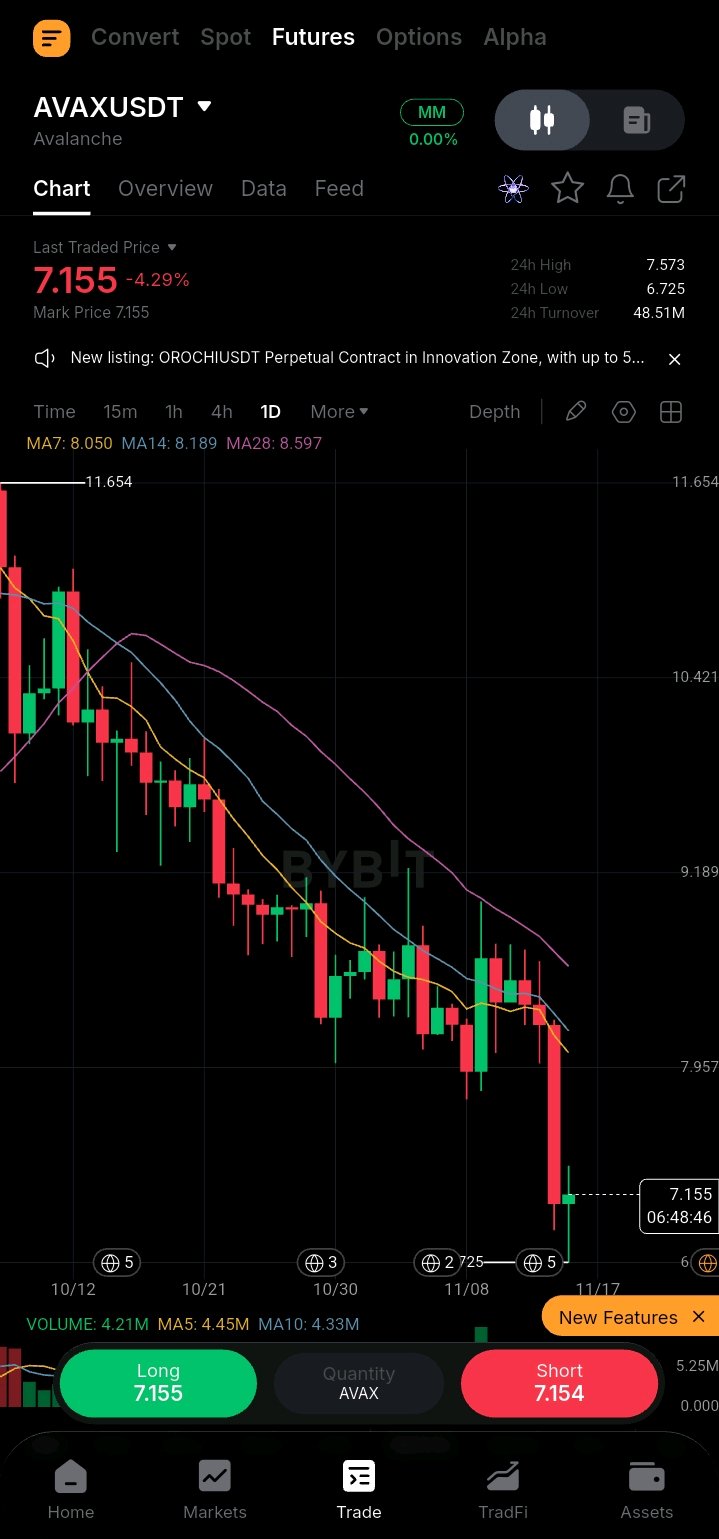
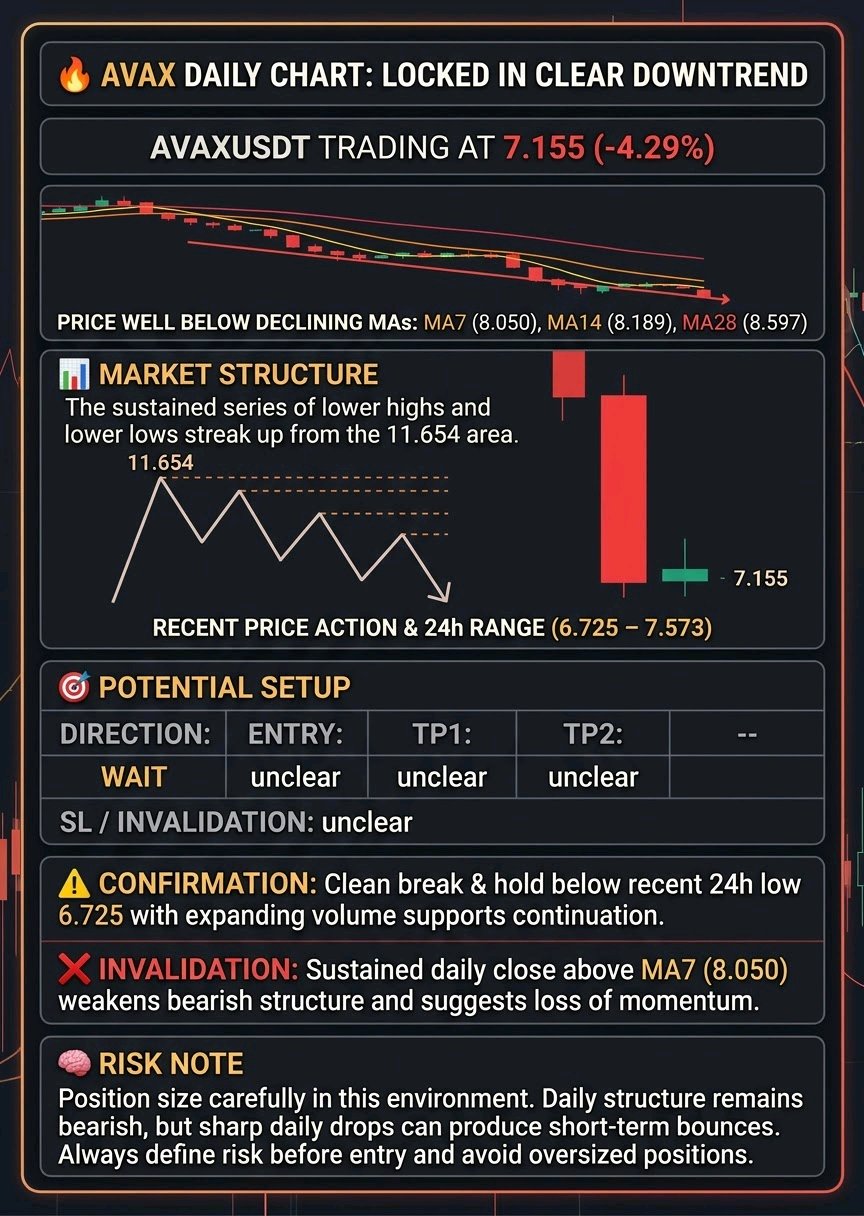
AVAXの日足チャートは、依然として明確な下降トレンドから抜け出せていない
AVAXUSDT は現在7.155で取引されており、-4.29%の急落を見せ、日足ベースでは下降傾向にあるMA7、MA14、MA28を大きく下回っています。 📊 市場構造: チャートは11.654のエリアから現水準まで、高値と安値を切り下げる動きが続いています。価格は依然として下降傾斜の移動平均線(MA7: 8.050、MA14: 8.189、MA28: 8.597)の下に位置しており、弱気相場が継続しています。直近では大きな陰線が形成され、その後7.155付近で小さな陽線が出現しました。24時間のレンジは6.725から7.573です。 🎯 潜在的なセットアップ: 方向性: 様子見 エントリー: 不明 TP1(利益確定1): 不明 TP2(利益確定2): 不明 SL(損切り)/ 無効化: 不明 ⚠️ 確認事項: 出来高を伴って直近の24時間安値である6.725を明確に割り込み、その水準を維持すれば、下降トレンドの継続が裏付けられます。下降中のMA7を回復し、その上で推移することが、安定化に向けた最初の兆候となります。 ❌ 無効化(シナリオ崩れ): MA7(現在8.050)を上回って日足が確定すれば、目先の弱気な構造が弱まり、下降トレンドが勢いを失っていることを示唆します。 🧠 リスクに関する注記: このような市場環境ではポジションサイズに十分注意してください。日足構造は依然として弱気ですが、急激な下落は短期的なリバウンドを生む可能性があります。エントリー前に必ずリスクを定義し、過度なポジションサイズは避けてください。 #IMPACTbyTrade
BR is trading near $0.4277 on Bybit, down roughly 1% on its exchange snapshot, while broader data shows a sharper daily decline. After pulling back from $0.47, the key test is whether buyers defend $0.416–$0.420. Market Snapshot CoinGlass showed an aggregate quote near $0.4415, while its Bybit exchange table showed $0.4277; I’m using the Bybit-specific quote for this trading read. CoinGlass reported a 24-hour range of $0.4164–$0.4732, market cap near $132.25 million, fully diluted valuation around $441.5 million, and spot volume near $1.06 million. Futures volume was about $15.66 million, almost 15 times spot turnover. CoinGlass lists 301.67 million circulating against a 1 billion maximum, though other trackers report a lower float. Treat the exact circulating figure cautiously; most of the maximum supply is not yet in circulation. Derivatives and Positioning Aggregate OI is $21.49 million, down 4.47%. Funding is positive near 0.025%, meaning longs are paying shorts. Liquidations were $48,900, about 96% from longs. Price weakness alongside positive funding and long liquidations suggests leveraged buyers have been caught leaning into the market. Bybit’s table showed BRUSDT futures volume near $1.29 million and OI around $1.89 million, down about 5.9%. Funding remains positive, so crowded longs may still need to unwind. A recovery with stronger spot volume would be healthier than a futures-only spike. Technical Structure Support sits at $0.420–$0.4164. A hold and reclaim of $0.435 would suggest buyers are absorbing supply. Above that, watch $0.450, then $0.470–$0.473 resistance. If $0.4164 fails on expanding volume, watch $0.400 and then $0.380. A quick reclaim after a wick below support would weaken the bearish case; repeated closes beneath it would strengthen it. Fundamentals and Product Activity Bedrock builds Bitcoin-focused DeFi infrastructure through uniBTC, brBTC and liquid-staking assets including uniETH and uniIOTX. The thesis is to make Bitcoin capital productive across DeFi and multiple networks. DefiLlama’s uniBTC dashboard reported TVL of about $247.8 million, but that figure had fallen around 29% over 30 days, from approximately $355 million on October 16 to $258 million on November 14. That contraction suggests capital has been leaving the product. The dashboard showed just $1,047 in 30-day uniBTC fees and revenue, with zero holder revenue. TVL is deposited capital, not sustainable income or direct value flowing to BR holders. Stronger fees and retained liquidity are needed. Token Utility and Governance BR is Bedrock’s governance and reward token. Locking it creates veBR, which provides voting rights over protocol decisions and gauge incentives. This utility does not mean holders automatically receive protocol revenue. Long-term demand depends on reasons to lock BR beyond emissions. Watch governance participation, product usage, liquidity and fee growth. Tokenomics and Unlock Risk BR has a 1 billion maximum supply. Tokenomics.com lists 20% strategic reserve, 20% team, 18.5% marketing, 14.5% future incentives, 12.5% seed investors, 5.5% airdrop, 5% IDO and 4% liquidity. Its vesting page lists a December 20, 2026 unlock of approximately 70.8 million BR, or 7.1% of total supply, allocated to insiders and private investors. Trackers disagree on supply and vesting, so verify the official schedule. Even so, a release this large relative to market cap is a material risk when spot liquidity is thin. Trading Scenarios Bullish case: defend $0.4164, reclaim $0.435 and then break $0.450 with rising spot volume. A sustained break above $0.473 could open $0.50. Bearish case: lose $0.4164 and fail to reclaim it. That would keep sellers in control and put $0.400, followed by $0.380, on the radar. Positive funding and weak spot turnover make a leveraged bounce vulnerable to another flush. Here’s the level map I’m tracking: - Immediate support: $0.420–$0.4164 - Resistance: $0.435, then $0.450–$0.473 - Bullish confirmation: sustained break above $0.473 with stronger spot participation - Bearish signal: breakdown below $0.4164 and failed reclaim My view is cautious. Bedrock has a BTCFi product suite and governance utility, but falling TVL, low reported fees, positive funding and the upcoming unlock deserve respect. I want spot demand before chasing a futures-led bounce. Are you watching $0.416 support as a potential entry, or waiting for a confirmed reclaim of $0.473?$BRUSDT #IMPACTbyTrade

Cardano's founder just declared the roadmap "finished" — the same week ADA crashed to $0.1429, 95% below its all-time high. Cardano is the peer-reviewed proof-of-stake Layer-1. On November 13, founder Charles Hoskinson said in a livestream titled "Finishing Cardano" that the original roadmap is complete. The market answered within a day: ADA lost 12.3% on November 14, closed at $0.1478, its lowest close since June 30, and tagged $0.1429 intraday. A year ago it was $0.5033 — over 3x today's price. The catalyst goes beyond that. A treasury request for a Copper strategic reserve of 22 million ADA closes today — a live vote on Cardano stockpiling its own token. Behind it: the Dijkstra hard fork with Leios scaling, testnet live since October, and Peras, due Q2 2027. Macro is hostile: the Fed has an 88.5% hike chance on December 8–9, Bitcoin trades near $65,000 after $1.91 billion left the spot ETFs in seven sessions, and Fear & Greed sits at 12. ADA fell more than twice as hard as Bitcoin. The squeeze setup is in the numbers: ADA is down 16.6% in seven days and 67.9% in a year, market cap $5.5 billion. Daily RSI hit 25.7 on November 14 — deep oversold. Open interest unwound to $284 million, down 13% in 24 hours, and funding is -0.0139% per 8 hours, about -15.2% annualised: shorts pay longs to stay short. Futures volume jumped 79% to $726 million; $6.3 million was liquidated in 24 hours, 95% longs. Weak hands are gone; the short book sits on the year's low. Technically, ADA sits 30% below its 50-day and 27% below its 200-day average — a stretched rubber band. The $0.1426–$0.1442 zone is the line: today's low and the June 30 close. Hold it and the bounce has room; lose it and $0.13s is next. Trade: LONG ADA $0.1500–$0.1530, stop $0.1425, below today's low. TP1 $0.1650 (1.5R), TP2 $0.1750 (2.6R), TP3 $0.1870 (3.9R). 24–48 hour swing; daily RSI, 50/200-day averages, funding, open interest. Bull case: RSI 25.7 with deeply negative funding is the classic squeeze setup — shorts pay to hold at the year's low, and stabilisation above $0.1500 forces covering into thin liquidity. If the Copper vote passes today, "finished" flips from surrender to completion. Bear case: the founder declaring victory with the token 95% below its high reads as capitulation. The Ethiopia rollout never happened, the Fed is about to hike, and ADA has shown zero relative strength. A daily close under $0.1425 invalidates everything and opens a fresh leg down. A: ADA squeezes back above $0.1650 this week — "finished" marks the bottom. B: $0.1425 breaks and ADA grinds toward $0.13 — the roadmap is done and so is the bid. Which side are you on? $ADAUSDT #ByXIMPACT #IMPACTbyTrade Trade idea, not investment advice — levels are conditional and can fail.
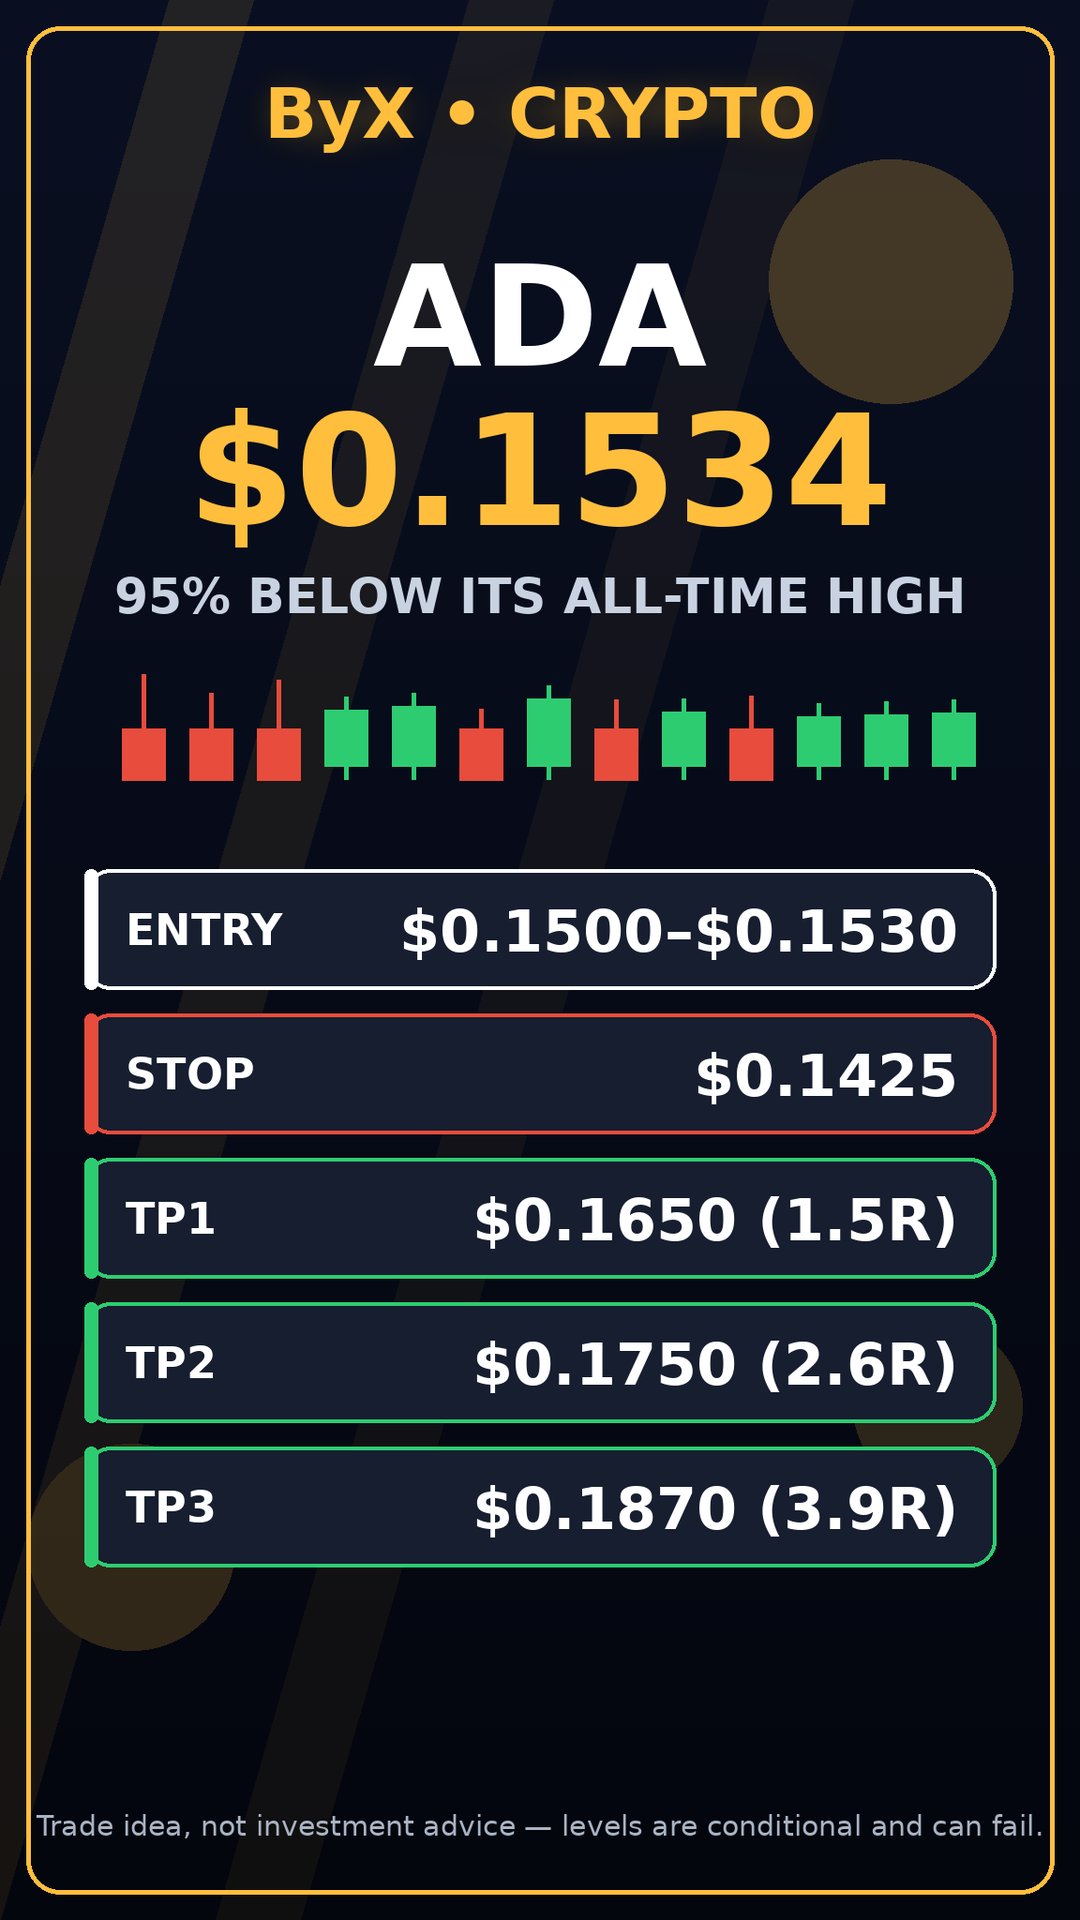
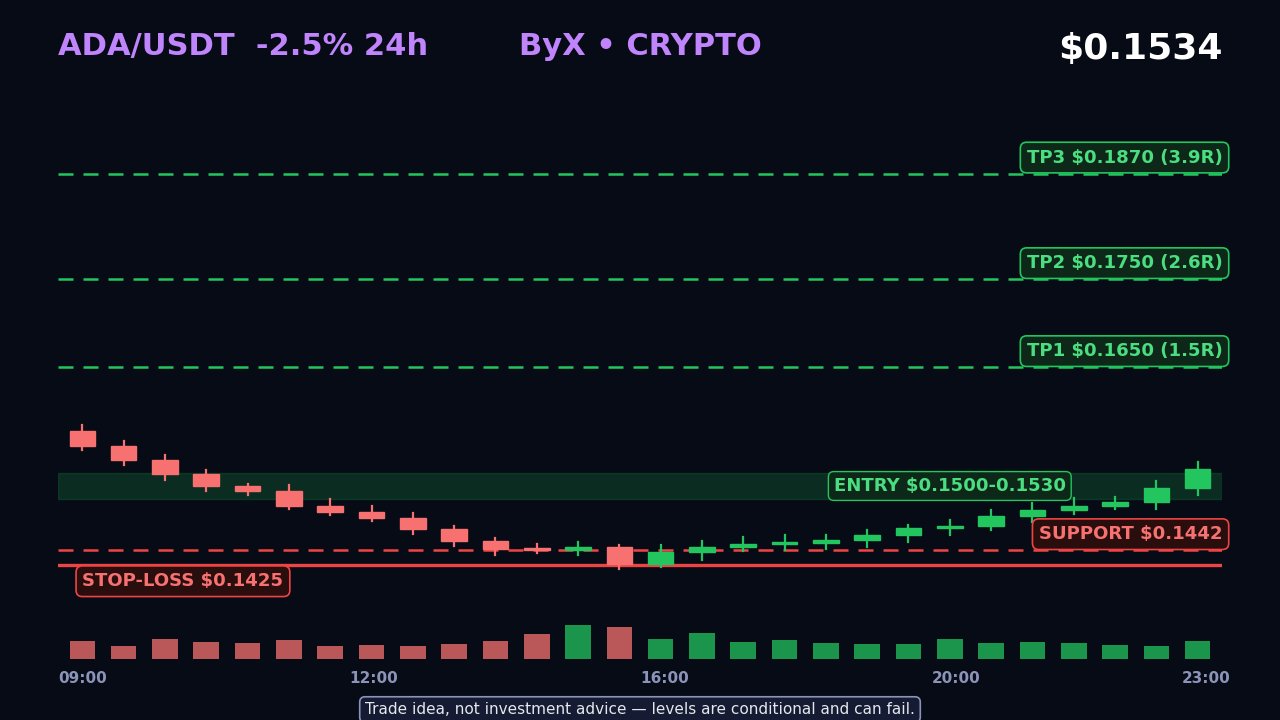

$GRAMUSDT just did something rare: every average agrees on the price. After sliding from 1.113 to 1.016 (about 8.7%), GRAM is sitting at 1.049 with the 7, 14 and 28-period MAs stacked at 1.051, 1.049 and 1.049. On the 1h chart, that's a market that has stopped disagreeing with itself. For most of this move, the 28 MA was a ceiling sloping down and every bounce died under it. Now it's flat, and price is sitting on it instead of below it. That's not a reversal. It's the end of the one-way pressure. What bothers me is the volume. The latest bar is 156K against a 5-bar average of 384K. The sell-off came on heavy volume. The recovery from 1.016 came on lighter, fading volume. Buyers stepped in, but they haven't paid for the move yet. The order book shows 91% bids, but I wouldn't lean on that. Bids can be pulled in seconds, and a lopsided book next to shrinking volume often means people are placing orders, not taking price. What I'm watching -Above 1.073: the 24h high and the first higher high since the drop. That's the real signal. - Below 1.016: the low gets swept and the recovery was just a pause. - 1.016–1.073: a range about 5.6% wide, and price is sitting in the middle of it. The part most people will skip Suppose GRAM breaks 1.073 and you chase it, with a stop under 1.016. Risk is about 5.3%. The first logical target, 1.113, is only about 3.7% away. That's roughly 0.7R, which is a bad trade even if you're right about direction. The better version is a reclaim of 1.073, a retest that holds, and a tighter invalidation. Without that, this isn't a setup yet. It's a compression, and a compression on fading volume resolves with a candle, not an opinion. I'm not calling it either way. I need a close above 1.073 with volume well above that 384K average, or a break under 1.016 that fails to bounce. #IMPACTbyTrade

Chainlink (LINK): Building the Infrastructure for the Next Generation of Global Finance 🌐 Chainlink is becoming much more than an oracle network. It is building essential infrastructure that could help connect traditional finance with the expanding blockchain economy. What Makes Chainlink Different? Blockchains cannot independently access real-world data or communicate seamlessly with other networks. Chainlink addresses this challenge through decentralized oracles, connecting smart contracts with external information, financial systems, and blockchain networks. Its ecosystem includes Data Feeds, Data Streams, and the Cross-Chain Interoperability Protocol (CCIP). Ecosystem Development Recent progress makes the bigger picture interesting. CCIP 2.0 introduced enhanced security, customizable compliance, and more flexible cross-chain transfers. Chainlink also introduced Fulcrum for institutional financing and collateral management. Additionally, its CCIP Vault Adapters enable DeFi vaults to accept deposits from more than 80 blockchains. Why Future Demand Matters As tokenized assets, stablecoins, and decentralized finance expand, reliable data and secure interoperability become increasingly important. LINK also has real ecosystem utility through service payments, node operator compensation, and network security. Risks Worth Watching Competition, regulatory uncertainty, technical vulnerabilities, and slower institutional adoption remain important challenges. Ecosystem growth does not automatically guarantee higher token value. My Final Perspective I believe Chainlink deserves attention because it is solving infrastructure problems rather than chasing temporary crypto trends. If blockchain adoption continues expanding, Chainlink could become an increasingly important part of that transformation. The real story is whether ecosystem usage and demand for LINK continue growing together. $LINKUSDT $BTCUSDT #IMPACTbyTrade