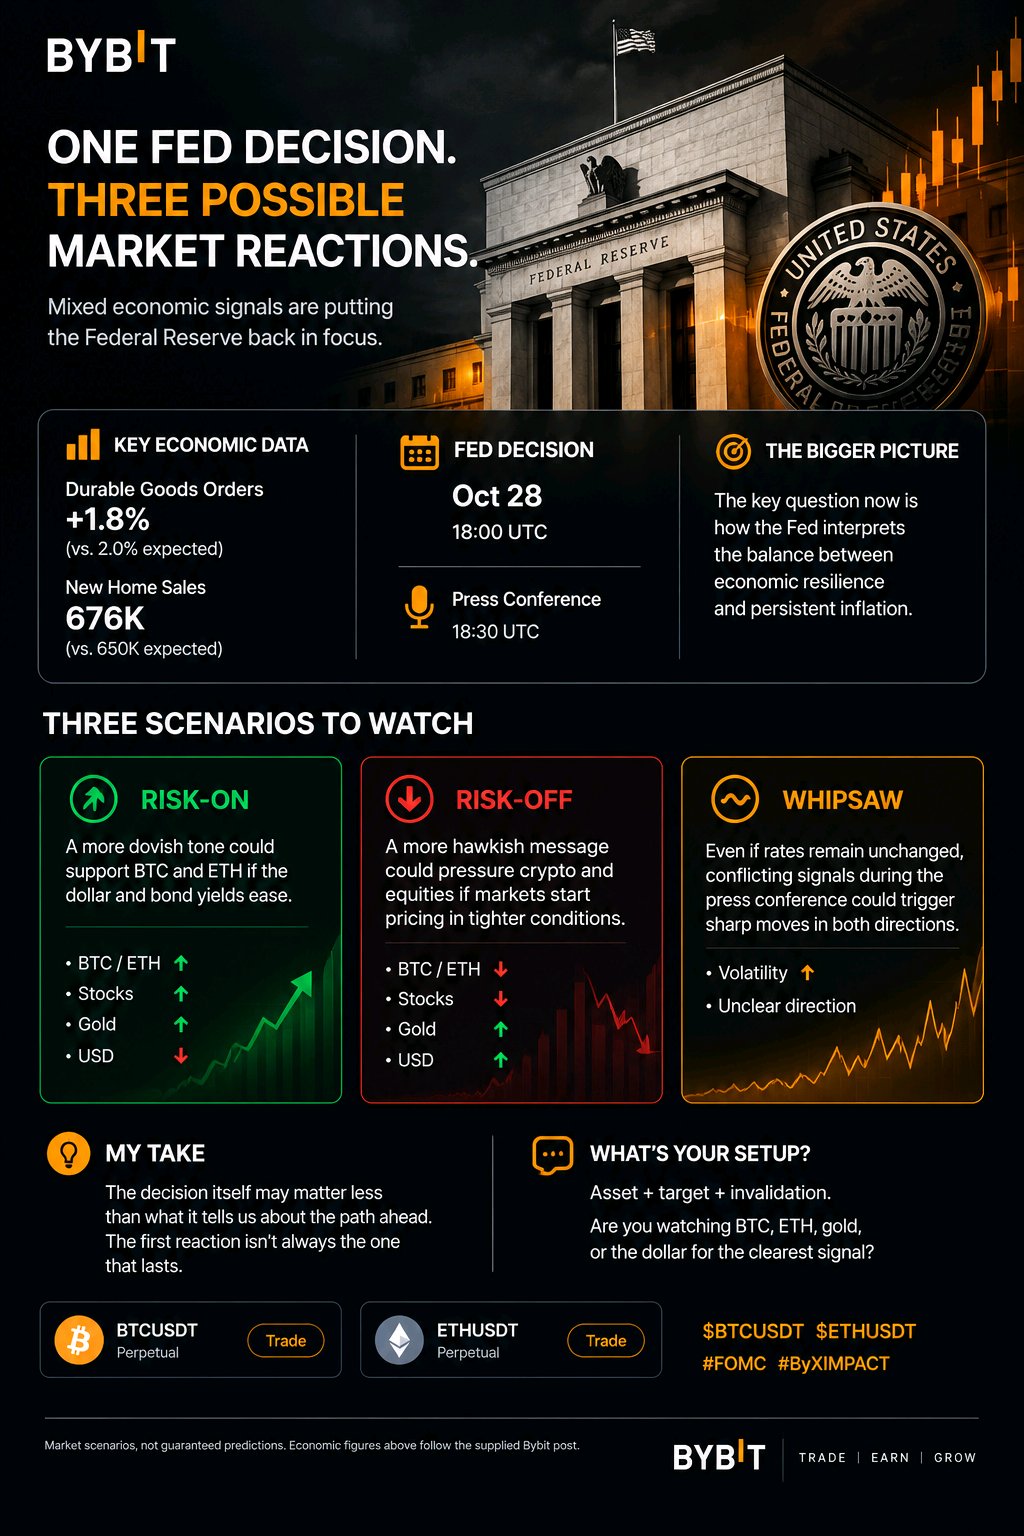
ONE FED DECISION. THREE POSSIBLE MARKET REACTIONS. Mixed economic signals are putting the Federal Reserve back in focus. Durable goods orders rose 1.8%, below the 2.0% expectation, while new home sales reached 676K against 650K expected. The bigger question now is how the Fed interprets the balance between economic resilience and persistent inflation. Here are three scenarios I'm watching: 🟢 Risk-on: A more dovish tone could support BTC and ETH if the dollar and bond yields ease. 🔴 Risk-off: A more hawkish message could pressure crypto and equities if markets start pricing in tighter financial conditions. 🟠 Whipsaw: Even if rates remain unchanged, conflicting signals during the press conference could trigger sharp moves in both directions. For me, the decision itself may matter less than what it tells us about the path ahead. The first reaction isn't always the one that lasts. What's your setup? Asset + target + invalidation. Are you watching BTC, ETH, gold, or the dollar for the clearest signal? $BTCUSDT $ETHUSDT Market scenarios, not guaranteed predictions. #ByXIMPACT #BybitIPOExpress #FOMCRateDecision #WSOT2026

DOT is trying to reclaim $1.00 after a sharp weekly decline of more than 13%. Buyers have stepped in near $0.98, but the bounce remains fragile until price clears the first major resistance. The immediate resistance sits at $1.02–$1.05. A decisive breakout could open the way toward $1.08 and $1.12. On the downside, losing $0.97 could expose $0.92 and potentially $0.90. The fundamental story is shifting toward real utility. Polkadot’s dotUSD stablecoin launched under DOT DAO governance, while the proposed JAM upgrade remains a longer-term catalyst. However, stronger adoption and sustained demand are still needed to reverse the broader downtrend. Bullish scenario: $1.02 reclaim → $1.05 → $1.08 Bearish scenario: $0.97 breakdown → $0.92 → $0.90 For now, $1.02 is the key test. A breakout with stronger volume could signal recovery, but losing $0.97 would put sellers back in control. Educational analysis only, not financial advice. $DOTUSDT #ByXIMPACT

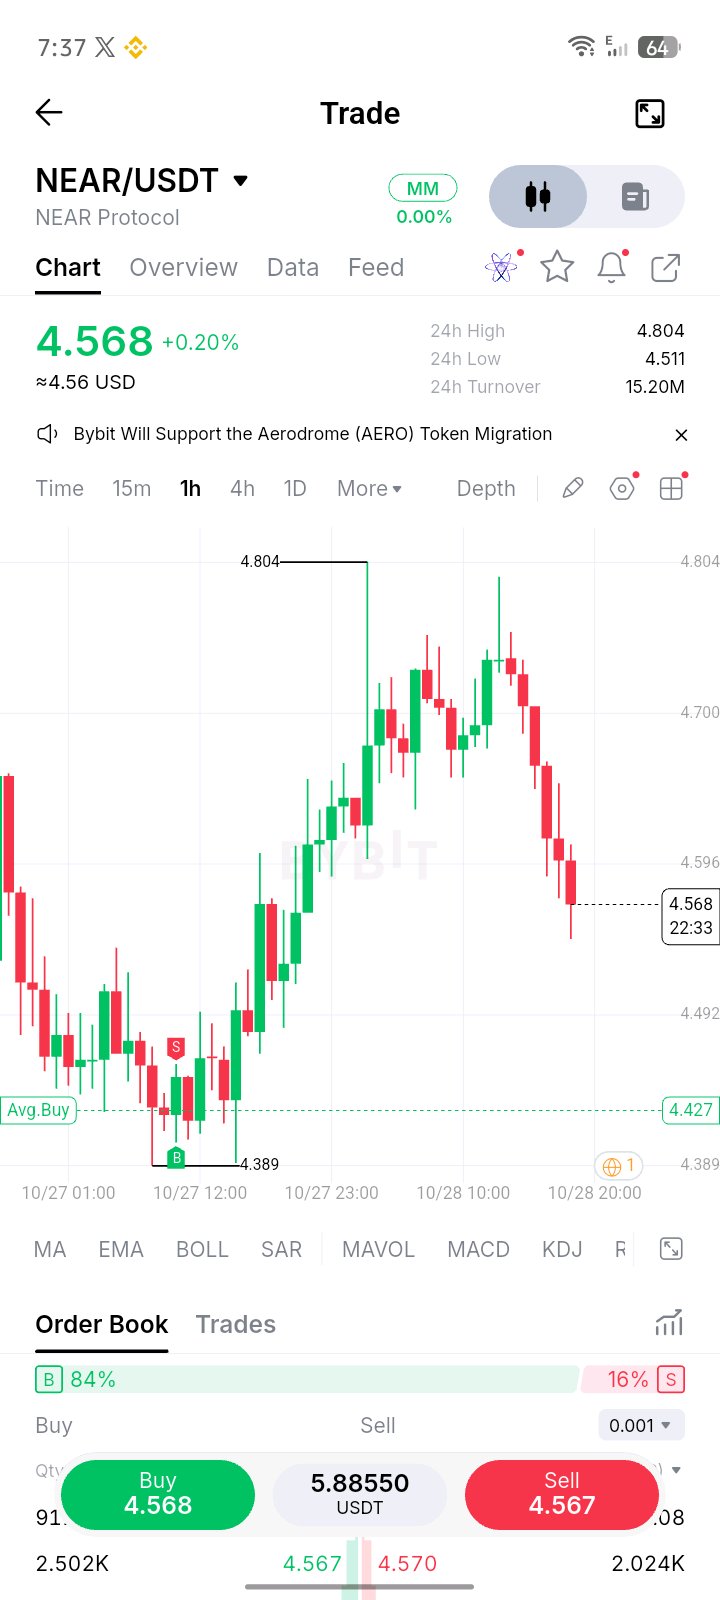
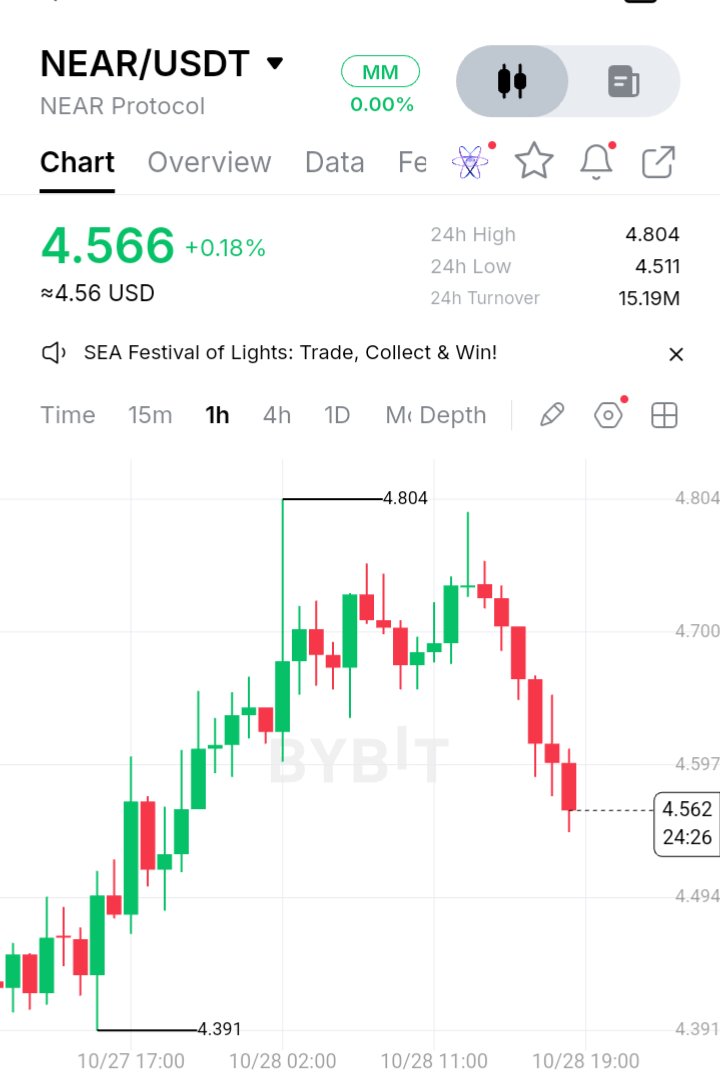
NEAR Protocol is facing an important test after its recent recovery. The price climbed from $4.389 to $4.804, but buyers couldn’t hold the highs, and NEAR has now slipped back to $4.568. The big question is whether this is simply a healthy pullback or the beginning of another move lower. Looking at the 1-hour chart, the recovery was strong, but the latest candles show sellers gaining momentum. The $4.70–$4.80 zone has become a key resistance area, while $4.51 is the first level buyers need to defend. Until NEAR can reclaim resistance, it’s too early to call this a confirmed bullish reversal. The derivatives market also deserves attention. One available dataset reported roughly $1.02 billion in NEAR futures open interest, with funding around +0.009% per eight hours and a long-heavy positioning bias. That suggests traders are leaning bullish, but crowded long positions can become a problem if the price keeps falling. Futures activity alone doesn’t tell us whether genuine spot demand is supporting the move. On the broader market side, an available snapshot placed NEAR’s market capitalization near $6.09 billion, with around $522 million in 24-hour trading volume. However, I couldn’t verify fresh whale accumulation or exchange netflows for this specific period, so there isn’t enough evidence to claim that large holders are buying or selling aggressively. Key levels to watch: * Current price: $4.568 * Immediate support: $4.511 * Next support: $4.427 * Major swing low: $4.389 * First resistance: $4.700 * Major resistance: $4.804 Bullish scenario: If NEAR holds above $4.51 and climbs back through $4.70, buyers could make another attempt at $4.804. A breakout backed by stronger spot volume would improve the chances of a move toward $4.90–$5.00. Bearish scenario: If $4.51 breaks and the price fails to recover it, attention shifts to $4.427 and $4.389. Weak spot demand, rising exchange inflows, or excessive leveraged long positions could add further pressure. For now, NEAR is caught between buyers trying to protect the recovery and sellers taking control near resistance. The next move will depend less on bullish sentiment and more on whether real buying demand returns. Holding support is important, but reclaiming $4.70 is what could start to change the picture. #ByXIMPACT $NEARUSDT $ORDERUSDT

$BTC: Bitcoin Is Becoming More Than an Asset to Hold What interests me most about Bitcoin right now is how its role in finance is changing. For years, BTC was primarily viewed as an asset to buy, hold, or sell. Now, it's increasingly being used as collateral to access liquidity without giving up long-term exposure. The bigger question is whether this shift can create a sustainable lending market or whether it still depends too heavily on favorable market conditions. We've already seen Bitcoin-backed credit move beyond individual borrowers. In 2024, Sygnum arranged a reported $50 million Bitcoin-backed syndicated loan to Ledn. That was an important step because it showed how BTC collateral could support financing between institutional players, not just retail investors looking to borrow against their holdings. The market has continued to develop. Ledn offers Bitcoin-backed loans, while Sygnum's institutional lending framework includes BTC as eligible collateral. These products give borrowers another option when they need cash but don't want to sell their Bitcoin. However, the terms vary between providers, and advertised borrowing limits shouldn't be confused with the amount of credit actually being used. What makes this development interesting is the trade-off. Borrowing against BTC allows investors to retain exposure to potential price appreciation, but the debt doesn't disappear when the market turns negative. Falling prices can trigger additional collateral requirements or liquidation, turning a liquidity solution into a serious financial risk. On-chain lending introduces another dimension. It can connect Bitcoin-backed collateral with stablecoin liquidity and make certain lending processes more transparent. But smart-contract vulnerabilities, collateral management, counterparty exposure and withdrawal restrictions remain important considerations. For me, the real story isn't simply that more companies are offering Bitcoin-backed loans. It's whether borrowers keep using these services, repay successfully, return for additional financing and generate consistent demand even when BTC prices become volatile. That's the difference between a growing product category and a mature credit market. Announcements can attract attention, but actual borrowing activity is what matters. The question I'm watching is simple: Can Bitcoin-backed lending maintain strong, repeatable demand during a prolonged BTC downturn, or does the business mainly thrive when collateral prices are rising? $BTCUSDT $PEPEUSDT #ByXIMPACT


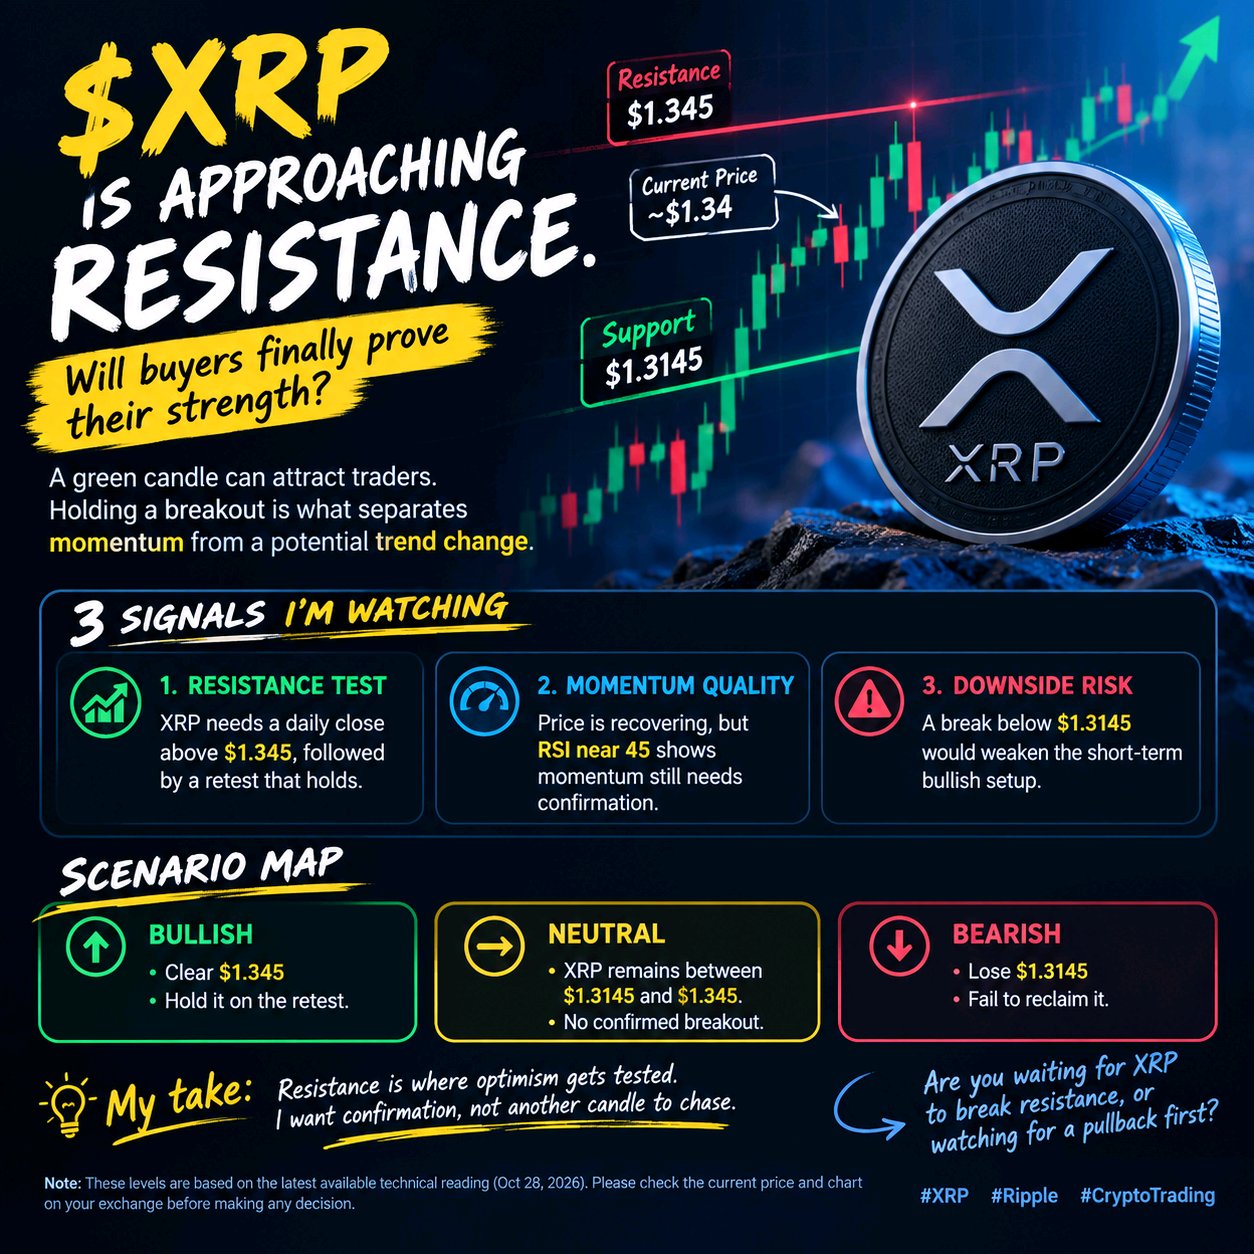
XRPis approaching resistance. Will buyers finally prove their strength? A green candle can attract traders. Holding a breakout is what separates momentum from a potential trend change. 📊 3 signals I'm watching: 🔹 Resistance test: XRP needs a daily close above $1.345, followed by a retest that holds. 🔹 Momentum quality: Price is recovering, but RSI near 45 shows momentum still needs confirmation. 🔹 Downside risk: A break below $1.3145 would weaken the short-term bullish setup. Scenario map: 🟢 Bullish: Clear $1.345 and hold it on the retest. 🟡 Neutral: XRP remains between $1.3145 and $1.345. No confirmed breakout. 🔴 Bearish: Lose $1.3145 and fail to reclaim it. My take: Resistance is where optimism gets tested. I want confirmation, not another candle to chase. Are you waiting for XRP to break resistance, or watching for a pullback first? #ByXIMPACT $XRPUSDT

$NEARUSDT BEARS STRIKE BACK! WILL BUYERS DEFEND SUPPORT? NEAR Protocol is trading around $4.566 as selling pressure intensifies on the 1H chart. After rallying from $4.391 to a high of $4.804, the price faced rejection and has now pulled back sharply. Bears are gaining short-term momentum, making the current support zone crucial for the next move. 📊 VIP Trading Levels - Support: $4.511–$4.494 - Major Support: $4.391 - Resistance: $4.597–$4.650 - Major Resistance: $4.700–$4.804 - Next Bullish Targets: $4.700, then $4.804 - Bearish Target: A confirmed breakdown below $4.494 could expose $4.391. 🎯 Trading Outlook: A strong bounce above $4.597 may signal recovery. However, losing support could extend the correction. Wait for candle confirmation and manage risk carefully. #WSOT2026 #SKHynixEarningsBeat #AnthropicS1Filing #IMPACTbyTrade #MyByXTake

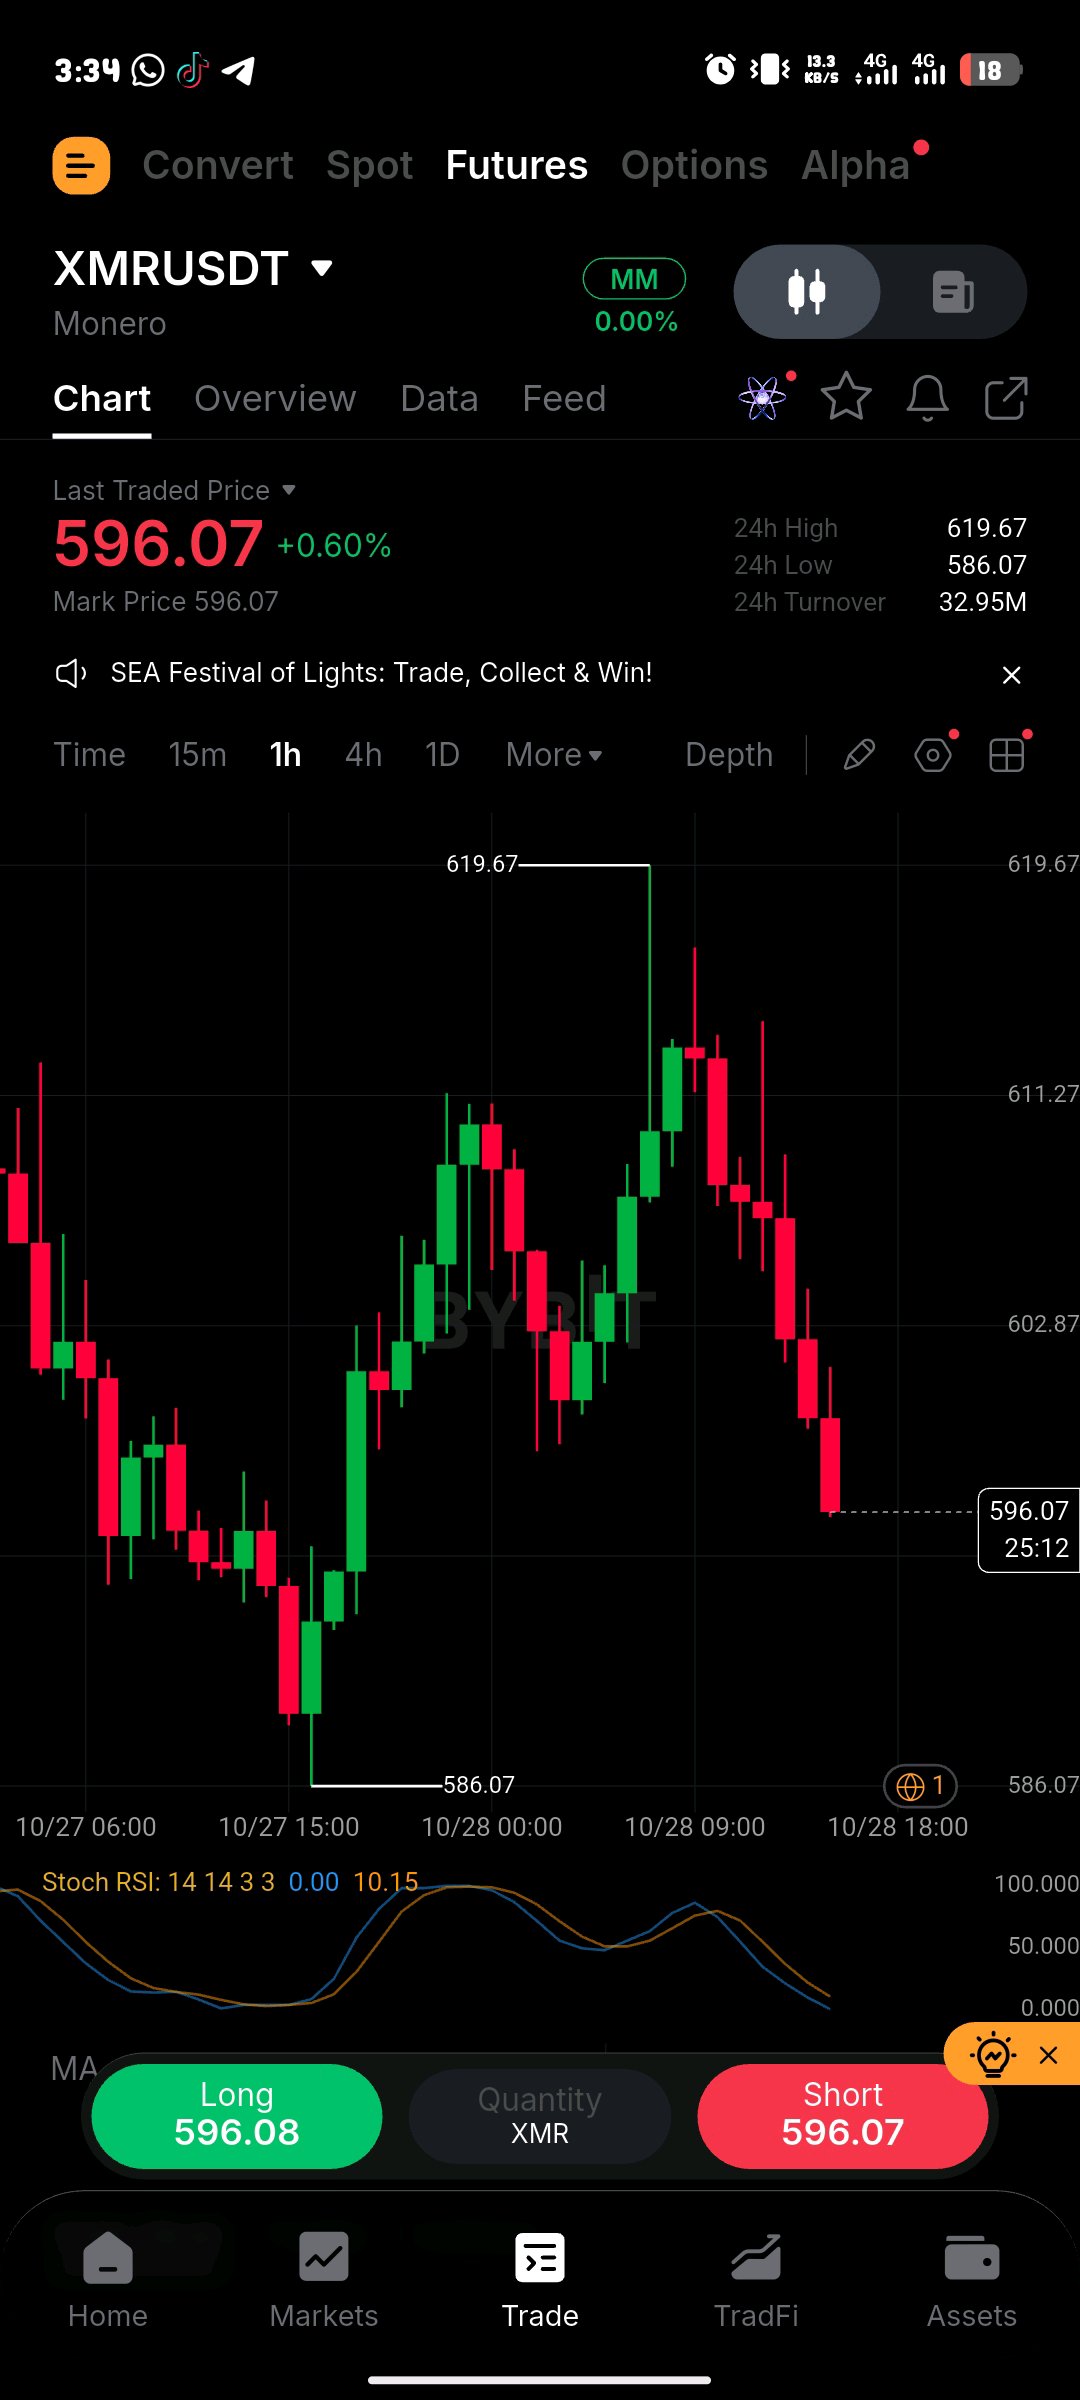
$XMR | Monero Faces a Critical Test
I’ve been watching $XMR, and what caught my attention is that Monero is struggling to follow Bitcoin’s recent strength. While the broader crypto market has shown signs of recovery, XMR has faced selling pressure around the $600 area. For me, the key question is whether buyers can defend support and bring momentum back. Fundamental Analysis Monero remains one of the leading privacy-focused cryptocurrencies. Its development community continues working on privacy improvements, including the proposed FCMP++ upgrade, which aims to strengthen transaction privacy. Recent network activity has also remained active, while the network’s hashrate has approached previous highs. However, mining-pool concentration remains a concern, and technical development alone does not guarantee higher prices. I want to see continued network activity alongside stronger demand for the token. Technical Analysis According to market data published on October 28, XMR was trading around $598–$606, with $590 emerging as an important short-term support level. The price has also faced resistance near $620. Key Levels I’m Watching - Resistance: $610–$620 - Breakout target: $635–$650 - Key support: $590 - Lower support: $575 - Major downside reference: $560 Bullish Scenario: If XMR holds above $590 and breaks through $620 with stronger volume, I’ll watch for a possible move toward $635–$650. Bearish Scenario: If sellers push XMR below $590 and the breakdown holds, the next area I’ll watch is around $575, followed by $560. My Market View I’m cautious on $XMR until buyers demonstrate stronger momentum. The project has a clear identity in the privacy sector, but the chart still needs confirmation. I’ll be watching the $590 support and $620 resistance zones to understand which side is gaining control. I don’t want to mistake a temporary bounce for a confirmed reversal. Price action, volume, and Bitcoin’s direction will all matter. What’s your view on $XMR? Can Monero reclaim $620 and move toward $650, or will sellers push it below $590? Share your thoughts in the comments. $PEPEUSDT $BCHUSDT #AnthropicS1Filing #IMPACTbyTrade

LATEST: ⚡ Stacks founder Muneeb Ali says quantum fears have already put a "ceiling on the growth of Bitcoin," as risk-averse institutions may delay big purchases until a credible upgrade path emerges. #MyByXTake

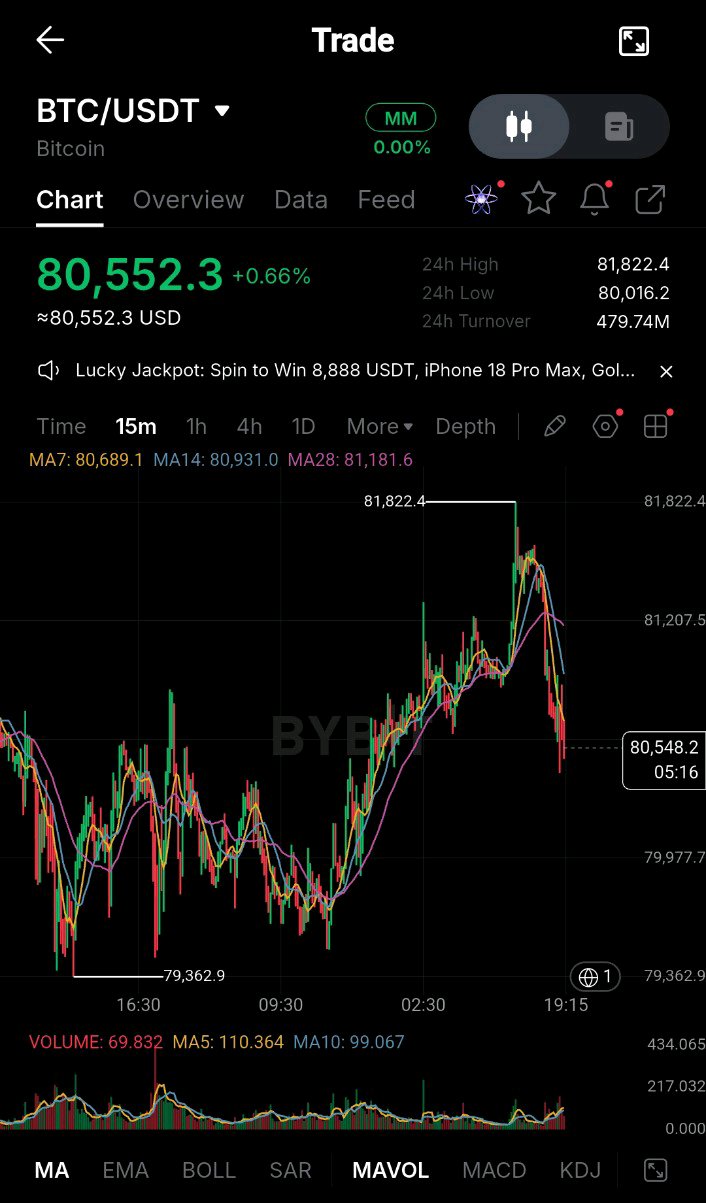
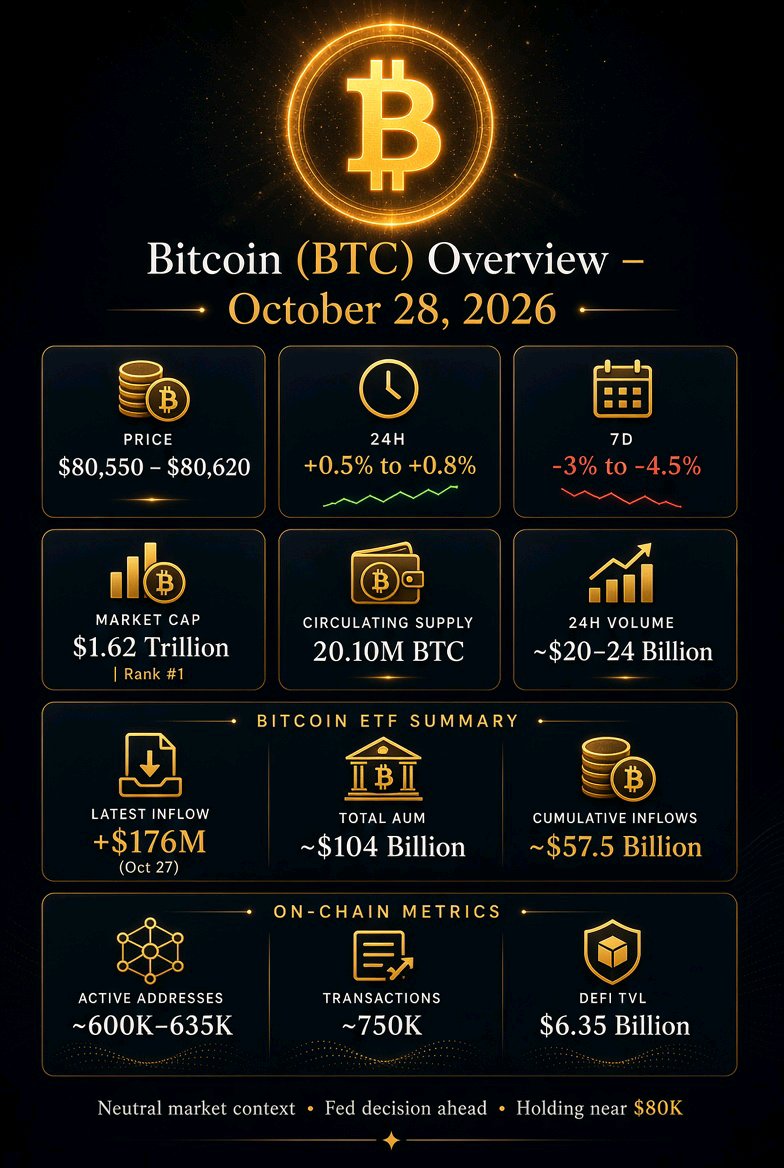
Bitcoin $BTCUSDT Overview – October 28, 2026** Bitcoin trades near $80,550–$80,620, up roughly 0.5–0.8% over 24 hours and down about 3–4.5% over the past 7 days. 24-hour trading volume stands near $20–24 billion. Market capitalization is approximately $1.62 trillion, ranking #1. Circulating supply is 20.10 million BTC out of a maximum 21 million. U.S. spot Bitcoin ETFs recorded a net inflow of $176 million on October 27 (led by BlackRock’s IBIT), following $110 million the prior day. Total net assets stand near $104 billion, with cumulative net inflows since launch around $57.5 billion. ETFs hold roughly 1.29 million BTC. On-chain metrics show roughly 600,000–635,000 daily active addresses and about 750,000 transactions in the latest 24-hour period. DeFi total value locked on Bitcoin is approximately $6.35 billion. Stablecoin activity on the network remains limited relative to other chains. Recent developments include consecutive days of positive ETF flows after earlier outflows, price recovery above $80,000 following a brief dip, and market focus on the Federal Reserve’s policy decision. Broader context involves elevated oil prices, AI-related equity volatility, and cautious risk sentiment ahead of the Fed meeting and U.S. midterms. Bitcoin remains approximately 36% below its all-time high of about $126,000 set in October 2025. #ByXIMPACT

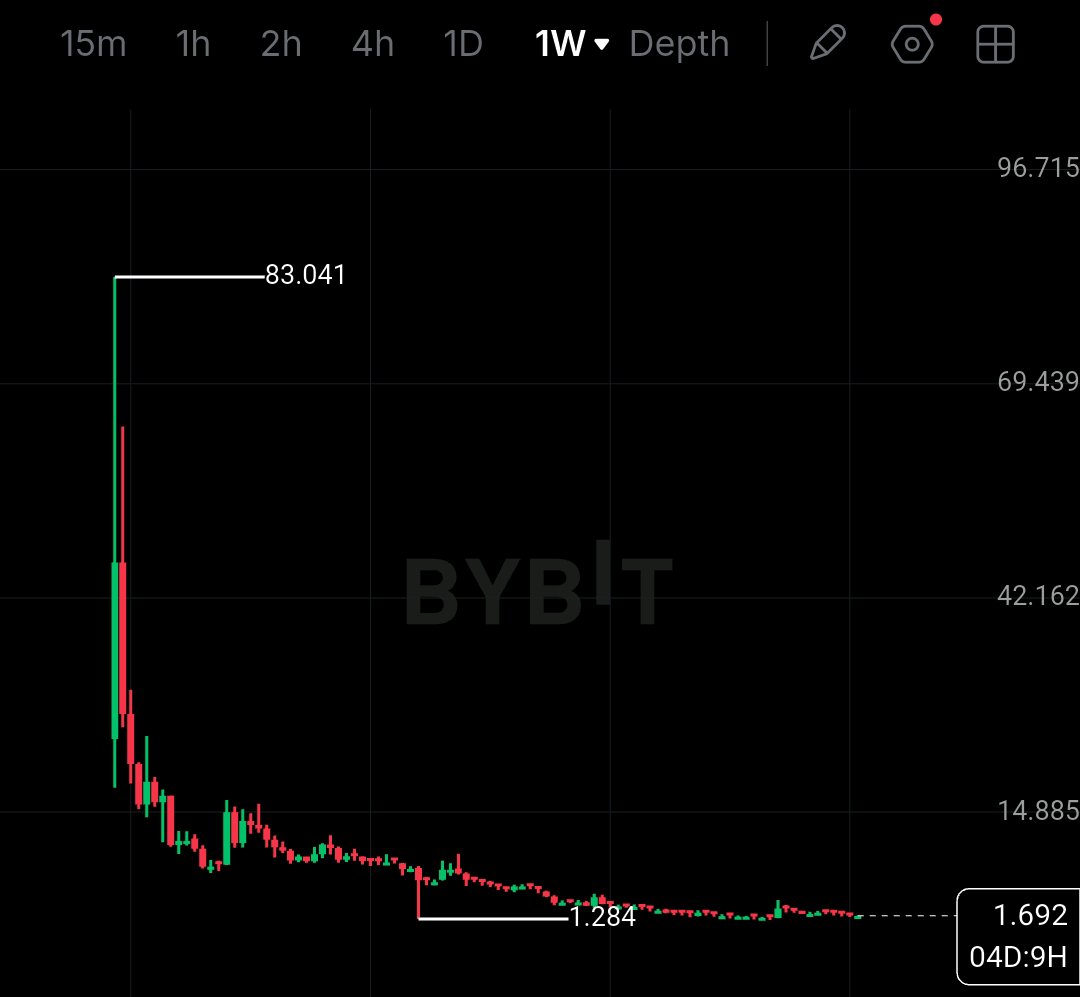
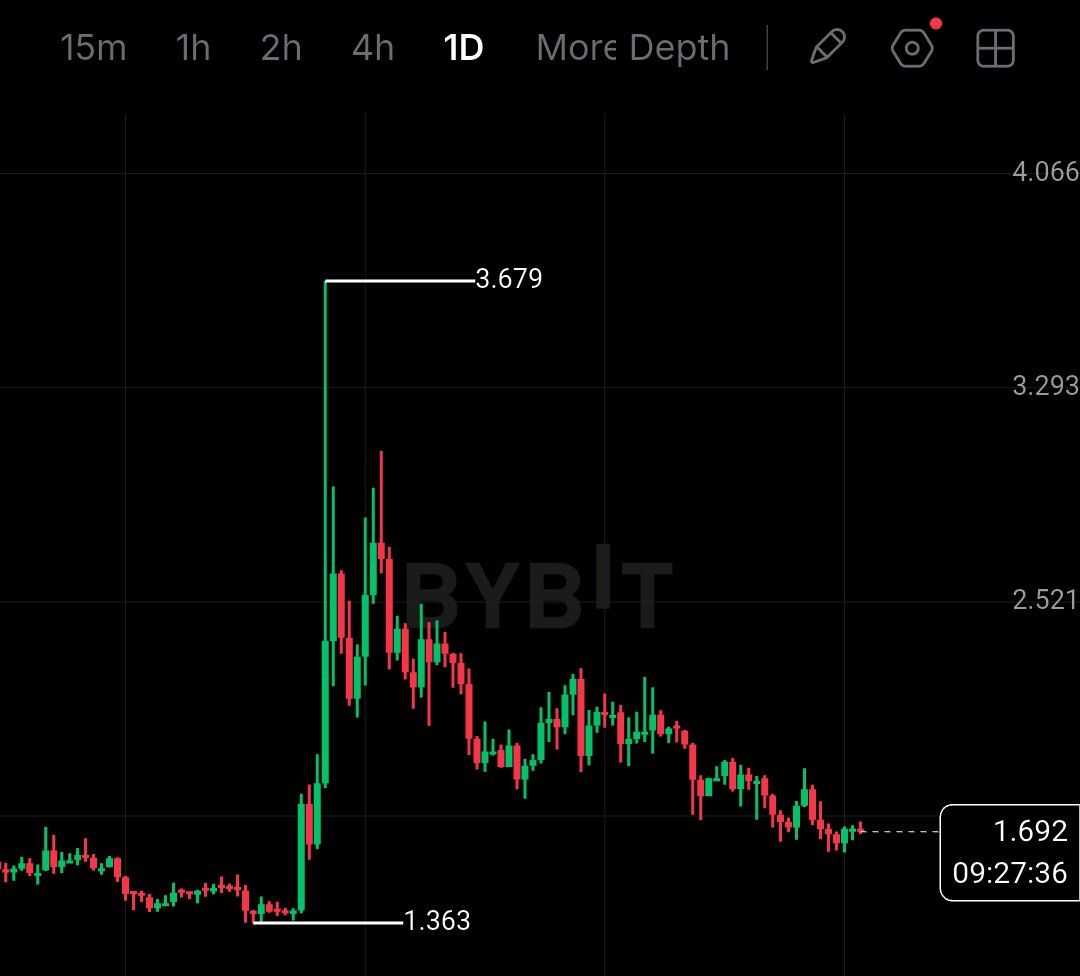
TRUMPUSDT has settled at $1.69
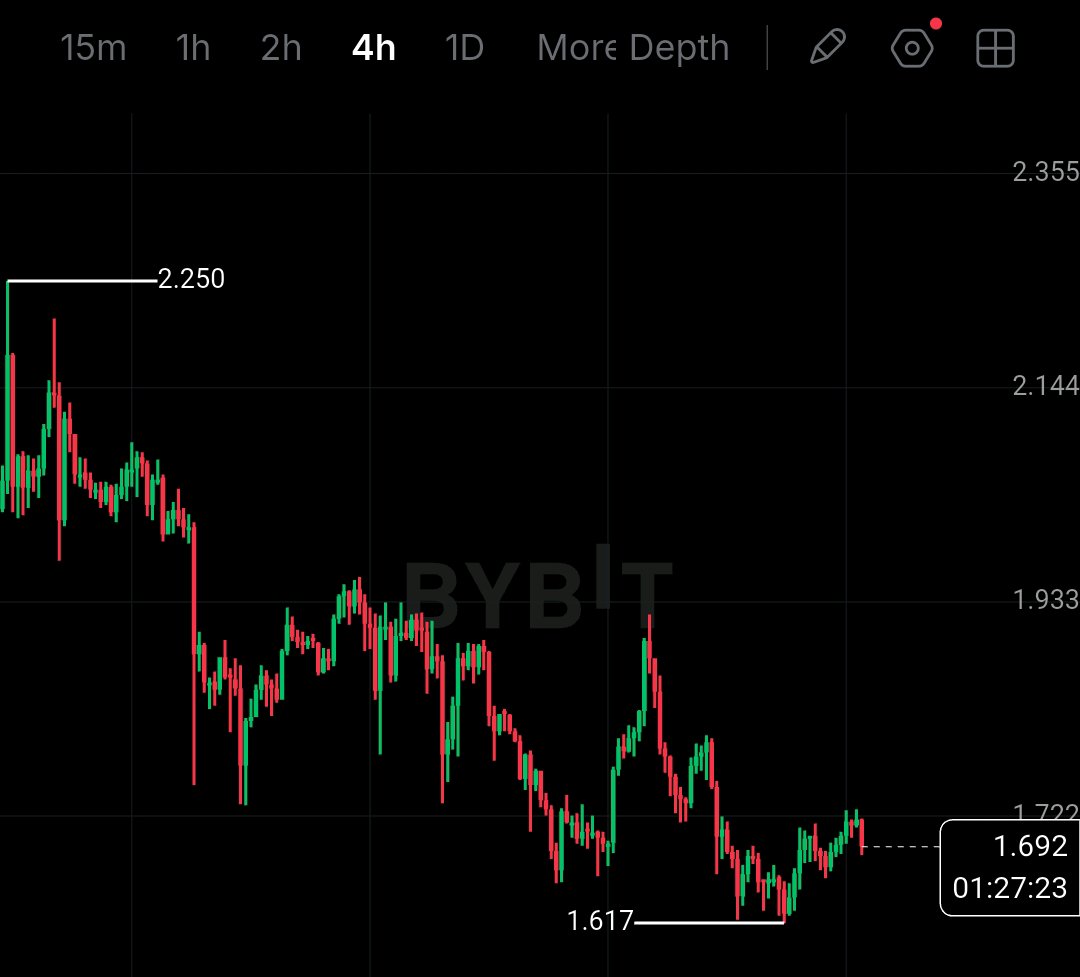
$TRUMPUSDT at $1.69 (+0.41%) 98% lower than $83 ATH, Double Bottom at $1.61 TRUMPUSDT has settled at $1.69 following a sharp washout. Last: $1.693 +0.41% / Mark: $1.693 24H High: $1.729 / Low: $1.680 Volume: $9.18M 1W chart has seen a 98% move down to $83.041 top on Feb 2025 dumped straight to $1.284 on March 2026. It has been consolidating at the bottom at $1.691 for 7 months. 1D chart has had a high of $3.679 on Aug, bottom $1.363 and now sits at $1.692 lower highs pattern but holding above $1.363. 4H chart has seen a high at $1.958 on Oct 14, low $1.617 on Oct 27. The double bottom has formed at $1.617 confirmed. Now $1.692 which is 4% above the low. 1H chart has the same low at $1.921 high on Oct 23 to $1.617 however we are trying to break out at $1.729. Support at $83 ATH, Double Bottom at $0__1.617 (Double Bottom) and at $83 ATH, Double Bottom at $1$83 ATH, Double Bottom at $2__ (Bottom). Resistance at $83 ATH, Double Bottom at $3__1.921 and $83 ATH, Double Bottom at $4__3.679. Breakout at $1.729. Trade Setup: LONG if it goes above $83 ATH, Double Bottom at $5__1.921 then back down to $83 ATH, Double Bottom at $6__1.617. SHORT if it goes below $83 ATH, Double Bottom at $7__1.363. Stop Loss at $1.729. Overall bias is SHORT-TERM LONG as it’s a low leverage, high volatility Meme Coin with $83 ATH, Double Bottom at $8__9.18M. Is it at $83 ATH, Double Bottom at $9__1.284? Tap $TRUMPUSDC to trade this bottom range. #IMPACTbyTrade #ByXIMPACT @BybitX @Bybit Learn @612 Ceros @SignalX @Demon - Trader @GhostWriter @VietnexusCrypto @James @PRADO @IBLOLO
Before Alphabet reports, here's the debate I'd put to the market: A) Search monetization is still the key valuation anchor. B) Google Cloud is becoming the most important incremental growth engine. C) Gemini and TPUs will decide long-term margins. D) Capital expenditure and free cash flow matter more than all three. I lean toward judging these together rather than choosing one heroic narrative. A company can be winning the AI race while disappointing shareholders if it spends faster than it monetizes. Which line item would change your view most? #EarningsWatch

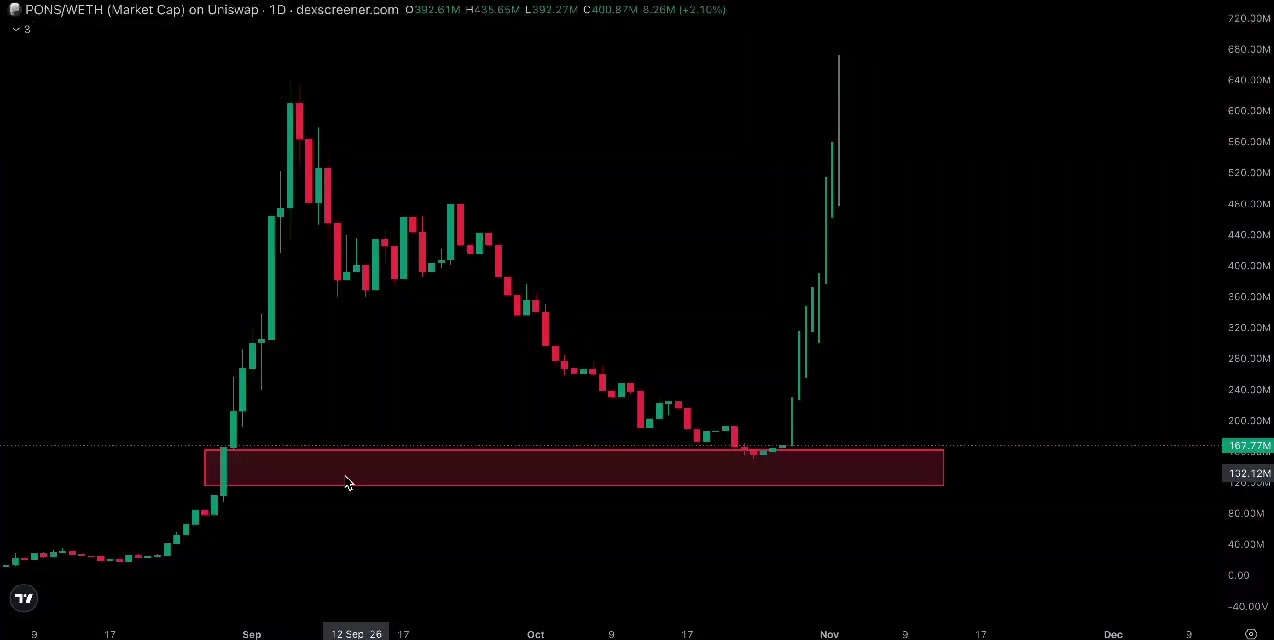
$PONSUSDT looking like it just got released from prison if this support holds, the next few weeks could get interesting If not expect it go down till ZERO #ByXIMPACT

Bitcoin Spot ETFs See $176M Total Net Inflows on October 27 According to SoSoValue data, US Bitcoin spot ETFs recorded a total net inflow of $176 million on October 27 Eastern Time, with BlackRock's IBIT leading at $151 million in net inflows. Ethereum spot ETFs saw a total net outflow of $60.22 million, with BlackRock's ETHA being the sole fund recording net outflows #MyByXTake

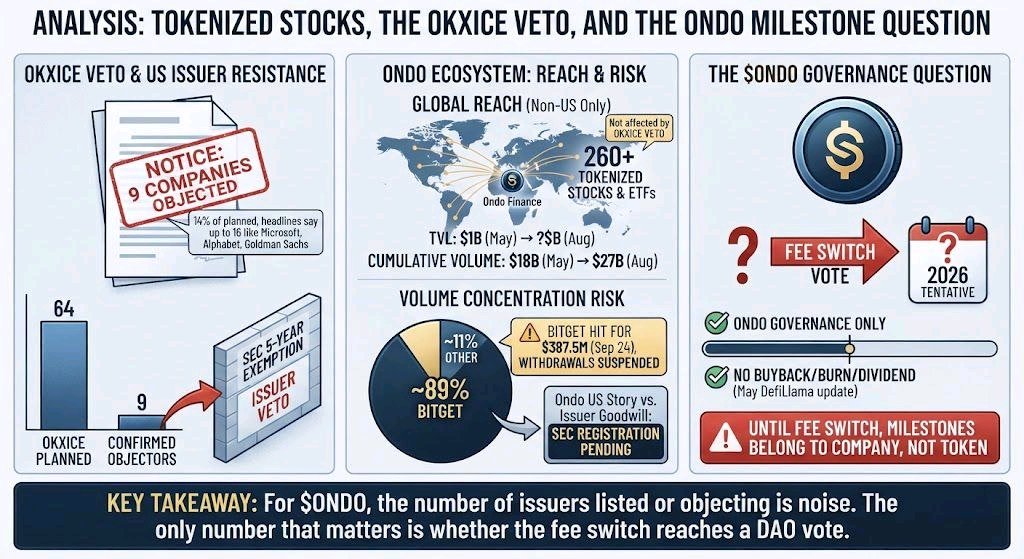
Nine US-listed companies objected to having their stock tokenized on OKXICE in its October 15 notice, about 14% of the stocks it first planned to offer. The venue isn’t live yet. Headlines since then put the count as high as 16, with Microsoft, Alphabet and Goldman Sachs named. I could only confirm the nine in the notice itself. The veto comes from the SEC’s September 17 exemption: five years, 30 days’ notice to issuers, and each company can object. That makes it a veto over one regulated US venue, not over tokenized stocks as a category. Here is where $ONDO comes in. Ondo’s 260+ tokenized stocks and ETFs are sold to non-US persons only, so I don’t think this veto reaches them. That is my read, not a confirmed fact. What it may test is Ondo’s US story: Ondo Global Markets has confidentially filed a registration statement with the SEC, and issuer goodwill is the next thing that filing runs into. The activity is real. Ondo said the stocks platform passed $1B in TVL with $18B in cumulative volume in May, and by August it cited $27B, roughly 26x TVL. But one spring report put about 89% of Ondo-related trading volume on Bitget. I couldn’t find a current split. Bitget was hit for about $387.5M on September 24 and suspended withdrawals. If the share is still anywhere near that, a lot of Ondo’s volume sits on one venue that just went through a freeze. And the token? ONDO is governance-only, with no buyback, burn or dividend active as of DefiLlama’s May update, and no executed DAO proposal since 2024. A fee switch vote is planned for 2026, and I couldn’t find a date for it. So the number worth tracking for $ONDO isn’t how many issuers object or how many tokens Ondo lists. It’s whether the fee switch ever reaches a vote. Until then, every milestone belongs to the company, not the token. #ByXIMPACT #IMPACTbyTrade $ONDOUSDT

$SEIUSDT is trading near $0.054 after recovering from its recent decline. The important question is whether buyers can reclaim $0.056 or whether this bounce becomes another lower high. SEI has spent much of the recent period struggling to turn its high-performance blockchain narrative into sustained price strength. The current market capitalization is around $360M, with roughly $33M in 24-hour trading volume. That is enough activity to make the next breakout meaningful, but price still needs to establish a stronger structure rather than rely on a short-lived bounce. The institutional story has advanced, too. REX Shares and Osprey Funds updated their proposed staked SEI ETF filing in September, targeting an October 23 effective date. That deadline has now passed, so traders should verify the product's actual status rather than continue treating the filing itself as a fresh catalyst. Even if institutional access expands, it does not guarantee immediate buying pressure in SEI. Key figures - $0.054 — approximate current price - $0.056 — near-term recovery test - $0.052 — first support area to monitor - $0.050 — downside structure to watch - $360M — approximate market capitalization - Nov. 13 — next scheduled supply release on one tracking source, around 22.08M SEI Bullish confirmation: a sustained move above $0.056, followed by a successful retest, would improve the recovery structure and bring $0.059–$0.061 into focus. Bearish confirmation: rejection around $0.056 followed by a loss of $0.052 would suggest buyers still lack control, putting $0.050 and potentially lower levels back in play. The supply picture also deserves attention. SEI has a long vesting schedule, and scheduled releases can create additional selling pressure if demand is weak. The upcoming release is not automatically bearish, but its effect depends on whether market demand absorbs the new tokens. For me, the real trade is whether SEI can convert its institutional-access narrative and technical recovery into sustained demand. Until price reclaims resistance and holds it, a bounce is not yet a confirmed trend reversal. #ByXIMPACT

JUST IN: BlackRock ETF clients buy $110.34 million worth of Bitcoin. #ByXIMPACT #Bybit8thAnniversary #FOMCRateDecision #MidtermsMarketWatch #IMPACTbyTrade $BTCUSDT $DOGEUSDT



$GRAMUSDT GRAM data now…Here's the full breakdown for **GRAM**: $GRAMUSDT💰 Price Snapshot | Field | Value | $GRAMUSDT| **Price** | $1.2230 | | **24h Change** | +1.07% 📈 | # 🐋 Capital Flow & Sentiment | Metric | Value | | **Whale Long Value** | $9.55M | | **Whale Short Value** | $9.60M | | **Long/Short Ratio** | 1.0:1 ⚠️ | | **Fund Side** | **Bullish** | | **Top Trader Position Rate** | 1.03x | | **Funding Rate (Latest)** | +0.005% | | **Funding Rate (Avg)** | +0.00095% | | **Open Interest (Now)** | $21.7M | | **Open Interest (30d ago)** | $25.4M ↓ | > ⚠️ Whales are perfectly balanced — longs vs shorts nearly equal ($9.55M vs $9.60M). No clear directional conviction. OI declining -14.8% in 30 days — weakest among all coins analyzed today. --- # 📊 Key Price Levels # Support Zones | Timeframe | S1 | S2 | S3 | |---|---|---|---| | **5m** | $1.2228 | $1.2195 | $1.2125 | | **4H** | $1.1985 | $1.1746 | $1.1234 | | **1D** | $1.2812 | $1.2174 | $1.0806 |# Resistance Zones | Timeframe | R1 | R2 | R3 | |---|---|---|---| | **5m** | $1.2392 | $1.2425 | $1.2495 | | **4H** | $1.3165 | $1.3404 | $1.3916 | | **1D** | $1.5968 | $1.6606 | $1.7974 | --- # 🎯 Quick Take - **Price moving slightly** +1.07% — mild positive momentum - **Immediate resistance**: $1.2392–$1.2495 (5m) — break above opens **$1.3165–$1.3916** (4H) - **Major upside target**: **$1.5968–$1.7974** (1D Fibonacci) — big potential but needs catalyst - **Key support floor**: $1.1985 (4H) — break below risks $1.1234 - Perfectly balanced whale positions = **no clear edge** — wait for a directional breakout ⚠️ --- # 🏆 Complete Watchlist — Final Master Table | Metric | XRP | ONDO | MNT | HBAR | DOGE | GRAM | |---|---|---|---|---|---|---| | Price | $1.3142 | $0.4204 | $0.5301 | $0.07565 | $0.07919 | $1.2230 | | 24h Change | -0.24% | **+4.19%** 🏆 | +3.05% | +0.04% | +1.84% | +1.07% | | L/S Ratio | 1.5:1 | 2.2:1 | **2.9:1** 🏆 | 1.6:1 | 1.7:1 | 1.0:1 ⚠️ | | Whale Long| **$96.4M** 🏆 | $18.2M | $19.3M | $12.0M | $36.5M | $9.6M | | OI Size | $234.7M | $120.9M | $66.2M | $405.6M | **$1.39B** 🏆 | $21.7M | | OI Trend | ↑↑ | ↓ | ↓ | ↑ | ↓ | ↓↓ | | 24h Volume | **$1.66B** 🏆 | $422M | $28M | $78M | $513M | $24.8M | | Funding | High 🔴 | Low | Low | Negative ⚡ | High 🔴 | Low | # 🎯 Updated Final Ranking | Rank | Coin | Key Strength | |---|---|---| | 🥇 | **XRP** | Biggest liquidity + whale money + rising OI | | 🥈 | **ONDO** | Best price momentum + buy pressure | | 🥉 | **MNT** | Strongest smart money conviction | | 4️⃣ | **DOGE** | Huge OI + volume, explosive on news | | 5️⃣ | **HBAR** | Squeeze setup, negative funding advantage | | 6️⃣ | **GRAM** | Balanced whales + declining OI — wait for breakout signal | > ⚠️ GRAM shows the weakest institutional conviction today. Best approach: watch for a clean break above **$1.2495** before entering. Want news, volatility, or social sentiment for GRAM — or ready to trade any of these? #WSOT2026 #ByXIMPACT #IMPACTbyTrade

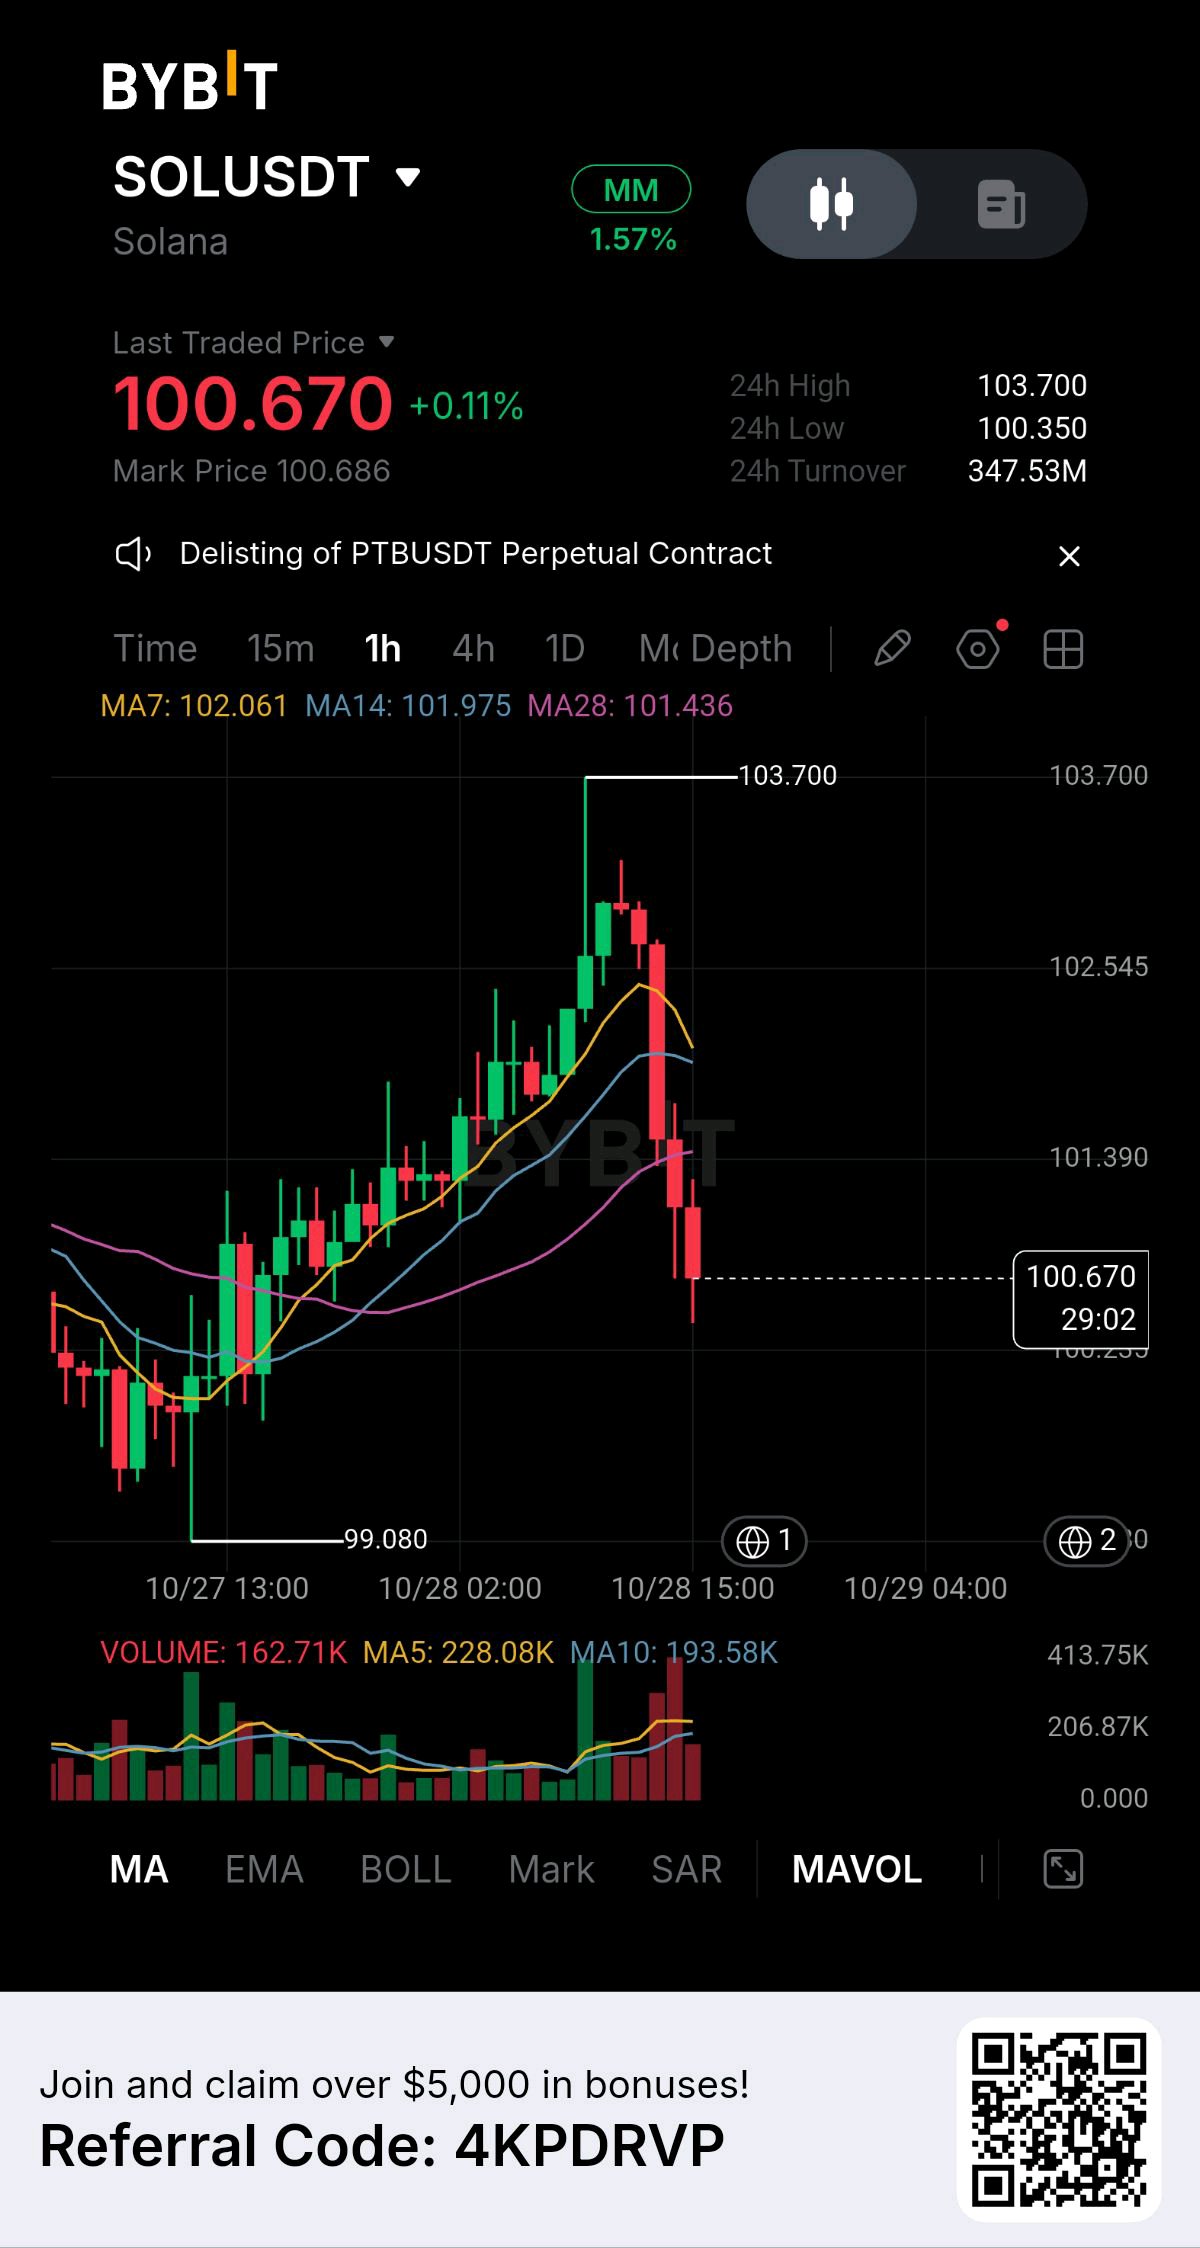
I’m watching $SOLUSDT closely after its strong recovery toward $103.700 was rejected by sellers. Price is now trading around $100.670, and the latest bearish candles show that selling pressure has increased significantly. What looked like a bullish continuation setup has turned into a critical support test, and I want to see how price reacts before deciding on the next potential direction. 1. MARKET STRUCTURE: SELLERS ARE TAKING CONTROL SOL previously recovered from the $99.080 low and climbed toward the $103.700 high, forming a short-term upward move. However, buyers failed to maintain control near the top, and the market has now produced a sharp pullback. The rejection near $103.700 is important because it shows that sellers were willing to defend higher prices. The latest decline has pushed SOL below all three moving averages, weakening the previous bullish structure. My focus now is whether this decline develops into a deeper correction or whether buyers can step in and create a strong recovery. 2. MOVING AVERAGES: BEARISH PRESSURE INCREASES The current moving average levels are: MA7: $102.061 MA14: $101.975 MA28: $101.436 SOL is trading below all three moving averages. The short-term averages are positioned above the current price, creating potential resistance during any recovery. For buyers to regain momentum, I want to see price reclaim the $101.436 area first, followed by a stronger move above $101.975–$102.061. Until that happens, I’m treating any bounce with caution rather than assuming the bullish trend has resumed. 3. KEY SUPPORT ZONE: $100.350–$100.000 The immediate area I’m watching is around the recent 24-hour low of $100.350 and the psychological $100.000 level. If buyers defend this zone and produce a strong bullish candle with increasing volume, SOL could attempt a relief bounce toward $101.436 and then $101.975–$102.061. However, if price breaks below $100.350 and fails to recover quickly, selling pressure could extend toward the previous swing-low area around $99.080. This is a level I would monitor for the next reaction, not a guaranteed downside target. 4. RESISTANCE LEVELS TO WATCH The first important resistance is $101.436, followed by the $101.975–$102.061 moving average zone. A stronger recovery could bring $102.545 into focus, while $103.700 remains the major recent high. I want to see SOL reclaim these levels with convincing candles and stronger buying volume before considering a meaningful bullish continuation. 5. VOLUME CONFIRMATION AND MY NEXT MOVE The recent sell-off has been accompanied by increased trading activity, suggesting that the rejection is more than just a small price fluctuation. Still, I want to observe the next candles to determine whether sellers remain in control or buyers begin absorbing the selling pressure. My plan is simple: I will not chase a falling price, and I will not call a reversal without confirmation. BULLISH SCENARIO: SOL holds the $100.350–$100.000 support area, forms a higher low, and reclaims $101.436 with stronger buying volume. BEARISH SCENARIO: SOL loses $100.350, struggles to recover above $100.000, and continues printing bearish candles. In that case, the $99.080 swing low becomes an important area to monitor. MY FINAL THOUGHTS SOL is at a critical decision point. The previous rally toward $103.700 has lost momentum, and price is now trading below all three moving averages. For now, sellers have the short-term advantage, but the $100 area could determine whether this becomes a deeper correction or the beginning of another recovery. I’m watching support, candle structure, and volume together. The next confirmed move matters more than guessing the direction too early. This is my technical market analysis, not a guaranteed prediction. I will wait for confirmation and manage risk carefully rather than enter a trade based on emotion. #ByXIMPACT

LTC is trying to grind higher near $57.50, but I’m watching one level closely: can buyers reclaim $58.40–$58.80, or will this bounce run into another wall of sellers? The recovery is real, but Litecoin still needs stronger confirmation before I’d call it a trend reversal. Litecoin is trading around $57.50, up roughly 2% over 24 hours. Recent daily trading has stayed near the $55.70–$57.80 area, with market capitalization around $4.4B and 24-hour volume near $180M–$190M. However, LTC remains roughly 86% below its May 2021 all-time high near $410. That bigger-picture drawdown matters: a modest bounce can improve sentiment without automatically restoring a bullish trend. On the short-term chart, buyers have defended the $55.70–$56.30 region and pushed price back toward $57.50. The next challenge sits around $58.40–$58.80, with $60 becoming the next psychological level if resistance breaks. On the downside, losing $56.30 would weaken the recovery, while a decisive break below $55.70 could expose the $54.50 area. One detail worth watching is Litecoin’s supply schedule. LTC has a maximum supply of 84 million coins, and roughly 77.8 million are already circulating. Its latest halving in August 2023 reduced mining rewards to 6.25 LTC per block. Lower new issuance can support a scarcity narrative over time, but it does not guarantee price appreciation; demand, liquidity and broader market direction still matter most in the near term. Key figures: - Price: ~$57.50 - 24H change: approximately +2% - Recent daily range: ~$55.70–$57.80 - Market cap: ~$4.4B - 24H volume: ~$180M–$190M - Circulating supply: ~77.8M LTC - Maximum supply: 84M LTC - Distance from ATH: approximately −86% Bullish confirmation: LTC holds above $56.30 and breaks through $58.80 with sustained buying volume. A successful reclaim could open a move toward $60 and $62. Bearish confirmation: Price rejects the $58.40–$58.80 zone and falls below $56.30. Losing $55.70 would make a deeper pullback toward $54.50 more plausible. For now, I’m treating this as a recovery attempt not a confirmed breakout. The key signal is whether buyers can turn resistance into support instead of allowing another rejection. Will LTC reclaim $60 next, or do sellers have one more move lower? $LTCUSDT #ByXIMPACT
🎁$50 USDT GIVEAWAY🎁 👉Just follow me and comment "ME" I will pick the winners after 5 hours! $BTCUSDC $SOLUSDC
The Fed meeting may be over, but the research doesn't stop at the closing bell. Did the market reaction teach you something about rate expectations, cross-asset correlations, liquidity or your own trade process? Try to explain one lesson with a concrete observation. A strong community grows when people share not just their predictions, but how they update them after new evidence arrives. What's your takeaway? #FOMCRateDecision
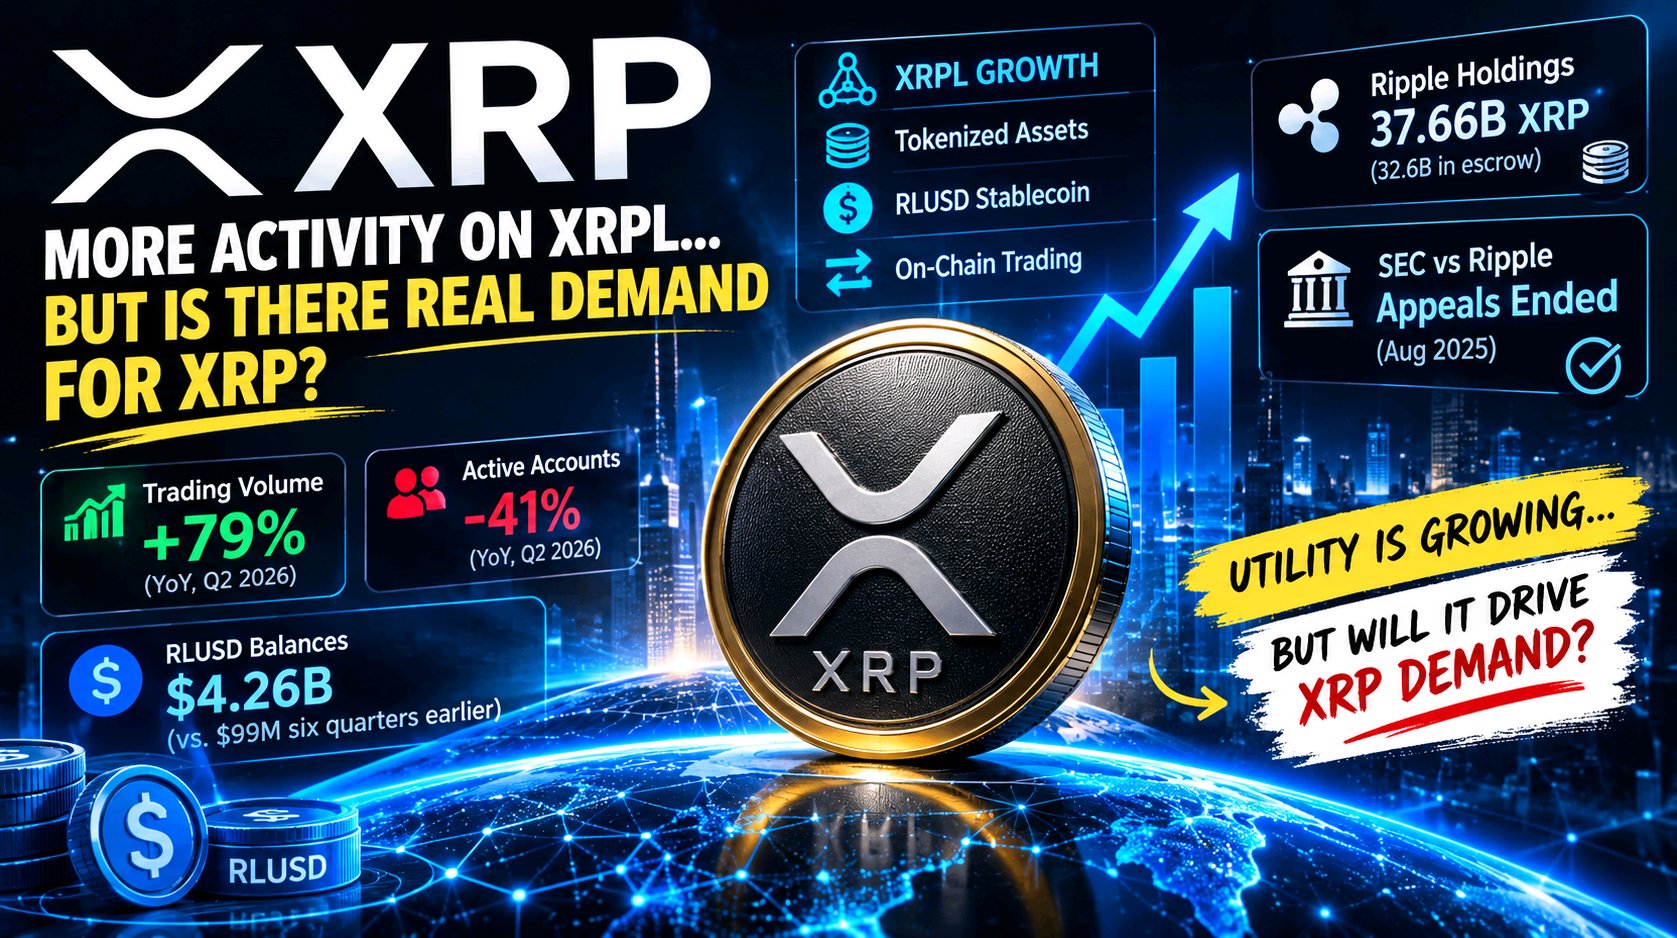
What caught my attention about XRP is that the XRP Ledger is attracting more value, but that does not automatically mean more people are using it. That distinction matters more than another bullish headline. CoinDesk reported that XRP Ledger order-book trading volume increased 79% year over year in Q2 2026, while the number of accounts initiating trades fell approximately 41%. Meanwhile, average tokenized-asset and RLUSD balances reached roughly $4.26 billion, compared with just $99 million six quarters earlier. Much of that growth came from Ripple’s dollar-backed RLUSD stablecoin. CoinDesk +1 The interesting part is how these developments connect. XRPL is building activity around tokenized assets, stablecoins and on-ledger trading, while XRP itself remains essential for transaction fees and account reserves. However, those functions do not guarantee that ecosystem growth will translate into proportional demand for XRP. xrpl.org +1 Supply also deserves attention. Ripple reported holding approximately 37.66 billion XRP, including 32.6 billion in escrow, as of June 30, 2026. Escrow releases and subsequent movements matter, but released tokens should not automatically be treated as immediate selling pressure. Ripple The regulatory picture has also changed: the SEC and Ripple ended their appeals in August 2025, while the existing judgment and injunction remained in effect. That removes one major chapter of uncertainty, not every market risk. Reuters For traders, I would watch whether rising on-ledger value is accompanied by stronger participation, sustained XRP spot volume and improving price structure. If activity keeps concentrating among fewer accounts, the growth story deserves closer scrutiny. The real question is whether expanding XRPL utility eventually creates measurable, sustained demand for XRP itself. $XRPUSDT #ByXIMPACT

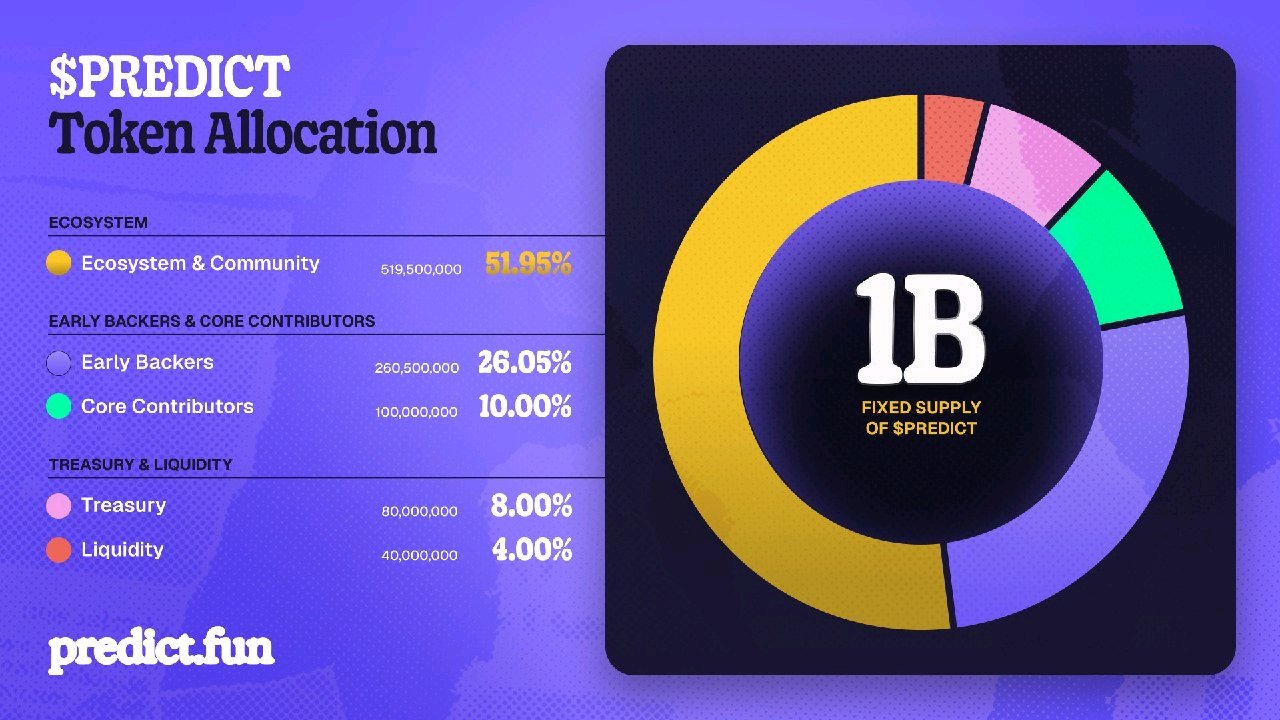
PREDICT TGE Analysis: High FDV, Aggressive Airdrop Mechanics, and the Binance IDO Gamble As a crypto trader, you already know the game: a hot prediction market project, a massive FDV, and the classic "take the money and run" airdrop dilemma. Here’s the breakdown of what’s actually happening with $PREDICT and how to position yourself. Tokenomics: Supply Overhang and the TGE Unlock The headline is the 1B fixed supply, but the devil is in the details. · Ecosystem & Community (51.95%): This is the largest chunk, but 70M (7%) is earmarked for the Season 1 airdrop. The rest is subject to long-term emission schedules. · Early Backers & Core Contributors (36.05%): This is the most critical data point. These allocations are fully locked at TGE with a 24-month cliff followed by a 36-month vesting schedule . This means no VC or team selling pressure on day one, which is a massive positive for the initial price action. · Circulating Supply at TGE: 16% of the total supply (160M tokens) will be in circulation. This is relatively high, but given the lockups, the actual float might be manageable if market makers absorb the airdrop sells. The Airdrop: The "Greedy vs. Patient" Dilemma The 70M token airdrop (7% of supply) comes with a predatory mechanic that you need to game: · Option A (Instant Gratification): Claim 35% immediately. The remaining 65% is burned/forfeited forever . This is designed to create sell pressure on day one. · Option B (The Long Game): 100% of the allocation via 12-month vesting. You have a one-month window post-TGE to change your mind and downgrade to Option A . · Trader Strategy: If you are farming the airdrop, Option B is mathematically superior unless you desperately need liquidity. The 35% instant claim essentially values your allocation at a ~65% penalty. Even if you plan to sell, vesting allows you to sell into potential pumps over the year rather than capitulating to the initial TGE dump. The Binance IDO and FDV Reality Check Tomorrow’s Binance Wallet IDO is the immediate catalyst. While the exact Alpha Points requirement is unclear, the pre-market data is screaming overvaluation: · Pre-Market FDV: It is currently trading around $1.4B to $1.64B FDV, with a recent pump touching $2B . · The Risk: A $1.4B FDV for a project with minimal initial float is a massive ask. As a trader, you must calculate the Point Value. If the FDV holds at $1.4B, the implied price is $1.40 per token. However, airdrop farmers who took Option A will likely dump their 35% immediately. This creates a scenario where the actual spot listing could see significant downside volatility unless there is aggressive market-making. · The Verdict: The FDV is currently driven by hype and perp pre-market mechanics, not actual user adoption. Do not chase the pre-market price. If you are participating in the Binance IDO, treat it as a short-term flip. If the FDV opens above $1.5B, the risk/reward for holding is poor. Summary $PREDICT has a clean TGE float (no VC dumps), but the 16% unlock and the airdrop's "burn 65%" mechanic are designed to test your conviction. The $1.4B+ FDV is rich. If you get an IDO allocation, consider taking profits on the initial listing volatility rather than holding for a "1B supply" long-term play. #PREDICT #BinanceIDO #Tokenomics #TGE #CryptoTrader

🚨 $BTC: ONLY 21 MILLION WILL EVER EXIST
Coinbase’s CEO highlights $BTCUSDT biggest advantage: scarcity. Gold and diamonds can still be mined. Bitcoin has a hard cap of 21 million coins.$ETHUSDT No one can change that fixed supply. 🔥 #IMPACTbyTrade



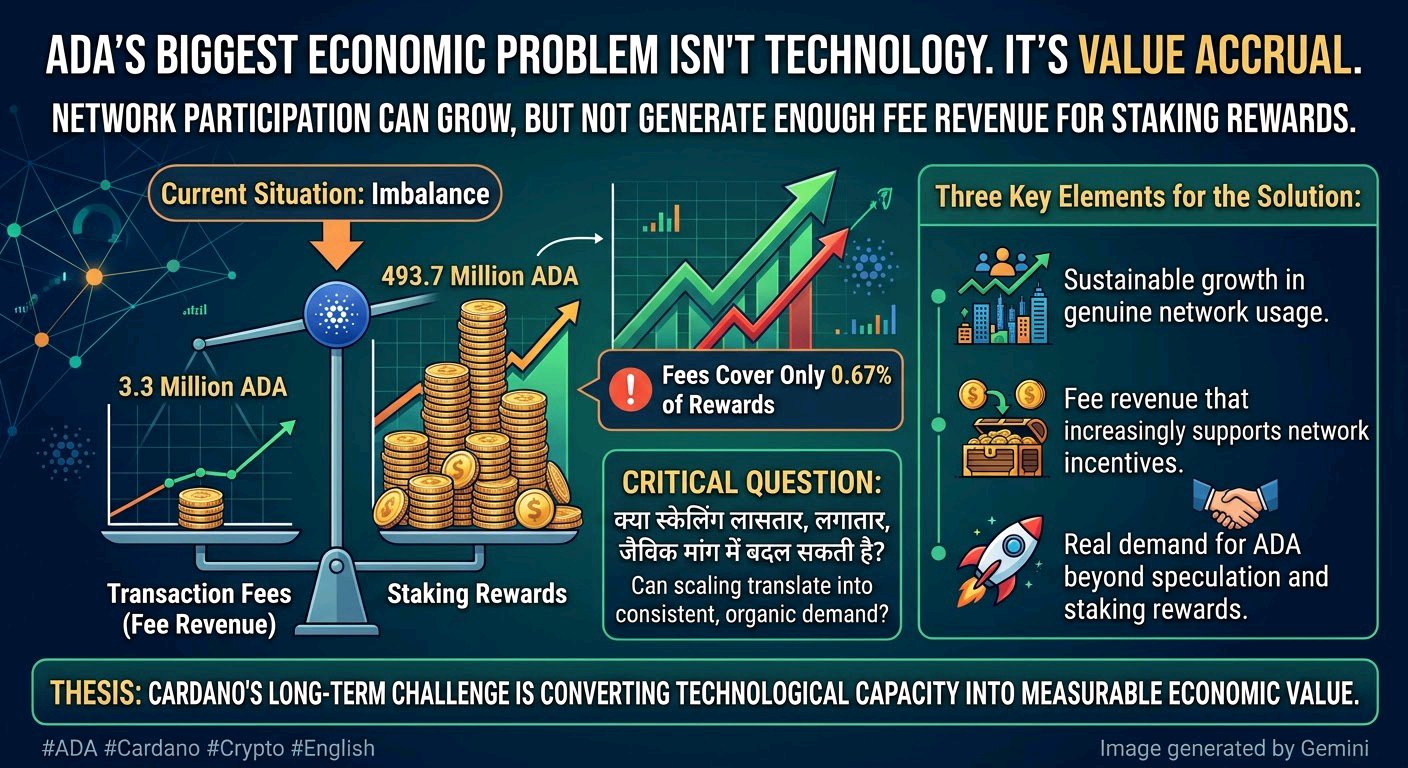
$ADAUSDT Biggest Economic Problem Isn’t Technology. It’s Value Accrual. Cardano has a clear economic contradiction: network participation can grow without generating enough fee revenue to support its reward economy. A September 2026 analysis reported 3.3 million ADA in transaction fees against 493.7 million ADA in staking rewards across 73 epochs. Fees covered just 0.67% of rewards. That gap raises a serious question about long-term sustainability. <Cite refs={["turn500931search1"]}/> The issue isn’t whether Cardano can scale. It’s whether scaling can translate into consistent, organic demand for blockspace. More transactions alone don’t guarantee stronger value for ADA. Activity driven by incentives, automated behavior, or temporary campaigns can inflate metrics without creating durable economic demand. For ADA to build a stronger fundamental case, three things matter: • Sustainable growth in genuine network usage. • Fee revenue that increasingly supports network incentives. • Real demand for ADA beyond speculation and staking rewards. My thesis: Cardano’s long-term challenge is converting technological capacity into measurable economic value. Until fee generation catches up with the reward structure, adoption metrics tell only half the story. The real question isn’t how many transactions Cardano can process. It’s how much sustainable economic demand those transactions create. #MyByXTake

ELSAUSDT: The Recovery Is Holding — But $0.0839 Still Matters ELSA was trading around $0.0760 in the October 28 market snapshot, after pulling back from its recent highs. Buyers are still trying to defend the recovery, but I’m not treating this as a fresh breakout while price remains below $0.0839 resistance. There’s an important fundamental detail worth watching. HeyElsa is developing an AI crypto copilot for transactions, swaps and DeFi activity. Its official litepaper describes ELSA utility features such as execution-fee discounts, premium-agent access and on-chain execution. These are stated use cases, but real adoption and sustained demand still need to be demonstrated. Supply matters too. ELSA has a maximum supply of 1 billion tokens, while circulating-supply estimates differ across trackers: CoinGecko lists around 228.98 million, while CoinMarketCap reports approximately 255.64 million. I wouldn’t treat either figure as definitive without a consistent supply methodology. Key figures | 28 October 2026 - ~$0.0760 — Market-price reference - $0.0839 — First resistance to reclaim - $0.0899 — Second resistance if the breakout holds - $0.0754 — First support to defend - $0.0690 — Next support if the first level breaks Bullish confirmation: ELSA reclaims $0.0839 and holds above it on a retest. That would strengthen the recovery setup and bring $0.0899 into focus. Bearish confirmation: Price closes below $0.0754 and fails to reclaim it. That would weaken the short-term setup and put $0.0690 back on the radar. I’m also watching the November token unlock. Trackers estimate around 17.7 million ELSA, but disagree on whether it is scheduled for November 19 or 20. That is potential additional supply, not guaranteed selling. I wouldn’t chase ELSA just because its AI narrative is attracting attention. I want price confirmation and a clearer picture of how new supply may affect the market. The recovery needs confirmation. Supply pressure deserves attention. $ELSAUSDT #ByXIMPACT


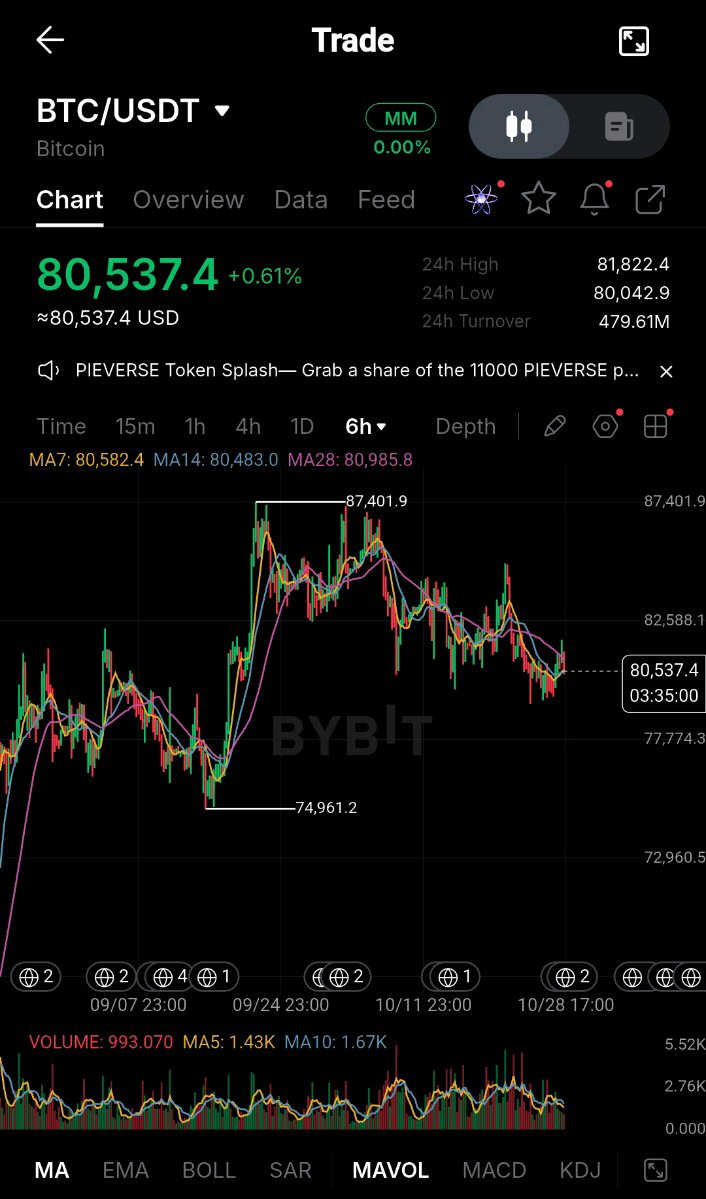
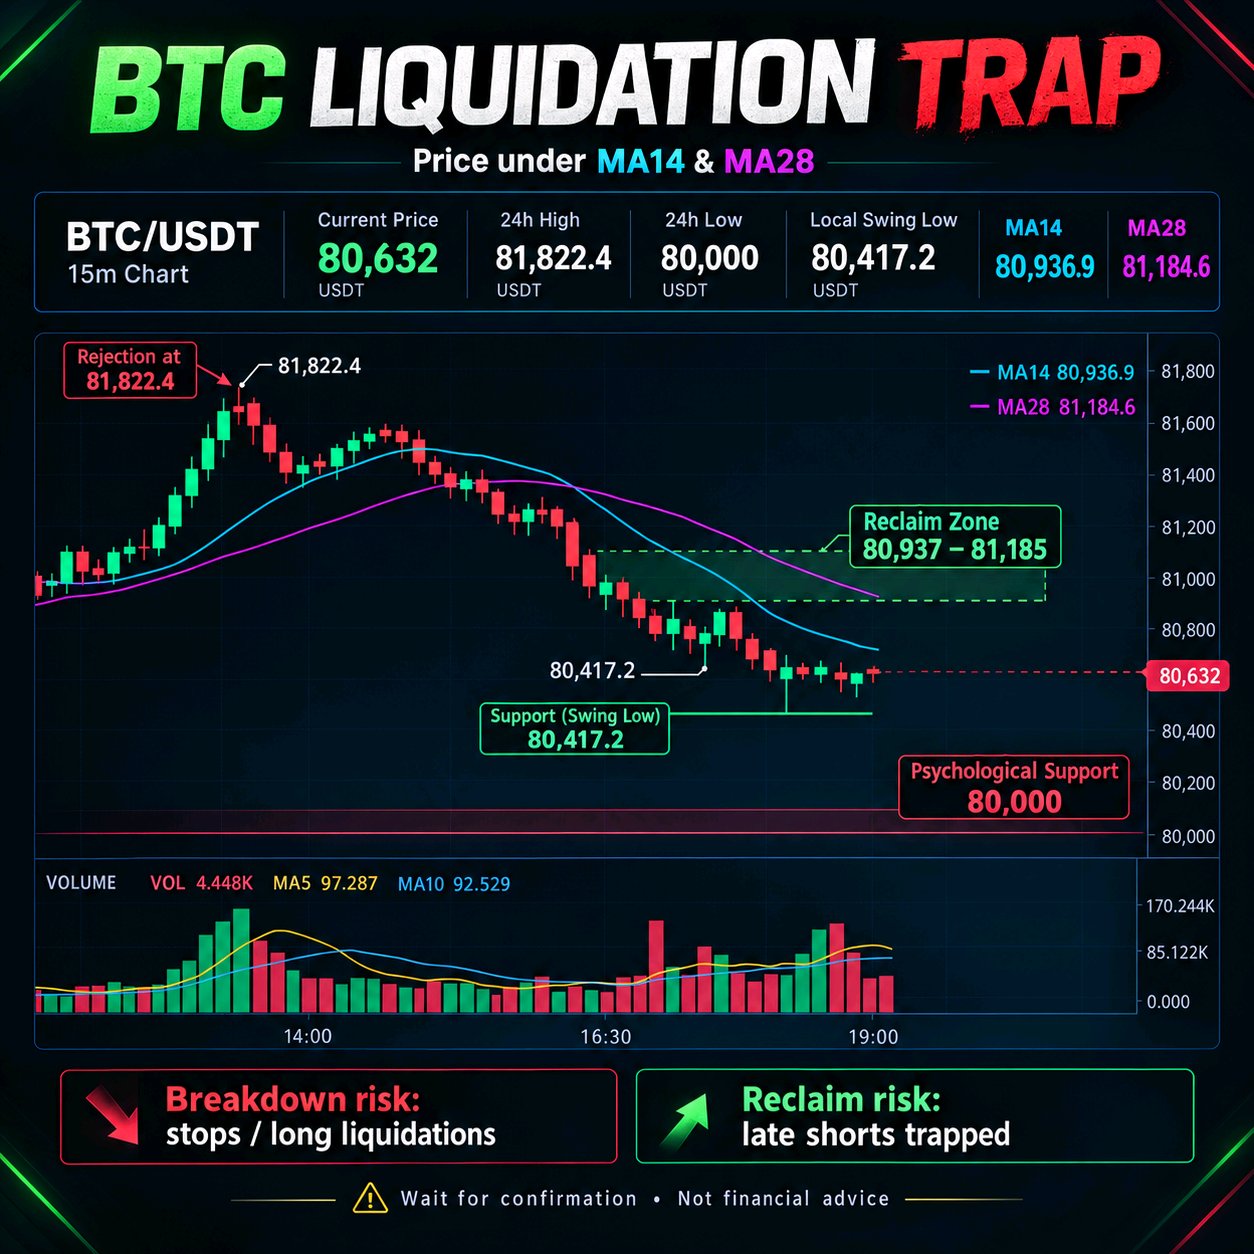
BTC Liquidation Trap ⚠️ | $80.6K Bitcoin is showing weakness after rejection near $81,822. Price is now around $80,632, trading below both MA14 and MA28. 🔻 $80,417: Local support to watch 🔻 $80,000: Key psychological level 🔺 $80,937–$81,185: Recovery zone to reclaim A breakdown could trigger stop-losses and long liquidations. But a strong recovery above the moving averages could trap late sellers instead. Don't chase the move. Let price confirm the next direction. Which comes first: a sweep below $80K or a bounce toward $81.2K? $BTCUSDT #IMPACTbyTrade

$BMTUSDT: BMT’s 68% surge has turned into a test of whether buyers can actually regain control. Bubblemaps (BMT) exploded on October 24, reaching an intraday high near $0.0585 as daily trading volume climbed to roughly 1.59 billion BMT. But the follow-through disappeared: by October 27, BMT closed near $0.0281—more than 50% below that spike’s high. Now comes the more interesting signal. BMT has rebounded from its October 28 low around $0.0268, with price returning toward $0.029. Yet derivatives data still shows negative funding, meaning short positions are paying longs to remain open. Open interest was also down 1.3% over 24 hours in one October 28 snapshot, despite the price recovery. That combination matters: the rebound may be partly a reaction to crowded bearish positioning—not proof that sustained spot demand has returned. Negative funding can help fuel a squeeze, but it cannot guarantee one. What confirms a stronger recovery? BMT needs to hold above the recent $0.0268 low and challenge the $0.030–$0.031 area, where the previous sessions saw selling pressure. A sustained move above that zone would improve the recovery case; losing $0.0268 would put the rebound thesis under pressure. The key question for the next few sessions is not whether BMT can bounce. It already has. It is whether buyers can turn that bounce into a durable recovery while derivatives positioning remains skewed toward shorts$BMTUSDT #ByXIMPACT

Crypto is starting to prove its value beyond trading. Tether, Bybit, Kraken, Solana Foundation and other major players have joined forces to launch FASE, a Swiss nonprofit focused on financial security, scam prevention and support for trafficking survivors. The scale is what caught my attention: • Up to 10M young people targeted with digital education and anti-scam tools • Stablecoin-based humanitarian aid pilot could reach 1M people • Support planned for organizations helping trafficking survivors across Africa This is a different side of crypto: not just markets, but access, protection and real-world financial utility. For the industry, initiatives like this could matter far beyond the next market cycle. $SUSDT $SOLUSDT #ByXIMPACT #IMPACTbyTrade #WSOT2026



🪙 LTCUSDT | Trade Update Successful trading requires a clear strategy, patience, and disciplined execution — not emotional decisions. • Market: LTCUSDT • Direction: Market Confirmation Required • Timeframe: 15M • Strategy: Market structure, momentum & key levels • Focus: Capital protection and risk management Watch how price reacts around support and resistance. A breakout with strong volume may present an opportunity, while a breakdown below support could invalidate the setup. Unrealized P&L is not realized profit. • Follow the plan. • Control your risk. Discipline over emotion. 🚀📊 $LTCUSDT $CHILLGUYUSDT #FOMCRateDecision #Bybit8thAnniversary #IMPACTbyTrade #MyByXTake #MidtermsMarketWatch


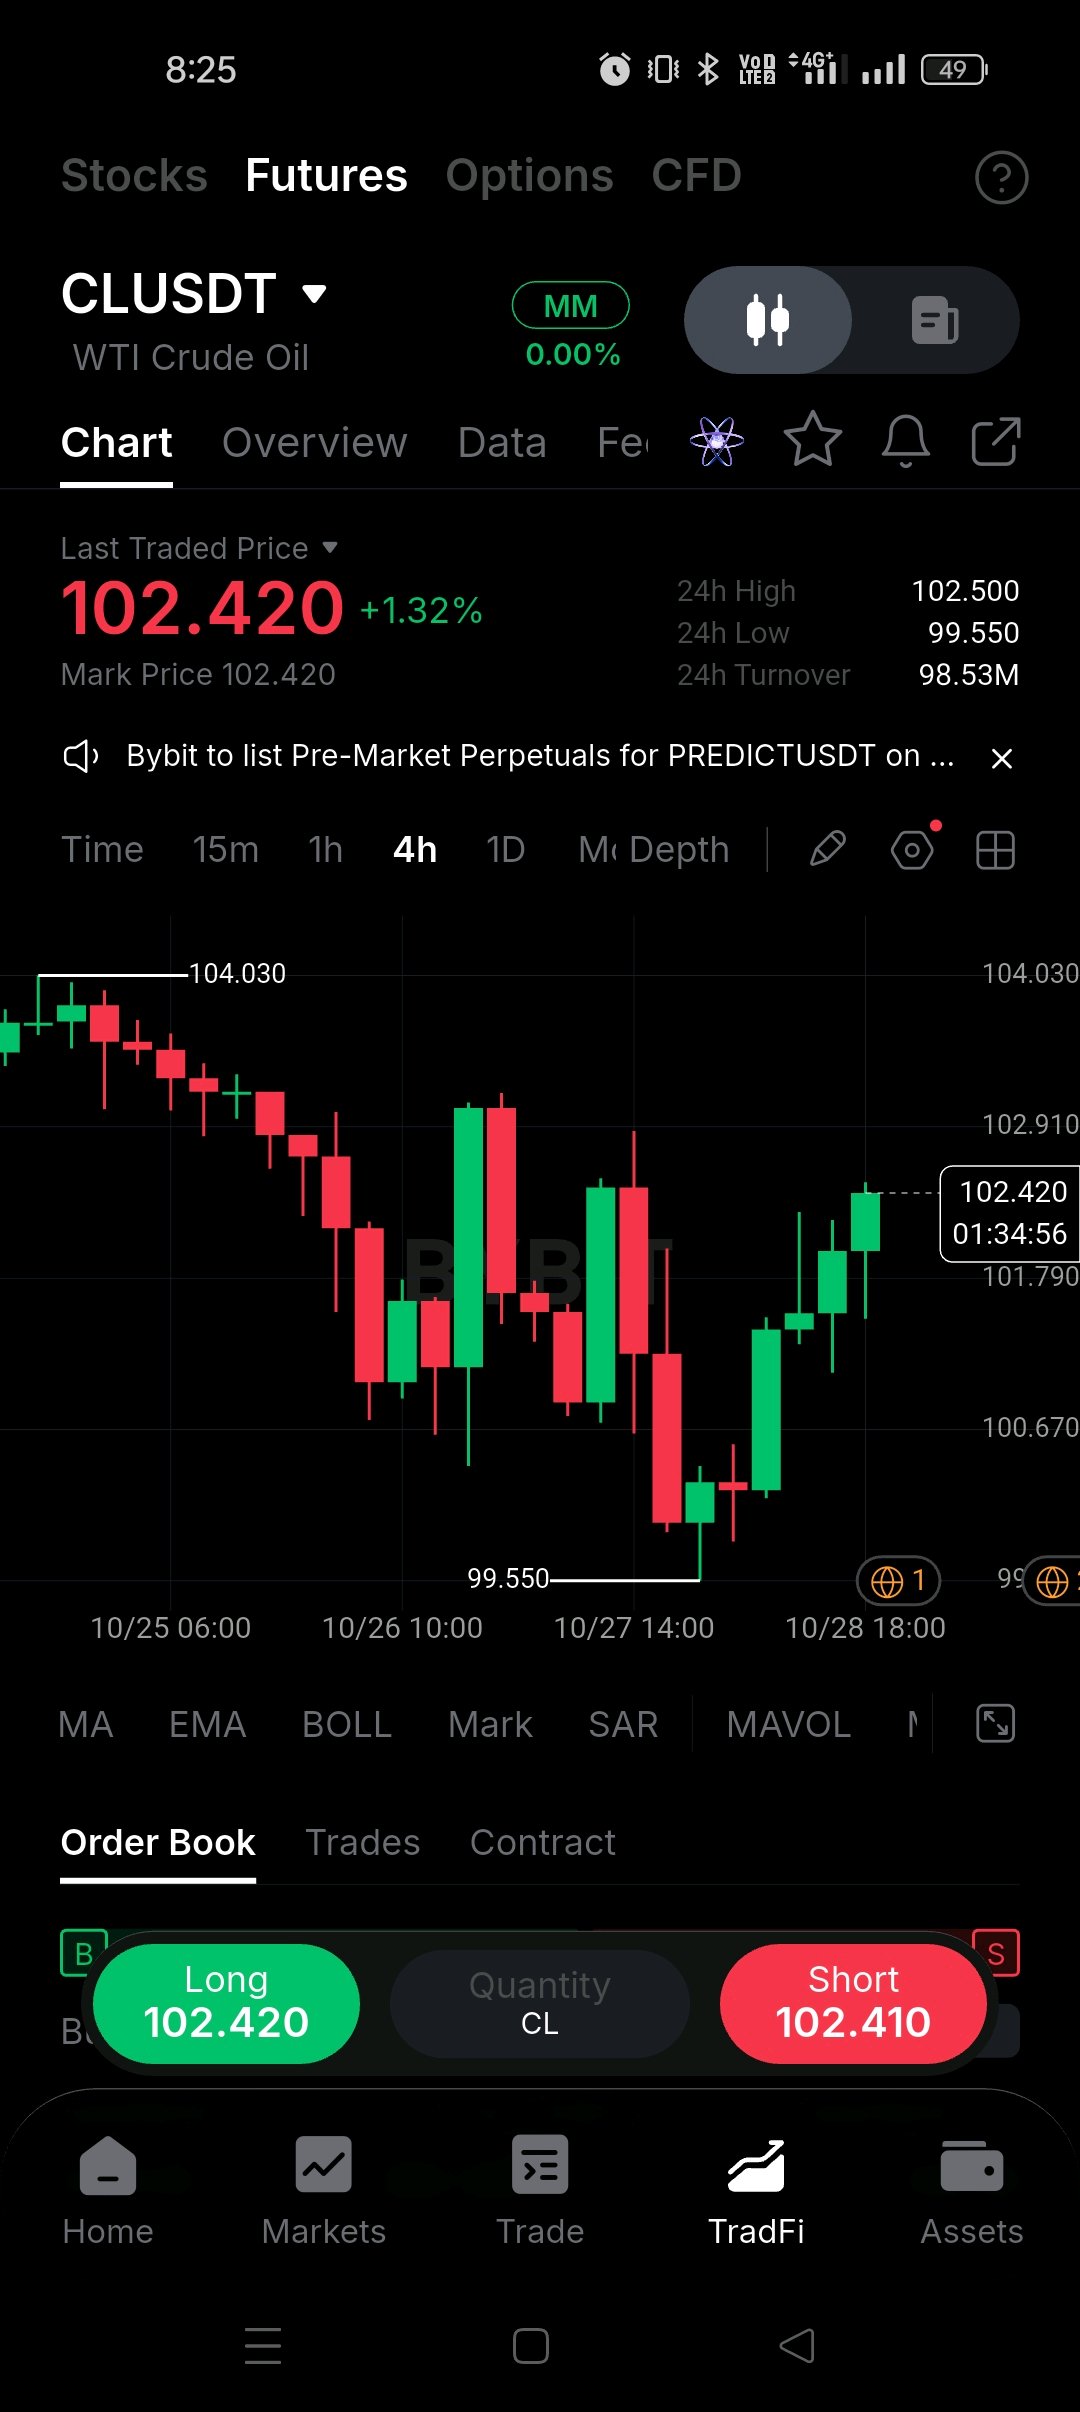
CLUSDT 4H Chart Analysis
WTI Crude Oil is showing a recovery after dropping to the $99.55 support zone. Buyers have pushed the price back above $102 and the recent candles show positive momentum. The next resistance is around $102.90. If buyers break this level and hold above it the price could move toward $103.50 and $104.00. However if the price gets rejected near resistance it may pull back toward $101.80 or $100.70. My view is cautiously bullish as long as the price holds above the nearby support levels. I will watch the $102.90 zone closely for the next move. #MyByXTake #CLUSDT

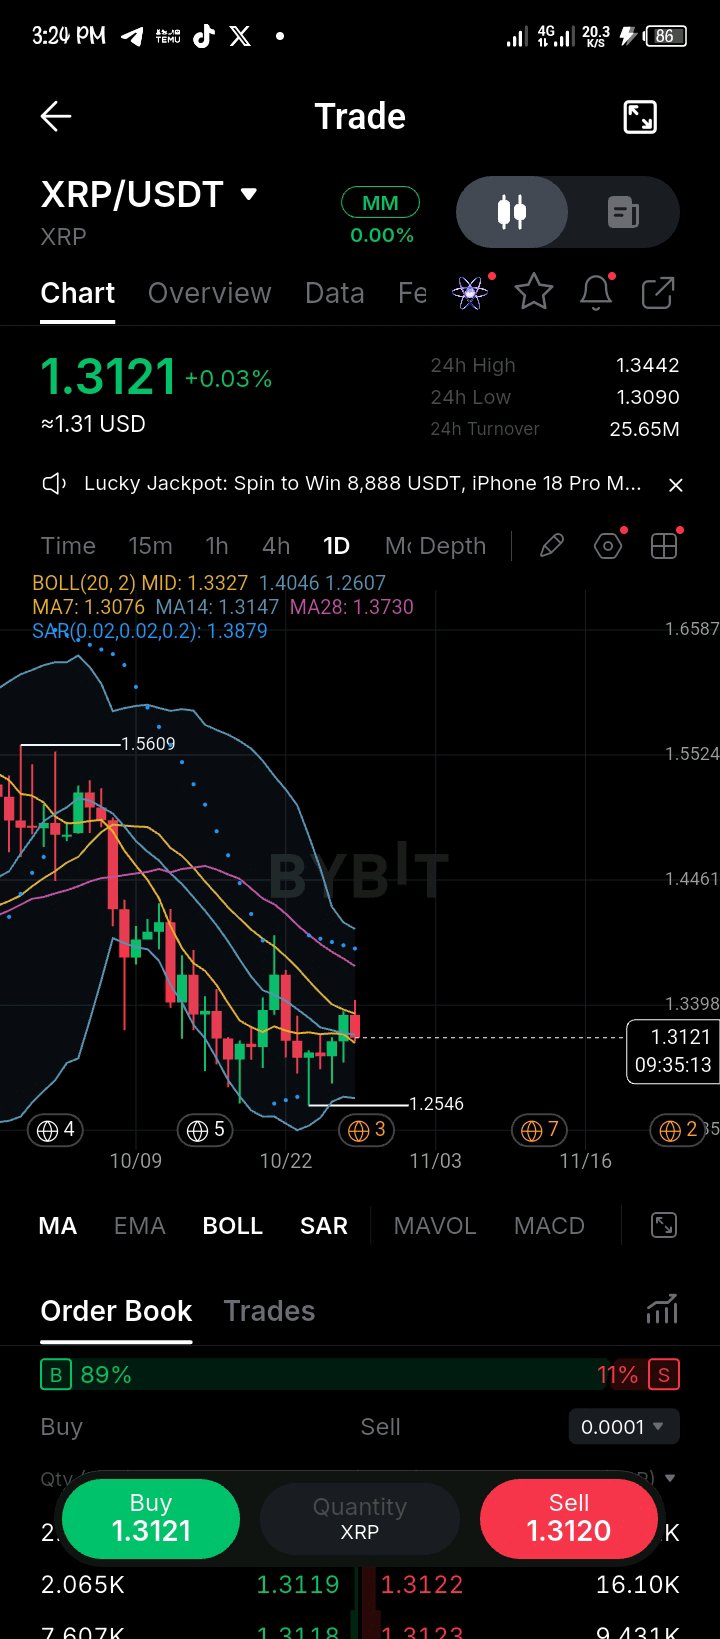
$XRPUSDT +0.03% to 1.3121 — This is a bottom coiling after a trend flush, trying to reclaim the MA cluster.* What caught my attention isn't the flat +0.03%, it's the structure behind it. Price topped around 1.5609 near BOLL Upper, then flushed straight down - losing MA7: 1.3076, MA14: 1.3147, MA28: 1.3730, and BOLL MID: 1.3327, and washed to 1.2546 low, tagging near BOLL Lower at 1.2607. Now we are sitting at 1.3121, chopping back into the MA7/MA14 box after that drop. The detail that matters most is the BOLL + MA compression. BOLL(20,2) MID is 1.3327, Upper 1.4046, Lower 1.2607. Price is still BELOW MID but holding above MA7: 1.3076 - first sign of support reclaim. MA14: 1.3147 is the immediate trigger, MA28: 1.3730 is still way above - bear stack still intact but tightening. SAR is high at 1.3879 - downtrend dot not flipped. Order book 89% Buy vs 11% Sell - heavy absorption on this bottom. My read is this is late-stage downtrend basing, not a breakout. Selling at 1.3121 right above 1.3090 (24h Low) / 1.2607-1.2546 support is terrible risk/reward. Buying here is also early without confirmation above MID. If price holds above 1.3076 (MA7) and closes above 1.3147 / 1.3327 (MA14 + BOLL MID), the setup for a mean-reversion long towards 1.3442 (24h High) then 1.3730 (MA28) and 1.4046 (BOLL Upper) becomes attractive. Lose 1.3090, then 1.2607-1.2546 gets retested. Structural lines I care about: Capitulation support 1.2546-1.2607, immediate support 1.3076, trigger 1.3147 / 1.3327, expansion 1.3730 / 1.4046. This is bottom coiling holding MA7 - watch the BOLL MID reclaim, don't chase inside the box. #MyByXTake #IMPACTbyTrade $USDCUSDT @

🚀 Wall Street Just Took a Big Step Toward Putting Securities on Blockchain. And this time, it's not just another experiment. On October 28, DTCC announced the launch of its Tokenization Service through its subsidiary, The Depository Trust Company (DTC). Why is this important? Because DTCC is a major part of the infrastructure behind traditional securities markets. Its new service allows eligible securities held at DTC to be represented as blockchain tokens, while preserving their existing ownership rights and investor protections. The initial eligible list includes 34 securities, covering selected stocks, ETFs and U.S. Treasuries. But here's the part that makes this different from the usual tokenization headlines. Participants can convert eligible holdings between traditional and tokenized forms, while tokenized securities remain recorded in DTC’s official books and records. The service currently supports Canton Network and DTCC's private Besu network, with additional blockchain integrations planned for 2027. There's a catch, though. This isn't permissionless trading for anyone with a crypto wallet. Participants must opt in, wallets must be registered, and transfers are restricted to registered wallets. DTCC says 20 participants have signed access agreements. So what's the bigger opportunity? Tokenized securities could eventually move more efficiently between traditional financial systems and blockchain infrastructure, potentially improving how institutions manage and transfer collateral. Those benefits still need to prove themselves in practice. The real milestone isn't that Wall Street discovered tokenization. It's that a major piece of Wall Street's existing infrastructure has now launched a service built around it. #RWA #Tokenization #Blockchain #TradFi


Hyperliquid Unstakes 180,000 $HYPE For Monthly Team Unlocks, As Buyer Of Previous OTC Sale Remains A Mystery$HYPEUSDT #Hypeusdt

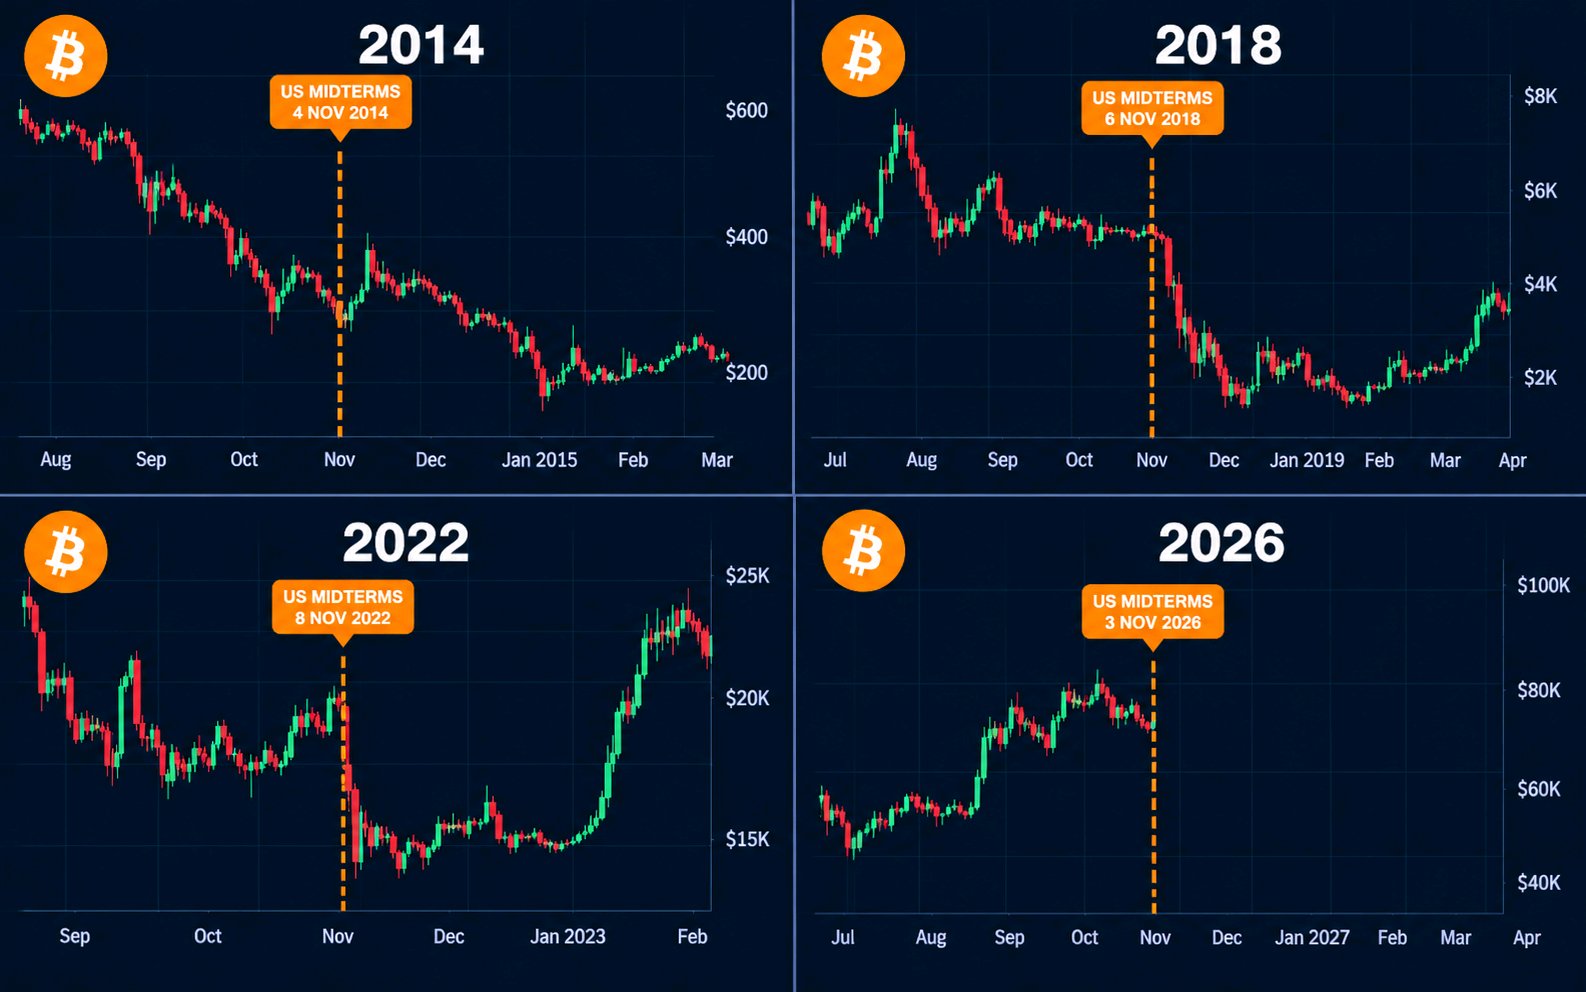
🚨 Will Bitcoin Crash After the 2026 Midterms?
HISTORY IS WARNING BITCOIN HOLDERS! Bitcoin has crashed after every US midterm election. Will history repeat, or will BTC finally break the cycle? $BTCUSDC #BybitStocks

SK hynix Smashes Q3 & Halts Solidigm’s $10B IPO
Revenue: KRW 104.62T Operating Profit: KRW 83.33T 🔥 Key Driver: Surging HBM4 shipments and AI-driven memory demand. Meanwhile, SK hynix discontinued its review of Solidigm’s pre-IPO financing and potential US listing, previously valued at around $10B. 🤔 What’s your move? Buy the pullback, hold, or take profit? Trade SKHY Now #SKHynixEarningsBeat #MyByXTake #NewFinancialPlatform

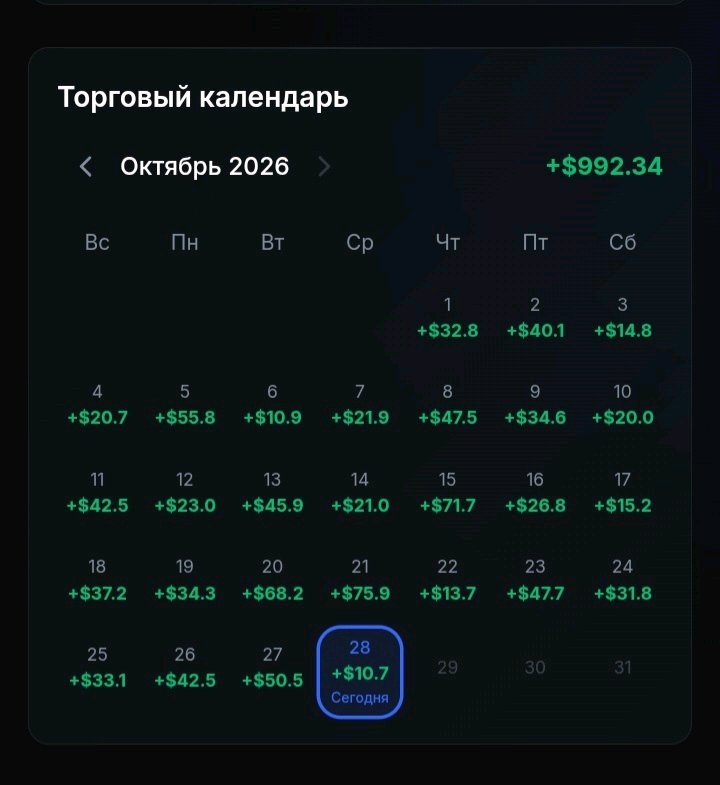
Смешно, когда люди спорят, работает это или нет. Я просто открываю приложение. Вот 👇

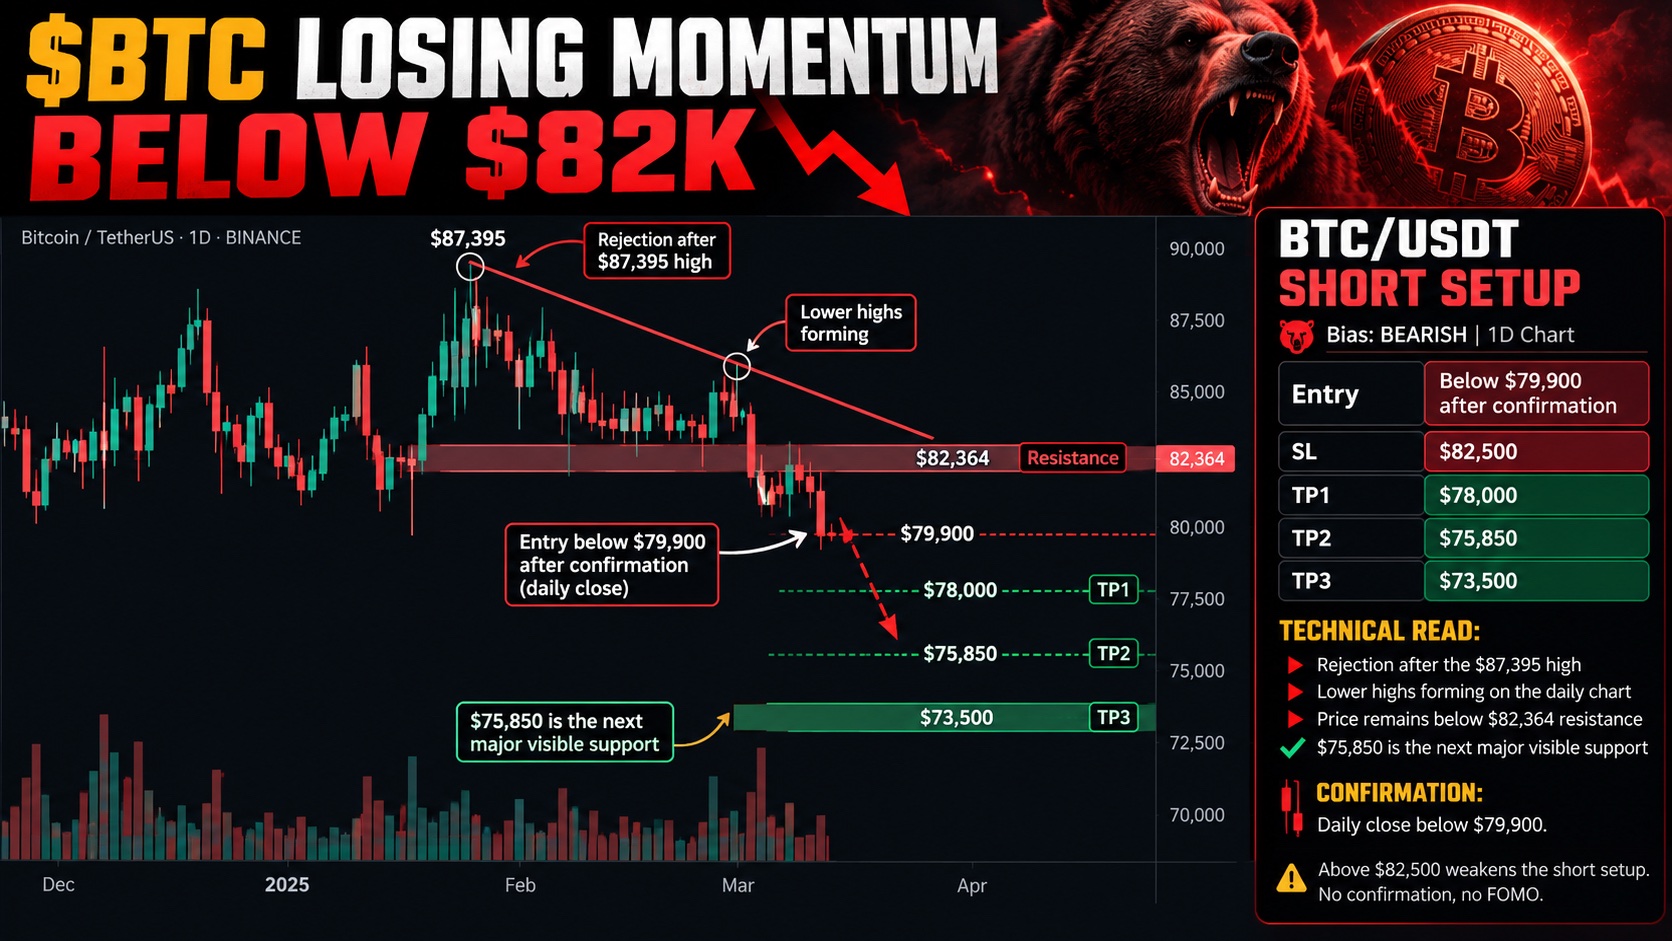
📉 $BTC Losing Momentum Below $82K
$BTCUSDT /USDT: SHORT SETUP Bias: BEARISH | 1D Chart Entry: Below $79,900 after confirmation SL: $82,500 TP1: $78,000 TP2: $75,850 TP3: $73,500 Technical read: 🔻 Rejection after the $87,395 high 🔻 Lower highs forming on the daily chart 🔻 Price remains below $82,364 resistance ✅ $75,850 is the next major visible support Confirmation: Daily close below $79,900. Above $82,500 weakens the short setup. No confirmation, no FOMO. #IMPACTbyTrade #ByXIMPACT

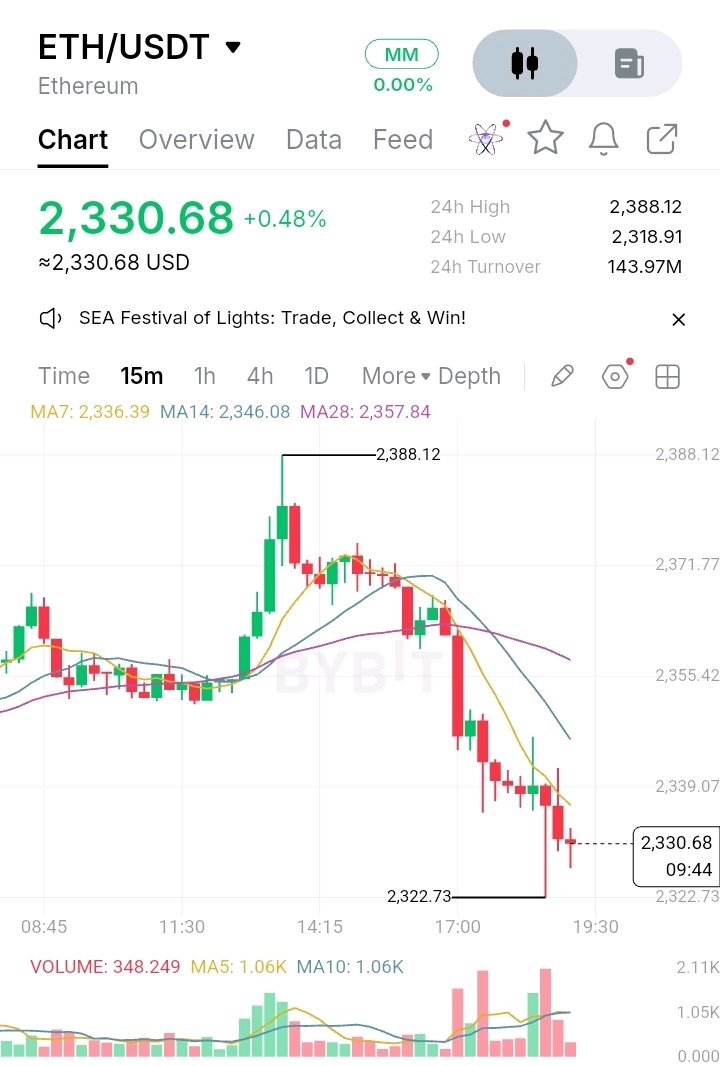
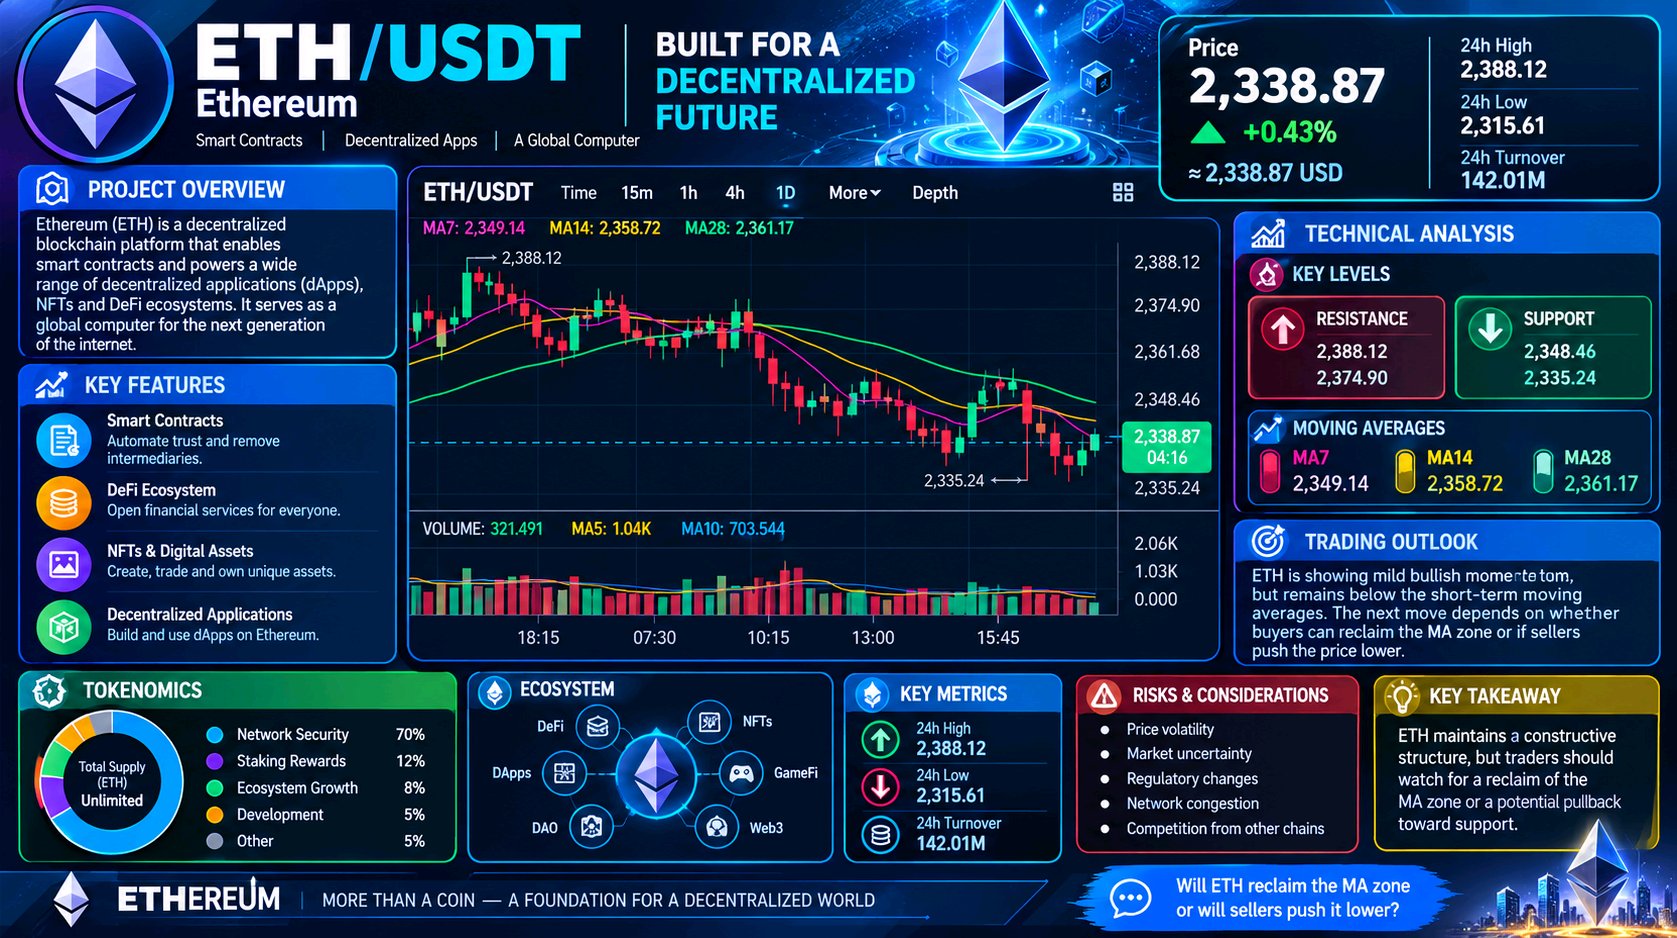
📊 $ETHUSDT Technical Analysis 💰 Price: $2,330.68 (+0.48%) 🔺 24h High: $2,388.12 🔻 24h Low: $2,318.91 📈 Moving Averages - MA7: $2,336.39 - MA14: $2,346.08 - MA28: $2,357.84 ETH is trading below all three moving averages, indicating short-term bearish pressure despite its positive 24-hour performance. 🎯 Key Levels - Resistance: $2,336, $2,346, $2,358 - Support: $2,322.73, $2,318.91 🚀 Bullish Scenario: Reclaiming $2,336 could open the way toward $2,346 and $2,358. ⚠️ Bearish Scenario: A break below $2,318.91 may signal further weakness. 📉 Volume: Displayed volume is below MA5 and MA10, suggesting limited buying momentum. Market Outlook: ETH remains under short-term pressure. Watch for a moving-average reclaim or a breakdown below support for the next directional signal. 💬 Will ETH recover above $2,350 or retest $2,319 first? #ByXIMPACT #IMPACTbyTrade