IMPACTbyTrade
Trades reales. Perspectivas reales. Mayor IMPACTO. Comparte tus posiciones, historial de trading y razonamiento de mercado con un Cashtag cuando sea relevante. Las ideas originales y la interacción genuina importan más que el volumen de publicaciones. Los creadores elegibles pueden competir por recompensas semanales de 100 USDT. Aplican criterios de elegibilidad, puntajes de IMPACTO mínimos y términos del evento.

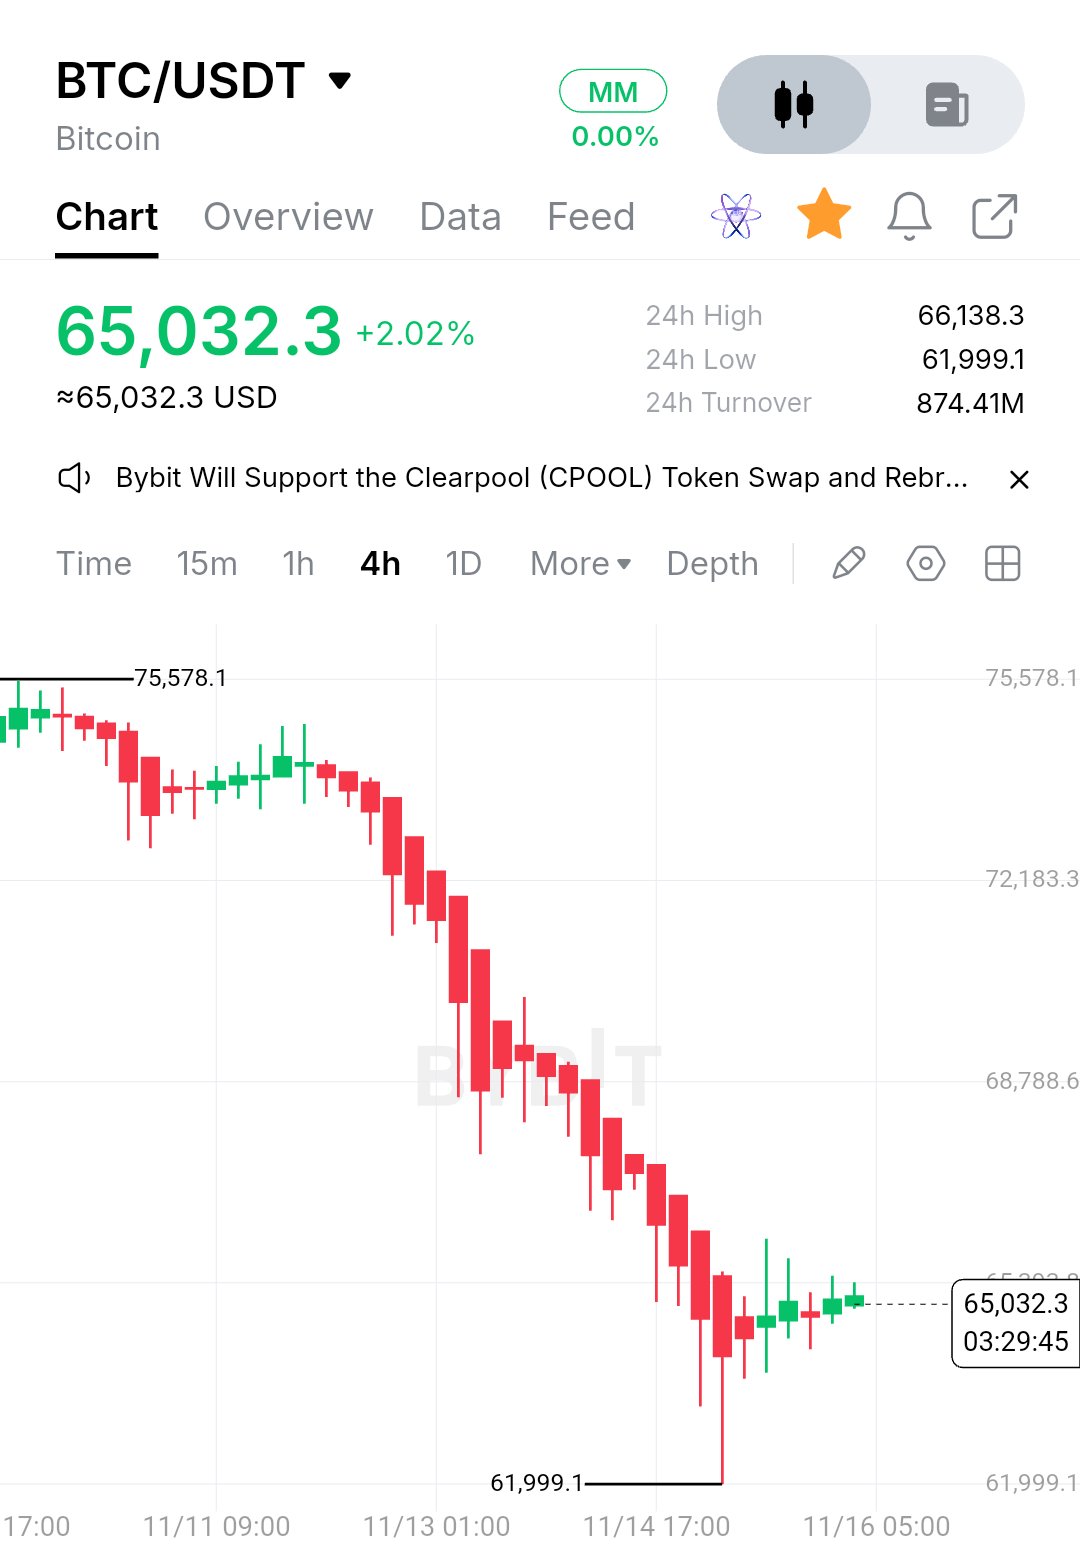
$BTCUSDT — The sell-side expansion has slowed, but Bitcoin has not yet proven a structural reversal. Bitcoin is currently trading around $65,032, showing a short-term recovery of approximately 2.02%. However, looking at the 4H chart, the broader structure remains under pressure after an aggressive bearish displacement from the $75,500 region. 1. MARKET CONTEXT & PRICE ACTION BTC experienced a sustained downside move, breaking through several intermediate support areas without establishing meaningful bullish reactions. Previous demand failed to absorb the selling pressure, allowing sellers to maintain control and push price toward the $61,999 liquidity zone. The reaction from $61,999 is now worth watching. Price has recovered toward $65,000, suggesting that buyers are beginning to respond after the recent sell-side expansion. Nevertheless, this recovery currently looks more like a relief bounce than a confirmed change of market structure. On the 4H timeframe, the dominant structure remains bearish, with lower highs and lower lows still defining the broader move. The immediate objective for buyers is to reclaim nearby resistance and establish a higher low. 2. BUYER VS. SELLER BEHAVIOR The $61,999 area represents an important downside reference. The sharp rejection from this region suggests that sell-side liquidity may have been taken before buyers stepped in. But one bullish reaction does not automatically establish a reversal. For buyers to regain control, BTC needs to: • Maintain acceptance above the $64,000–$65,000 region. • Break and hold above the $65,400–$66,150 resistance area. • Form a higher low on the 4H timeframe. • Demonstrate bullish displacement rather than weak, overlapping candles. If these conditions develop, the recovery could gain structural credibility. On the other hand, repeated rejection around $65,400–$66,150 would indicate that sellers are still defending the supply area. 3. TARGETS & UPSIDE CHECKPOINTS If buyers successfully reclaim nearby resistance, these are the important structural checkpoints: 🎯 $65,400–$66,150: First resistance and immediate recovery confirmation zone. 🎯 $68,000–$68,800: Next major upside checkpoint, approximately 4.6%–5.8% above the current price. 🎯 $70,000–$72,180: Broader recovery objective, approximately 7.6%–11% upside if bullish momentum continues. 🎯 $75,500: Previous major swing region and a potential larger-scale recovery objective. These are conditional technical objectives, not guaranteed price destinations. Each level requires acceptance and confirmation before considering the next. 4. RISK MANAGEMENT & INVALIDATION The bullish recovery thesis depends heavily on BTC maintaining the demand established around $61,999. A decisive 4H breakdown below $61,999, particularly if followed by a failed retest, would invalidate the immediate recovery setup and expose Bitcoin to further downside price discovery. Likewise, rejection from $65,400–$66,150 without a successful reclaim would weaken the short-term bullish argument. Avoid chasing green candles into resistance. Let price establish its direction, identify the liquidity sweep, and wait for confirmation through market structure. 5. FINAL THOUGHT Bitcoin has shown its first meaningful reaction after a substantial bearish expansion, but the market still needs to prove that buyers can do more than temporarily slow the decline. The distinction between an asset's long-term potential and a trade's immediate probability is important. Believing in Bitcoin does not mean ignoring bearish structure, and respecting bearish structure does not mean abandoning bullish opportunities. Trade the confirmation, respect the invalidation, and let price action determine the bias. #IMPACTbyTrade

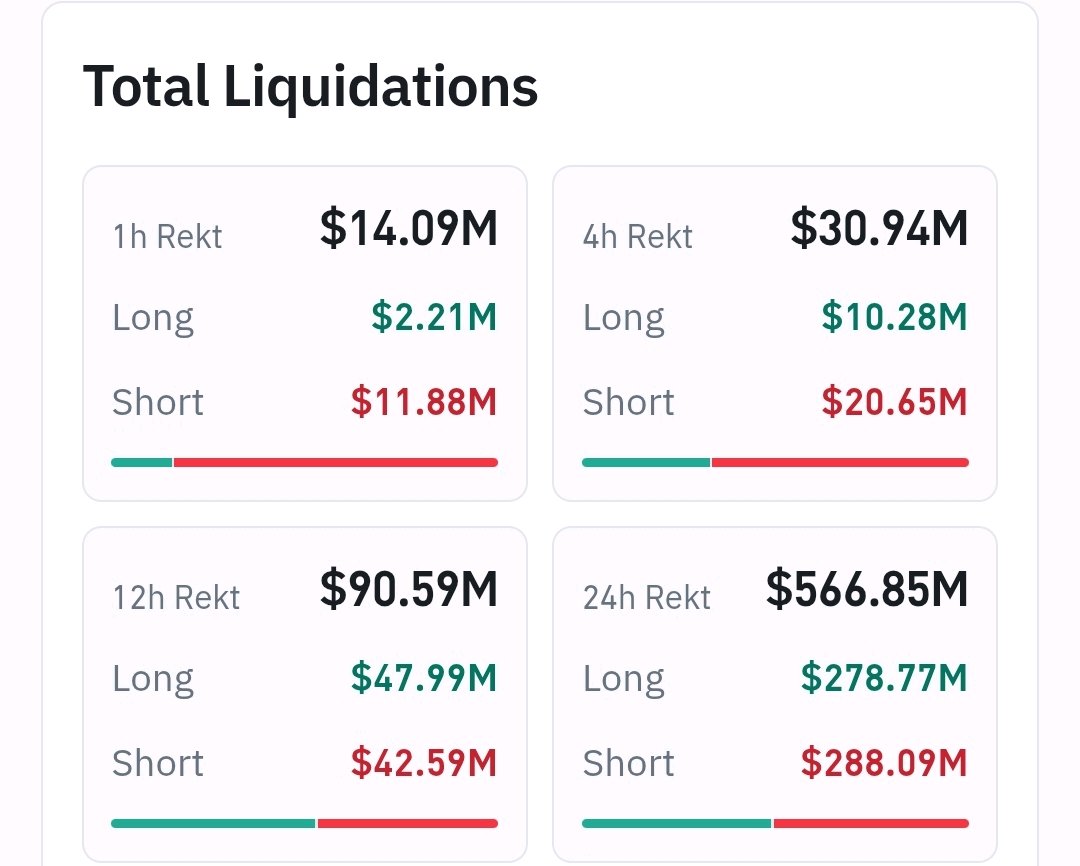
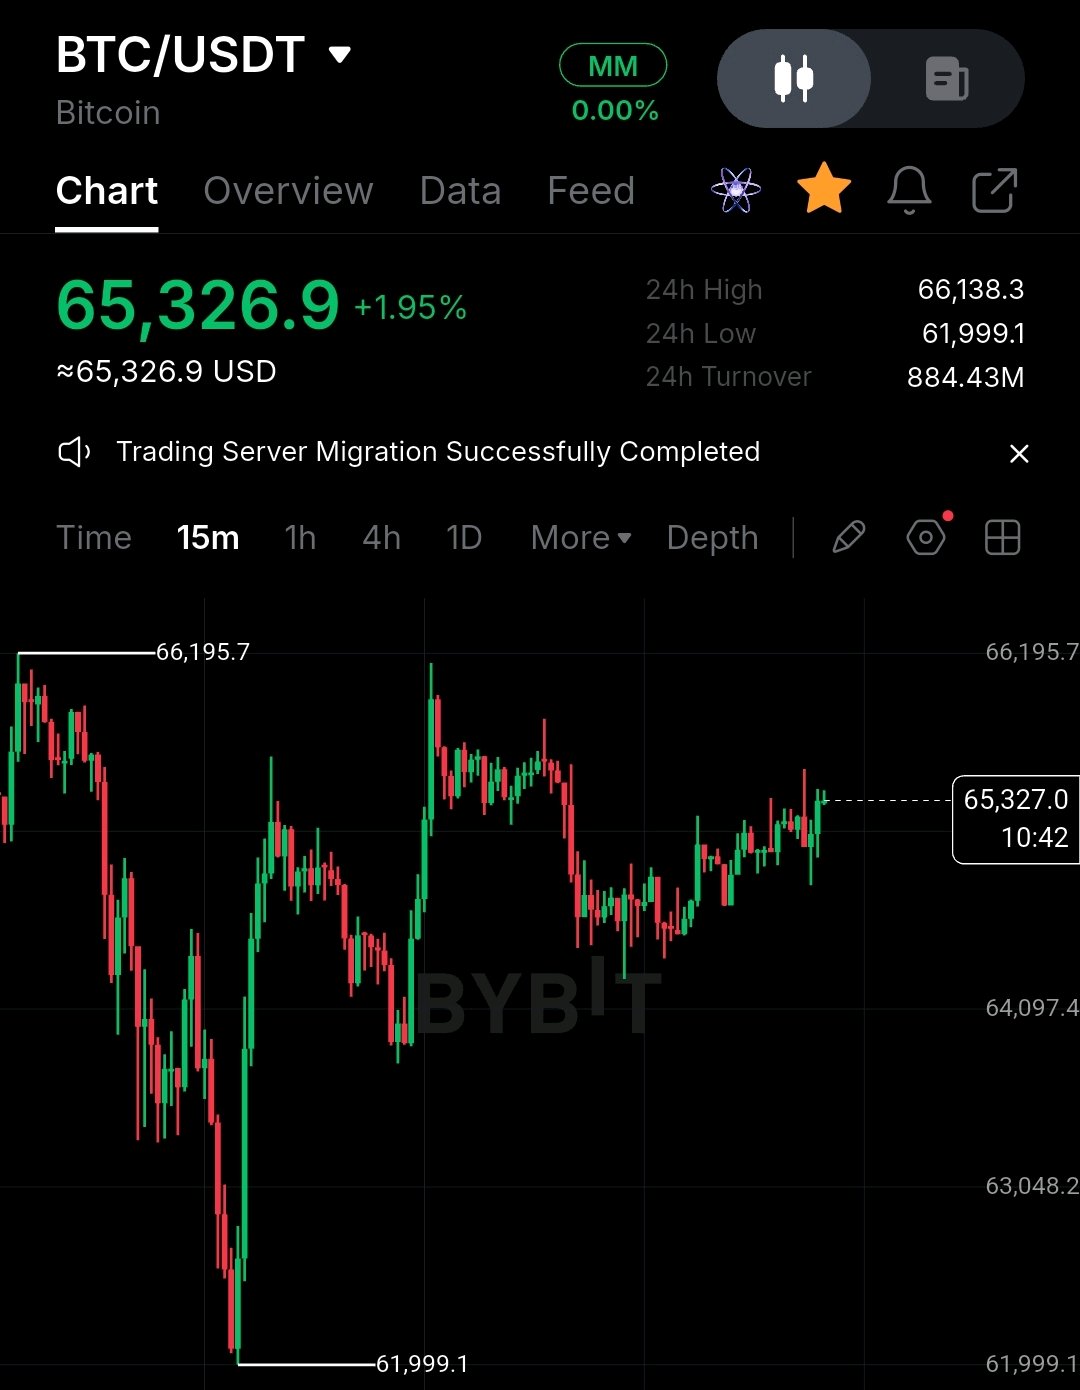
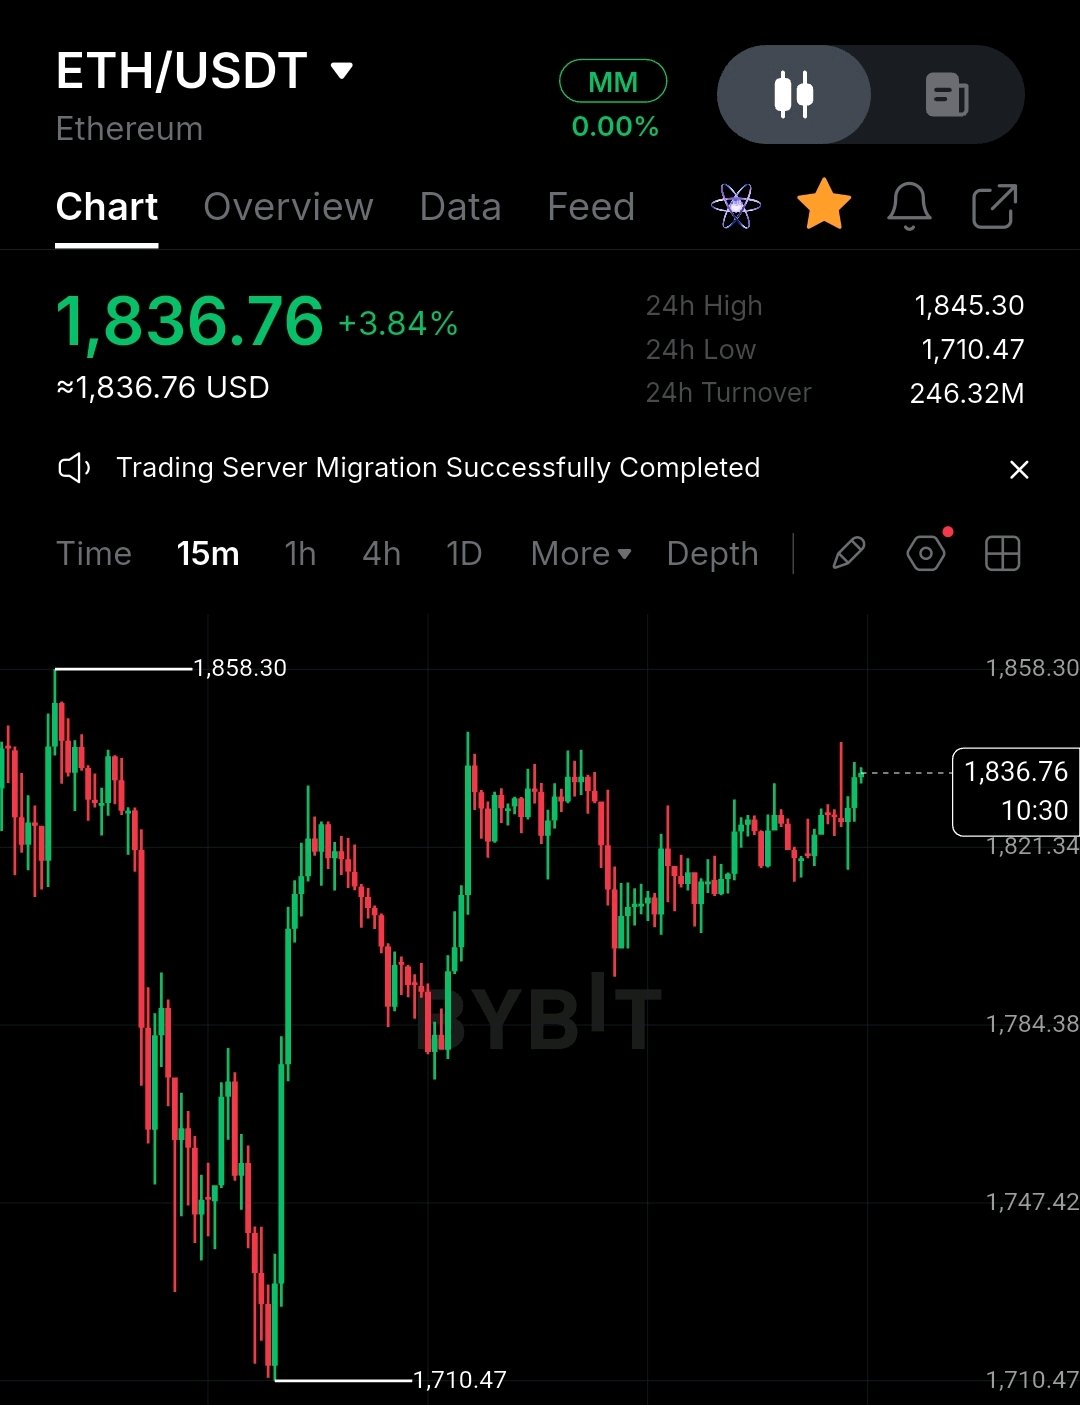
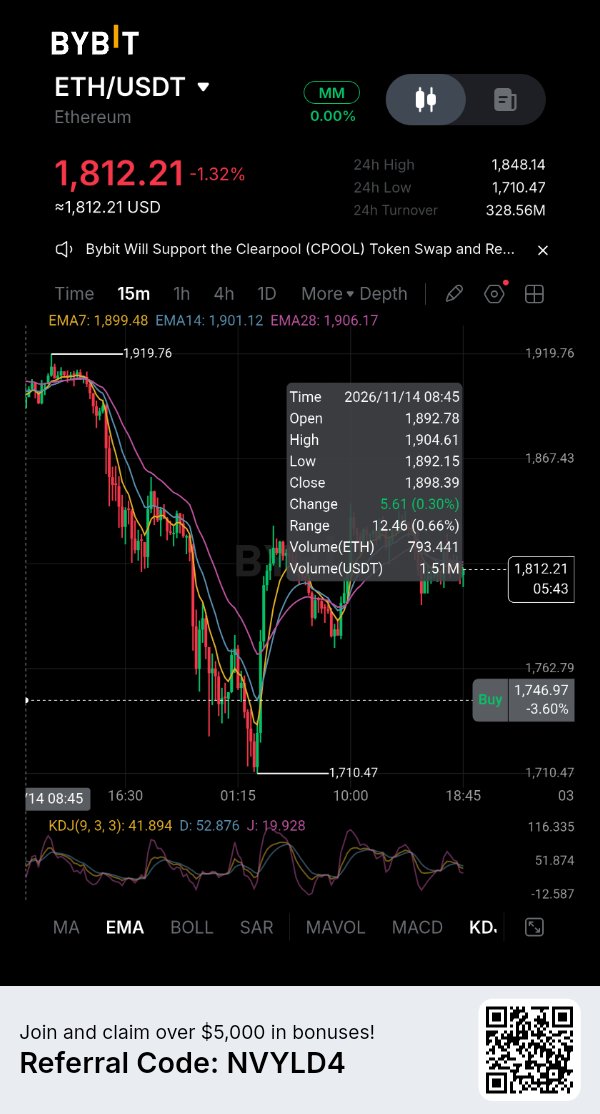
Yesterday, when I wrote about the market, around $1.93 billion in crypto futures positions had been liquidated, with most of them being longs. Today, around $560 million has been liquidated over the past 24 hours, with longs and shorts now accounting for a similar share. This comes after a small market recovery. $BTC bounced from around $62,000 to nearly $66,000 and is now trading near $65,300. While $ETH recovered from approximately $1,710 to $1,830. #IMPACTbyTrade $BTCUSDT $ETHUSDT

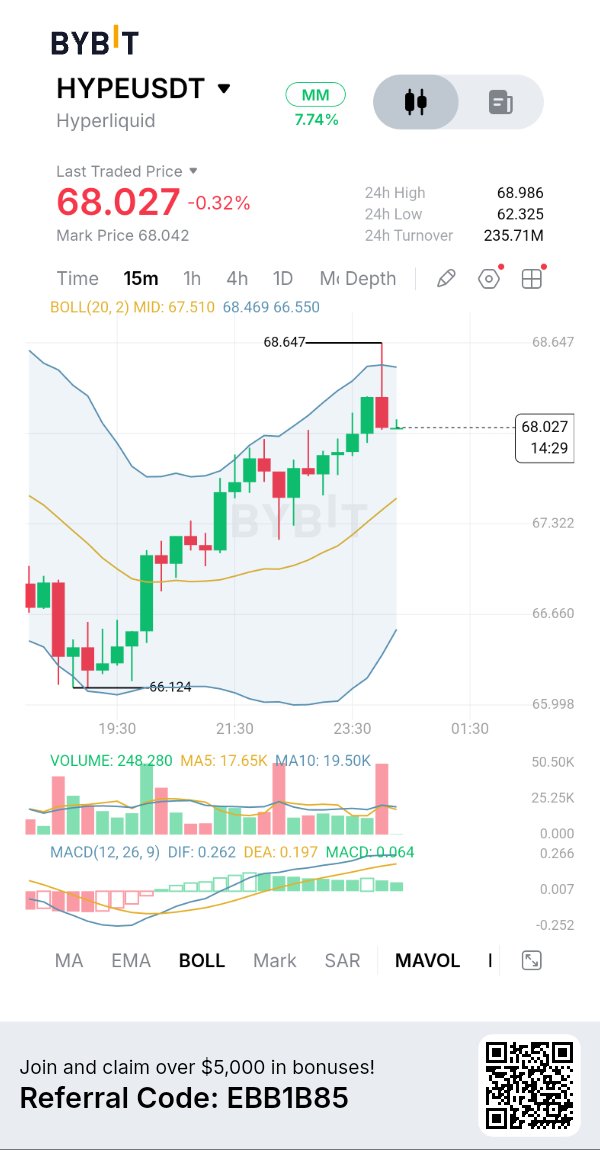
If you think $HYPEUSDT has permanently topped just because the rest of crypto is digital trash, take a hard look at its ever expanding fundamentals Why does this matter? Because Hyperliquid is a revenue machine where every dollar of collateral and every dollar of trading volume contributes to deflationary $HYPEUSDT buybacks More adoption → less circulating $HYPE overtime. Its that simple and no other asset has this. $TSLA ran hard off its early-November low, broke the prior swing high, and is now pulling back. I'm leaning long, but I'm not buying here. I want price to come down into a specific pullback zone first. Chasing the middle of a pullback is how you get a bad entry. The drop from the recent high looks like a retracement inside the up-leg, not a trend change. The 12h still prints higher lows. Why the zone matters: - The 4h, 12h and daily moving averages stack at the same level - The 62% retracement of the last up-leg lands there too - Recent equal lows sit just below it Four separate reasons on one shelf make a bounce there mean more. The ICT read: those equal lows hold a pool of stop orders. A sweep through them that snaps back into the discount zone is the setup I'd take. Targets are the liquidity resting above the recent swing highs. Where I'm wrong: if price gives up the 12h swing low, the daily 200-day average and the bottom of the optimal retracement band together, the pullback read is dead and I step aside. Risks: Nvidia earnings on Nov 18 and December rate-hike worries could shake AI and high-beta names. Thin weekend pricing means the Monday open can gap. Not investment advice. All decisions and responsibility are your own. $BTC has only been oversold on the weekly 4 times in it's entire history 📉 But, an oversold weekly RSI hasn't always marked the final bear-market bottom. 📉 2015: BTC bottomed 210 days later. 📉 2019: Oversold RSI coincided with the bottom. 📉 2022: BTC bottomed 147 days later. 2026: Already 280 days since the initial oversold signal, with a definitive bottom still to be confirmed. When BTC first became oversold this cycle, it was trading around $60,000. Yesterday's flush saw BTC trade as low as $62,000, meaning price has spent 280 days without establishing a sustained recovery. This is the longest period between an initial weekly oversold RSI signal and a confirmed cycle bottom among the historical examples examined. Only in 2019 did the oversold RSI coincide with the final bottom. The other examples tell us, an oversold weekly RSI doesn't guarantee an immediate reversal. Historically, it has often been followed by months of further consolidation or downside before a definitive bottom forms. #IMPACTbyTrade
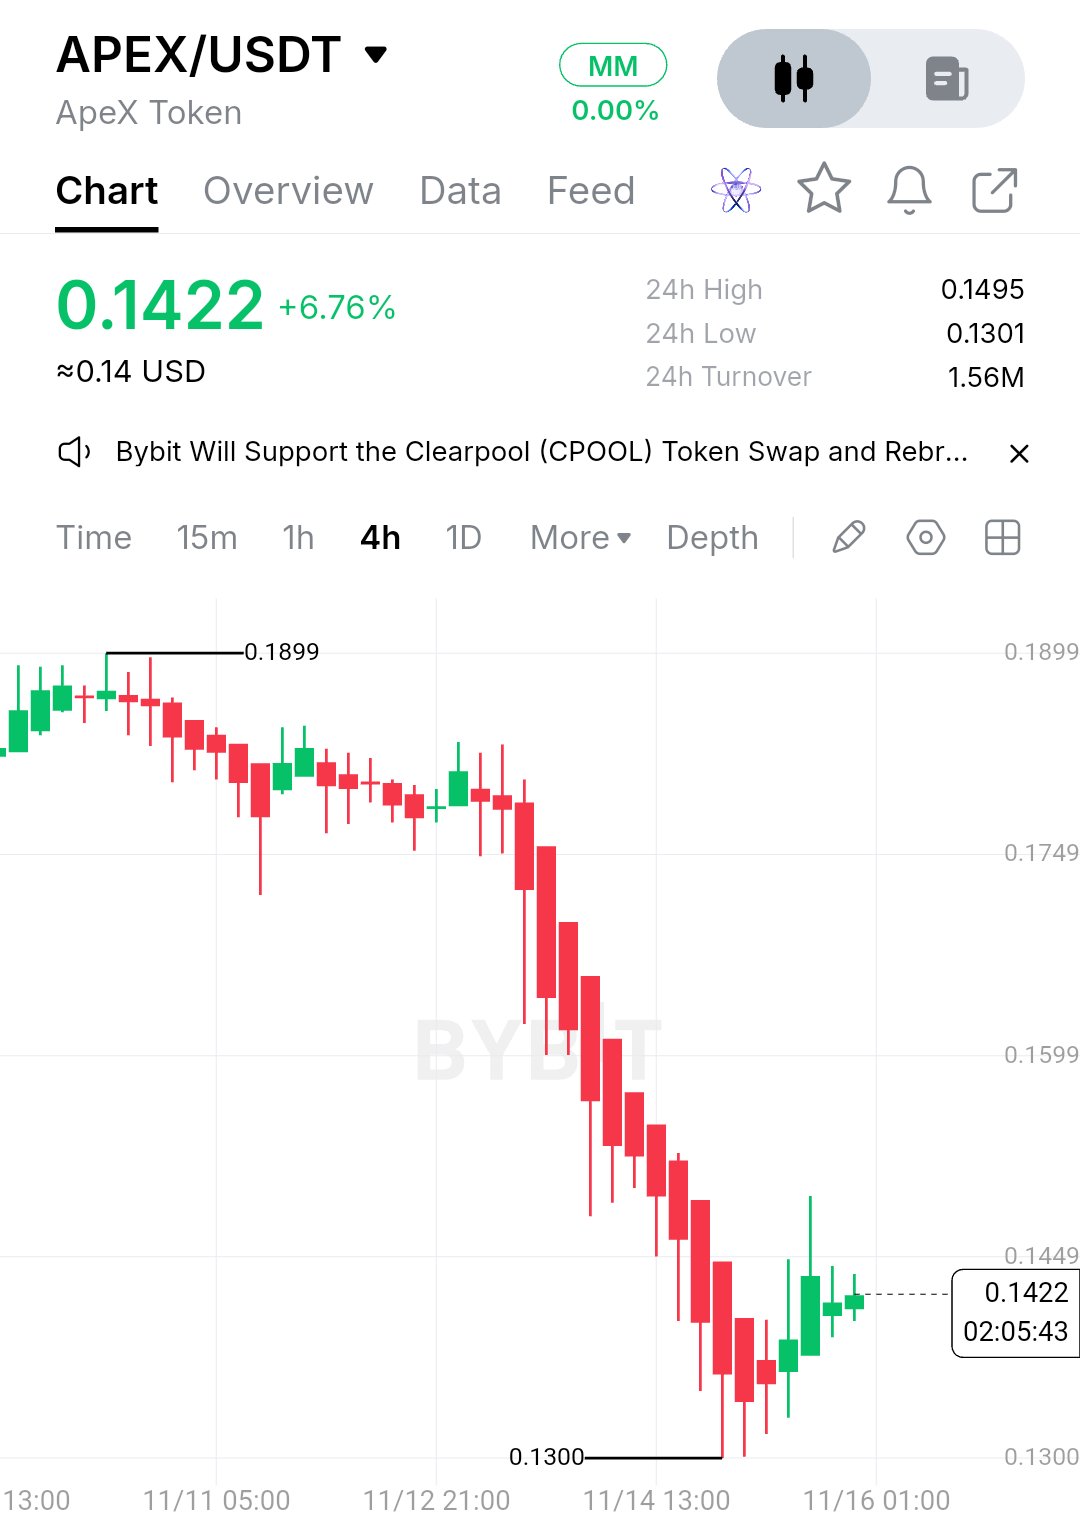
$APEXUSDT is an Ethereum-based token, not a standalone blockchain, and that distinction matters when looking at its economics. There is no native APEX network transaction count, median transaction size, miner fee revenue or hashrate figure to compare against block rewards. So the payments usage is not the right way to measure this asset. APEX is tied to ApeX Protocol, a decentralized derivatives trading ecosystem. APEX has staking, governance and protocol incentive utility, and that is the point. Token holders can earn APEX rewards, but current validator revenue, staking yield and fee-to-reward ratios are not independently established by the available data. There is no APEX mining halving or native block reward reduction to price in. I don't think that's a design flaw. When someone quotes the transaction count, the number that matters for this token is different: actual protocol activity, fee generation and whether that activity creates sustainable demand for APEX. The latest available market data shows APEX around $0.1422, up roughly 6.8% in 24 hours but still down 22.6% over seven days. The 4H chart shows a sharp selloff from the $0.18 area toward $0.1300, followed by a recovery. Underneath is ApeX Omni's expansion into perpetual markets, including crypto, US stocks and prediction markets. ApeX was also reported to have recorded $11.661 billion in 30-day trading volume in the October 22 DEX market comparison. That explains the attention, not a guaranteed token-price catalyst. No directional call from the middle of a box after a move this size. Levels instead: Above $0.1495: a daily close over it turns the recent ceiling into a support test. The next major resistance area is around $0.1599–$0.1749. Below $0.1300: a daily close under it says the recovery is failing. The next downside area needs fresh price discovery. $0.1300–$0.1495: the immediate range, roughly 15% wide. Window: the next several daily closes. APEX needs sustained protocol activity and stronger buying pressure to support a recovery. The breakout case is invalid on acceptance below $0.1300. #IMPACTbyTrade

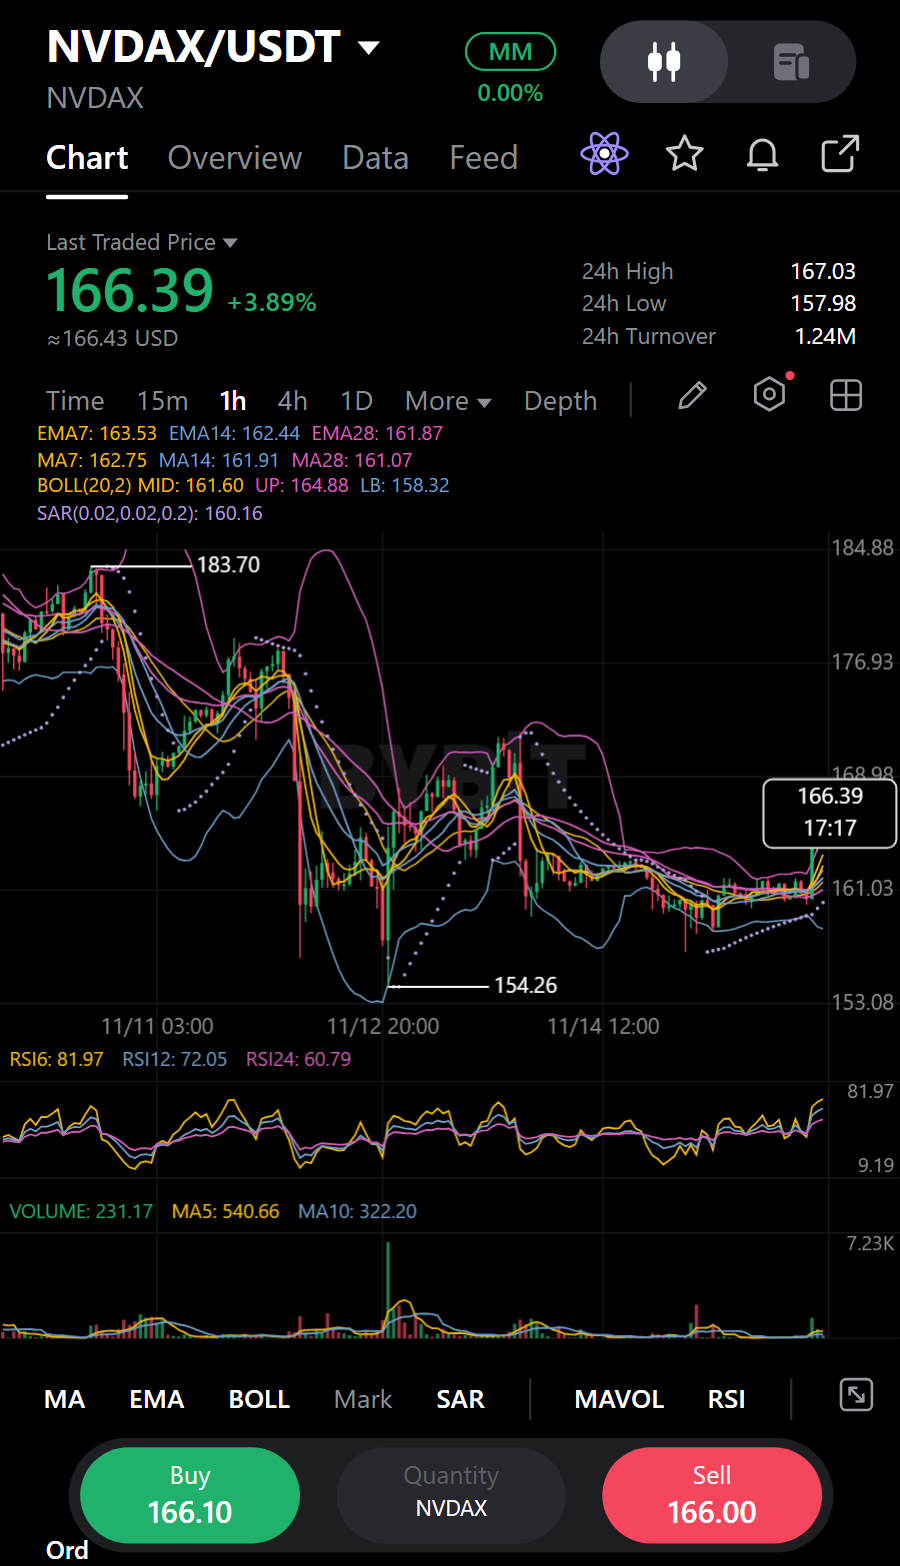
NVDAXUSDT: Los compradores tienen una recuperación que defender
Un marcado repunte verde cada hora ha puesto a $NVDAXUSDT de nuevo por encima de su grupo de medias móviles. La vela roja de la 01:00 cerró en 160.39; luego, la vela de las 02:00 subió de 160.39 a 166.52 antes de cerrar en 164.04. La vela verde de las 03:00 dio continuidad con un cierre en 165.4. Eso se interpreta como compradores entrando con fuerza y manteniendo la presión en lugar de retroceder todo el movimiento. El precio está ahora por encima de la MA7, MA14 y MA28, lo que apoya la tendencia alcista, aunque las medias siguen estando muy juntas en lugar de ampliamente separadas. El movimiento de 24 horas es positivo y el volumen ha aumentado respecto al día anterior, añadiendo participación al impulso. Me gusta ese trasfondo, pero las pequeñas velas anteriores tuvieron poca actividad, así que quiero que la ruptura demuestre que puede sostenerse. Mi configuración de largo es ver que el precio se mantenga o vuelva a probar la Zona de Entrada en 165.8575 - 166.7625; mantengo NVDAX al contado, mientras que la tarjeta de retención nativa lleva los detalles de la posición. Un movimiento por debajo del Stop Loss en 163.595 invalidaría este intento. El TP1 está en 168.5725 y el TP2 en 170.835, con una relación riesgo-recompensa de aproximadamente 0.8 a 1 y 1.7 a 1 desde el medio de la zona, respectivamente. Favorezco a los alcistas mientras el precio se mantenga por encima del nivel de invalidación y los compradores defiendan la prueba de soporte; perder ese nivel cambiaría mi perspectiva, no solo haría que la configuración se vea menos ordenada. El repunte también aumenta el riesgo de volatilidad, así que tendría cuidado con la ejecución en un libro de órdenes poco profundo y no asumiría que el primer impulso seguirá corriendo. Plan de Trading (LARGO / Alcista): • Soporte: 157.98 / 154.26 | Resistencia: 167.03 / 178.7 • Zona de Entrada: 165.8575 - 166.7625 • Stop Loss (SL): 163.595 • Objetivos: TP1 168.5725 | TP2 170.835 ¿Confiarías en esta ruptura de alto volumen o esperarías a una consolidación más clara de la zona de entrada? Solo es mi análisis, no es un consejo.#IMPACTbyTrade


BARD cotiza cerca de $0.1038 después de caer más de un 14% en 24 horas, con un rango de $0.0996–$0.1274. El precio ha vuelto a acercarse a su mínimo de sesión, y los compradores deben defender los $0.100 antes de la liberación de oferta del 18 de noviembre. Panorama del mercado La última instantánea de CoinGlass sitúa la capitalización de mercado cerca de los $41.69 millones y la valoración totalmente diluida alrededor de los $103.8 millones. El suministro circulante se estima en 396.56 millones frente a un máximo fijo de mil millones. El volumen al contado (spot) es de unos $14.06 millones, mientras que el volumen de futuros alcanzó los $109.48 millones, casi 7.8 veces la actividad al contado. Los derivados están impulsando gran parte del movimiento a corto plazo, mientras que la liquidez al contado es menor. Un repunte liderado principalmente por contratos perpetuos puede desvanecerse si los compradores al contado no regresan. BARD también se encuentra aproximadamente un 94% por debajo de su máximo de marzo de 2026 de $1.716, lo que deja la tendencia general gravemente dañada. Derivados y posicionamiento El interés abierto agregado ronda los $19.53 millones, una caída del 25.16% en 24 horas. La tasa de financiación (funding) es profundamente negativa, cerca del -0.2183%, lo que significa que los vendedores en corto pagan a los compradores en largo. Las liquidaciones sumaron cerca de $334,600, incluyendo aproximadamente $251,400 de posiciones en largo. Los flujos al contado fueron negativos en alrededor de $1.2 millones, mientras que los flujos de futuros mostraron salidas de aproximadamente $3.7 millones. La instantánea de perpetuos BARDUSDT de Bybit mostró un precio cerca de $0.1042, un interés abierto (OI) de alrededor de $4.77 millones, una caída del 26.2%, y una tasa de financiación cercana al -0.0937% cada cuatro horas. La tasa de financiación difiere entre plataformas, así que utiliza el feed en vivo de Bybit para ejecutar tus operaciones en lugar de considerar la tasa agregada como la lectura exacta de su contrato. Las posiciones en largo han sido forzadas a salir y el posicionamiento en corto es costoso. Eso puede crear un potencial de "squeeze" (estrangulamiento), pero la caída del OI y los flujos al contado negativos no confirman una acumulación nueva. Estructura técnica La zona de defensa inmediata es $0.1000–$0.0996. CoinGlass también identifica un muro de compra de futuros cerca de $0.1000. Si esto se mantiene y el precio recupera los $0.1070, aparecerá la primera señal de estabilización. Por encima de eso, los $0.1100 y $0.1139 son las siguientes áreas de resistencia. Si $0.0996 se rompe decisivamente, observa los $0.0964, seguidos por $0.0930. Una recuperación rápida por encima de los $0.1000 después de una mecha debilitaría la señal bajista; cierres repetidos por debajo mantendrían a los vendedores en control. Panorama fundamental Lombard está construyendo infraestructura financiera on-chain centrada en Bitcoin. Su activo insignia, LBTC, es un activo de Bitcoin líquido diseñado para permitir que los poseedores accedan a DeFi sin vender BTC. Su objetivo es hacer que Bitcoin sea un colateral productivo a través de integraciones DeFi. LBTC es el activo vinculado a Bitcoin; BARD es el token de gobernanza independiente. BARD no está respaldado por Bitcoin y no representa la propiedad de reservas de BTC. La estrategia de rendimiento de LBTC de Lombard ha evolucionado: la documentación oficial describe una estrategia de "covered call" que genera primas por opciones, en lugar de depender del modelo anterior de staking de Bitcoin. El rendimiento es variable, no garantizado. La tesis depende de la adopción de LBTC, la liquidez y las tarifas del protocolo. El TVL por sí solo no es suficiente: el crecimiento del producto no crea automáticamente demanda para BARD. Utilidad del token y tokenomics BARD es el token de gobernanza de Lombard, con una utilidad destinada a evolucionar junto con el desarrollo del protocolo. Su programa de staking anterior ha finalizado y los reclamos de airdrop han terminado. Tener BARD no genera automáticamente rendimiento ni una parte de los ingresos del protocolo. La asignación oficial es 35% ecosistema, 25% contribuyentes principales, 20% fundación y 20% inversores tempranos. El suministro máximo está fijado en mil millones, con el resto de los tokens programados para desbloquearse gradualmente durante 48 meses después del lanzamiento. Por lo tanto, el momento del suministro importa para una capitalización de mercado relativamente pequeña. Riesgo de desbloqueo próximo Tokenomics.com lista la próxima liberación para el 18 de noviembre: aproximadamente 22.81 millones de BARD, equivalente al 2.3% del suministro total y alrededor del 5.6% de la capitalización de mercado actual según su valoración cotizada. Los receptores incluyen insiders, la comunidad, inversores privados y la fundación. No garantiza ventas, pero crea un exceso de oferta a corto plazo. Escenarios de trading Alcista: defender $0.0996–$0.1000, recuperar $0.1070 y superar los $0.1139 con un mayor volumen al contado. Una tasa de financiación profundamente negativa podría alimentar un movimiento de cobertura de posiciones en corto (short-covering), con $0.1200 como la siguiente referencia. Bajista: perder los $0.0996 y no lograr recuperarlos. Eso expone los $0.0964, luego los $0.0930. Las continuas salidas de capital al contado hacia el desbloqueo podrían socavar cualquier rebote liderado por futuros. Aquí está el mapa de niveles que estoy siguiendo: - Soporte inmediato: $0.1000–$0.0996 - Resistencia: $0.1070, luego $0.1100–$0.1139 - Confirmación alcista: ruptura sostenida por encima de $0.1139 con aumento del volumen al contado - Señal bajista: ruptura por debajo de $0.0996 y fallo en la recuperación Mi postura es defensiva, pero el potencial de un "squeeze" permanece. La financiación negativa es extrema y el OI se ha contraído bruscamente, sin embargo, los flujos al contado siguen siendo débiles y el desbloqueo del 18 de noviembre está cerca. Quiero que los $0.100 se mantengan y que los compradores recuperen los $0.107 antes de considerar una operación de recuperación. ¿Arriesgarías una entrada temprana cerca del soporte, o esperarías hasta después del desbloqueo para confirmar?$BARDUSDT #IMPACTbyTrade

$XRPUSDT ¿Es esto una oportunidad de compra o una señal de advertencia? XRP ha experimentado una presión de venta significativa, por lo que la confirmación del mercado es especialmente importante. Estoy observando: Si XRP puede mantener sus mínimos recientes. Si los compradores regresan con un volumen más fuerte. Si el mercado cripto en general comienza a recuperarse. Intentar atrapar un mercado en caída sin confirmación puede ser arriesgado. Los traders inteligentes observan la acción del precio en lugar de seguir las emociones. Holders de XRP, ¿se mantienen pacientes o esperan una señal de recuperación más fuerte? #IMPACTbyTrade

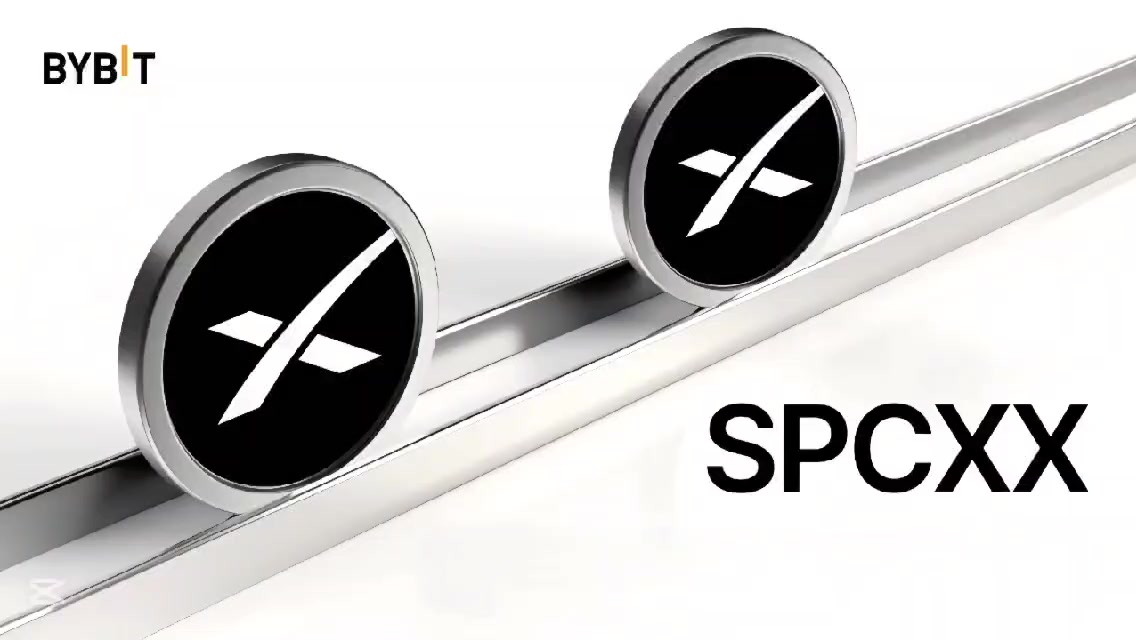
🚀 La gráfica de SpaceX xStock mostraba señales mixtas antes de que llegaran los titulares; algo importante sucedió en la gráfica diaria de $SPCXXUSDT durante la corrección reciente. Después de una caída pronunciada desde el máximo de 167.05, el precio encontró un piso firme en 120.55. La recuperación desde ese mínimo fue agresiva, pero se estancó exactamente donde los indicadores técnicos sugerían que lo haría: en la extensión de Fibonacci 1.0 de 135.35 y el nivel 1.618 en 138.61. La EMA50 se sitúa más arriba, en 144.05, y sigue actuando como techo. La gráfica captó el precio cerca de 139.13, con la vela diaria aún abierta y el RSI recuperándose hacia la zona media de los 50. Pero la verdadera historia está en el mapa de liquidez. El mapa de calor de liquidación de Coinglass para SPCXX muestra dos enormes grupos de apalancamiento justo encima del precio actual. Hay una fuerte concentración de liquidez en 140 y otra banda densa justo debajo en 138; estas son las zonas donde se acumulan las posiciones apalancadas y actúan como imanes para el movimiento del precio. Cuando el precio se acerca a un grupo como este, el mercado a menudo busca esa liquidez, barriendo los stops y forzando liquidaciones antes de decidir una dirección real. Los titulares recientes añadieron contexto a la volatilidad. SpaceX está lidiando con una ola de liberaciones de acciones de insiders, incluida una liberación de 59.1 millones de acciones y una mayor de 319 millones que llegó al mercado recientemente. La compañía también lanzó una misión clasificada de seguridad nacional para la Fuerza Espacial de EE. UU., lo que añade ruido fundamental a la cinta. Pero esto es lo que más me interesa 🤔 El rechazo de la gráfica en la zona de 138-140 y el mapa de calor de liquidación ya contaban la misma historia antes de que los desbloqueos salieran a la luz. Por eso, siempre hay que estudiar la estructura del precio y el posicionamiento juntos; la acción del precio revela dónde los compradores están perdiendo el control, y el mapa de calor revela dónde el mercado es más frágil. Las gráficas no pueden predecir eventos específicos, pero pueden advertirnos cuando el apalancamiento está acumulado de una manera que hace probable un movimiento violento. Perspectiva de Trading de hoy SPCXX está ahora atrapada entre dos fuerzas. El mapa de calor sugiere que si el precio logra superar los 140 y mantenerse por encima, la liquidez superior podría impulsar un 'short squeeze' hacia la EMA50 en 144.05 y la extensión de Fibonacci 2.618 en 143.88. Pero la oportunidad más grande está más abajo 🙂↕️ Si el soporte de 138 falla y el grupo de liquidez inferior del mapa de calor es barrido, veo un camino claro de regreso hacia la zona de 134-135, y finalmente al bloque de demanda principal en 120.55 si la venta se acelera. Ahí es donde me interesaré particularmente en una posible configuración en largo. No planeo comprar simplemente porque el precio llegue a mi caja. Quiero ver una reacción alcista significativa, un cambio en la estructura del mercado y evidencia de que los compradores pueden defender un nuevo mínimo más alto. Solo entonces consideraré posicionarme para una recuperación hacia la región de 153-167, con la posibilidad de un nuevo máximo más alto por encima de esa área si los catalizadores fundamentales se alinean. Gestión de Riesgo ⚡️ Aún no tengo una entrada en largo confirmada. Mi stop-loss y mi relación riesgo-beneficio dependerán de la confirmación alcista real y del precio de entrada. Una ruptura sostenida por debajo de 134.75 sin una recuperación convincente invalidaría mi configuración alcista propuesta, y me haría dar un paso al costado en lugar de forzar una operación. También es importante recordar que SPCXX es un derivado tokenizado, no una acción real de SpaceX. Ofrece exposición al precio 24/7 pero no otorga derechos de accionista ni dividendos, por lo que las entradas deben tener en cuenta la propia liquidez del token y los spreads más amplios que vienen con la incertidumbre macroeconómica. Estoy dispuesto a perderme la primera parte de una recuperación antes que comprometer capital antes de que se cumplan mis condiciones. La paciencia importa más que atrapar el fondo exacto. Actualización rápida de Nvidia 🖥 Mantengo mi postura cautelosa sobre Nvidia $NVDAXUSDT dado el riesgo reciente por los titulares. La acción de Nvidia ha sido altamente volátil, con los titulares sobre la investigación relacionada con el CEO causando una caída inicial del 8.8% a 170.24 antes de que la acción redujera las pérdidas para cotizar alrededor de 179.35. Los compradores minoristas intervinieron agresivamente, con informes de 111 millones de dólares en compras netas en los primeros 30 minutos de la sesión, lo que muestra que todavía hay un fuerte interés en comprar durante las caídas. Soy alcista sobre el potencial de IA a largo plazo de Nvidia, pero no confundiré una historia de negocio prometedora con una entrada de trading confirmada. La acción permanece sobrevendida en algunas métricas y es posible un repunte de alivio, pero el lastre de los titulares significa que la estructura aún es frágil. Por ahora, estoy observando una estructura de precios más sólida antes de tomar una posición nueva. La oportunidad no desaparece solo porque elijo esperar la confirmación 😏 IMPACTbyTrade La salida de Jensen Huang pone a prueba el liderazgo de IA de Nvidia

xmlmusdt
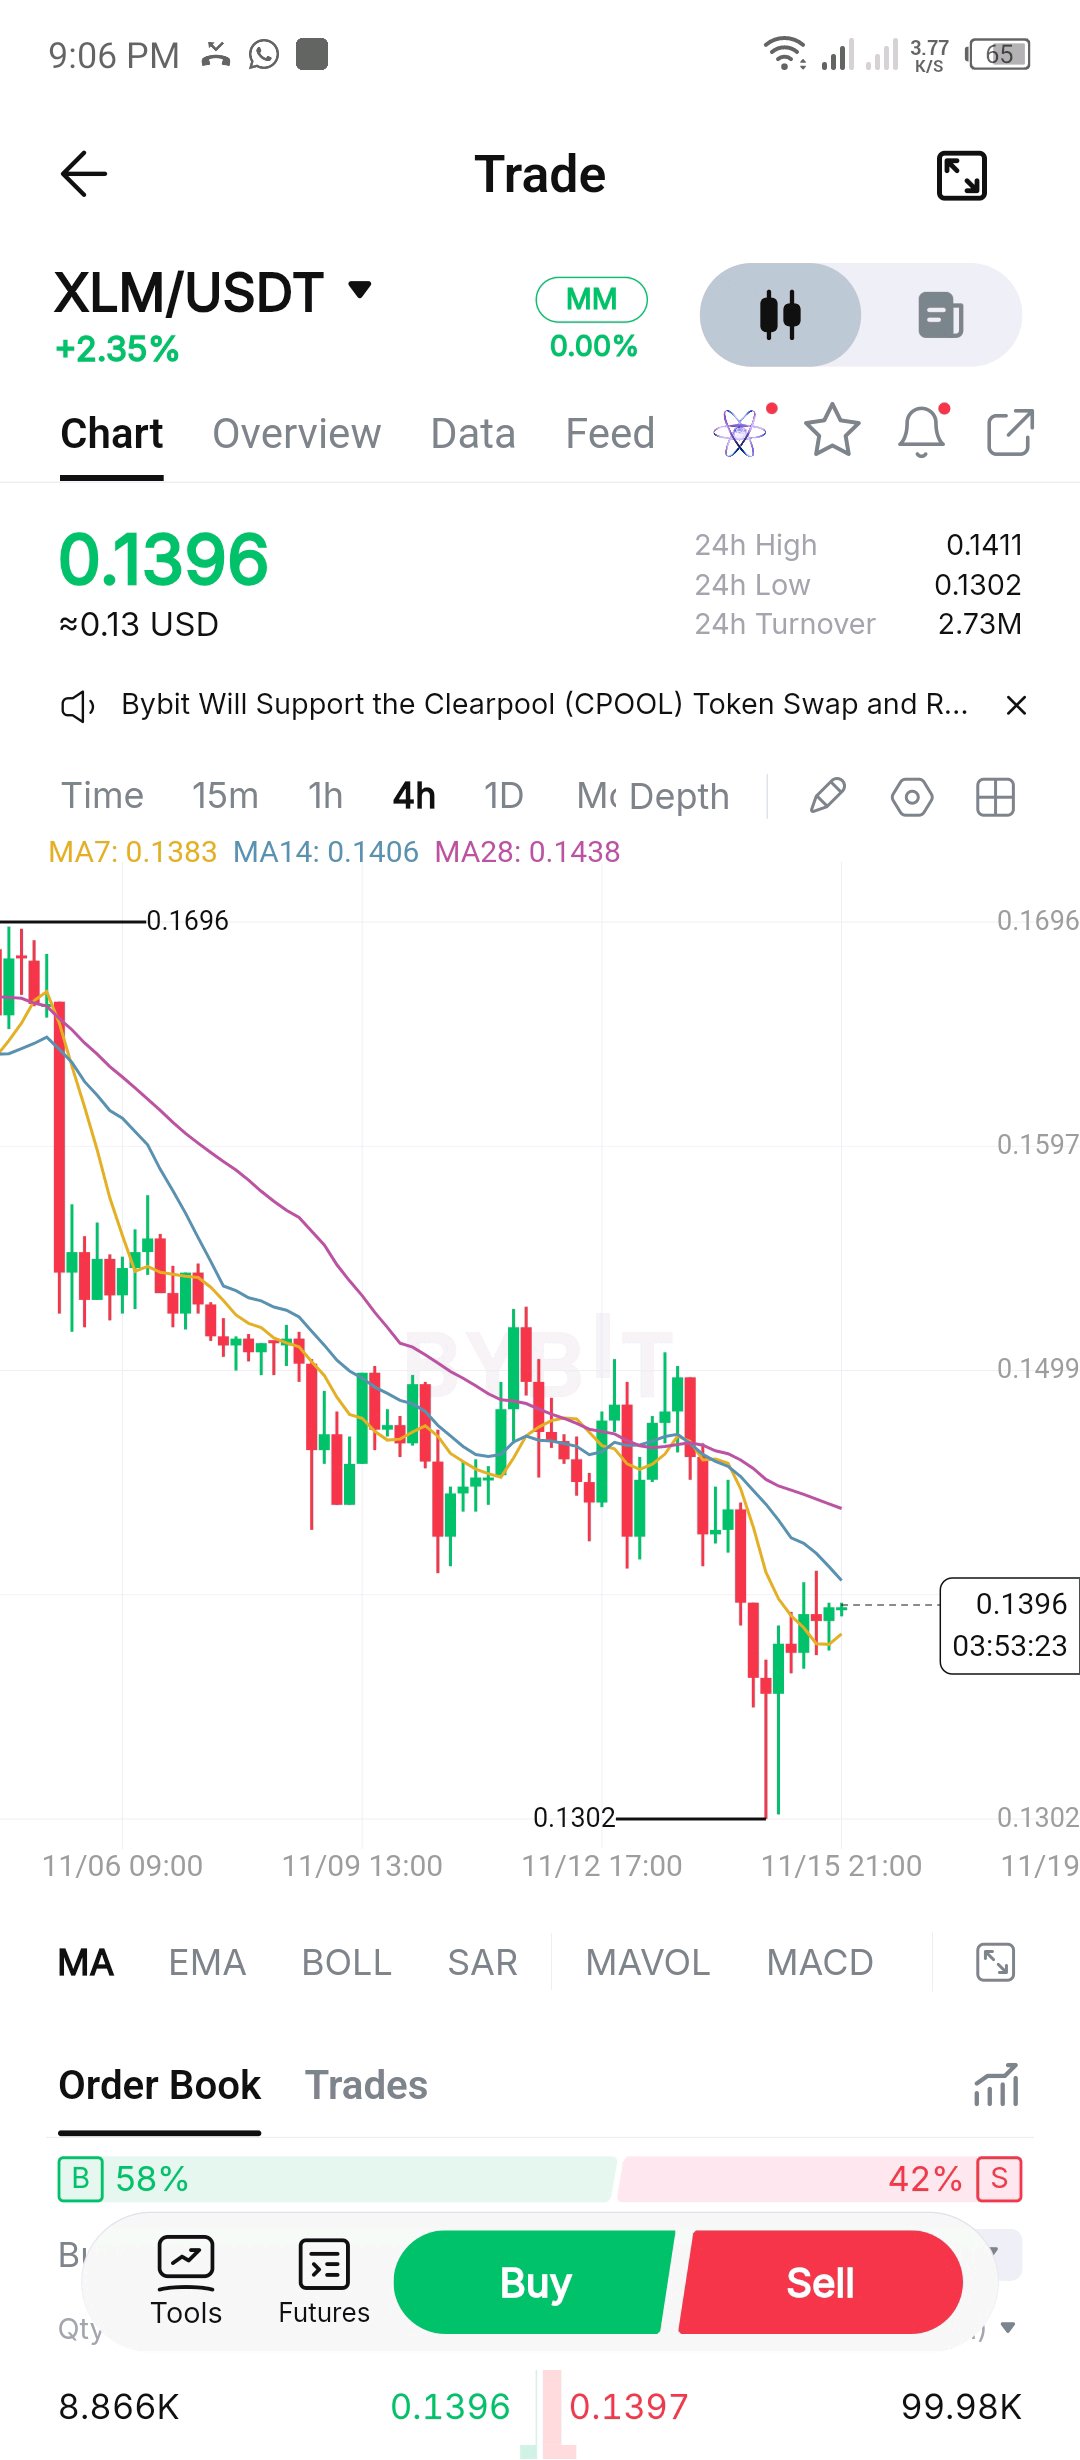
$XLMUSDT $XLMUSDT Technical Analysis Timeframe: 4H Current Price: $0.1396 24H Change: +2.35% 1. Market Trend The overall trend is still BEARISH (DOWN). MA7: 0.1383 MA14: 0.1406 MA28: 0.1438 The price is above MA7 but below MA14 and MA28. This suggests a short-term recovery inside a larger downtrend. 2. Support Levels $0.1380 – Immediate support $0.1350 – Secondary support $0.1302 – Major support 3. Resistance Levels $0.1406 – First resistance $0.1438 – Strong resistance $0.1499 – Major resistance 4. Possible Market Direction Bullish scenario: If XLM breaks and closes a 4H candle above $0.1406, it could move towards $0.1438. Bearish scenario: If price gets rejected around $0.1406, it could fall towards $0.1380 and $0.1350. 5. My Trading Bias SHORT-TERM: Slightly bullish recovery. OVERALL: Bearish. My preference is to wait for confirmation before entering a trade. Avoid rushing into BUY or SELL. A breakout confirmation is important. Verdict: DOWN bias until XLM breaks above $0.1438 convincingly. #IMPACTbyTrade

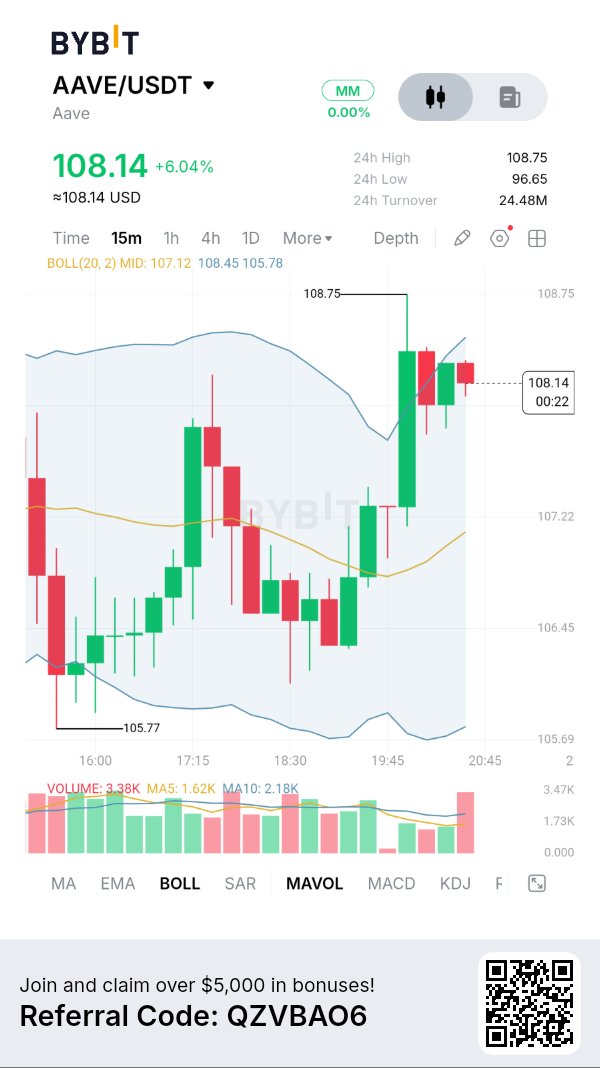
AAVE ($AAVE): Buyers Push Price Above $108 as Recovery Momentum Builds FUNDAMENTAL ANALYSIS Aave remains one of the leading decentralized lending protocols, allowing users to supply assets, earn interest and borrow against crypto collateral. Its latest major development is Aave V4, which introduces a Hub-and-Spoke architecture designed to improve liquidity management, capital efficiency and risk isolation. Aave's October development update reported that V4 deposits surpassed $1.5 billion, while the wider protocol reached $1.1 trillion in cumulative borrowing volume. These milestones reinforce Aave's position in DeFi, although protocol growth does not automatically guarantee token price appreciation. TOKENOMICS AAVE has a maximum supply of 16 million tokens. Its utility includes protocol governance and participation in the Safety Module. The DAO also operates a buyback program funded by protocol revenue, creating another potential source of market demand. However, buybacks, staking and protocol growth must be evaluated alongside circulating supply, liquidity and broader market conditions. CHART + INDICATORS According to the supplied Bybit 15-minute chart: - Current price: $108.14 - 24H change: +6.04% - 24H high: $108.75 - 24H low: $96.65 - 24H turnover: $24.48M - Bollinger midline: $107.12 - Upper band: $108.45 - Lower band: $105.78 - Recent chart low: $105.77 $AAVEUSDT has recovered strongly from $105.77 and reclaimed the Bollinger midline. Price is now testing the upper band around $108.45. Volume stands at 3.38K, above MA5 at 1.62K and MA10 at 2.18K. This suggests stronger participation during the recent recovery. However, price is approaching resistance, so a rejection remains possible. BULLISH SCENARIO A sustained move above $108.45, followed by a successful retest, could open the way toward $108.75. A convincing breakout above $108.75 would strengthen the recovery and potentially attract additional buyers. BEARISH SCENARIO Failure to break the upper Bollinger Band could trigger a pullback toward $107.12. Losing the midline would weaken the immediate bullish structure, while a deeper correction could expose $105.78 again. MY TRADING PLAN I would avoid chasing the current green candles. For a bullish entry, I want a confirmed breakout above $108.45, improving volume and a successful retest. If price gets rejected, I would watch how it reacts around $107.12 before considering another opportunity. Position sizing and stop-loss placement should reflect the volatility of the market. MY INTERPRETATION AAVE is showing encouraging recovery momentum, supported by stronger volume and a move above the Bollinger midline. Its fundamentals remain interesting, particularly with V4 expansion and growing protocol activity. But the immediate technical challenge is whether buyers can overcome $108.45 and establish acceptance above $108.75. Is AAVE preparing for another leg higher, or are buyers approaching a resistance zone where sellers could regain control? #IMPACTbyTrade


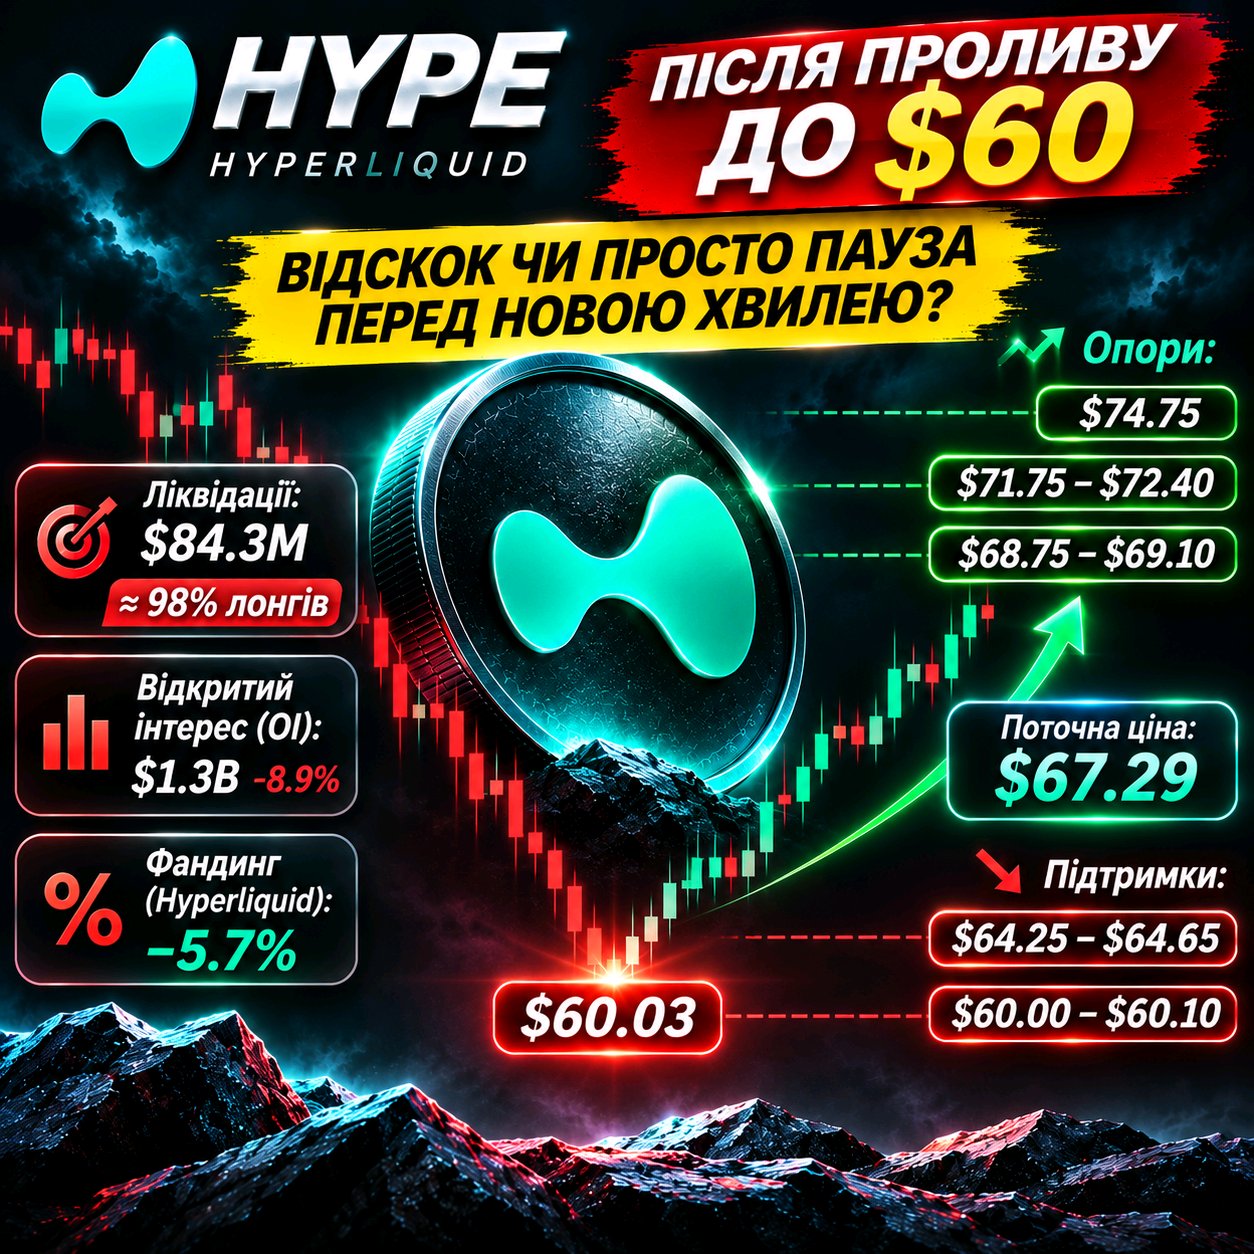
$HYPEUSDT відскочив від $60. Але чи справді продавці втратили контроль? Після різкого падіння HYPE показав сильну реакцію покупців. Ціна піднялася від $60,03 до області $67, але я поки не поспішаю називати це розворотом. Причина моєї обережності — структура ринку. 98% ЛІКВІДАЦІЙ ПРИПАЛО НА LONG За останнім доступним зрізом за добу на HYPE було ліквідовано близько $84,3 млн позицій. Із цієї суми приблизно $82,7 млн припало на LONG. Це масштабне очищення плечових покупців, які намагалися втримати попередній висхідний рух. Водночас відкритий інтерес на Hyperliquid скоротився на 8,9% — до приблизно $1,3 млрд. Для мене це важливий сигнал: частина спекулятивного капіталу вже залишила ринок. FUNDING ПОКАЗУЄ ЦІКАВУ РОЗБІЖНІСТЬ На Hyperliquid ставка фінансування перейшла в негативну область, тоді як на Binance та Bybit вона залишалася позитивною. Така різниця показує, що позиціонування трейдерів на різних біржах суттєво відрізняється. Негативний funding може створювати умови для закриття SHORT, але сам по собі не гарантує зростання. ДЕ ЗАРАЗ ЗОСЕРЕДЖЕНА ЛІКВІДНІСТЬ? Я виділяю такі області: - $68,75–69,10 — найближча перешкода для покупців. - $71,75–72,40 — важлива зона опору та потенційного закриття SHORT. - $74,75 — наступний орієнтир відновлення. - $64,25–64,65 — значний кластер ліквідацій LONG. - $60,00–60,10 — локальне дно останнього розпродажу. Особливо цікава асиметрія ліквідності: за доступною картою ліквідацій нижче ціни зосереджено значно більше потенційних ліквідацій LONG, ніж найближче зверху SHORT. Це означає, що ризик повторного зниження залишається. МОЯ ПОЗИЦІЯ Я бачу перші ознаки стабілізації, але ще не бачу підтвердженого розвороту. Повернення вище $69 із формуванням вищого мінімуму стане першим аргументом на користь покупців. Наступна перевірка — $72,40. Якщо HYPE зможе закріпитися вище цієї області, картина стане значно цікавішою. Якщо ж ціна втратить $64,60, увага знову переміститься до мінімуму $60. Найцікавіше зараз — не сам відскок HYPE, а те, чи зможуть покупці втримати його після того, як ринок уже ліквідував більшість плечових LONG. #IMPACTbyTrade $BTCUSDT
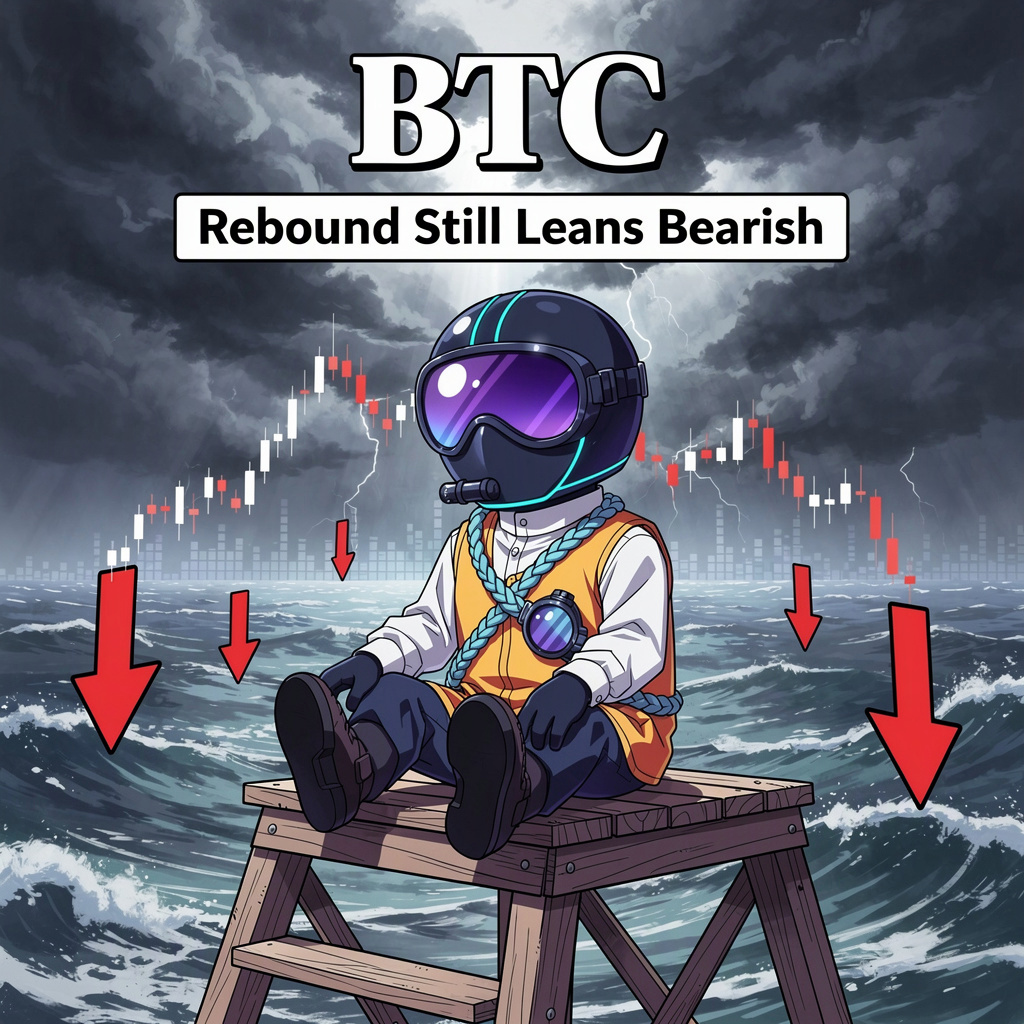
BTCUSDT: El rebote sigue inclinándose a bajista
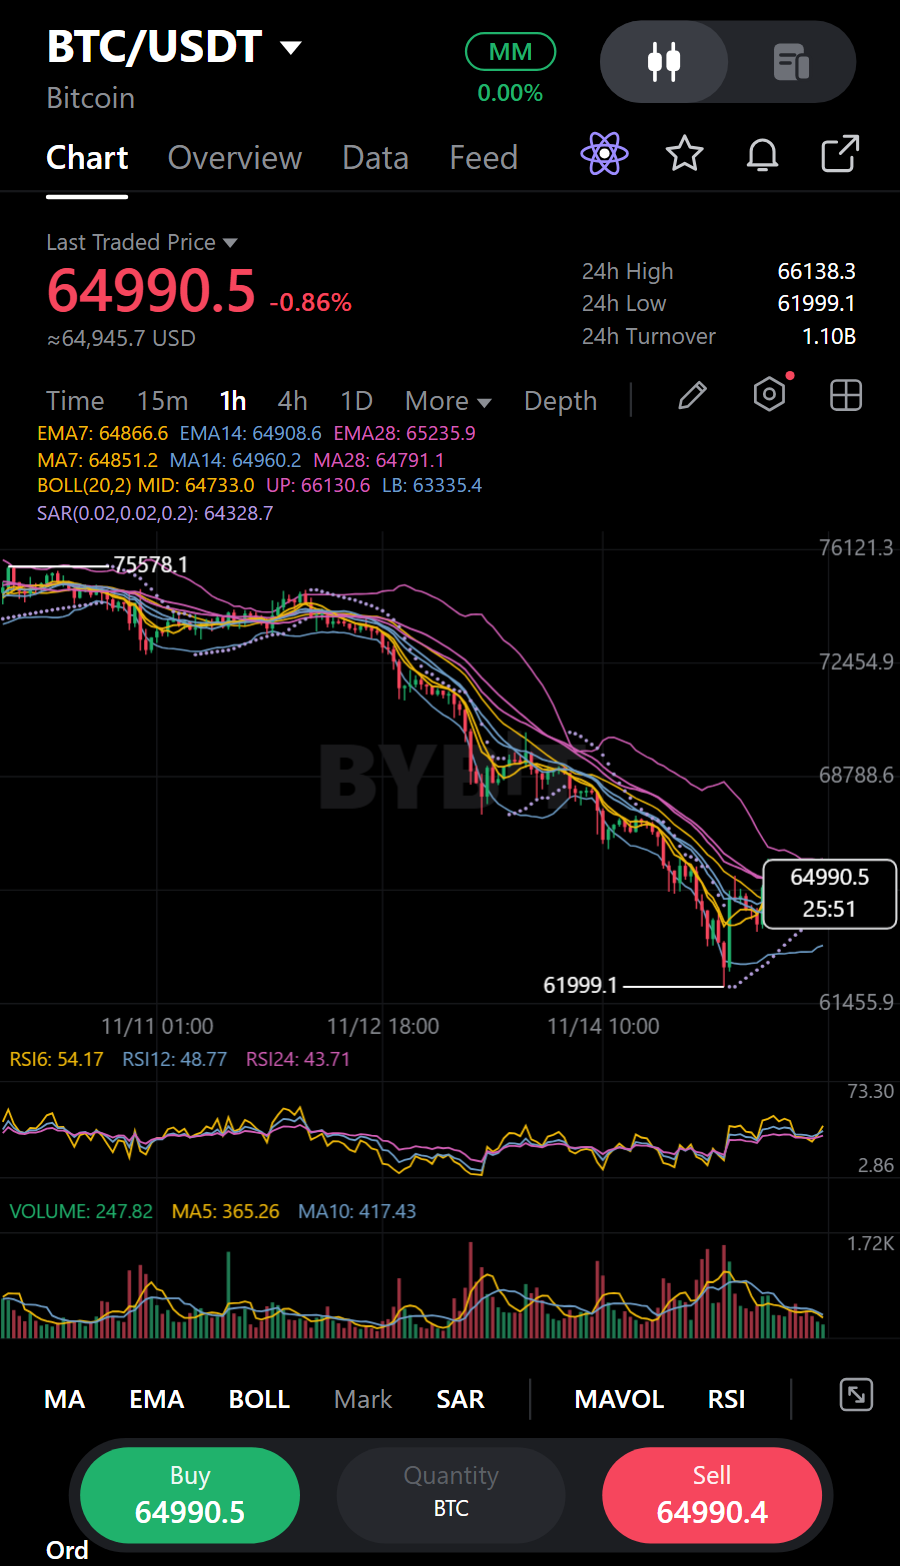
Una pequeña vela verde es la última interrupción, todavía no un cambio: a las 01:00 $BTCUSDT cerró en 64,735.30 con apenas 0.6x el promedio de 12 velas. Antes de eso, la vela roja de las 21:00 cerró en 64,769.40, y los cierres en rojo a las 23:00 y 00:00 llevaron el precio a 64,704.60 y 64,571.60. La secuencia muestra a los vendedores presionando tras el rebote; el último repunte se ve flojo en participación. El último precio negociado es 64,980.60, justo por encima de la MA7 en 64,925.11, la MA14 en 64,926.05 y la MA28 en 64,818.47. Eso les da a los compradores un punto de apoyo, pero estos promedios están muy juntos y no borran la debilidad horaria reciente. Un estratega ha esbozado una posible recuperación de Bitcoin en 2027, atribuyendo la venta masiva al apalancamiento e identificando niveles que apoyarían o invalidarían esa perspectiva. Veo eso como un contrapunto a largo plazo, no como un detonante a corto plazo para BTCUSDT. Para esta configuración, los compradores todavía necesitan demostrar seguimiento alrededor del grupo de medias móviles; una vela verde de bajo volumen aún no ha logrado eso. La evidencia del mercado mantiene mi sesgo inmediato bajista: BTCUSDT ha bajado un 1.03% en la ventana de ticker de 24h, y el volumen negociado es aproximadamente 1.26x el del día anterior. Más actividad junto con un declive no prueba que los vendedores mantendrán el control, pero coincide más con la configuración en corto que con una recuperación confirmada. Me gustaría ver que las velas horarias se construyan por encima de los promedios antes de cambiar esa lectura. Para una posición en corto (short), vigilaría el rango de 64,773.64 - 65,187.56 buscando un estancamiento en lugar de perseguir la debilidad. La idea queda invalidada por encima del Stop Loss de 66,222.36. Desde el punto medio de la Zona de Entrada, el TP1 en 63,945.80 ofrece aproximadamente una relación de 0.8 a 1, y el TP2 en 62,911.00 ofrece aproximadamente 1.7 a 1. El primer objetivo ofrece un margen limitado en relación con el riesgo, así que sería selectivo; los cambios rápidos y las mechas horarias aún pueden barrer una entrada o un stop antes de que la dirección sea clara. Plan de Trading (SHORT / Bajista): • Soporte: 61,999.10 / 61,999.10 | Resistencia: 66,138.30 / 74,822.90 • Zona de Entrada: 64,773.64 - 65,187.56 • Stop Loss (SL): 66,222.36 • Objetivos: TP1 63,945.80 | TP2 62,911.00 Cuando el precio recupera brevemente las medias móviles con poco volumen, ¿qué te convencería de que el rebote es real? Solo mi lectura, no es un consejo.#IMPACTbyTrade

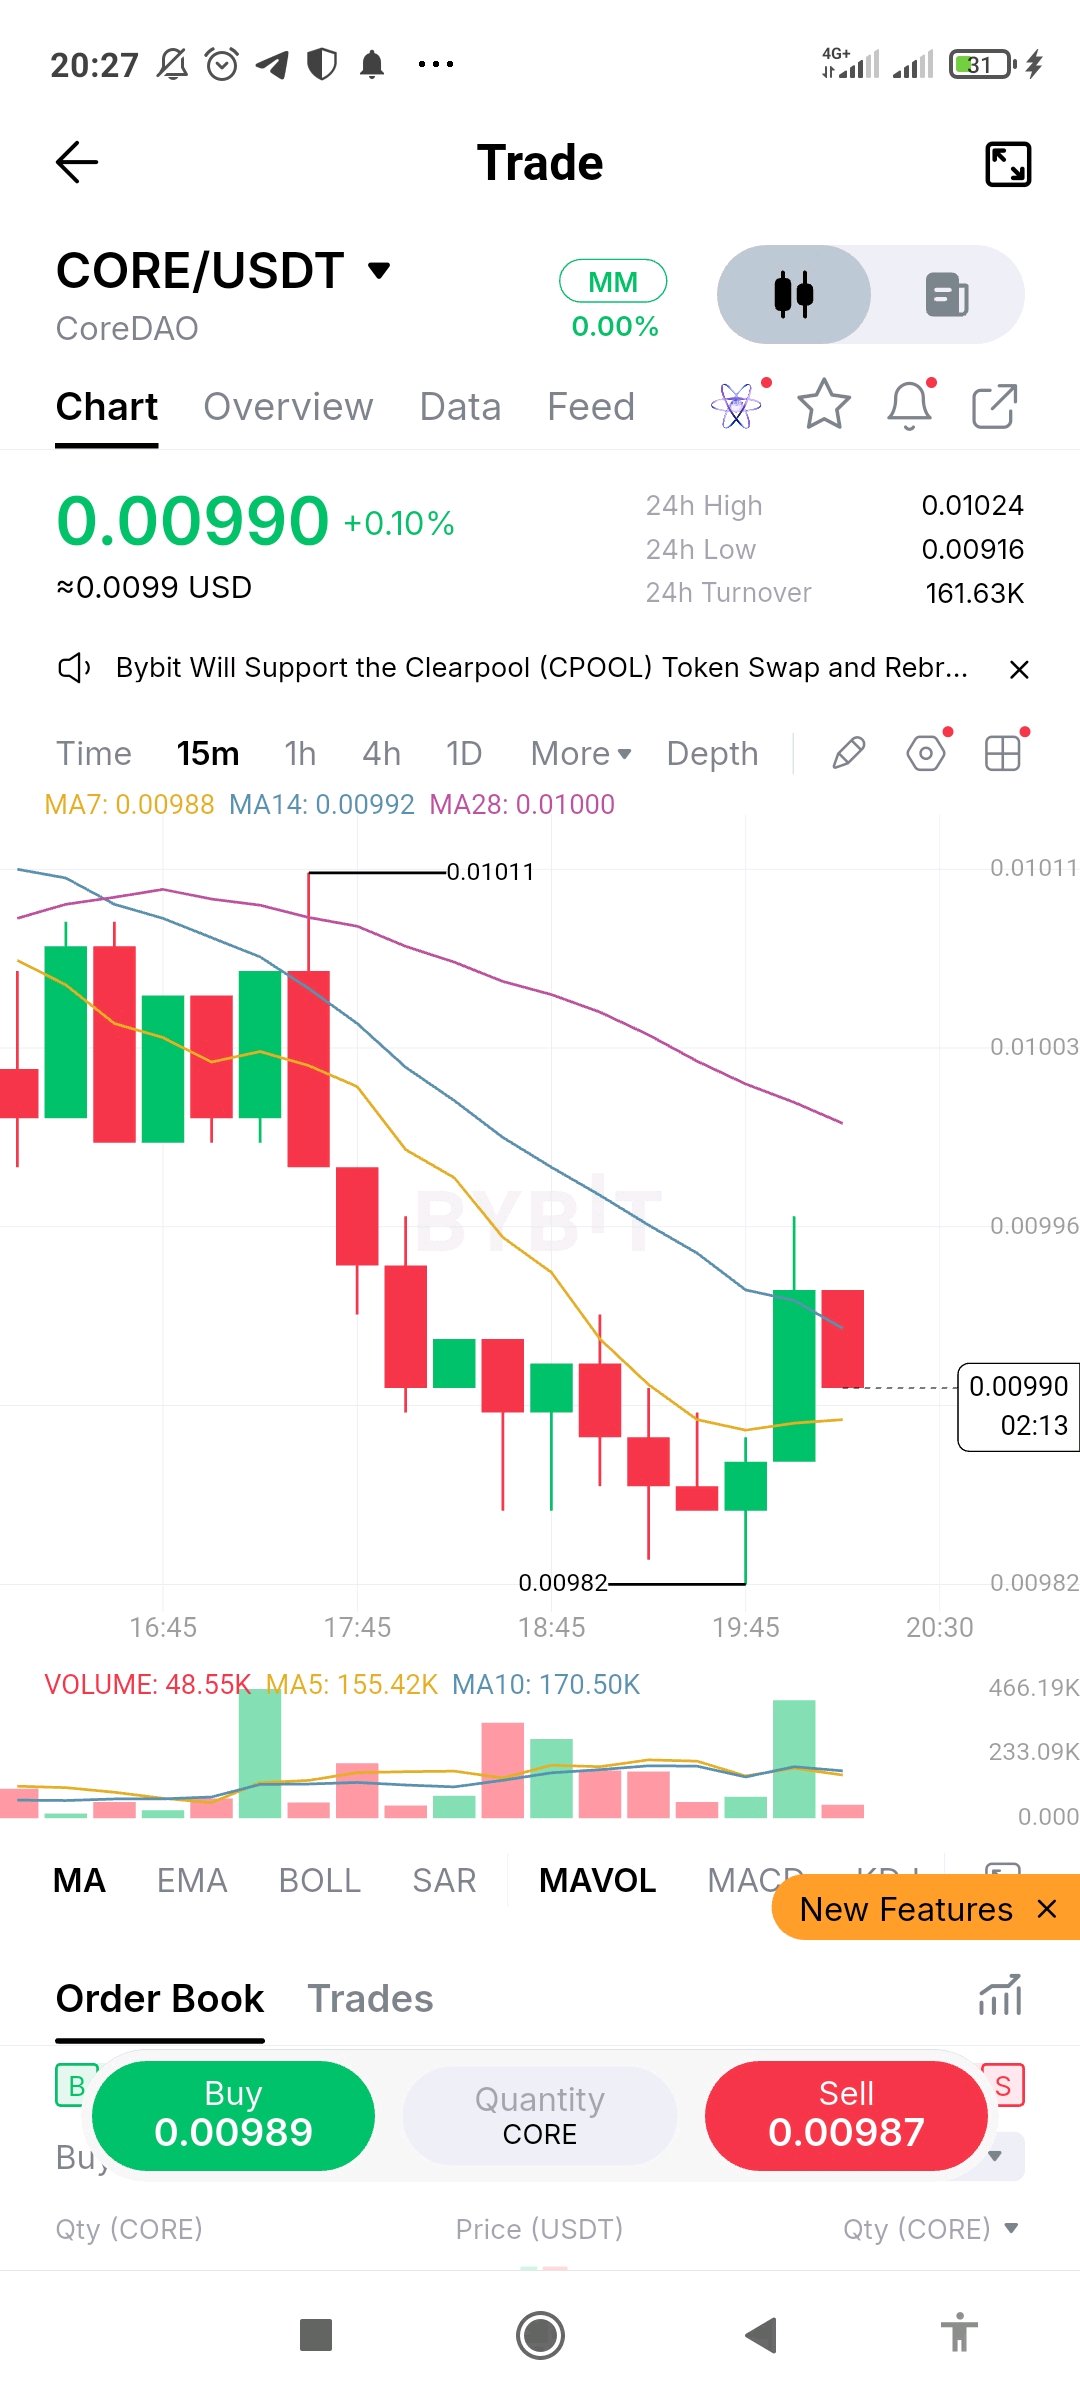
$COREUSDT está en 0.00990 en la gráfica de 15m, arriba solo un 0.1% en el día, pero la tendencia a corto plazo es a la baja. El precio se deslizó desde el área de 0.01011 hasta un mínimo de 0.00982, rebotó con una vela verde fuerte, luego imprimió una vela roja justo debajo de los promedios móviles que caen. MA7 (0.00988), MA14 (0.00992) y MA28 (0.01000) están apilados en orden bajista y con pendiente negativa. El mínimo de 0.00982 es el nivel a vigilar. Una ruptura por debajo mostraría que los vendedores siguen teniendo el control, mientras que un cierre por encima de la MA14 cerca de 0.00992 sería la primera señal de que el rebote tiene fuerza. El volumen subió en la vela del rebote pero se desvaneció en la vela roja posterior, así que los compradores aún no le han dado seguimiento. Nada aquí está confirmado. Lección: un porcentaje diario plano puede esconder una gráfica que sigue marcando máximos más bajos. Una sola vela verde dentro de una tendencia bajista es un intento de rebote, no una reversión, así que espera a un mínimo más alto y mantén tu posición pequeña. #IMPACTbyTrade $COREUSDT $BTCUSDT

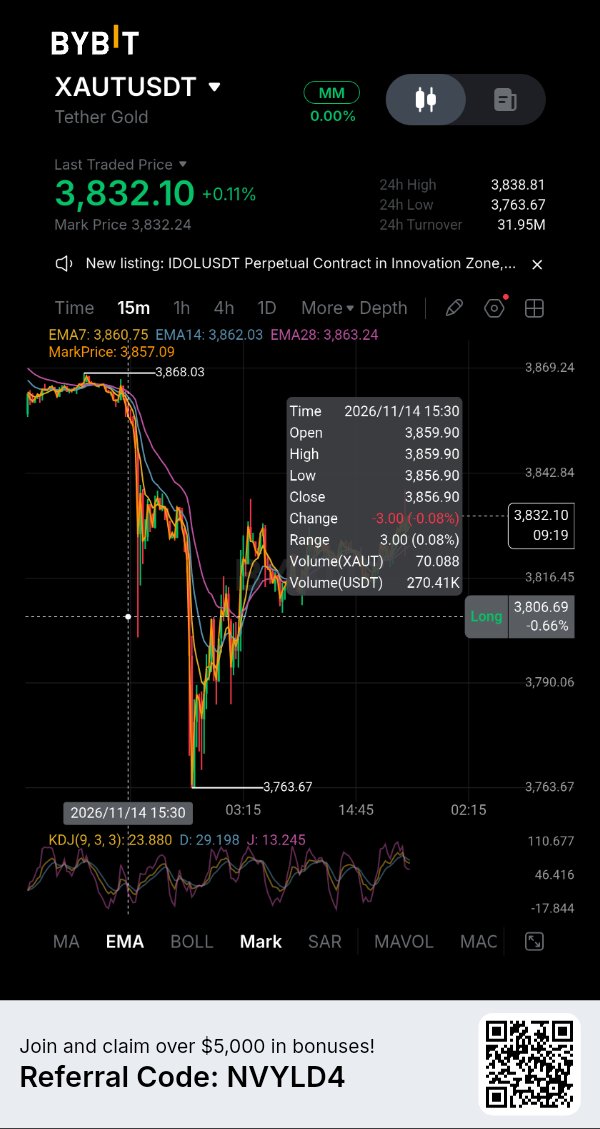
XAUT: La apuesta del oro como activo refugio está bajo presión
Tether Gold enfrenta una prueba mientras los inversionistas reevalúan las tasas de interés de EE. UU. El oro al contado cerró el viernes cerca de los $3,880 por onza tras caer alrededor de un 4.5% en la semana, su mayor descenso semanal desde principios de junio. Una breve recuperación tras una inflación al productor más moderada hizo poco por revertir la venta masiva del 3% del jueves. La presión proviene de la política monetaria. Los detalles de la inflación al consumidor y los precios al productor de EE. UU. han mantenido vivas las expectativas de alza de tasas, mientras que el rendimiento del Tesoro a 10 años ha superado el 5%. El funcionario de la Fed, Jeff Schmid, dijo el 15 de noviembre que la inflación se mantiene por encima del objetivo del 2%. Los rendimientos más altos aumentan el costo de oportunidad de mantener oro, que no paga intereses. Eso ayuda a explicar por qué la incertidumbre geopolítica no ha protegido al lingote de la venta. El perpetuo $XAUTUSDT de Bybit cotizaba cerca de los $3,823, una baja de aproximadamente el 1% en 24 horas según la última instantánea de datos de intercambio. Su volumen de contrato en 24 horas fue de alrededor de $43.36 millones, con una tasa de financiación del +0.0012% por período de cuatro horas. Una tasa de financiación positiva significa que los compradores (longs) están pagando a los vendedores (shorts), pero la tasa es modesta y no prueba una sobreexposición de posiciones largas. Los precios de los perpetuos también pueden diferir de las referencias del oro al contado debido a los horarios de negociación, la liquidez y la fijación de precios de los contratos. Hay un avance separado que vale la pena observar más allá del gráfico. El informe de reservas de Tether del 30 de septiembre indica que 827,417.63 XAUT estaban en circulación, respaldados por el mismo número de onzas troy finas bajo custodia. Eso representaba unas 25.7 toneladas de oro. El 11 de noviembre, Anchorage anunció servicios de custodia, trading y colateral institucional para clientes elegibles que posean XAUT. La expansión podría mejorar el acceso institucional, pero no hace que todos los poseedores de tokens sean elegibles para el canje directo con el emisor ni garantiza liquidez inmediata en efectivo. Por ahora, la dirección de XAUT sigue ligada a la respuesta del oro ante los rendimientos y el dólar. Un movimiento sostenido de vuelta por encima de los $3,900 en el lingote ayudaría a estabilizar el sentimiento; otra ruptura a la baja mantendría la presión sobre el token. La historia del acceso institucional está desarrollándose, pero no ha cancelado el riesgo macro. Preguntas clave: 1. ¿Puede el oro recuperar los $3,900 mientras los rendimientos del Tesoro se mantienen elevados? 2. ¿El acceso institucional se traducirá en una liquidez de XAUT más profunda y confiable? 3. ¿Es la caída actual una corrección o el comienzo de una revalorización más larga del oro? $IMPACTbyTrade


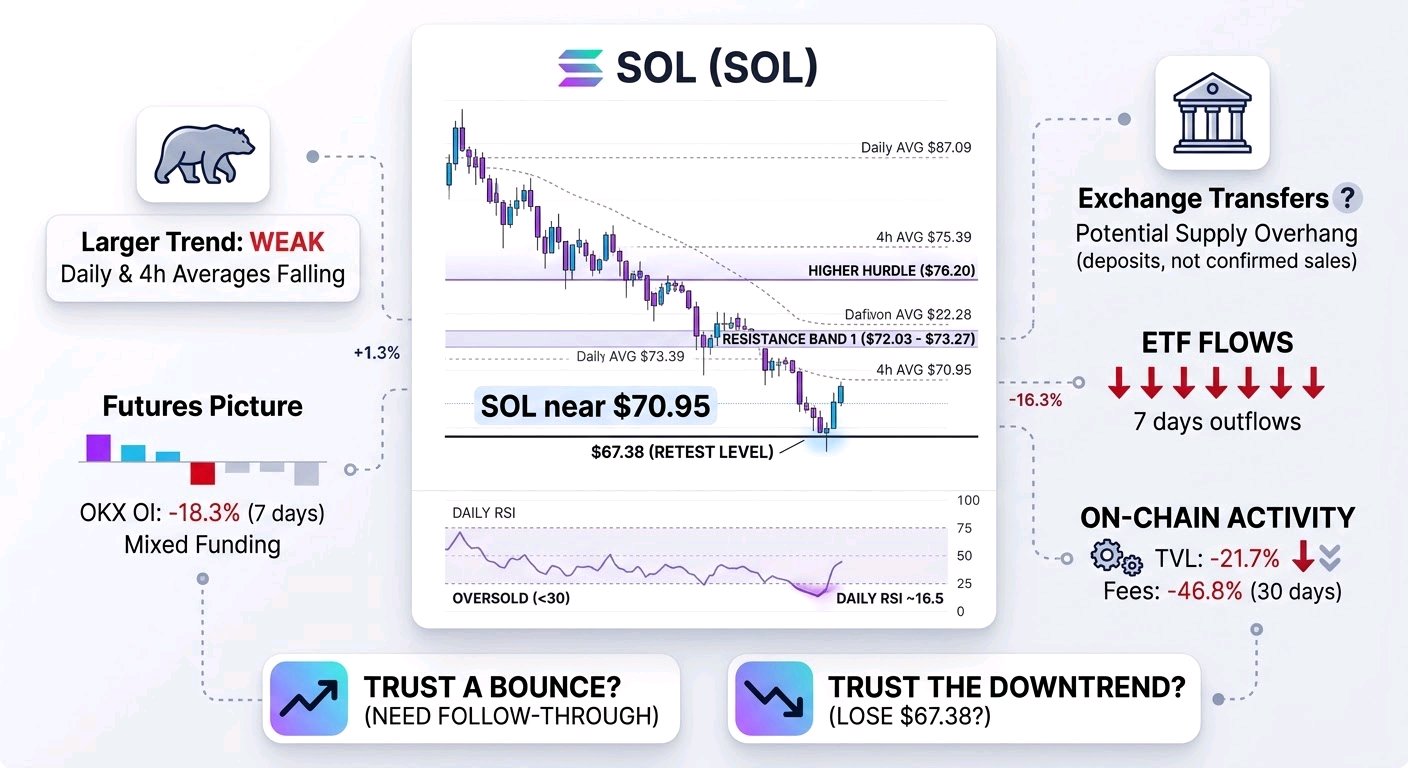
$SOLUSDT se encuentra cerca de los $70.95 después de perder un 20.3% en 7 días. Tocó los $67.38, su punto más bajo desde finales de junio, antes de rebotar. Ese mínimo es la prueba más clara en el corto plazo: si se mantiene, una base a corto plazo sigue siendo posible; si se pierde, el rebote no ha logrado detener la secuencia de precios a la baja. Ninguno de los dos resultados está confirmado todavía. La tendencia más amplia sigue siendo claramente débil. SOL está por debajo de sus promedios móviles de 4 horas en descenso, cerca de los $75.39 y $80.85, y de sus promedios diarios cerca de los $87.09 y $95.48. El RSI diario está alrededor de 16.5, una lectura inusualmente extendida. Esto hace que un repunte de alivio sea plausible, pero no nos dice que la venta haya terminado. En la gráfica de 1 hora, a SOL le ha costado mantenerse por encima de los $72.03–$73.27, la primera banda de resistencia formada por máximos recientes. Un movimiento a través de esa zona seguido de una nueva prueba exitosa sería más convincente que un pico breve. Los $76.20 son un obstáculo mayor; recuperarlos mejoraría la estructura a corto plazo, aunque no borraría la tendencia bajista más amplia. ¿Qué me haría confiar en un rebote? Un seguimiento, no solo una lectura de sobreventa. Las últimas velas muestran un rebote desde los $67.38, pero el precio no se ha consolidado por encima de la resistencia cercana. Los datos disponibles aquí no incluyen gráficas de 15 minutos fiables, MACD, volumen desglosado por vela, profundidad del libro de órdenes o mapas de calor de liquidaciones. Por lo tanto, no podemos verificar si el rebote tuvo una fuerte compra al contado detrás, identificar grupos de liquidación precisos o afirmar que un nivel en particular desencadenará compras o ventas forzadas. Los futuros ofrecen un panorama mixto. El financiamiento es ligeramente negativo en las principales plataformas, por lo que los cortos están pagando a los largos; el interés abierto en OKX ha caído un 18.3% en 7 días. Eso sugiere que se ha retirado algo de apalancamiento del mercado y deja espacio para la cobertura de cortos si el precio sube. Pero el posicionamiento no es unilateral: las cuentas de OKX se inclinan hacia posiciones largas, mientras que las de los principales traders se inclinan hacia posiciones cortas. Un interés abierto en descenso puede reflejar un desapalancamiento, no necesariamente una acumulación o un squeeze inminente. La actividad al contado es grande (unos $5.45 mil millones en 24 horas en 63 plataformas), pero el total por sí solo no puede decirnos si los compradores absorbieron la oferta o si los vendedores dominaron la operación. Las transferencias reportadas en los exchanges merecen atención, pero no una conclusión dramática. Los informes de noticias describen grandes depósitos de SOL, incluidos movimientos vinculados a Forward Industries; la empresa disputó la atribución de propiedad de una de las transferencias reportadas. Los movimientos en la cadena pueden ser reales, pero un depósito no prueba una venta. Eso hace que esto sea una posible sobreoferta, no una venta confirmada. El mercado en general también está bajo presión: la capitalización total del mercado cripto cayó un 5.2% en 24 horas, y el miedo está en 10, una lectura extrema. ¿Es la debilidad de SOL principalmente su propia oferta y actividad, o está siendo amplificada por un movimiento de aversión al riesgo en todo el mercado? Ambas cosas pueden ser ciertas. Hay aspectos positivos a largo plazo, pero no resuelven la operación a corto plazo. Los planes de tokenización de DTCC incluyen a Solana, y la red está organizando su conferencia Breakpoint. Esos desarrollos pueden importar con el tiempo; todavía no han producido una reversión de precio visible. Mientras tanto, las cifras más inmediatas son débiles: los flujos de los ETF muestran 7 días consecutivos de salidas, con un total de $32 millones en 5 días y $120 millones en 20 días. En 30 días, el valor bloqueado cayó un 21.7%, la oferta de stablecoins un 7.1% y las comisiones un 46.8%. Estas son señales verificadas de flujos y actividad más débiles, pero no podemos asumir que predicen las próximas sesiones. Mi lectura es deliberadamente condicional. Por encima de los $67.38, un rebote de alivio sigue siendo creíble, especialmente si el precio recupera los $72.03–$73.27 con una participación sostenida. Por debajo de ese mínimo, la interpretación bajista gana peso. ¿Qué cambiaría el equilibrio? Que la demanda al contado resista una nueva prueba, que el interés abierto se reconstruya a medida que el precio sube y que las salidas de los ETF disminuyan, lo que haría que el rebote fuera más sustancial. Otro rechazo en la resistencia, salidas continuas o una ruptura argumentarían que las condiciones de sobreventa no han detenido la tendencia bajista. Por ahora, ninguno de los dos lados tiene la confirmación que necesita.#IMPACTbyTrade
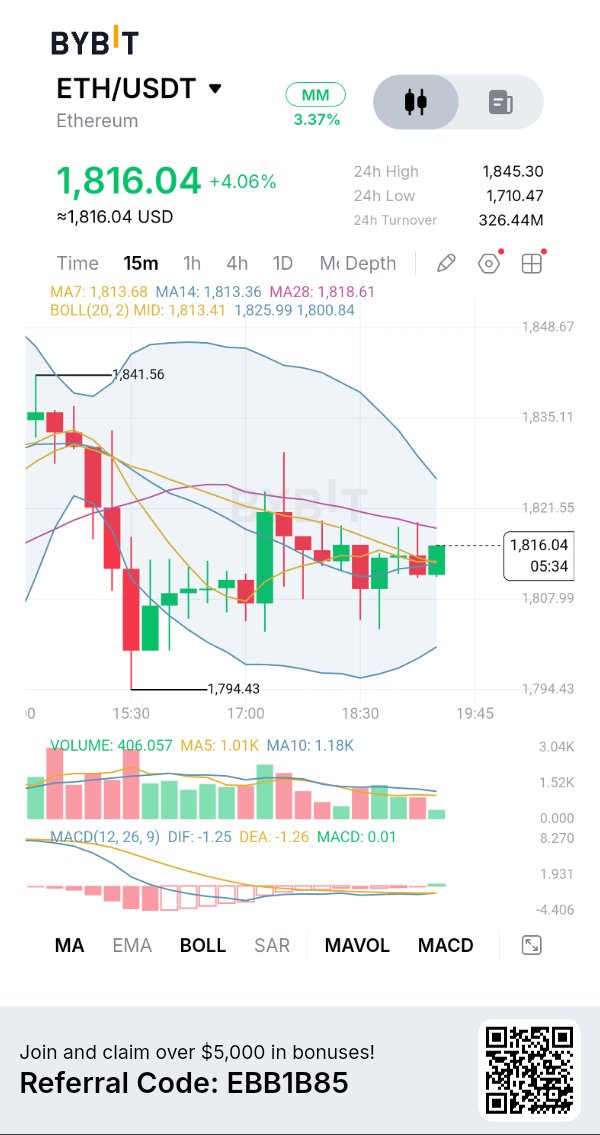
ETH Attempts Recovery Above $1,816: Are Buyers Preparing a Stronger Reversal? Ethereum is showing signs of short-term stabilization after experiencing considerable selling pressure, but the current recovery still needs confirmation. ETH has managed to reclaim the $1,800 region following a decline toward $1,794.43, and buyers are now attempting to build momentum around $1,816. The important question is whether this recovery can develop into a sustainable upward move or whether sellers will use the current bounce as another opportunity to regain control. CHART + TECHNICAL ANALYSIS My Bybit $ETHUSDT 15-minute chart shows ETH trading around $1,816.04, up approximately 4.06%, with a 24-hour high of $1,845.30 and low of $1,710.47. The recent price structure shows a sharp decline followed by a recovery and consolidation. Buyers have defended the $1,794.43 swing low, but price is still approaching several overhead resistance levels. The moving averages provide an interesting picture. MA7 is around $1,813.68, MA14 around $1,813.36 and MA28 around $1,818.61. ETH is trading above the shorter averages but remains below MA28, making $1,818.61 an important immediate resistance reference. The Bollinger Bands show a middle line around $1,813.41, an upper band near $1,825.99 and a lower band around $1,800.84. A sustained move above the middle band could strengthen the recovery, while rejection around the upper band would suggest that buyers still face considerable resistance. MACD + VOLUME ANALYSIS MACD is showing an early improvement, with DIF at -1.25, DEA at -1.26 and histogram around +0.01. The slightly positive histogram suggests that bearish momentum is easing. However, both MACD lines remain below zero, meaning a full bullish momentum reversal has not yet been confirmed. Volume currently stands around 406.057, below MA5 at 1.01K and MA10 at 1.18K. This is an important concern because the recovery is developing without strong participation. I would prefer to see expanding volume during an upward breakout before treating this move as a convincing reversal. BULLISH SCENARIO If ETH maintains support around $1,813–$1,814 and successfully reclaims $1,818.61, I would watch for a continuation toward $1,821.55. A stronger breakout could open the way toward $1,825.99, which aligns with the upper Bollinger Band. My preferred entry approach would be to wait for a decisive 15-minute close above resistance, followed by a successful retest with improving volume. A sustained breakdown below $1,807.99 would weaken this immediate bullish setup. MY TRADING PLAN I wouldn't chase the current recovery while ETH is trading between support and resistance. For a long position, I want to see buyers reclaim $1,818.61, confirm the breakout and demonstrate stronger volume. For a short position, I would wait for a confirmed breakdown below $1,807.99 and a failed recovery attempt. #IMPACTbyTrade

Hyperliquid was built to pull leveraged trading away from centralized exchanges. So what does it say that its own token now trades on a centralized venue with a 10x leverage tag? That tension is the real fundamental question. HYPE is the native asset of Hyperliquid, a decentralized perpetual futures platform. The screenshot shows it at 66.365, up 1.18%, beside a 67.95M figure that isn't labeled, so I won't assume what it measures. What is visible is enough to ask where the token's value actually comes from. The project's strength is focus. Rather than a general-purpose chain searching for a use case, Hyperliquid is organized around one proven source of demand: leveraged derivatives trading. A token placed at the center of that activity has a clearer economic story than most Layer 1 assets. The hidden contradiction is that token price and protocol economics are different things. A modest daily gain on a leveraged listing reflects speculative flow, not platform revenue. Traders can push HYPE higher elsewhere without a single additional user touching Hyperliquid itself. Price discovery is happening off-platform, so the market may be pricing the narrative faster than fundamentals can confirm it. For monetization, the key issue is whether platform trading activity converts into durable token demand through fees, buybacks or staking utility. None of that is verifiable from this screenshot, and no revenue, supply or unlock data is shown, so I am leaving tokenomics out rather than guessing. The bullish case is a focused product, strong brand recognition and listings on major venues that widen access and liquidity. The bearish case is cyclicality. Perpetual futures volume depends on volatility and appetite for leverage, and when traders step back, both activity and the token's value proposition thin out. The critical risk is competition. Derivatives traders move wherever liquidity and fees are best, and that includes centralized exchanges, which are the very venues Hyperliquid set out to displace. My view: the thesis is credible but concentrated. HYPE is effectively a claim on one business line, and that purity cuts both ways. It deserves serious attention, not blind enthusiasm. The milestone that would change my assessment is evidence that platform revenue translates into measurable, recurring token demand independent of price momentum. Until that link is visible, price strength is a sentiment signal rather than a fundamental one. If a token's price is set mostly on centralized venues, how much of its value does the protocol itself actually control? $HYPEUSDT #IMPACTbyTrade
HYPERLIQUID (HYPE): Is the Market Underestimating Its Potential? Hyperliquid is an interesting project to watch in the decentralized trading sector. My focus is on three factors: 1. Growth in platform activity. 2. User adoption and ecosystem development. 3. Whether HYPE can regain market strength. Long-term potential and short-term price action are two different things. I want to see real ecosystem growth before becoming overly bullish. What matters more to you: HYPE's technology, adoption, or price performance? $HYPEUSDT #IMPACTbyTrade


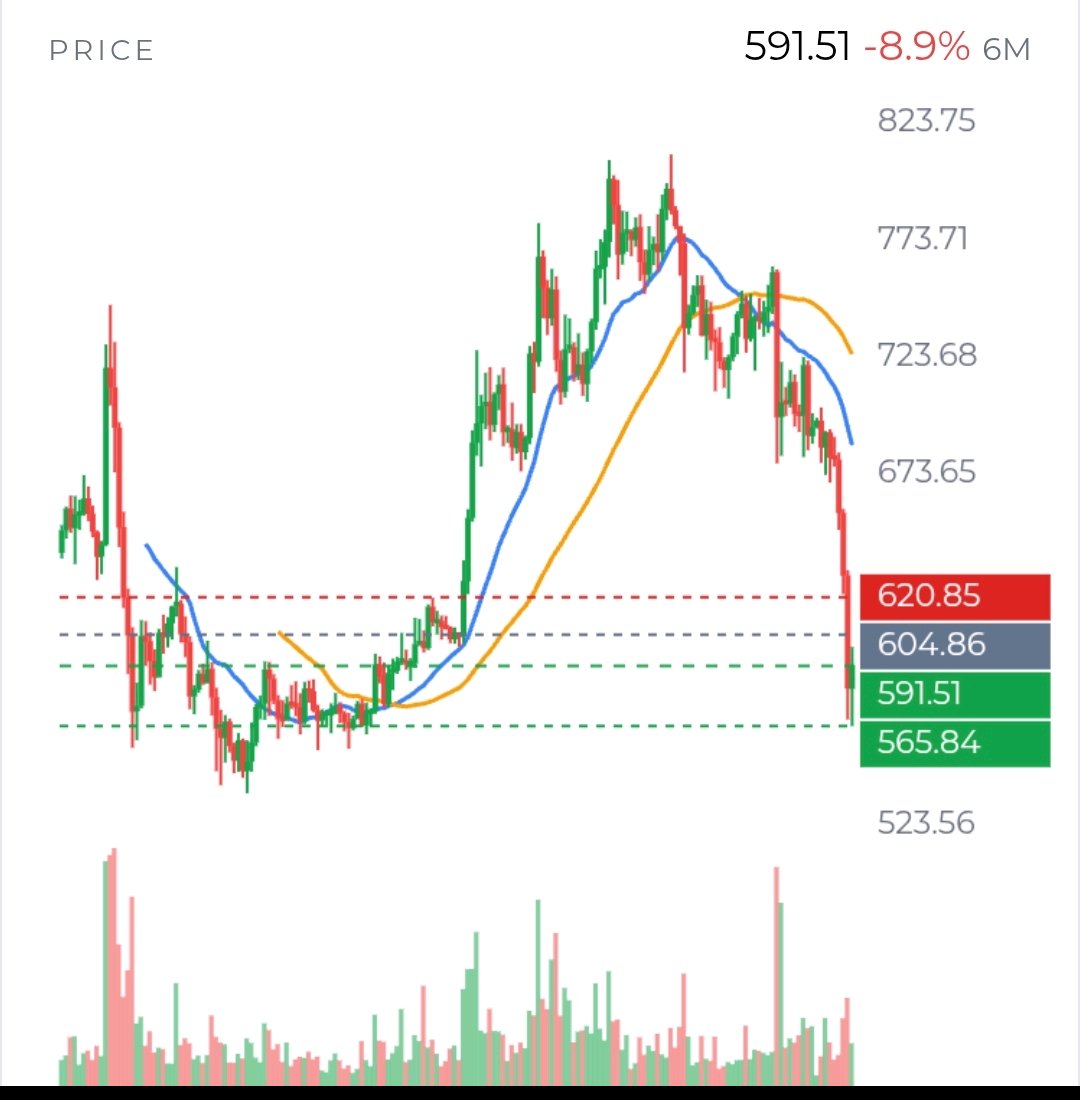
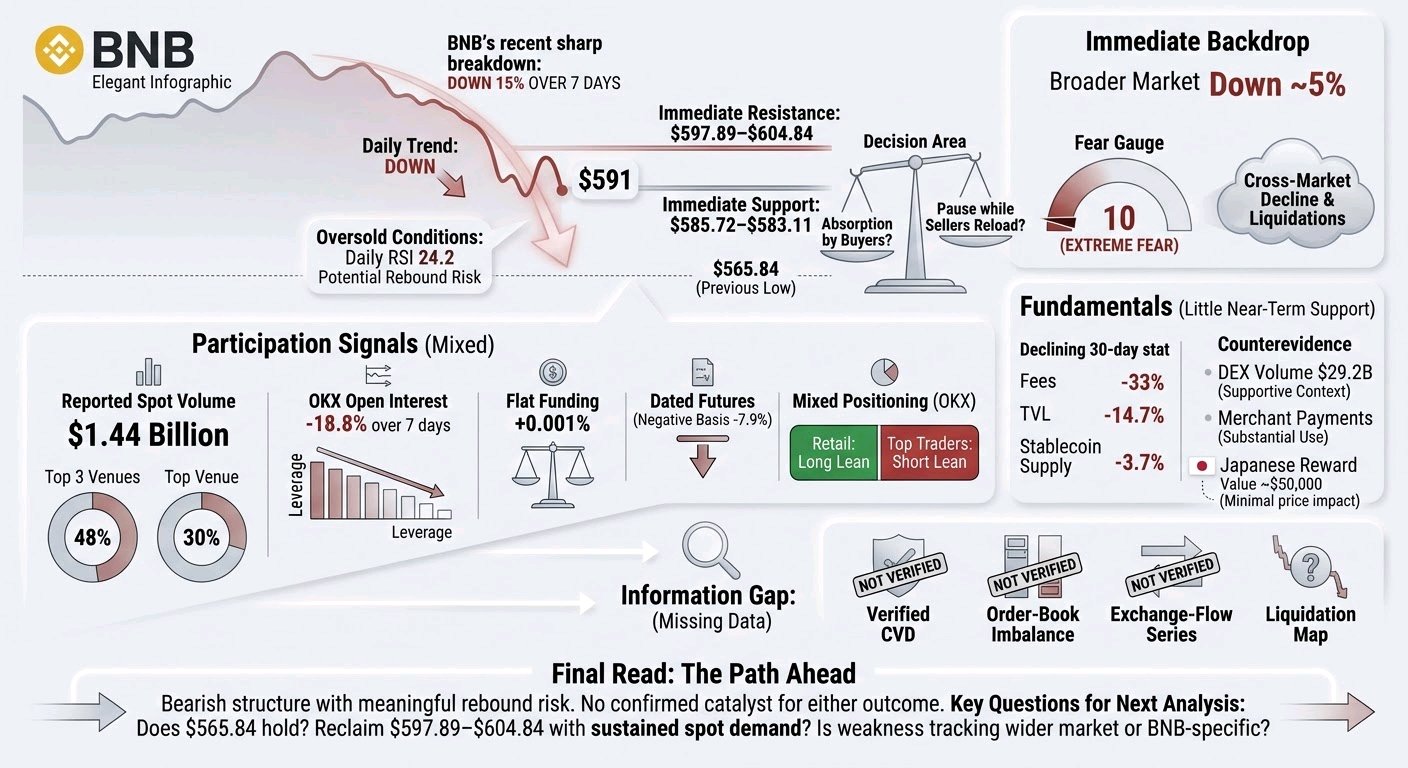
$BNBUSDT is not giving a clean signal yet. The important question is no longer simply “Is it oversold?” It is whether the market can turn a sharp drop into a stable base—or whether each bounce is an opportunity for sellers to exit. The verified picture is weak, but not one-sided. BNB is around $591, down about 15% in 7 days and 18% in 30 days. It remains below its daily EMA20 near $675 and EMA50 near $703; the hourly trend is also down. Daily RSI is 24.2, a level commonly called oversold. That tells us the decline has been forceful. It does not tell us the decline is finished. The levels closest to price matter most. Buyers have a first test at $585.72–$583.11, with the recent low at $565.84 below that. If price breaks the nearby support and cannot reclaim it, the low becomes a plausible retest. But if price holds support, could this be the beginning of a base? I would look for follow-through, not just one green candle. On the upside, $597.89–$604.84 is the first meaningful reclaim area, including the hourly EMA50. BNB has traded above part of that zone, but has not established a sustained hold. $620.60–$620.85 is the next important hurdle. Holding above it would weaken the immediate bearish interpretation; failing there would suggest the rebound has not yet changed the trend. A move all the way back to the daily EMA20 near $675 would require a much larger recovery, not merely a short-covering pop. Participation offers clues, but not a verdict. Reported spot volume is about $1.44 billion across 62 venues, though the top 3 account for 48%, including one venue at 30%. That concentration makes the aggregate number less convincing as evidence of broad buying. Perpetual open interest is reported at $563 million across 4 tracked venues; OKX open interest is down 18.8% over 7 days. That points to leverage coming out on that venue, but does not tell us what happened across the whole market. Funding is nearly flat, at roughly +0.001% per 8 hours. OKX accounts lean long, while top traders’ positioning measures lean short. The disagreement matters: it does not look like a clear, market-wide pile-up of shorts that must be squeezed, or longs that are certain to be liquidated. We also do not have verified liquidation levels, taker-flow data, or order-book evidence. So I would not claim that a particular price is a liquidation magnet or that a squeeze is underway. The wider market is a real part of this story. Total crypto market value is down about 5% in the latest snapshot, and fear is at 10, compared with 28 a week ago. Recent coverage described broad market stress and liquidations. That makes BNB’s fall look partly connected to risk aversion across crypto, not necessarily to a single BNB-specific event. If Bitcoin and the wider market stabilize, BNB could benefit; if they weaken again, local support may be less reliable. BNB Chain’s fundamentals are mixed over different timeframes. Over 30 days, fees fell 33%, TVL fell 14.7%, and stablecoin supply fell 3.7%. Those declines are a genuine headwind, though they do not identify the cause of the current selloff or time a trade. In the other direction, reported 30-day DEX volume is $29.2 billion, and a 12-month merchant-payments report found BNB Chain and Tron handled 75% of merchant USDT pay-ins. That is evidence of use, but not proof that buyers are stepping in now. My analytical view: the downtrend remains intact, while oversold conditions and nearby support make an immediate bearish continuation less certain. The most informative evidence next will be whether $565.84 holds on a retest, whether price can sustain a reclaim above $604.84, and whether any recovery comes with broader-market stability. Until those questions are answered, both a relief bounce and another leg down remain plausible. #IMPACTbyTrade
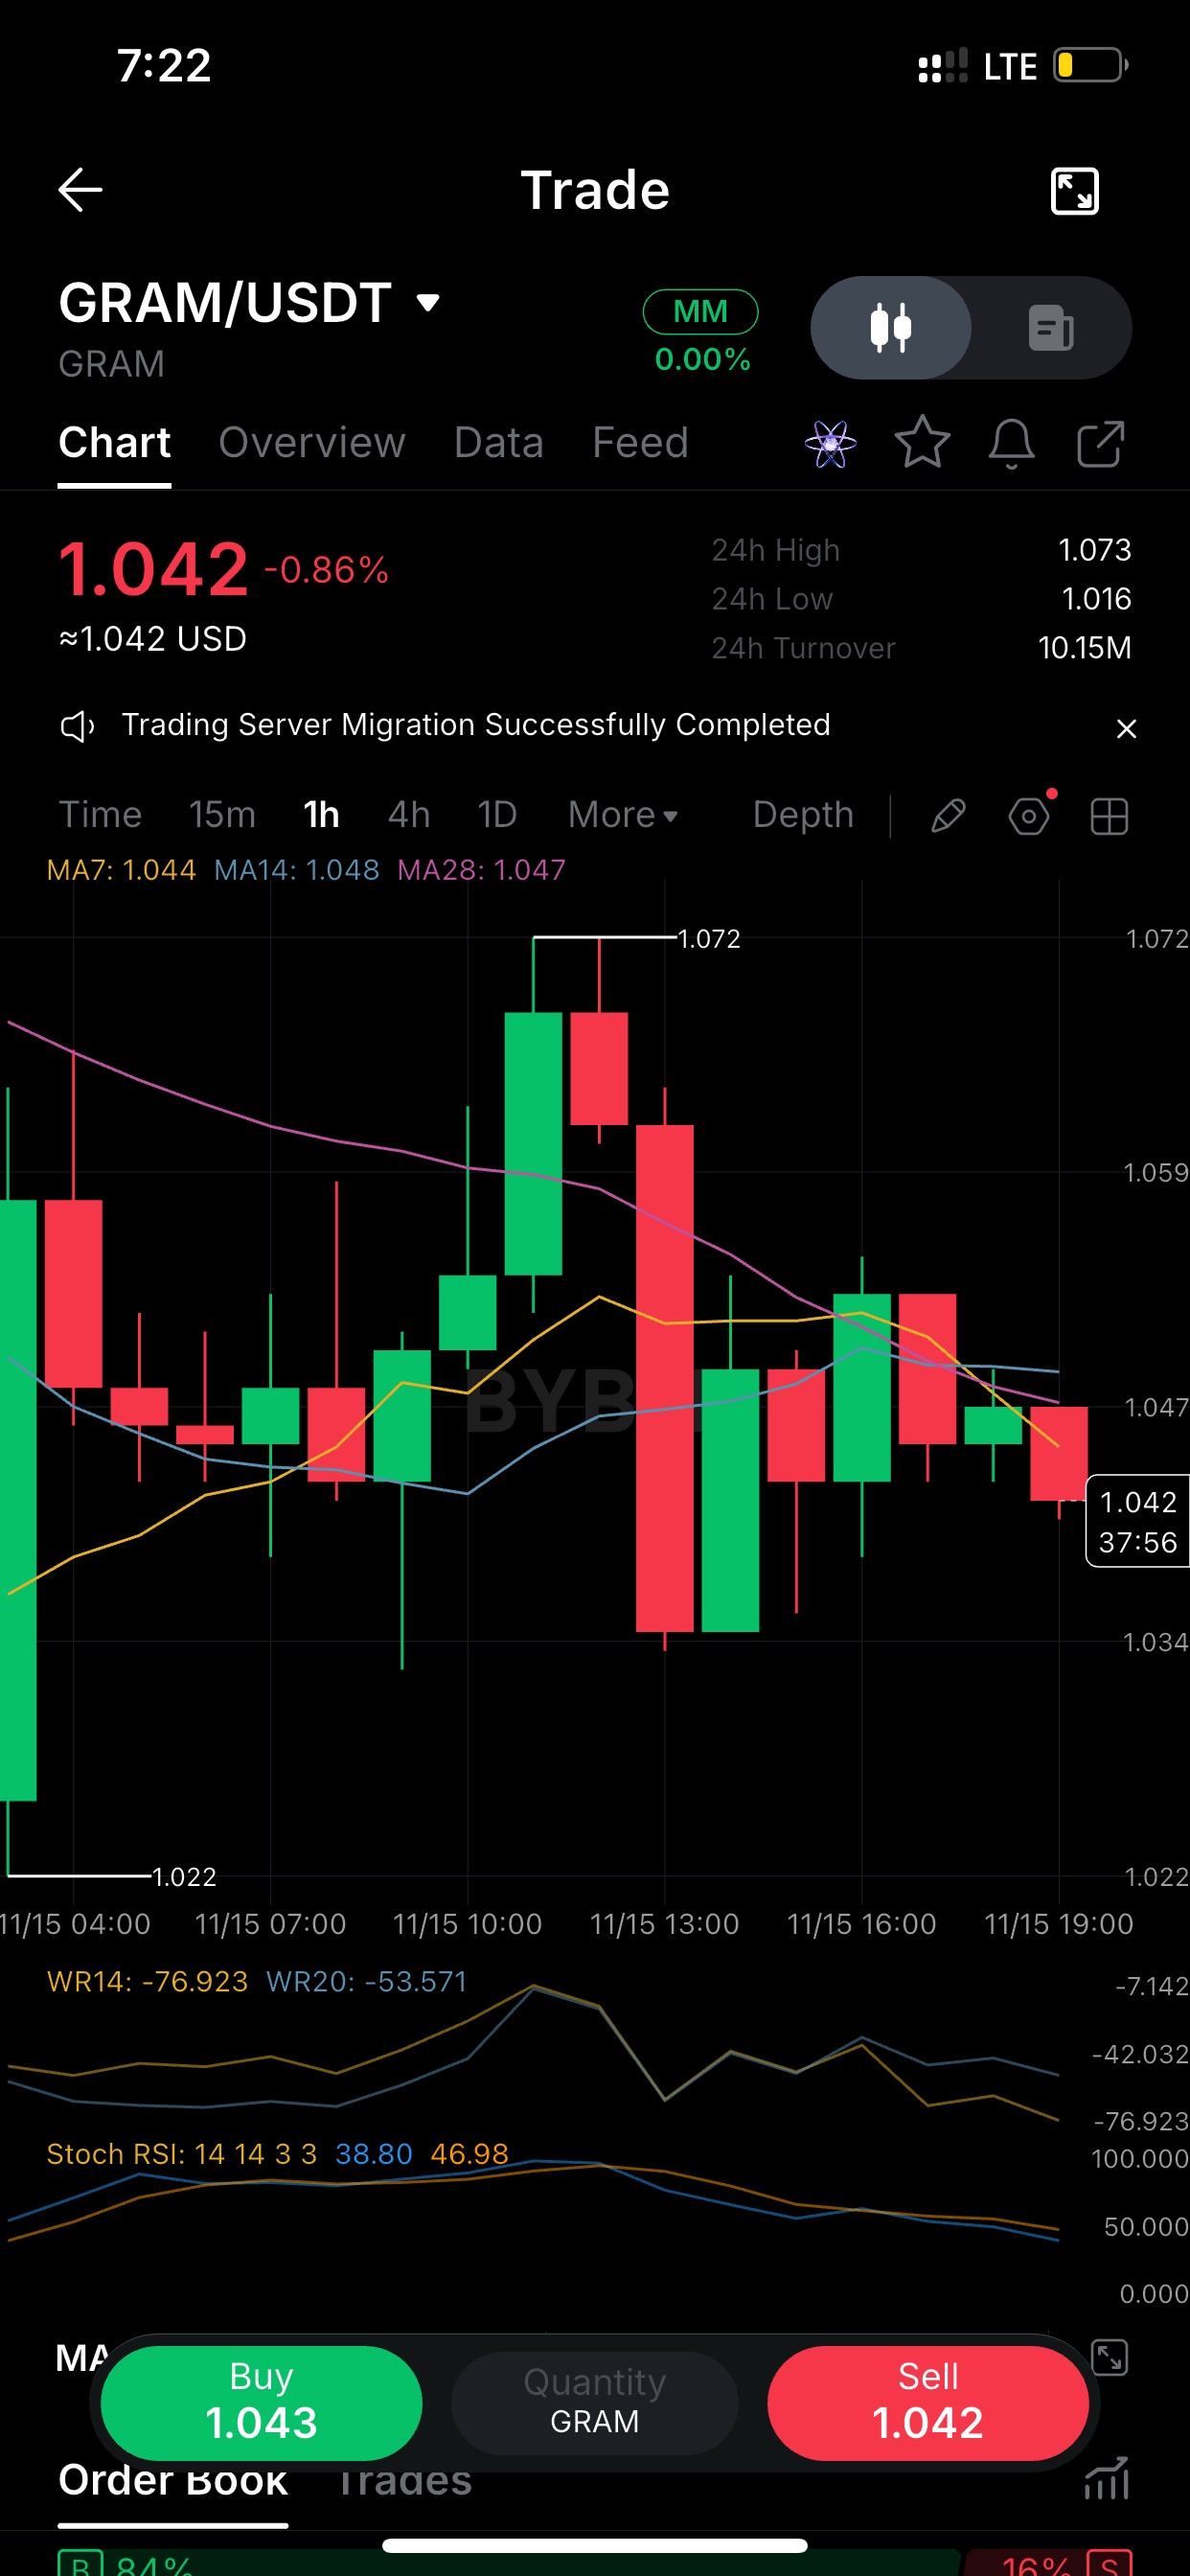
$GRAMUSDT printed 1.072 around 10:00 UTC and got sold straight back down. The red candle that followed erased almost the whole move and wicked to 1.034. Since then it's been lower highs, and price now sits at 1.042 under all three MAs (7/14/28 clustered at 1.044-1.048). That cluster is the first thing bulls need to reclaim. Until then I treat bounces as rallies into resistance, not a trend change. GRAM/USDT, 1h. Range is clean: 1.022 low, 1.072 high, and price is chopping in the lower half at 1.042. Momentum read: Stoch RSI is mid-range (about 39/47), so it's not oversold and there's room to slide further. Williams %R(14) is at -77, leaning weak but not washed out. If 1.034 (the last swing low) breaks on a closing basis, I'd expect a retest toward the 1.02 area. If buyers push back above 1.048, the bias flips neutral. Waiting on one of those two. 24h turnover on $GRAM is about 10M with a 1.016-1.073 range, so it's moving, but the 1h structure says sellers have the upper hand right now. Not chasing either side here. The setup I'd watch: a 1h close back above the MA cluster near 1.048 with a green candle that holds. Without that, every pop is just noise inside the range. One heads-up: the GRAM/USDT screen shows an MM tag and 0.00% fee badge. If this is a zero-fee or market-maker pair, trades on it are excluded from the trading impact part of the score. Your posts can still earn points on content quality, engagement and consistency, so make sure to use the coin tag or trading widget on each post. Also, spread these out over the day rather than posting all three at once, since high-frequency posting can get muted. #IMPACTbyTrade
$BNBUSDT is trying to stabilize after a sharp breakdown, but I don’t yet see evidence that the market has changed character. The key distinction is whether buyers are absorbing supply—or merely taking a pause while sellers reload. Verified: BNB is near $591, down 15% over 7 days. It fell to $565.84 and rebounded as high as $599.63, but recent hourly closes failed to hold above $597.89. The 1-hour, 4-hour and daily trends remain down. Daily RSI is 24.2, which signals oversold conditions, not a confirmed bottom. Price remains below the 1-hour EMA50 at $604.84, the 4-hour EMA20 at $615.86, and the daily EMA20 at $674.78. That leaves a nearby decision area. $585.72–$583.11 is short-term support; below it, the market would be testing $565.84 again. If that low breaks and price cannot quickly reclaim it, sellers retain control. On the other hand, a sustained move above $597.89–$604.84, followed by a successful retest, would be more meaningful than a brief intraday spike. The next substantial resistance is around $620.60–$620.85. Could BNB reclaim those levels while the broader market remains weak? That would be stronger evidence of demand than oversold readings alone. Participation signals are mixed. Reported spot volume is $1.44 billion across 62 venues, but the top 3 account for 48%, with one venue representing 30%. That makes the headline volume less persuasive as proof of broad-based buying. Perpetual open interest is $563 million across 4 tracked venues; OKX open interest is down 18.8% over 7 days. That suggests leverage has been coming out there, but it does not establish the direction of aggregate market-wide positioning. Funding is nearly flat at +0.001% per 8 hours, while dated futures trade at a negative 7.9% annualized basis. On OKX, retail accounts lean long, while top traders’ positioning leans short. Those crosscurrents do not point to an obvious, crowded short that must be squeezed. The important gap is what we cannot establish from these figures: there is no verified CVD, order-book imbalance, exchange-flow series, or liquidation map here. So we cannot confidently say whether spot buyers absorbed the selloff, where forced liquidations clustered, or whether the rebound was driven mainly by short covering. A liquidation level, if identified, would be a possible volatility point—not a guaranteed turning point. The immediate backdrop also matters. The broader crypto market is down about 5% in the latest snapshot, with fear at 10, down from 28 a week ago. News on Nov. 13 described a sharp cross-market decline and forced liquidations as Bitcoin and other major assets fell. That supports the interpretation that BNB’s slide was amplified by general risk aversion, rather than being solely a BNB-specific event. But it raises a useful question: if the broader market stabilizes, does BNB recover with it—or continue to lag? Fundamentals give little near-term support for a bullish reversal. Over 30 days, BNB Chain fees fell 33%, TVL fell 14.7%, and stablecoin supply fell 3.7%; these figures reinforce a weaker activity backdrop, though they do not prove what caused this week’s price move. There is counterevidence: reported 30-day DEX volume is $29.2 billion, and a recent merchant-payments report described substantial use of BNB Chain. Those are supportive context, not evidence of new buying pressure. A Japanese company’s announced BNB shareholder reward is worth watching, but its reported value is only about $50,000 and the reference date is Dec. 31. It does not look large enough to explain this selloff or reverse it by itself. My read: bearish structure, meaningful rebound risk, and no confirmed catalyst for either outcome. The next analysis should answer three questions: does $565.84 hold on a retest; can BNB reclaim $597.89–$604.84 with sustained spot demand; and is the weakness still tracking the wider market, or becoming BNB-specific?#IMPACTbyTrade

NEAR SPOT BUY 🟢 GREAT OPPortunity
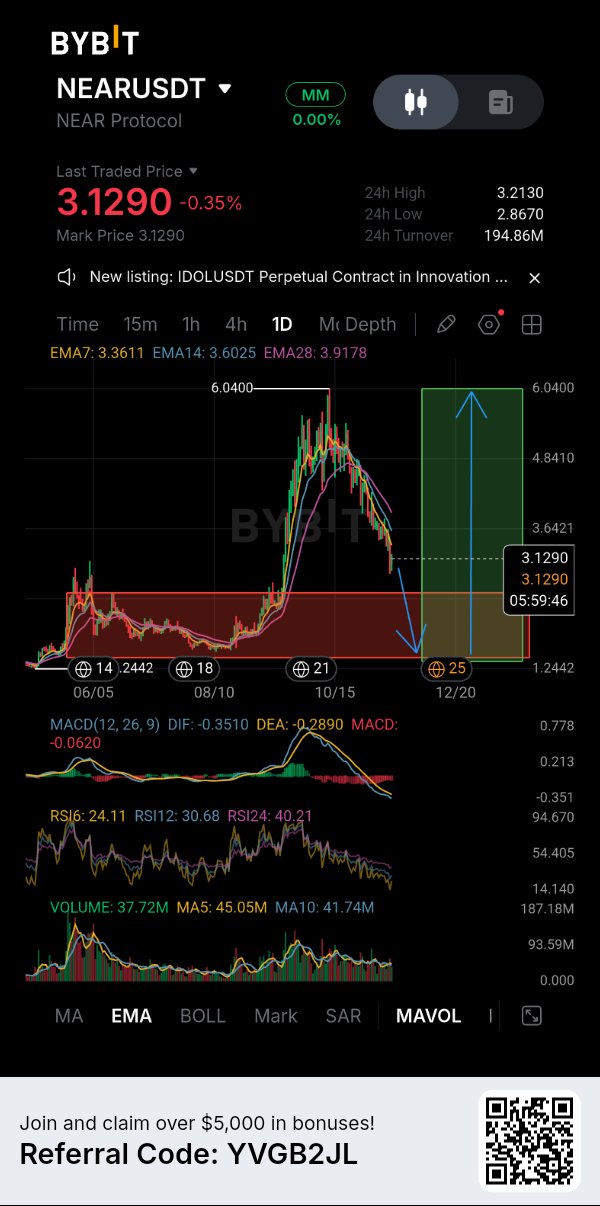
$NEAR EMERGENCY UPDATE : DOWNTREND IS GETTING DEEPER, BUT I'M WATCHING THE BIGGER OPPORTUNITY💯 $NEARUSDT is currently trading around $3.129, and the daily chart is showing clear signs of weakness. After the strong rally toward $6.04, price has gradually lost momentum and sellers have taken control. What concerns me most is that NEAR is now trading below all three visible EMAs. The EMA 7 is at $3.3611, EMA 14 at $3.6025, and EMA 28 at $3.9178. This bearish alignment tells me that buyers still have some work to do before the recovery becomes convincing. MY BYBIT 👉 WHAT THE DAILY CHART IS TELLING ME📊 RSI is another important detail here. RSI 6 is sitting at 24.11, RSI 12 at 30.68, and RSI 24 at 40.21. Short-term momentum is clearly stretched toward oversold territory. Meanwhile, MACD remains negative, with DIF at -0.3510 and DEA at -0.2890. The histogram is also below zero. So, although a relief bounce is possible, I don't want to confuse oversold conditions with a confirmed trend reversal. TWO SCENARIOS I'M WATCHING🟢🔴 BULLISH SCENARIO🟢 First, I want to see NEAR defend its current lower price region and establish some buying strength. The first recovery area I'm watching is around $3.36, followed by $3.60 and $3.92, where the visible EMAs are positioned. Reclaiming these levels would gradually improve the daily structure. A stronger recovery could eventually bring the previous $6.04 swing high back into focus, but that's a much bigger possibility, not an immediate target. BEARISH SCENARIO🔴 If sellers continue pushing price lower, the recent 24H low around $2.867 becomes an important nearby reference. A sustained breakdown could expose the much wider historical support region visible around $1.24. The chart annotation also illustrates a possible deeper correction before a larger recovery. However, I would need to see actual price confirmation before treating that projection as a realistic trading setup. FOR TRADERS ALREADY HOLDING NEAR🎯 I wouldn't make decisions based on RSI alone. If price starts recovering toward the EMA resistance cluster, partial profit-taking could be considered depending on individual entry prices. For anyone looking to build a larger position, I'd prefer seeing a confirmed recovery rather than averaging down blindly during continued weakness. RISK MANAGEMENT⚠️ $2.867 area deserves attention as the recent daily low. Losing it could increase downside pressure. A bounce without confirmation isn't a reliable entry. Liquidity zones aren't automatically buying opportunities either. Entry, stop-loss, position sizing, and risk-to-reward should all be considered before taking a trade. MY FINAL THOUGHTS🤔 I still see potential for a larger recovery in NEAR, but the current daily structure isn't bullish yet. I'd rather wait for buyers to prove themselves than rush into a falling market. Sometimes protecting capital during a weak market is the best trade. Are you accumulating NEAR at these prices, or waiting for a deeper correction before considering an entry? #IMPACTbyTrade #WSOT2026 #WSOTShowYourAITradeToEarn10USDT #JensenHuangExitTestsNvidiasAILeadership #USPPITestsTheHigherForLongerTrade


⚠️ ZRO/USDT — Is This a Deeper Correction Before Recovery, or Has the Trend Broken? ZRO is trading near $1.3765, down 10.33% in 24 hours, after falling from the recent $1.5468 high. The 24H low is $1.3421. Both 4H and daily charts remain weak; oversold RSI alone is not a buy signal. On 4H, RSI(6) is 25.94, RSI(12) 31.68 and RSI(24) 37.43. Daily RSI readings are also weak: 25.27, 34.93 and 42.69. Oversold conditions can bounce, but timing is uncertain. MACD is negative on both timeframes. On 4H, DIF is around -0.0392 versus DEA at -0.0230, with a negative histogram near -0.0162. Daily DIF is -0.0863 and DEA -0.0605. Volume is 332.60K, below MA5 at 575.88K and MA10 at 663.76K. Sellers remain in control; volume does not show a clear capitulation spike. The moving averages reinforce the caution. On 4H, MA7/EMA7 sit near $1.4406/$1.4416, MA14/EMA14 near $1.5041/$1.4792, and MA28/EMA28 around $1.5326/$1.5140. Daily averages are even higher: MA7 $1.4974, MA14 $1.5957 and MA28 $1.6837. Price must reclaim these areas; one bounce will not erase the downtrend. The Fibonacci map is important. The 4H chart marks $1.5042 as the 0.0 reference and $1.3817 as 1.0. Between them are 0.236 at $1.4753, 0.382 at $1.4574, 0.5 at $1.4430, 0.618 at $1.4285 and 0.786 at $1.4079. ZRO is now below the 1.0 level, so the full measured retracement has been exceeded. These are reference zones, not guaranteed support. Fundamentals are more nuanced than the chart. LayerZero says its interoperability protocol connects 165 networks and has moved more than $260B in cross-chain value. Its June 2026 token explanation describes ZRO as the asset intended to capture value across LayerZero, Stargate and the planned Zero network. Stargate revenue is directed to ZRO buybacks, while a separate LayerZero protocol fee switch would require governance activation before it can generate buyback-and-burn demand. Zero is designed for institutional settlement, payments and capital markets, with partners including DTCC, ICE, Citadel Securities, Tether and Google Cloud. These ambitions matter, but planned economics are not yet fully realized token value. There is also a near-term supply event. DeFiLlama lists 23.63M ZRO scheduled to unlock on November 19, around 5.91% of current circulating supply, allocated to core contributors and strategic partners. Unlocks do not mean automatic selling. LayerZero says actual investor sales have been below headline unlocks and points to Foundation and Stargate-funded buybacks. Still, new supply arrives while the chart is weak. Levels I am watching: 🔴 $1.4079: First Fibonacci reclaim level (0.786). A recovery above it would be an early sign of stabilization. 🔴 $1.4285–$1.4430: Fibonacci 0.618/0.5 zone, close to the 4H MA7 area. Reclaiming and holding this band would improve short-term structure. 🔴 $1.4574–$1.4753: Fibonacci 0.382/0.236 resistance. Buyers need to defend a retest after a breakout. 🔴 $1.5042: Fibonacci 0.0 reference and near the 4H MA14. A sustained reclaim would be a more meaningful recovery signal. 🟢 $1.3817: Fibonacci 1.0 reference, now just above price and an immediate reclaim test. 🟢 $1.3421: Visible 24H low. A decisive break below would expose further downside and weaken the case for a near-term base. I prefer evidence over trying to call a bottom. First I want price to reclaim $1.3817, then hold $1.4079 and work back through $1.4285–$1.4430 with improving volume. If rallies keep failing below the moving averages, the downtrend remains intact. A break under $1.3421 would make me more defensive. I would not treat oversold RSI as a standalone long signal. ZRO has a credible cross-chain role, but adoption, buybacks, fee-switch activation and token demand must be proven, not assumed. Strong fundamentals cannot cancel weak market structure. 🔥 Will ZRO reclaim $1.4079 and build a base, or will the November unlock and bearish momentum push it below $1.3421? $ZROUSDT #IMPACTbyTrade
ETH: The Leverage Reset Is Incomplete
Ethereum is still trading under pressure after last week’s sharp liquidation cycle. The latest CoinGlass snapshot puts $ETHUSDT near $1,816.60, down 1.32% over 24 hours and 14.35% over seven days. The day’s range has stretched from $1,710 to $1,857.60. Buyers have defended the low, but have not reclaimed the upper end with conviction. Derivatives data show that some leverage has left, although the process is not finished. Aggregate ETH futures open interest stands near $21.90 billion, down 3.02% over 24 hours. At the same time, tracked liquidations reached about $360.82 million, with $279.74 million coming from long positions. Falling price alongside lower open interest points to positions being closed or liquidated, not necessarily new shorts entering. Bybit’s $ETHUSDC perpetual offers a useful cross-check. Its open interest is around $1.36 billion, down 2.55% over 24 hours, while the funding rate is approximately −0.0047% per eight-hour period. Negative funding means shorts are paying longs, suggesting the perpetual market is trading with a bearish premium. Bybit recorded roughly $37.13 million in ETH liquidations over the same 24-hour window, heavily skewed toward longs at $33.32 million versus $3.81 million in shorts. Exposure is falling, but longs are still being forced out. The imbalance between derivatives and spot activity is another warning. CoinGlass reports roughly $64.45 billion in ETH futures volume against $4.48 billion in spot volume, a ratio of about 14.4 to one. This suggests short-term moves may be driven more by leverage than durable spot accumulation. The latest US spot ETH ETF reading was a modest $2.30 million net inflow on November 13; too little to establish a sustained demand trend. For ETH to build a credible recovery, the evidence needs to improve beyond a bounce from the $1,710 area. Spot participation should strengthen, open interest should stabilise without funding becoming aggressively positive, and price should hold above the recent intraday recovery zone. If price slips back toward the low while long liquidations remain dominant, the reset may still be working through the market. Key questions: 1. Can ETH hold above the $1,710–$1,800 area after the latest liquidation wave? 2. Will spot volume expand enough to support a recovery beyond derivatives trading? 3. Does falling open interest signal a healthier reduction in leverage, or simply another stage of forced exits? #IMPACTbyTrade

Can a network that sells blockchain data access to everyone survive if the market barely trades its own token? That is the tension around Lava. The project positions itself as a decentralized access layer, where independent providers serve RPC requests and applications pay for reliable connectivity. The problem is real. Many "decentralized" apps still depend on a few centralized RPC vendors, which quietly reintroduces single points of failure. If Lava delivers a credible multi-provider alternative, the technology matters. The screen shows something narrower. LAVA trades at 0.01596 USDT, down 2.15% on the session, with 574.58K displayed beside the ticker. If that is LAVA-denominated volume, the notional is roughly 9,000 USDT. That is my arithmetic, not a confirmed exchange statistic, and I can't verify the time window. It does frame the question: an infrastructure token needs real market depth before any usage story can be priced with confidence. The contradiction sits in who the customer is. Developers buying data access want cheap, predictable costs, not token exposure. Paying in the token is a design choice, not a necessity. If demand comes mainly from incentives, with providers earning rewards for serving requests, the token reflects subsidy rather than consumption. Nothing supplied shows revenue, supply, unlocks or fee data, so I won't pretend to know which one dominates. The bull case is that RPC is a recurring cost for every onchain application. Capturing even a small share of that spend through token-linked settlement could make a sub-two-cent asset look mispriced. The bear case is that centralized providers already compete well on latency and price. Developers switch only when decentralization becomes a purchasing criterion rather than a talking point. The critical risk is that the token's utility can be bypassed. Entrenched competitors plus optional token payments is a hard combination, and thin liquidity makes it worse. When small orders move price, a single-day percentage change says very little. My view: the thesis is plausible, but the evidence in front of me doesn't confirm it. A 2.15% decline on light turnover is noise, not a verdict on fundamentals. The next milestone is verifiable growth in fee-paying request volume, reported separately from incentive-funded activity, along with the share of provider rewards covered by organic fees. That would show whether usage is earning its place rather than being paid for. If Lava's customers could pay in any currency, would the token still be necessary? $LAVAUSDT #IMPACTbyTrade

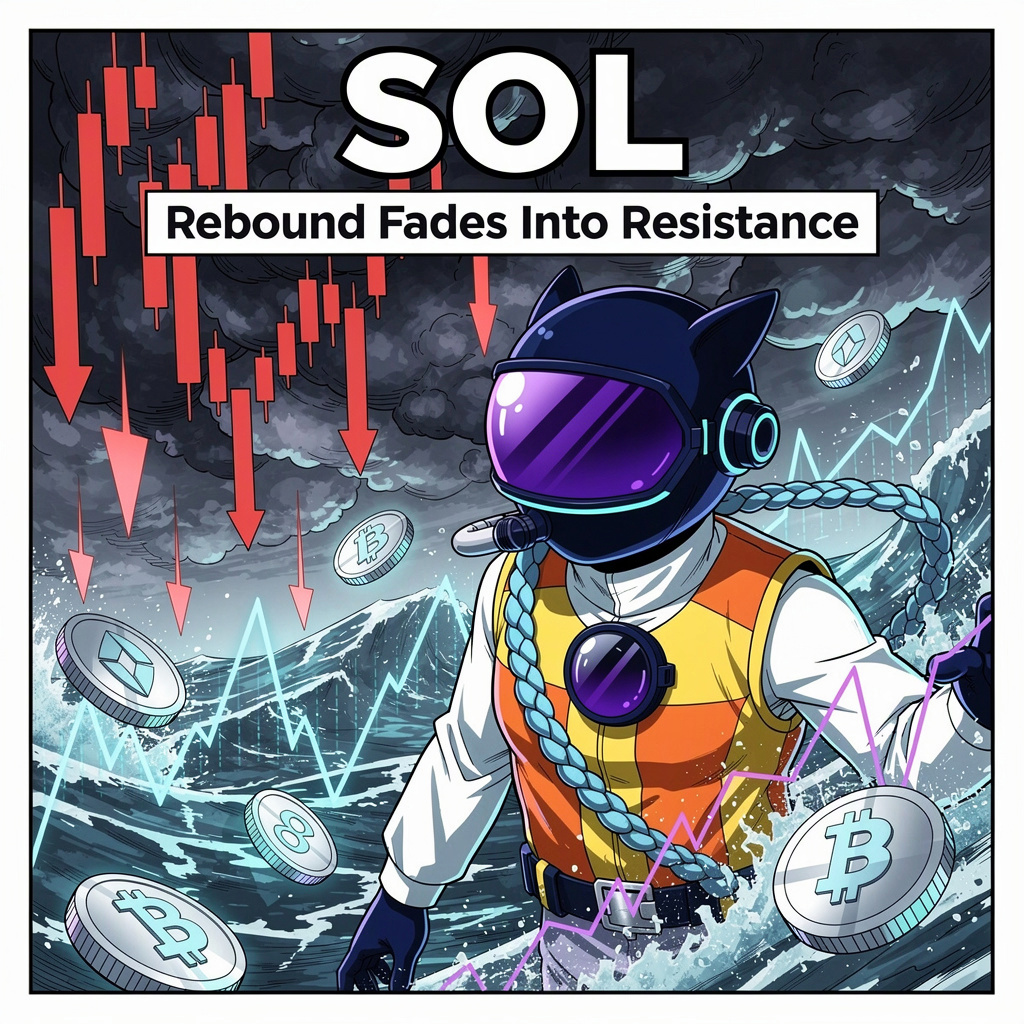
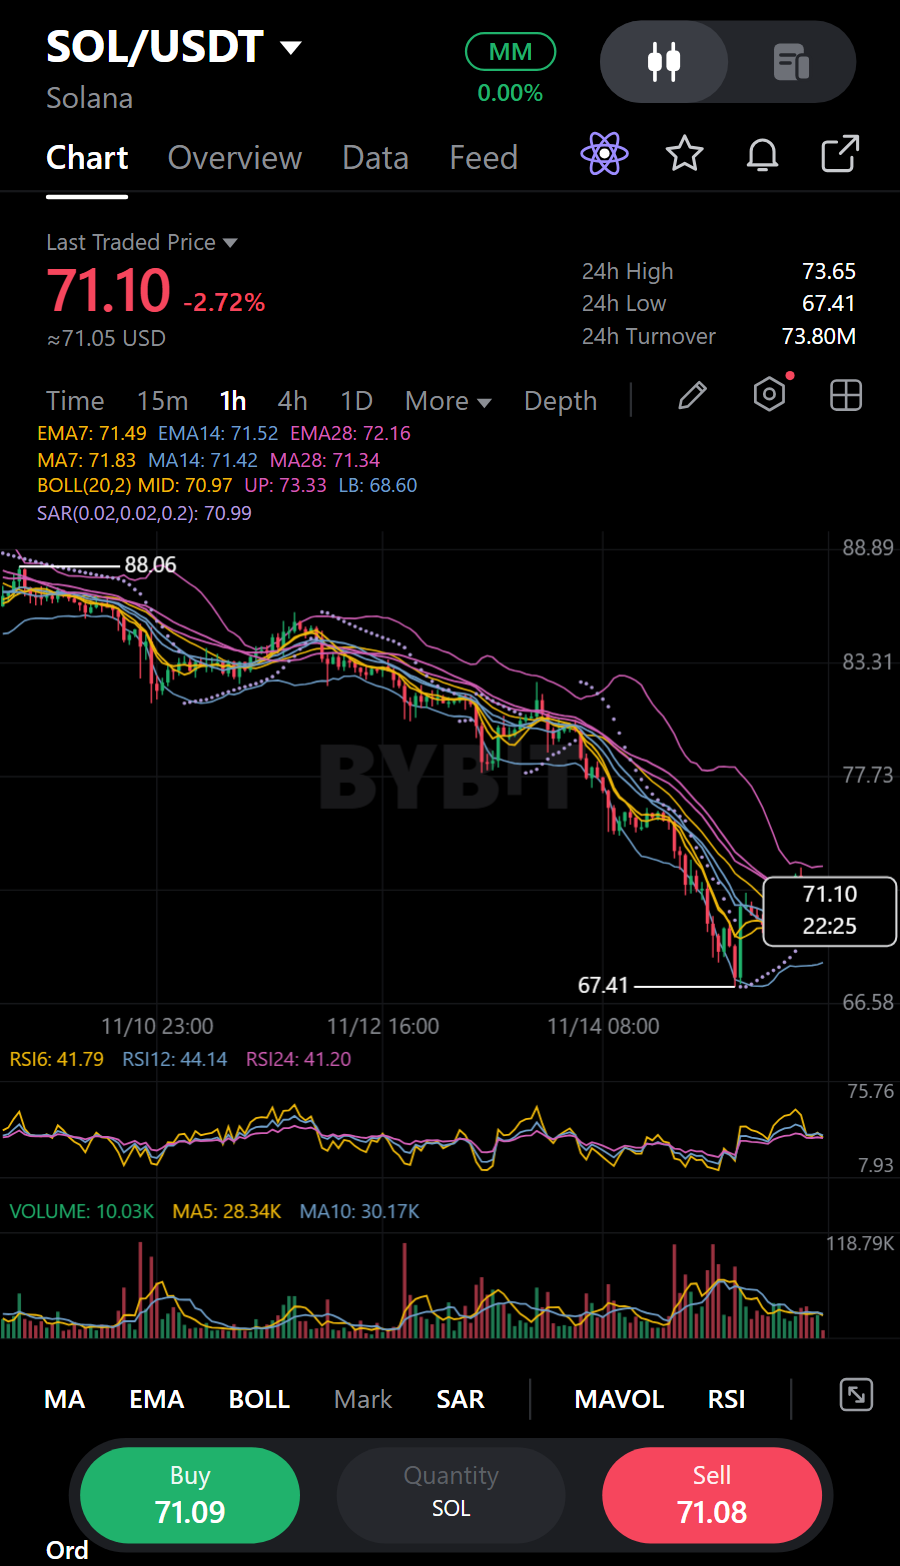
SOLUSDT: El rebote pierde fuerza ante la resistencia
El rebote tardío se ha estancado sin lograr una recuperación clara: $SOLUSDT está en 71.06, mientras que la última vela cerrada terminó en 71.42. Más temprano, la vela roja de las 12:00 cerró en 70.76 y la vela roja de las 14:00 en 69.98, mostrando que los vendedores presionaban a la baja antes de que los compradores intervinieran. Luego, la vela verde de las 15:00 cerró en 71.11 con el volumen más fuerte de la secuencia, una respuesta real, pero todavía no un cambio duradero en el control. La recuperación continuó hasta las 19:00, cuando una vela verde cerró en 72.87, pero el siguiente impulso fue rechazado: la vela roja de las 21:00 cerró en 71.3 después del rango más amplio de la secuencia. A las 23:00, los compradores solo lograron un cierre de 71.42. El precio está por debajo de las medias móviles MA7, MA14 y MA28, por lo que ese rebote no ha reparado la estructura horaria. El movimiento de 24h ha bajado un 2.78%, mientras que el volumen es aproximadamente 1.31 veces el del día anterior; una mayor actividad junto con la caída mantiene mi lectura bajista, a pesar del rebote. Tengo SOL spot, y veo la idea de venta en corto como condicional en lugar de perseguir la debilidad aquí. La Zona de Entrada es 70.748 - 71.372; una prueba allí que no logre recuperar las medias móviles cercanas dejaría a los vendedores con la configuración más clara. El Stop Loss es 72.932, con TP1 en 69.5 y TP2 en 67.94. Desde la mitad de la zona, la relación riesgo-beneficio declarada es de aproximadamente 0.8 a 1 para TP1 y 1.7 a 1 para TP2, por lo que el primer objetivo es modesto en relación con el riesgo. La visión bajista se debilita si el precio supera el área de stop y se mantiene allí; una nueva pérdida de terreno después de una recuperación fallida la respaldaría. El rango de 24h y esa amplia vela de las 21:00 son recordatorios de que esto puede moverse bruscamente, así que tendría cuidado con la ejecución y el deslizamiento (slippage) en lugar de tratar los niveles como garantías. ¿Qué buscas tú para distinguir una recuperación horaria real de un rebote que los vendedores pueden desvanecer? Plan de Trading (CORTO / Bajista): • Soporte: 67.41 / 67.41 | Resistencia: 73.65 / 85.82 • Zona de Entrada: 70.748 - 71.372 • Stop Loss (SL): 72.932 • Objetivos: TP1 69.5 | TP2 67.94 ¿Qué buscas tú para distinguir una recuperación horaria real de un rebote que los vendedores pueden desvanecer? Solo es mi lectura, no un consejo financiero.IMPACTbyTrade

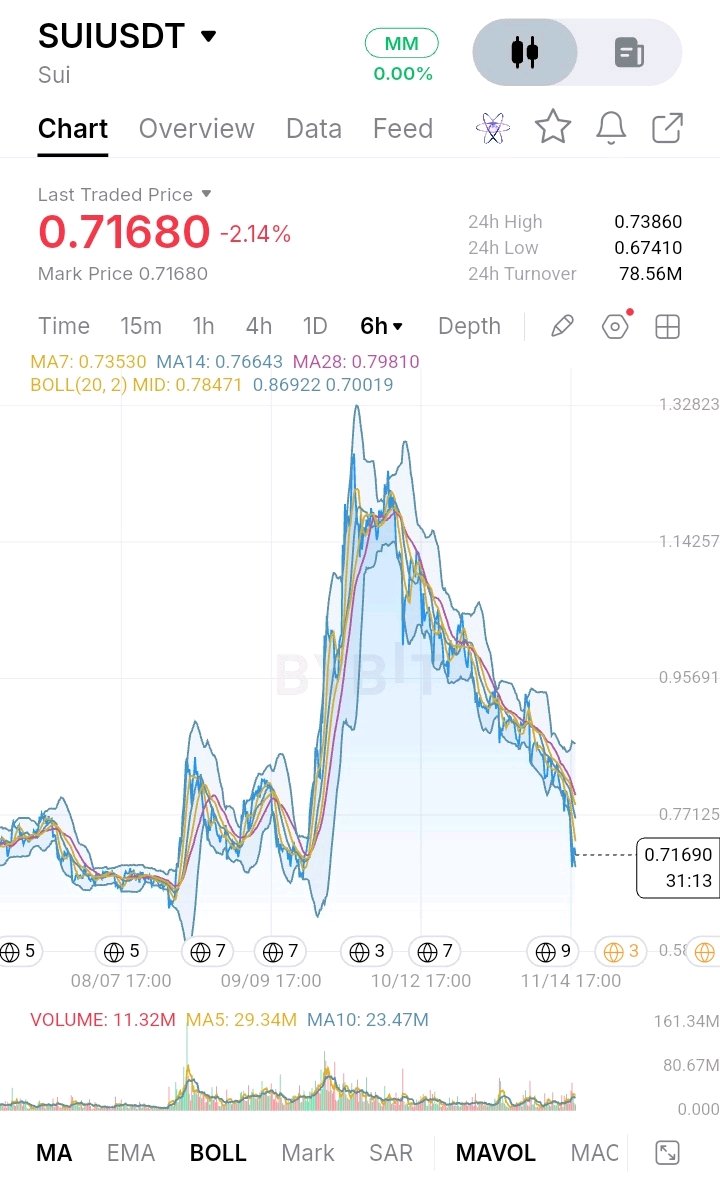
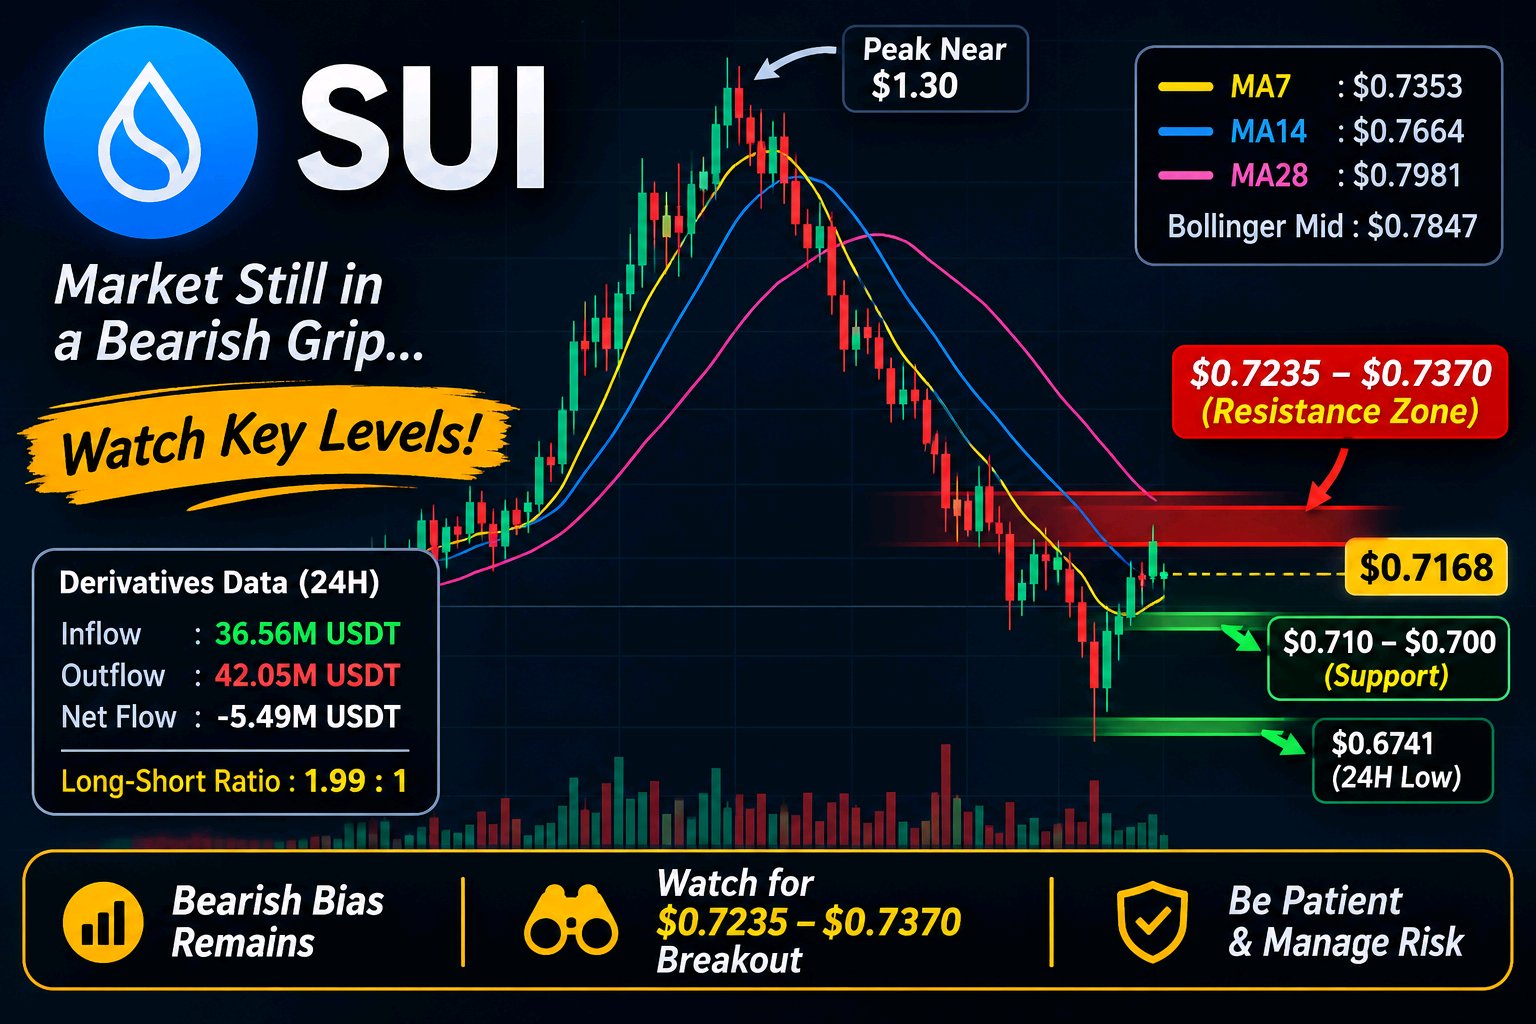
I've been watching $SUIUSDT closely, and what concerns me most right now is that the price is still struggling to build a strong recovery. Trading around $0.7168, SUI remains under selling pressure, and the overall market structure hasn't shown any convincing signs of a bullish reversal yet. There is a small recovery on the lower timeframe, but I don't think it's enough to change the bigger picture. Looking at the 6H chart, the downtrend is quite clear. SUI previously reached around $1.30, but since then, sellers have maintained control, pushing the price into a pattern of lower highs and lower lows. The moving averages support this bearish outlook. MA7 is around $0.7353, MA14 is near $0.7664, and MA28 stands at approximately $0.7981. With the current price trading below all three, buyers still have some work to do before the market can regain strength. Another level I'm paying attention to is the Bollinger middle band around $0.7847. If SUI manages to recover and hold above this area, it could be an early sign that buying momentum is improving. Until then, I would remain cautious. On the 15M chart, SUI has bounced after dropping toward $0.669. However, the recovery is facing resistance around $0.7235–$0.7370. This zone matters because it brings together the short-term moving averages and the upper part of the immediate recovery area. If buyers fail to reclaim it, the current bounce could simply develop into another lower high rather than the beginning of a new uptrend. The derivatives data adds another interesting perspective. The long-short ratio is approximately 1.99:1, showing that long positions are considerably higher than short positions. Meanwhile, 24H derivatives inflows are around 36.56M USDT, while outflows have reached 42.05M USDT, leaving a negative net flow of approximately 5.49M USDT. This suggests that more capital is leaving the derivatives market than entering it. With long positioning already elevated, another downward move could create additional liquidation pressure. For the downside, I'm watching $0.710–$0.700 first, followed by the previous 24H low at $0.6741. On the upside, $0.7386 is the first important level buyers need to reclaim. A stronger recovery would require sustained buying pressure rather than just a temporary bounce. Personally, I'm staying patient with SUI. I'm not treating this as an active long or short position. I want to see how price reacts around these levels before making a decision. Right now, protecting capital and waiting for confirmation makes more sense to me than rushing into a trade. #IMPACTbyTrade
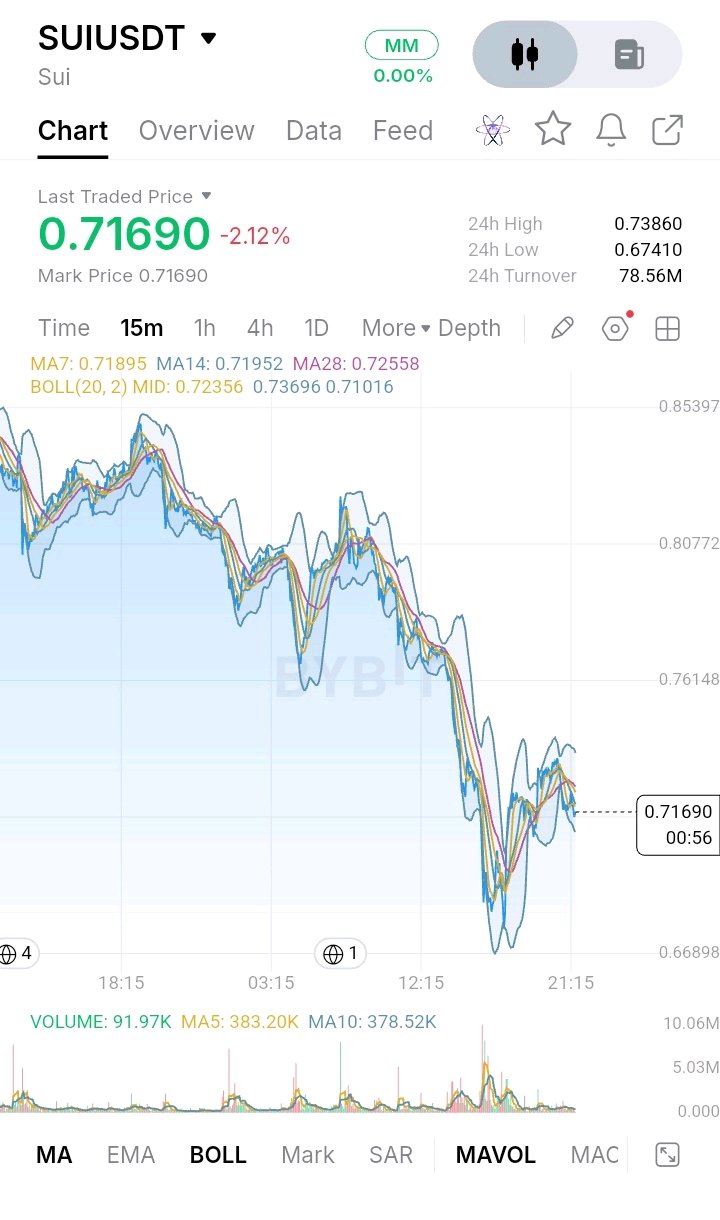

SUI Is Struggling to Hold $0.72 After Its Bounce From $0.6754 — Recovery or Another Breakdown? SUI has recovered sharply from $0.6754, but the rebound is now losing momentum around the $0.72 area. What makes this setup interesting is that buyers managed to recover a significant part of the drop, yet they have not reclaimed the resistance levels needed to change the broader trend. SUI/USDT: $0.7171 | -1.04% The 4H trend remains bearish The moving averages tell an important story: - MA7: $0.7181 - MA14: $0.7502 - MA28: $0.7816 Price is hovering around the 4H MA7 but remains well below MA14 and MA28. Both longer averages are still above the market, showing that sellers retain control of the broader structure. For buyers, reclaiming $0.7392 would be an early improvement. A stronger confirmation would require a sustained move above $0.7502. The 15-minute chart shows fading momentum The lower timeframe is also showing some weakness: - MA7: $0.7196 - MA14: $0.7201 - MA28: $0.7262 SUI is trading below all three short-term averages. The recent recovery has stalled, and the moving-average cluster around $0.7200–$0.7262 is now acting as overhead resistance. Volume adds another caution: current displayed 15m volume is 7.15K, compared with MA5 at 58.36K and MA10 at 55.71K. The rebound is not currently supported by strong trading participation. Key levels to watch Resistance - $0.7200–$0.7262: Short-term moving-average zone - $0.7392: 24H high and immediate breakout level - $0.7502: 4H MA14 - $0.7816: 4H MA28 Support - $0.7000: Nearby psychological and chart level - $0.6754: Recent low and major support Trading outlook Bias: WAIT — bearish structure, with a possible short-term recovery. A sustained breakout above $0.7392 could improve the recovery and bring $0.7502 into focus. Stronger confirmation would come if SUI reclaims the 4H MA14 with convincing volume. If price continues to struggle below $0.7262 and loses $0.7000, sellers could push it toward $0.6754 again. A decisive breakdown below $0.6754 would invalidate the current recovery structure and signal renewed downside pressure. I would avoid chasing either direction while price remains trapped between nearby support and resistance. The next confirmed move matters more than the temporary bounce. Do you think SUI can reclaim $0.7502, or will sellers push price back toward $0.6754 first? What are you watching on the 4H chart?$SUIUSDT #IMPACTbyTrade

One red line. Two upside levels. This is why $LINKUSDT has my attention. The most important number on my chart is $8.575. That's where my bullish idea faces its real test. The setup $LINK is up about 1.7% on the day at roughly $9.187 after a bounce off the lows, and it is trading far below its prior highs after a steep multi-day slide. Weekly RSI analysis suggests a possible bullish divergence. The daily chart has already shown an initial reaction, and price is now testing that base again. What I want to see is buyers absorbing the selling pressure, followed by a clear shift in daily market structure. If that happens with stronger volume, I'm watching two swing levels: 🎯 Target 1: ~$9.778 (about +6.4% from $9.187) 🎯 Target 2: ~$10.380 (about +13% from $9.187) These are ambitious scenarios, not guaranteed returns. Monday's reopening of traditional markets could bring fresh activity, but $LINK needs its own buying volume to support a meaningful recovery. As a mid-cap altcoin, sharp moves can happen in either direction. Management: If price breaks below $8.575 and cannot recover that level, my bullish setup is no longer valid. For a new position, I want a confirmed daily higher low, a break above the latest lower high, and expanding volume. The protective stop belongs below the confirmed structure. Position size and the final risk-to-reward ratio must be calculated from the actual entry and stop, not assumed in advance. I'm heavily bullish on $LINK's recovery potential, but the next volume-backed move will determine whether this remains a promising chart or becomes a trade worth taking. Not financial advice. Do your own research and manage your risk. #IMPACTbyTrade
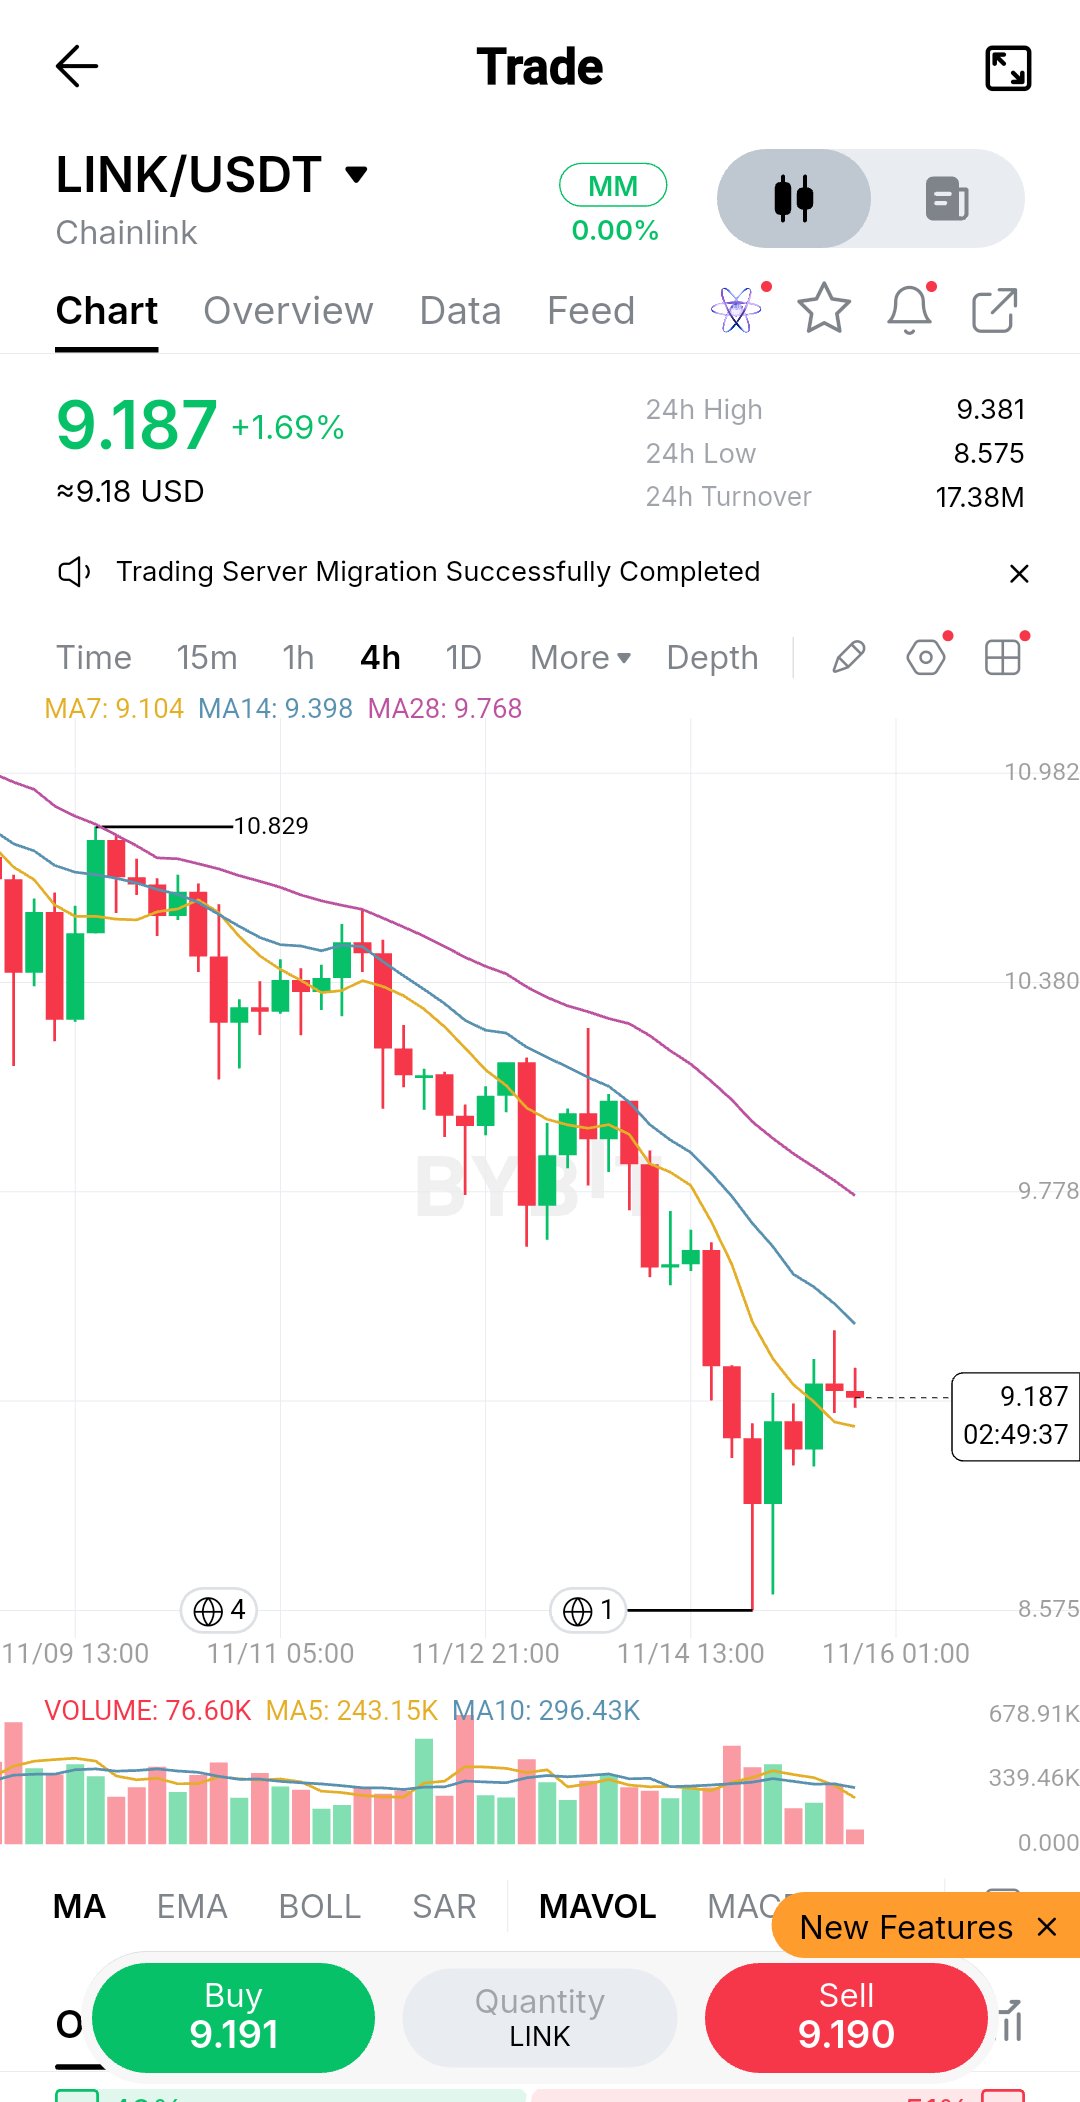
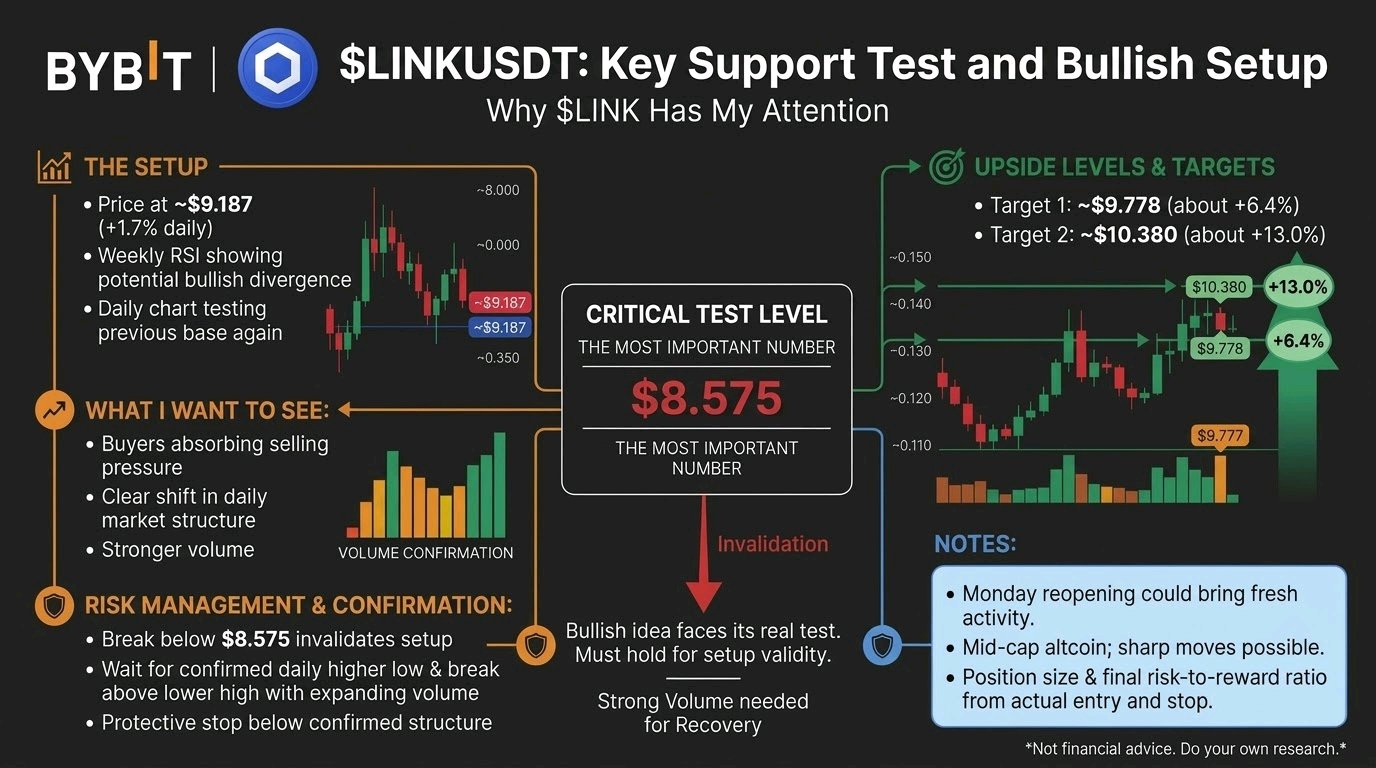

GLMR/USDT — Buyers Have Finally Stepped In, But Can They Turn This Bounce Into a Real Reversal? GLMR has caught my attention after the latest move. After spending weeks under selling pressure, buyers have suddenly stepped in and pushed the price toward $0.00790. The move is strong, and the volume makes it worth watching. But I don't want to confuse one powerful green candle with a confirmed trend reversal. There are still a few important levels that buyers need to overcome. What I'm seeing on the Daily chart GLMR is trading around $0.00778, with the latest daily candle showing a gain of nearly 38%. The first thing I noticed is that price has recovered above the EMA7 at $0.006862 and EMA14 at $0.007170. It is also approaching the EMA28 at $0.007711. However, the MA28 at $0.007912 is still an important overhead level. This means the recovery is improving the daily picture, but buyers haven't cleared every major resistance yet. Volume is particularly interesting. Daily volume has reached 46.39M, compared with the MA5 at 21.67M and MA10 at 20.71M. That's a meaningful increase in participation and gives this move more weight than a low-volume bounce. The daily RSI readings are also improving: - RSI6: 62.85 - RSI12: 52.26 - RSI24: 48.82 MACD is still slightly negative, with DIF at -0.000581 and DEA at -0.000554. So the daily momentum has not completely turned bullish yet. The 4H chart is showing something more encouraging This is where the recovery becomes more interesting. Price has moved above all the displayed short-term moving averages: - EMA7: $0.006765 - EMA14: $0.006479 - EMA28: $0.006519 - MA7: $0.006351 - MA14: $0.006203 - MA28: $0.006479 The 4H MACD has also moved into positive territory. DIF is at 0.000011, DEA at -0.000222 and the histogram at 0.000234. That's an improvement in short-term momentum. But there is one thing I wouldn't ignore: RSI6 has reached 76.59, while RSI12 is at 69.65 and RSI24 at 61.44. Short-term momentum is now quite stretched. Buyers may still push higher, but a pullback or consolidation wouldn't surprise me. The price levels I am watching Here are the areas that matter most to me: - $0.008385 — Recent high and immediate breakout resistance. - $0.00791–$0.00792 — Daily MA28 resistance zone. - $0.007823 — Important 4H Fibonacci reference level. - $0.00717–$0.00686 — Daily EMA14 and EMA7 support area. - $0.00675–$0.00620 — Important 4H moving-average support cluster. - $0.006034 — Additional downside reference from the displayed Fibonacci tool. - $0.005411 — Recent low and major structural support. What would make me more confident? I want to see GLMR hold above the $0.00782–$0.00792 region rather than simply touch it and fall back. If buyers manage to establish support above this zone, the next important test will be $0.008385. A convincing break above that high, supported by sustained volume, would make the recovery considerably more interesting. Beyond that, $0.00876 becomes the next visible chart reference. On the other hand, if price gets rejected around $0.00791–$0.008385 and starts losing $0.00717, I'll be watching for a deeper pullback toward the $0.00675–$0.00620 area. A move back below $0.005411 would seriously damage the current recovery structure. How I would approach a trade I wouldn't chase GLMR after a nearly 38% daily move. For a long setup, I'd rather wait for a pullback and see whether the $0.00782–$0.00792 region can hold as support. A confirmed breakout above $0.008385 followed by a successful retest would be another possible setup. For an invalidation level, the $0.00717 area is an important first reference, while a deeper structural failure below $0.00620 would weaken the recovery further. The actual stop should depend on the entry and position size. My view is that GLMR has finally shown buyers are willing to defend the market, and the 4H momentum supports that improvement. But the daily chart still needs confirmation. I want to see buyers prove they can hold the reclaimed levels, not just produce one impressive candle. The bounce is real. Whether it becomes a trend reversal is the next question. $GLMRUSDT #IMPACTbyTrade

BNBUSDT: A $1.19B Token Burn Couldn't Prevent the Sell-Off. Here's What Matters Now. BNB's latest correction is exposing an interesting contradiction: its token supply continues shrinking, but market demand is not strong enough to protect price. BNB is trading around $590–$599, following a sharp decline from the $680 region. On November 14, it dropped 7.68%, and the November 15 session has so far produced a rebound from approximately $566. That recovery deserves attention, but I wouldn't call it a trend reversal yet. The supply story is improving. The demand story is not. On October 19, BNB completed its 37th quarterly burn, permanently removing 1,646,196.44 BNB, worth approximately $1.197 billion at the time. This is more than a headline event. BNB's Auto-Burn mechanism gradually reduces supply toward a target of 100 million tokens. Additionally, BEP-95 burns a portion of gas fees generated through BNB Chain activity. There is a structural supply-reduction mechanism behind the asset. But here's the overlooked part: a token burn reduces available supply; it does not guarantee immediate buying pressure. Derivatives are revealing the weakness. Current aggregated market data shows: - Futures volume: approximately $1.33B. - Spot volume: approximately $193M. - Open interest: approximately $962M, down around 0.86% over 24 hours. - Funding: slightly positive at approximately 0.0008%. - Liquidations: approximately $13.4M, with roughly 97% coming from longs. Futures activity is almost seven times spot volume. More importantly, both spot and futures flows have recorded net selling over the past seven days. This suggests the correction isn't simply a temporary leverage reset. Actual spot demand also needs to improve. What the chart is telling me The $566–$582 region is becoming an important short-term demand area after the latest sell-off. The market has bounced from that zone, but buyers still need to establish control. My key levels: - $566: Recent session low. Losing this level would weaken the recovery attempt. - $582: Important short-term price reference from the previous daily close. - $600–$612: Immediate recovery territory where buyers need to demonstrate strength. - $630: A more meaningful resistance area following the recent breakdown. On the 15M, I want to see higher lows rather than another short-lived bounce. On the 1H, holding above $600 would improve the immediate structure. On the 4H, reclaiming $630 would provide stronger evidence that sellers are losing control. The broader market matters too. Binance Research's November report highlighted rising inflation, stronger expectations of a December Fed rate hike and weaker institutional demand as important pressures on crypto markets. BNB cannot completely escape that environment, regardless of its own token-burning mechanism. My approach is conditional: If buyers defend $582 and reclaim $612 with stronger spot participation, recovery toward $630 becomes more credible. If $566 breaks decisively, I would avoid assuming that the recent bounce represents a bottom. BNB's tokenomics are reducing supply, but the market is demanding something more important right now: evidence that real buyers are willing to absorb the available selling pressure. A burn supports the long-term supply story; demand must prove the short-term price story. $BNBUSDT #IMPACTbyTrade
$XRPUSDT is caught between a sharp rebound from a two-year low and a still-intact downtrend. At about $0.958 on November 15, it is up 4.78% from the prior daily close, after trading as low as $0.8993. That bounce matters, but it has not yet changed the market structure: XRP remains below $1, below its 4-hour EMA20 near $0.991, and well below its daily EMA20 near $1.131. The market is asking whether buyers have found real demand—or whether they are simply responding to an oversold flush. The immediate test is $0.9795–$0.9983. That zone combines the recent intraday high, the former $1 support area, and the 4-hour EMA20. A brief move above it would not be enough by itself. I would want to see XRP hold above the zone on a retest, with meaningful spot buying and open interest rebuilding. Otherwise, a rally could be short covering or position adjustment rather than fresh demand. A break below $0.943 would weaken the near-term bounce; $0.8929, the recent low, is the more consequential support. If that level gives way, the market has not yet shown a strong nearby base. The broader technical picture is unambiguous, though not a timing signal. XRP is down 17.2% over 7 days and 28.0% over 30 days. The daily RSI is 24.3, an oversold reading, but oversold markets can remain weak. On the 1-hour chart, price is near the EMA20 and below the EMA50 around $0.976; on the 4-hour chart it remains below both the EMA20 and EMA50. These facts favor caution on the bounce, but a successful reclaim of $0.9983 would make the bearish interpretation less secure. The derivatives picture is mixed. Funding is mildly negative across the tracked venues, with the weighted rate at -0.011% per 8 hours; shorts pay longs, which can make short positions costly and leave room for a squeeze. Yet this is not evidence that a squeeze is underway. OKX open interest is down 9.4% over 7 days, but that is one venue, and dollar-denominated open interest can fall simply because the token price falls. Long/short data also conflicts: accounts are net long, while top traders’ positions lean short. Reported recent liquidations hit longs hardest, but the available figures do not establish precise liquidation clusters or prove broad market-wide deleveraging. We still need to ask: if price rises, does open interest grow with it, or do shorts merely close into thin demand? There are real fundamental headwinds, but their timing is less clear. U.S. spot XRP funds saw $6.48M in net outflows over 5 days and $1.18M over 20 days, though the latest reported session was positive. XRPL stablecoin supply and value locked each fell about 25% over 30 days. Those are signs of weaker marginal demand and network capital, not proof that they caused this week’s selloff. A reported 240M XRP transfer did not reach an exchange, and exchange-balance readings are disputed because newly tracked wallets changed the totals. Neither establishes a wave of sell-side deposits. No verified new announcement or token unlock in the retrieved recent news clearly explains the move; 36.5% of maximum supply remains outside circulation, a longer-term supply consideration, not evidence of an immediate release. My read is that broad crypto weakness, extreme fear, ETF outflows, and long liquidations explain the pressure better than any single XRP-specific event. But we lack spot CVD, order-book imbalance, and reliable whale-flow evidence, so claims of accumulation or distribution would be premature. The bull case needs a held reclaim of $0.9983, supported by spot demand; the bear case strengthens if $0.943 fails and especially if $0.8929 breaks. Which side is actually taking initiative—spot buyers or leveraged traders—and will the next move in open interest confirm it?#IMPACTbyTrade
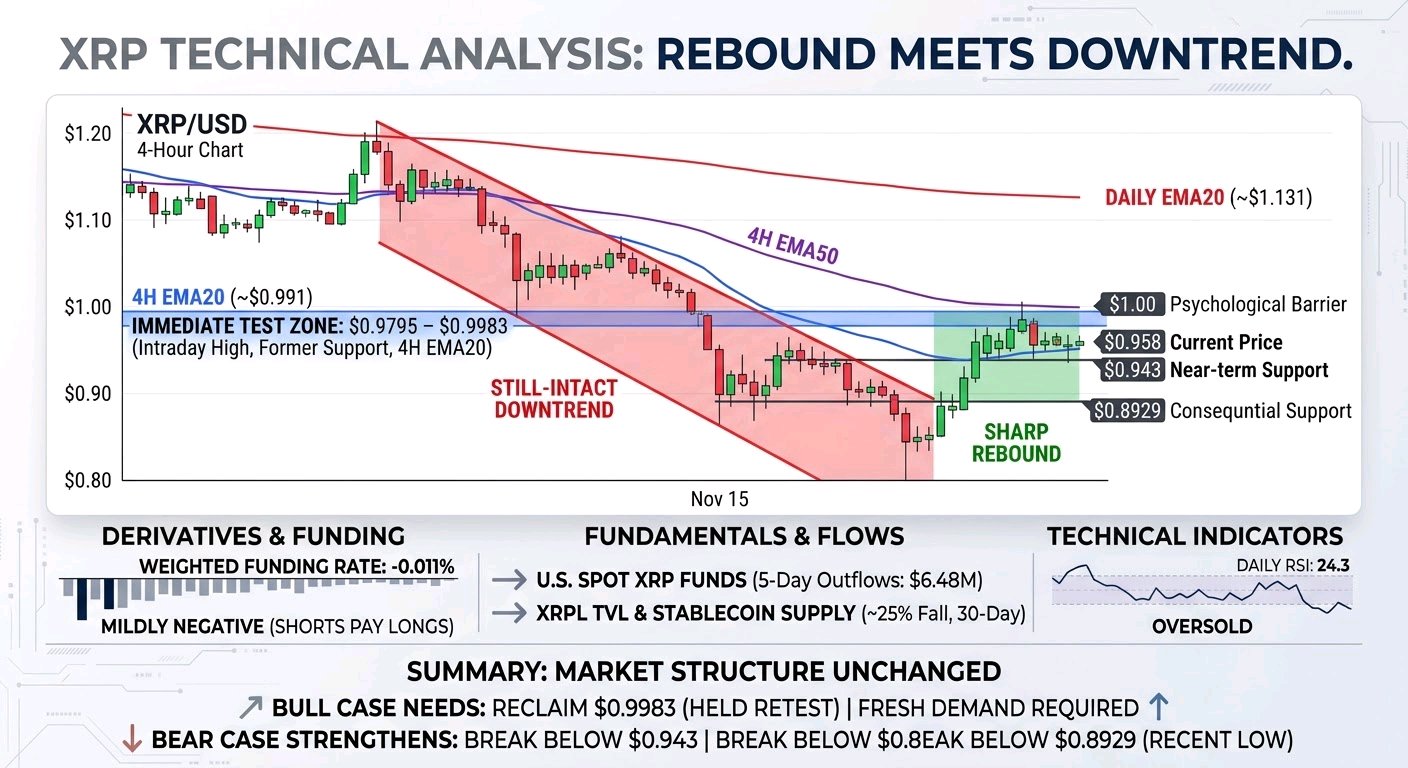

NVDA has gone from a hard slide to a quiet base, and a quiet base is the kind of chart where I'd rather buy a small dip than chase the high. The chart attached is only background on the bigger picture. The trade below stands on today's Bybit 1h and 15m charts alone. $NVDAXUSDT is at 161.55 (+1.12%), inside a 24h range of 156.15 to 161.74 That puts it 97% of the way up the range, 3.5% above the low and 0.1% under the high. Turnover is 54.23M. The levels I'm watching: Up: 161.74 (24h high) -> 163.99 (chart gridline, an area) -> 171.84 (1h chart high) Down: 160.89 (1h MA7) -> 160.80 (1h MA14) -> 160.70 (15m MA14) -> 160.35 (1h MA28) On the 1h, price is over MA7 (160.89), MA14 (160.80) and MA28 (160.35), by 0.4%, 0.5% and 0.7% The three have flattened and bunched after the slide from 171.84, so I read 160.35 to 160.90 as one support zone, and price is only now stepping away from it. On the 15m, price is over MA7 (160.85), MA14 (160.70) and MA28 (160.84), by 0.4%, 0.5% and 0.4% All three are tightly stacked and turning up, and the last candles are a clean run of green into the 24h high. I don't want to buy the top of that run, I want it to come back to the stack. I'm watching volume. The 15m bar is 2.79K against MA5 2.66K and MA10 2.38K with 06:42 left, so the push is above both averages but still forming. The 1h bar is 12.87K against 8.80K and 8.64K with 06:37 left, also above both. Participation is picking up on the way up, which is what I want from a base, but it is still small next to the flush earlier in the week. The trade, buying the dip into the stack: - Entry: 160.60 to 161.00 (limit, needs a 0.3% to 0.6% dip) - Stop: below 159.90 - Target 1: 162.30 (~1.7R from 160.80) - Target 2: 163.60 (~3.1R) Invalid if the 15m closes below 159.90, because that loses the 1h MA28 and the whole stack together. My thinking is to stay small, since this is a TradFi perp with thin liquidity and price is already at the 24h high. Limit orders, small size, and no dip, no trade. #IMPACTbyTrade
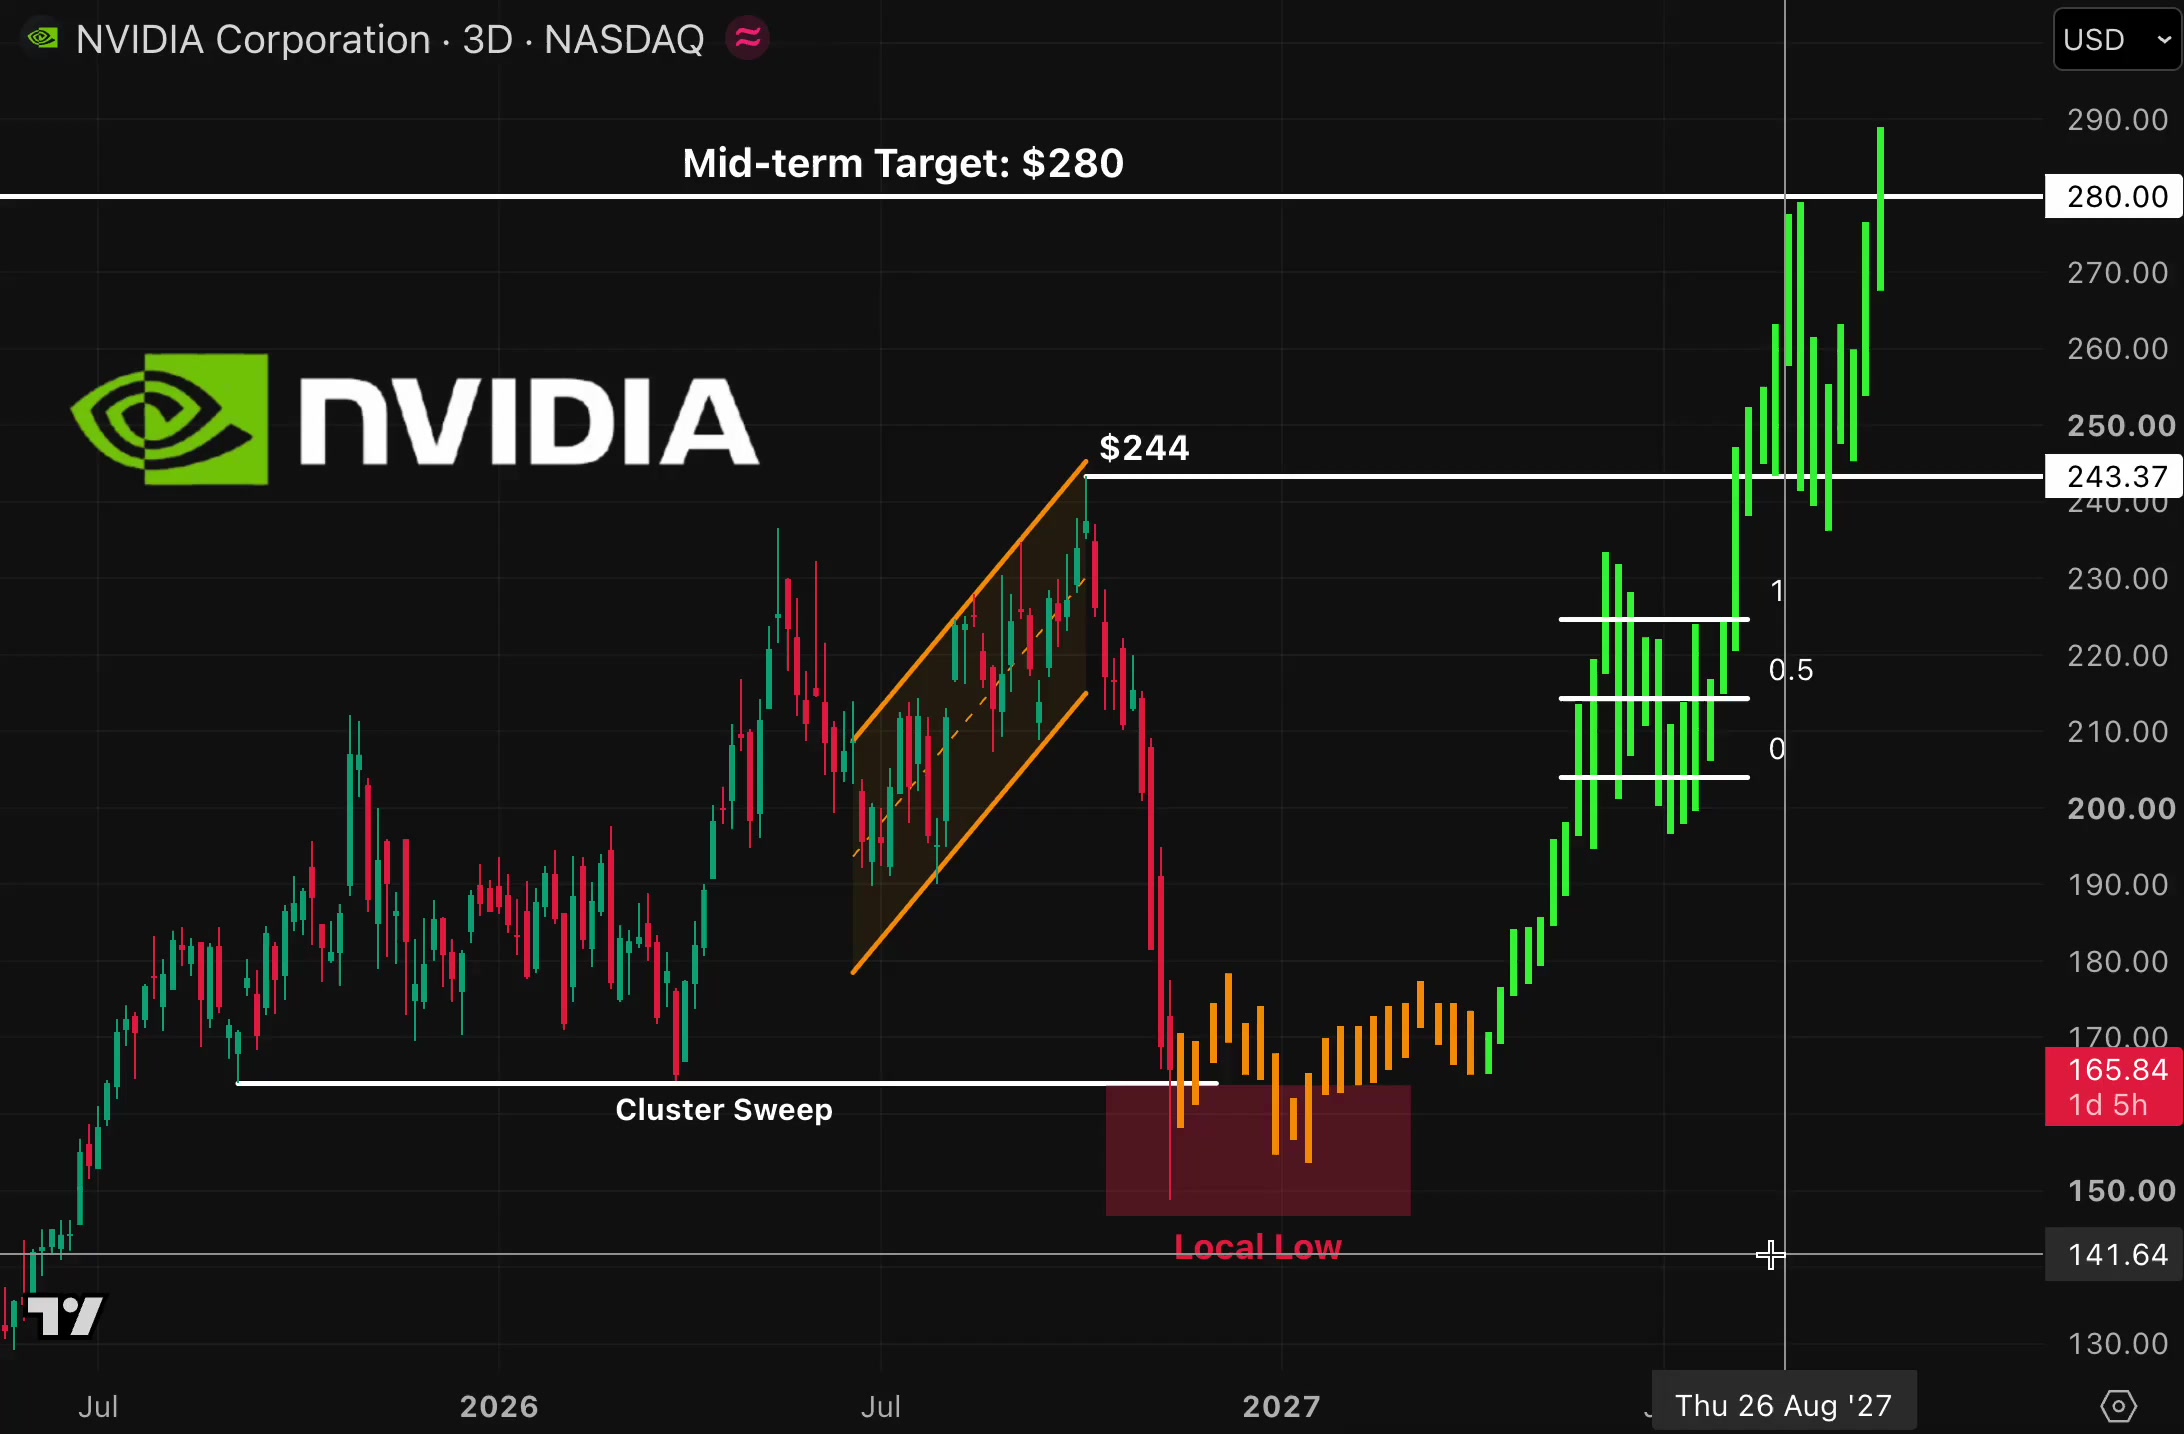
SOLANA ($SOLUSDT): Can Bulls Turn the Momentum Around? Solana is facing a challenging market environment, and traders are watching closely for signs of strength. Here are three things I am monitoring: Whether buyers defend the recent support area. Whether trading volume starts recovering. Whether SOL can build a stronger market structure. A recovery needs confirmation, not just hope. SOL community: Are you waiting for a bullish reversal or expecting more downside? #IMPACTbyTrade

$GRAMUSDT – SELLING PRESSURE IS STILL PRESENT, BUT I'M WATCHING THE $1.06 RECLAIM FOR A POSSIBLE RECOVERY $GRAM is approaching an important decision zone, and I'm paying close attention to how price reacts around the $1.01–$1.04 support area. The market is showing mixed signals. While the 4H structure has some recovery potential, the 1H and daily trends remain under pressure. I don't want to assume a bullish reversal before buyers prove they can take control. Market Overview GRAM is trading around $1.04–$1.05, with recent price action showing continued weakness after a significant decline. On the broader timeframe, the monthly performance remains negative, suggesting that sellers still have the advantage in the bigger picture. I'm monitoring the 1H and 4H charts closely. A sustained move above $1.063 would be the first indication that short-term momentum is improving. The next important resistance sits around $1.078, followed by the $1.098–$1.14 region. Volume Analysis GRAM has maintained meaningful trading activity, with recent market data showing approximately $105M in futures volume and $38M in spot volume over 24 hours in one reported snapshot. However, trading activity alone doesn't confirm accumulation. Recent order-flow data also showed negative cumulative volume delta, indicating that aggressive selling has been outweighing buying across tracked markets. For me, the important signal will be whether spot buyers start supporting the recovery rather than relying entirely on futures activity. My Trading Plan I'm interested in a potential recovery setup, but I want confirmation before committing to a position. Initial Entry Zone: $1.014–$1.035 Preferred DCA Level: $0.990–$1.010, only if support holds and buyers show a clear reaction. First Resistance: $1.063–$1.078 Primary Target: $1.098 Additional Upside Potential: $1.14–$1.185 if momentum strengthens and price establishes acceptance above the previous resistance zones. My preferred confirmation is a strong 4H recovery followed by a successful retest. I don't want to chase a sudden green candle without evidence that buyers are taking control. What Could Go Wrong? The biggest risk is another breakdown below the $1.014 support area. If sellers push price below this level, the $0.990 region becomes an important structural support to watch. A sustained 4H breakdown below $0.990 would significantly weaken my recovery expectations and could open the door to another downward move. I also want to see improving spot demand. If futures activity increases while spot buying remains weak, any recovery could struggle to maintain momentum. Risk management remains essential. I would rather miss an entry than hold a position through a confirmed structural breakdown. My Perspective GRAM is interesting because price is approaching a major support region while trading activity remains relatively strong. However, I don't see enough confirmation to call this a confirmed bullish reversal yet. My focus is on three things: 1. Whether $1.014–$1.035 attracts genuine buying interest. 2. Whether GRAM can reclaim $1.063 and challenge $1.078. 3. Whether spot volume starts supporting upward price movement. My expectation is a possible short-term recovery if buyers defend the current support region. A move toward $1.098 and potentially $1.14 becomes more interesting after resistance is reclaimed. For now, I'm staying patient. The support reaction and the $1.063 breakout will tell me much more than simply guessing the next direction. $GRAMUSDT #IMPACTbyTrade
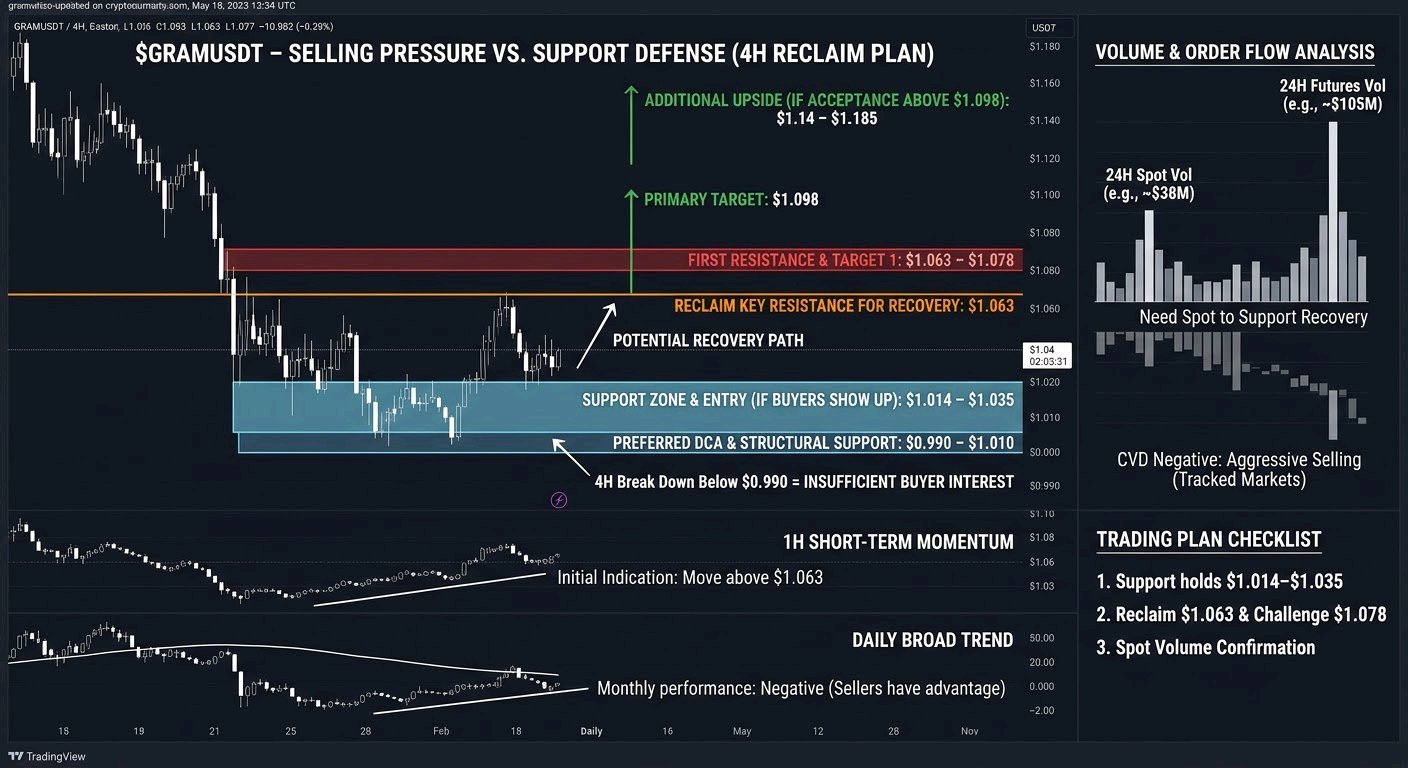

AVAX daily chart still locked in a clear downtrend
$AVAXUSDT is trading at 7.155 after a sharp -4.29% move, sitting well below the declining MA7, MA14 and MA28 on the daily timeframe. 📊 Market Structure: The chart shows a sustained series of lower highs and lower lows from the 11.654 area down to current levels. Price remains under the downward-sloping moving averages (MA7 at 8.050, MA14 at 8.189, MA28 at 8.597), confirming the bearish structure. A large red candle printed recently, followed by a small green candle near 7.155. 24h range sits between 6.725 and 7.573. 🎯 Potential Setup: Direction: WAIT Entry: unclear TP1: unclear TP2: unclear SL / Invalidation: unclear ⚠️ Confirmation: A clean break and hold below the recent 24h low of 6.725 with expanding volume would support continuation of the downtrend. Reclaiming and holding above the declining MA7 would be the first sign of potential stabilization. ❌ Invalidation: A sustained daily close back above the MA7 (currently 8.050) would weaken the immediate bearish structure and suggest the downtrend is losing momentum. 🧠 Risk Note: Position size carefully in this environment. The daily structure remains bearish, but sharp daily drops can produce short-term bounces. Always define risk before entry and avoid oversized positions. #IMPACTbyTrade
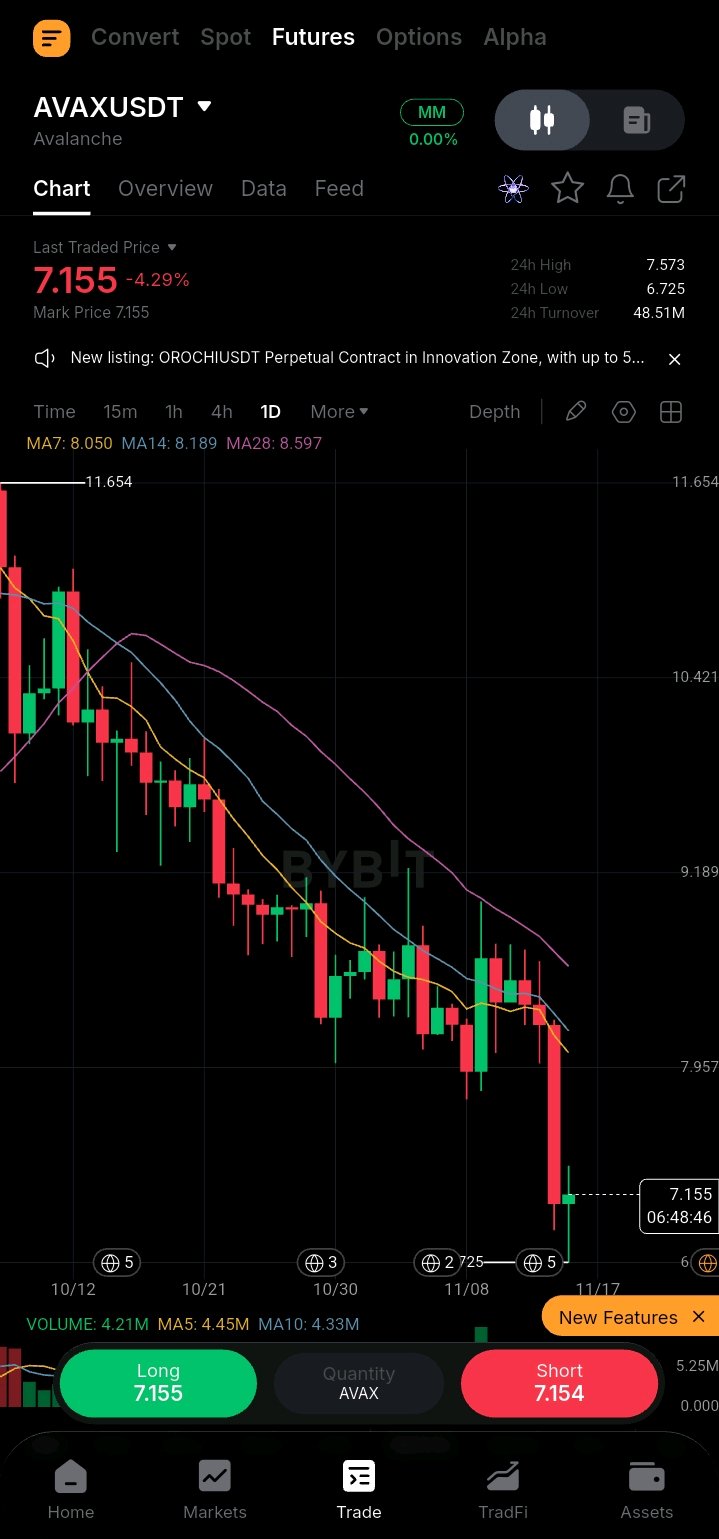
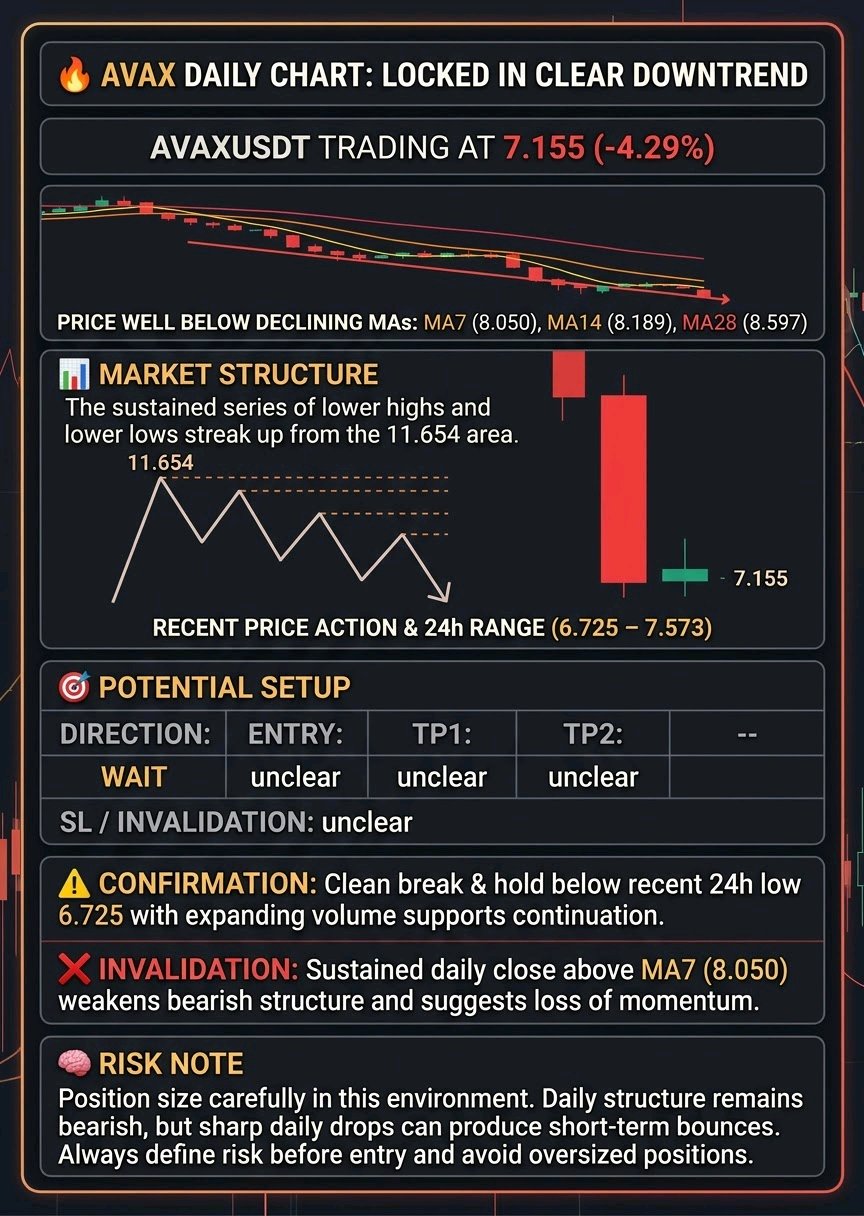
BR is trading near $0.4277 on Bybit, down roughly 1% on its exchange snapshot, while broader data shows a sharper daily decline. After pulling back from $0.47, the key test is whether buyers defend $0.416–$0.420. Market Snapshot CoinGlass showed an aggregate quote near $0.4415, while its Bybit exchange table showed $0.4277; I’m using the Bybit-specific quote for this trading read. CoinGlass reported a 24-hour range of $0.4164–$0.4732, market cap near $132.25 million, fully diluted valuation around $441.5 million, and spot volume near $1.06 million. Futures volume was about $15.66 million, almost 15 times spot turnover. CoinGlass lists 301.67 million circulating against a 1 billion maximum, though other trackers report a lower float. Treat the exact circulating figure cautiously; most of the maximum supply is not yet in circulation. Derivatives and Positioning Aggregate OI is $21.49 million, down 4.47%. Funding is positive near 0.025%, meaning longs are paying shorts. Liquidations were $48,900, about 96% from longs. Price weakness alongside positive funding and long liquidations suggests leveraged buyers have been caught leaning into the market. Bybit’s table showed BRUSDT futures volume near $1.29 million and OI around $1.89 million, down about 5.9%. Funding remains positive, so crowded longs may still need to unwind. A recovery with stronger spot volume would be healthier than a futures-only spike. Technical Structure Support sits at $0.420–$0.4164. A hold and reclaim of $0.435 would suggest buyers are absorbing supply. Above that, watch $0.450, then $0.470–$0.473 resistance. If $0.4164 fails on expanding volume, watch $0.400 and then $0.380. A quick reclaim after a wick below support would weaken the bearish case; repeated closes beneath it would strengthen it. Fundamentals and Product Activity Bedrock builds Bitcoin-focused DeFi infrastructure through uniBTC, brBTC and liquid-staking assets including uniETH and uniIOTX. The thesis is to make Bitcoin capital productive across DeFi and multiple networks. DefiLlama’s uniBTC dashboard reported TVL of about $247.8 million, but that figure had fallen around 29% over 30 days, from approximately $355 million on October 16 to $258 million on November 14. That contraction suggests capital has been leaving the product. The dashboard showed just $1,047 in 30-day uniBTC fees and revenue, with zero holder revenue. TVL is deposited capital, not sustainable income or direct value flowing to BR holders. Stronger fees and retained liquidity are needed. Token Utility and Governance BR is Bedrock’s governance and reward token. Locking it creates veBR, which provides voting rights over protocol decisions and gauge incentives. This utility does not mean holders automatically receive protocol revenue. Long-term demand depends on reasons to lock BR beyond emissions. Watch governance participation, product usage, liquidity and fee growth. Tokenomics and Unlock Risk BR has a 1 billion maximum supply. Tokenomics.com lists 20% strategic reserve, 20% team, 18.5% marketing, 14.5% future incentives, 12.5% seed investors, 5.5% airdrop, 5% IDO and 4% liquidity. Its vesting page lists a December 20, 2026 unlock of approximately 70.8 million BR, or 7.1% of total supply, allocated to insiders and private investors. Trackers disagree on supply and vesting, so verify the official schedule. Even so, a release this large relative to market cap is a material risk when spot liquidity is thin. Trading Scenarios Bullish case: defend $0.4164, reclaim $0.435 and then break $0.450 with rising spot volume. A sustained break above $0.473 could open $0.50. Bearish case: lose $0.4164 and fail to reclaim it. That would keep sellers in control and put $0.400, followed by $0.380, on the radar. Positive funding and weak spot turnover make a leveraged bounce vulnerable to another flush. Here’s the level map I’m tracking: - Immediate support: $0.420–$0.4164 - Resistance: $0.435, then $0.450–$0.473 - Bullish confirmation: sustained break above $0.473 with stronger spot participation - Bearish signal: breakdown below $0.4164 and failed reclaim My view is cautious. Bedrock has a BTCFi product suite and governance utility, but falling TVL, low reported fees, positive funding and the upcoming unlock deserve respect. I want spot demand before chasing a futures-led bounce. Are you watching $0.416 support as a potential entry, or waiting for a confirmed reclaim of $0.473?$BRUSDT #IMPACTbyTrade

Cardano's founder just declared the roadmap "finished" — the same week ADA crashed to $0.1429, 95% below its all-time high. Cardano is the peer-reviewed proof-of-stake Layer-1. On November 13, founder Charles Hoskinson said in a livestream titled "Finishing Cardano" that the original roadmap is complete. The market answered within a day: ADA lost 12.3% on November 14, closed at $0.1478, its lowest close since June 30, and tagged $0.1429 intraday. A year ago it was $0.5033 — over 3x today's price. The catalyst goes beyond that. A treasury request for a Copper strategic reserve of 22 million ADA closes today — a live vote on Cardano stockpiling its own token. Behind it: the Dijkstra hard fork with Leios scaling, testnet live since October, and Peras, due Q2 2027. Macro is hostile: the Fed has an 88.5% hike chance on December 8–9, Bitcoin trades near $65,000 after $1.91 billion left the spot ETFs in seven sessions, and Fear & Greed sits at 12. ADA fell more than twice as hard as Bitcoin. The squeeze setup is in the numbers: ADA is down 16.6% in seven days and 67.9% in a year, market cap $5.5 billion. Daily RSI hit 25.7 on November 14 — deep oversold. Open interest unwound to $284 million, down 13% in 24 hours, and funding is -0.0139% per 8 hours, about -15.2% annualised: shorts pay longs to stay short. Futures volume jumped 79% to $726 million; $6.3 million was liquidated in 24 hours, 95% longs. Weak hands are gone; the short book sits on the year's low. Technically, ADA sits 30% below its 50-day and 27% below its 200-day average — a stretched rubber band. The $0.1426–$0.1442 zone is the line: today's low and the June 30 close. Hold it and the bounce has room; lose it and $0.13s is next. Trade: LONG ADA $0.1500–$0.1530, stop $0.1425, below today's low. TP1 $0.1650 (1.5R), TP2 $0.1750 (2.6R), TP3 $0.1870 (3.9R). 24–48 hour swing; daily RSI, 50/200-day averages, funding, open interest. Bull case: RSI 25.7 with deeply negative funding is the classic squeeze setup — shorts pay to hold at the year's low, and stabilisation above $0.1500 forces covering into thin liquidity. If the Copper vote passes today, "finished" flips from surrender to completion. Bear case: the founder declaring victory with the token 95% below its high reads as capitulation. The Ethiopia rollout never happened, the Fed is about to hike, and ADA has shown zero relative strength. A daily close under $0.1425 invalidates everything and opens a fresh leg down. A: ADA squeezes back above $0.1650 this week — "finished" marks the bottom. B: $0.1425 breaks and ADA grinds toward $0.13 — the roadmap is done and so is the bid. Which side are you on? $ADAUSDT #ByXIMPACT #IMPACTbyTrade Trade idea, not investment advice — levels are conditional and can fail.
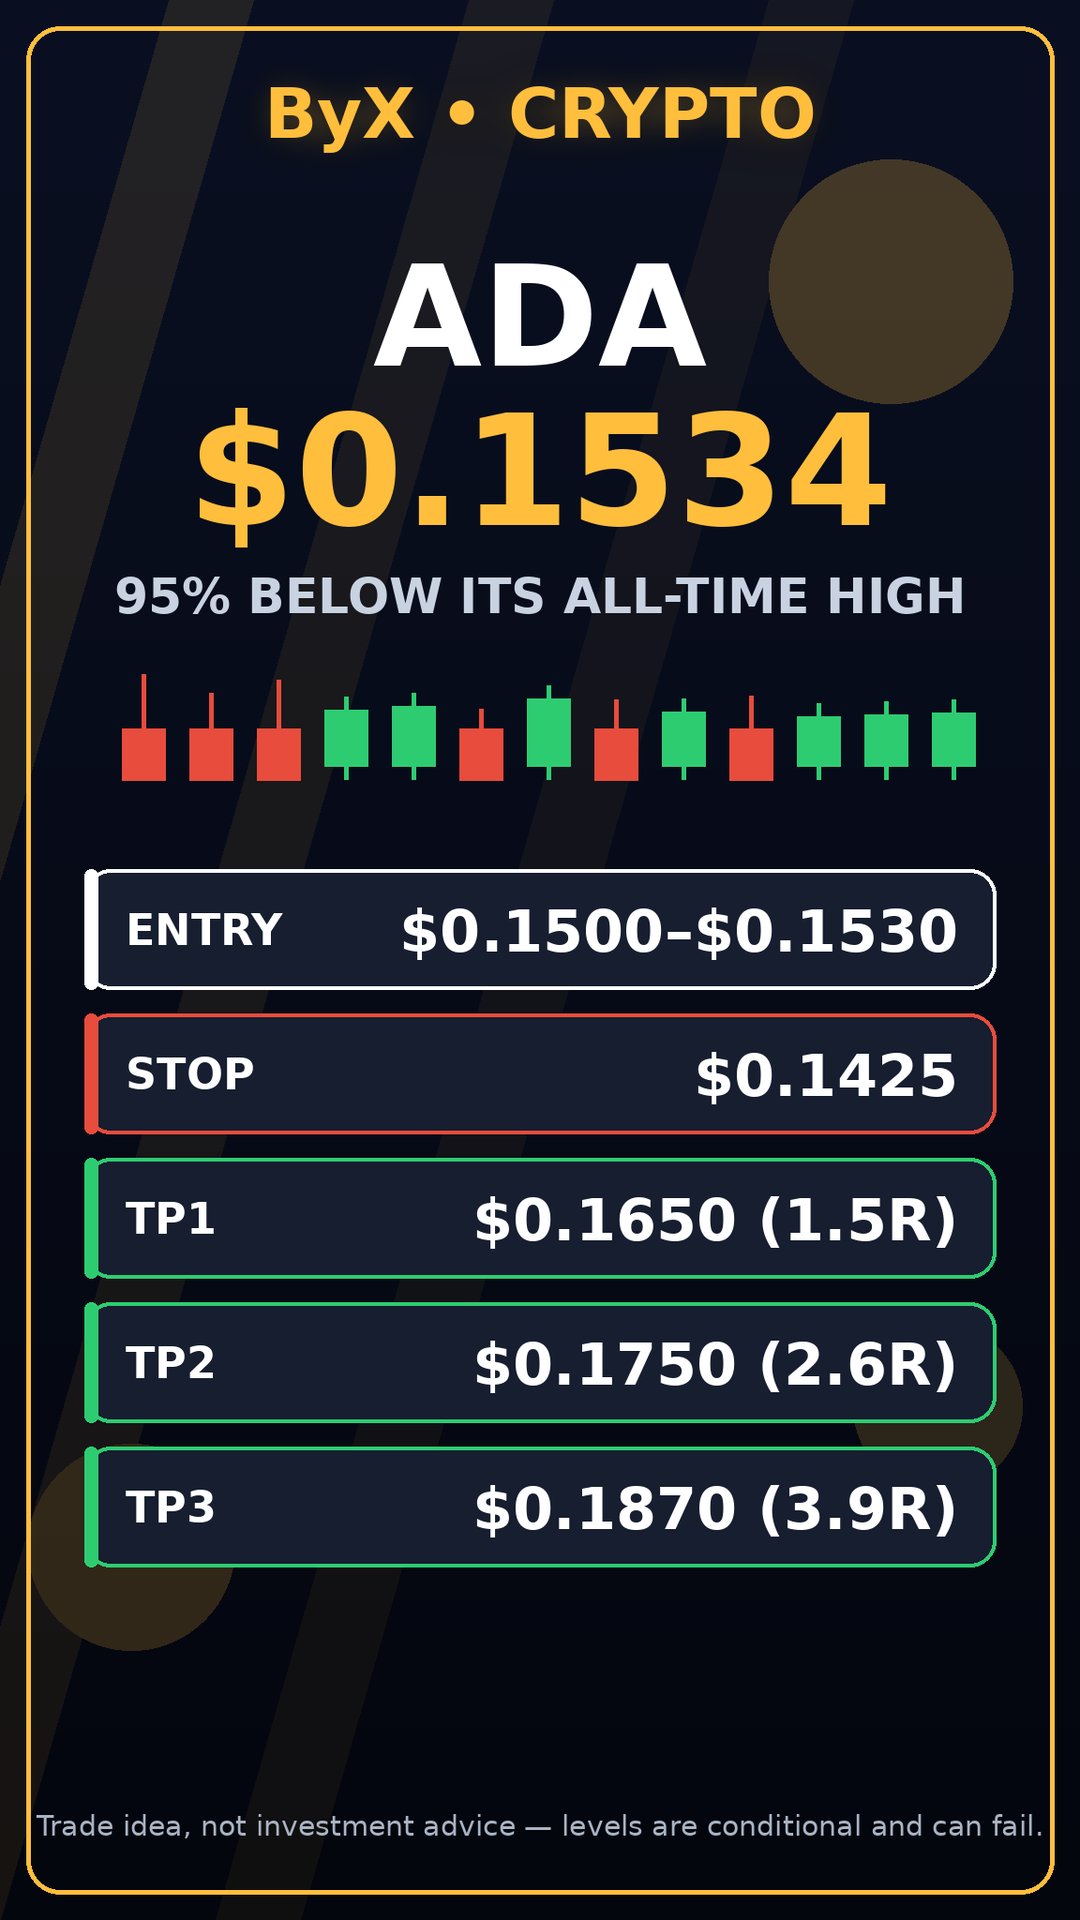
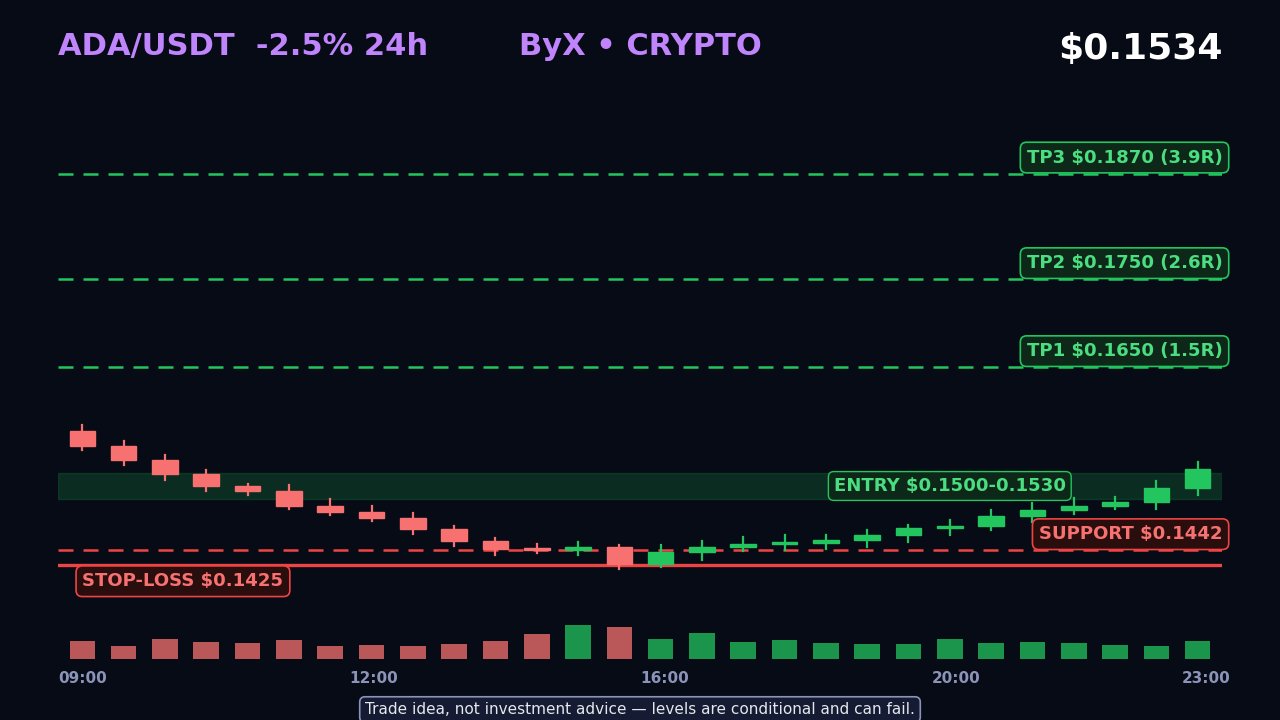

$GRAMUSDT just did something rare: every average agrees on the price. After sliding from 1.113 to 1.016 (about 8.7%), GRAM is sitting at 1.049 with the 7, 14 and 28-period MAs stacked at 1.051, 1.049 and 1.049. On the 1h chart, that's a market that has stopped disagreeing with itself. For most of this move, the 28 MA was a ceiling sloping down and every bounce died under it. Now it's flat, and price is sitting on it instead of below it. That's not a reversal. It's the end of the one-way pressure. What bothers me is the volume. The latest bar is 156K against a 5-bar average of 384K. The sell-off came on heavy volume. The recovery from 1.016 came on lighter, fading volume. Buyers stepped in, but they haven't paid for the move yet. The order book shows 91% bids, but I wouldn't lean on that. Bids can be pulled in seconds, and a lopsided book next to shrinking volume often means people are placing orders, not taking price. What I'm watching -Above 1.073: the 24h high and the first higher high since the drop. That's the real signal. - Below 1.016: the low gets swept and the recovery was just a pause. - 1.016–1.073: a range about 5.6% wide, and price is sitting in the middle of it. The part most people will skip Suppose GRAM breaks 1.073 and you chase it, with a stop under 1.016. Risk is about 5.3%. The first logical target, 1.113, is only about 3.7% away. That's roughly 0.7R, which is a bad trade even if you're right about direction. The better version is a reclaim of 1.073, a retest that holds, and a tighter invalidation. Without that, this isn't a setup yet. It's a compression, and a compression on fading volume resolves with a candle, not an opinion. I'm not calling it either way. I need a close above 1.073 with volume well above that 384K average, or a break under 1.016 that fails to bounce. #IMPACTbyTrade

Chainlink (LINK): Building the Infrastructure for the Next Generation of Global Finance 🌐 Chainlink is becoming much more than an oracle network. It is building essential infrastructure that could help connect traditional finance with the expanding blockchain economy. What Makes Chainlink Different? Blockchains cannot independently access real-world data or communicate seamlessly with other networks. Chainlink addresses this challenge through decentralized oracles, connecting smart contracts with external information, financial systems, and blockchain networks. Its ecosystem includes Data Feeds, Data Streams, and the Cross-Chain Interoperability Protocol (CCIP). Ecosystem Development Recent progress makes the bigger picture interesting. CCIP 2.0 introduced enhanced security, customizable compliance, and more flexible cross-chain transfers. Chainlink also introduced Fulcrum for institutional financing and collateral management. Additionally, its CCIP Vault Adapters enable DeFi vaults to accept deposits from more than 80 blockchains. Why Future Demand Matters As tokenized assets, stablecoins, and decentralized finance expand, reliable data and secure interoperability become increasingly important. LINK also has real ecosystem utility through service payments, node operator compensation, and network security. Risks Worth Watching Competition, regulatory uncertainty, technical vulnerabilities, and slower institutional adoption remain important challenges. Ecosystem growth does not automatically guarantee higher token value. My Final Perspective I believe Chainlink deserves attention because it is solving infrastructure problems rather than chasing temporary crypto trends. If blockchain adoption continues expanding, Chainlink could become an increasingly important part of that transformation. The real story is whether ecosystem usage and demand for LINK continue growing together. $LINKUSDT $BTCUSDT #IMPACTbyTrade