IMPACTbyTrade
真實交易。真實洞見。更大的影響力 (IMPACT)。適時分享您的持倉、交易紀錄以及對市場的分析,並加上 Cashtag。原創見解與真實互動比單純的發文數量更為重要。符合資格的創作者可競逐每週前 100 名的 USDT 獎勵。須符合資格要求、最低 IMPACT 分數及活動條款。

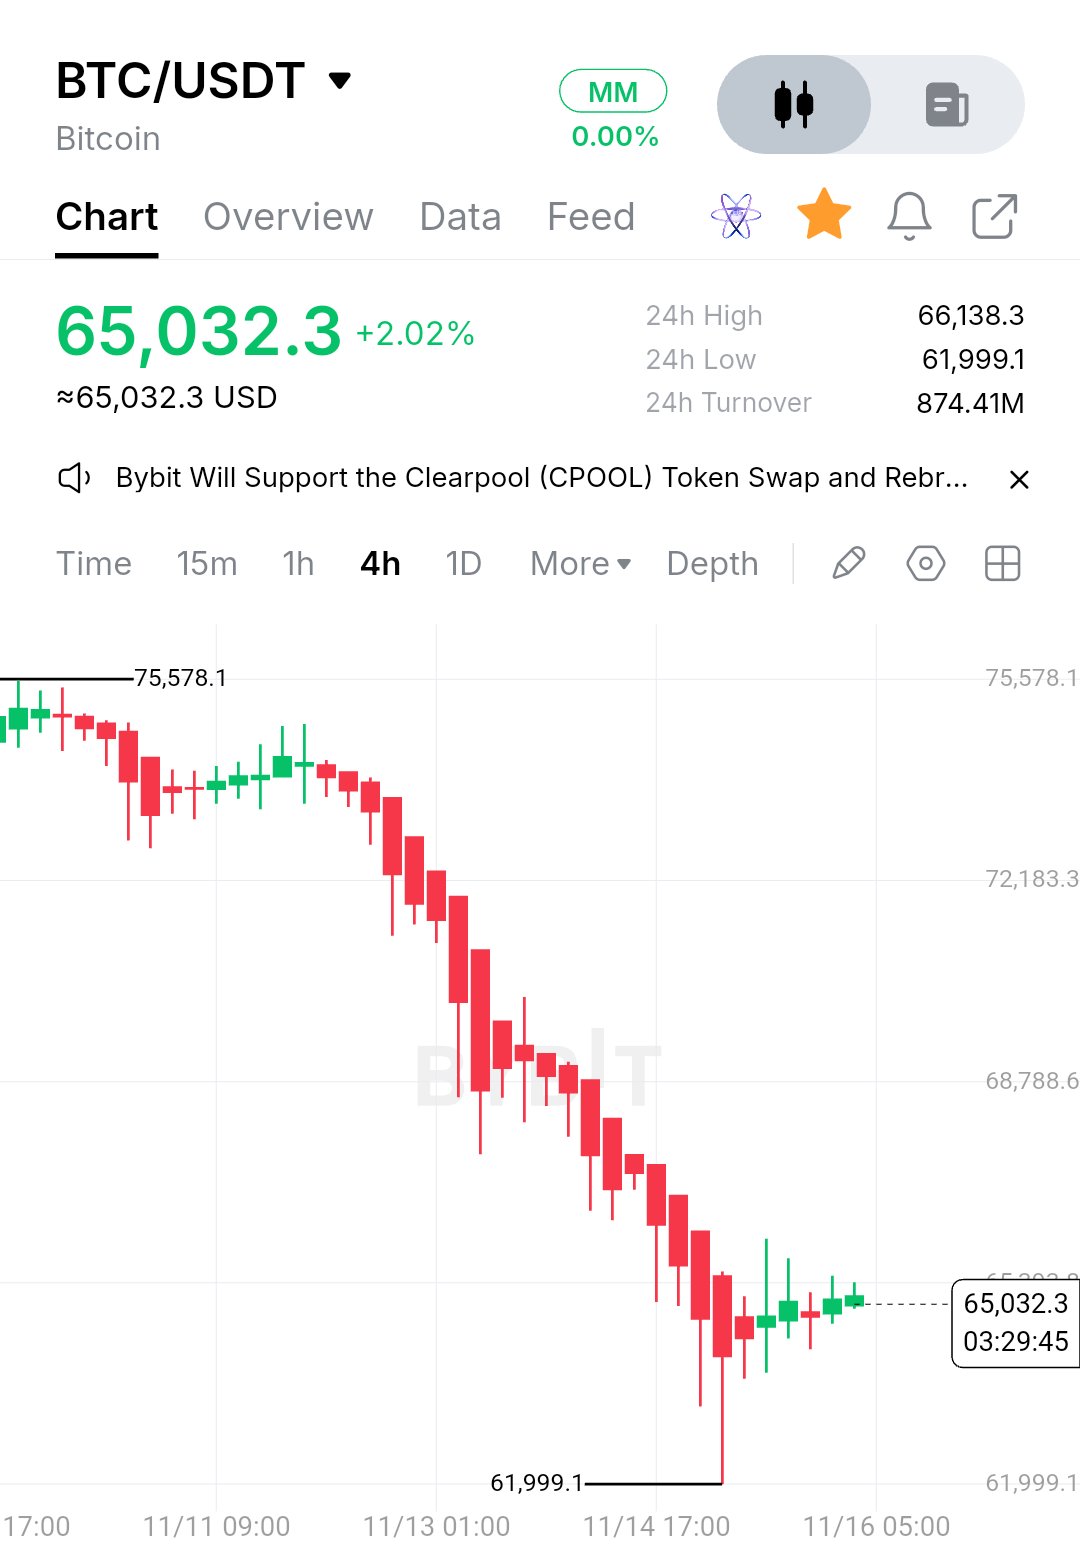
$BTCUSDT — The sell-side expansion has slowed, but Bitcoin has not yet proven a structural reversal. Bitcoin is currently trading around $65,032, showing a short-term recovery of approximately 2.02%. However, looking at the 4H chart, the broader structure remains under pressure after an aggressive bearish displacement from the $75,500 region. 1. MARKET CONTEXT & PRICE ACTION BTC experienced a sustained downside move, breaking through several intermediate support areas without establishing meaningful bullish reactions. Previous demand failed to absorb the selling pressure, allowing sellers to maintain control and push price toward the $61,999 liquidity zone. The reaction from $61,999 is now worth watching. Price has recovered toward $65,000, suggesting that buyers are beginning to respond after the recent sell-side expansion. Nevertheless, this recovery currently looks more like a relief bounce than a confirmed change of market structure. On the 4H timeframe, the dominant structure remains bearish, with lower highs and lower lows still defining the broader move. The immediate objective for buyers is to reclaim nearby resistance and establish a higher low. 2. BUYER VS. SELLER BEHAVIOR The $61,999 area represents an important downside reference. The sharp rejection from this region suggests that sell-side liquidity may have been taken before buyers stepped in. But one bullish reaction does not automatically establish a reversal. For buyers to regain control, BTC needs to: • Maintain acceptance above the $64,000–$65,000 region. • Break and hold above the $65,400–$66,150 resistance area. • Form a higher low on the 4H timeframe. • Demonstrate bullish displacement rather than weak, overlapping candles. If these conditions develop, the recovery could gain structural credibility. On the other hand, repeated rejection around $65,400–$66,150 would indicate that sellers are still defending the supply area. 3. TARGETS & UPSIDE CHECKPOINTS If buyers successfully reclaim nearby resistance, these are the important structural checkpoints: 🎯 $65,400–$66,150: First resistance and immediate recovery confirmation zone. 🎯 $68,000–$68,800: Next major upside checkpoint, approximately 4.6%–5.8% above the current price. 🎯 $70,000–$72,180: Broader recovery objective, approximately 7.6%–11% upside if bullish momentum continues. 🎯 $75,500: Previous major swing region and a potential larger-scale recovery objective. These are conditional technical objectives, not guaranteed price destinations. Each level requires acceptance and confirmation before considering the next. 4. RISK MANAGEMENT & INVALIDATION The bullish recovery thesis depends heavily on BTC maintaining the demand established around $61,999. A decisive 4H breakdown below $61,999, particularly if followed by a failed retest, would invalidate the immediate recovery setup and expose Bitcoin to further downside price discovery. Likewise, rejection from $65,400–$66,150 without a successful reclaim would weaken the short-term bullish argument. Avoid chasing green candles into resistance. Let price establish its direction, identify the liquidity sweep, and wait for confirmation through market structure. 5. FINAL THOUGHT Bitcoin has shown its first meaningful reaction after a substantial bearish expansion, but the market still needs to prove that buyers can do more than temporarily slow the decline. The distinction between an asset's long-term potential and a trade's immediate probability is important. Believing in Bitcoin does not mean ignoring bearish structure, and respecting bearish structure does not mean abandoning bullish opportunities. Trade the confirmation, respect the invalidation, and let price action determine the bias. #IMPACTbyTrade

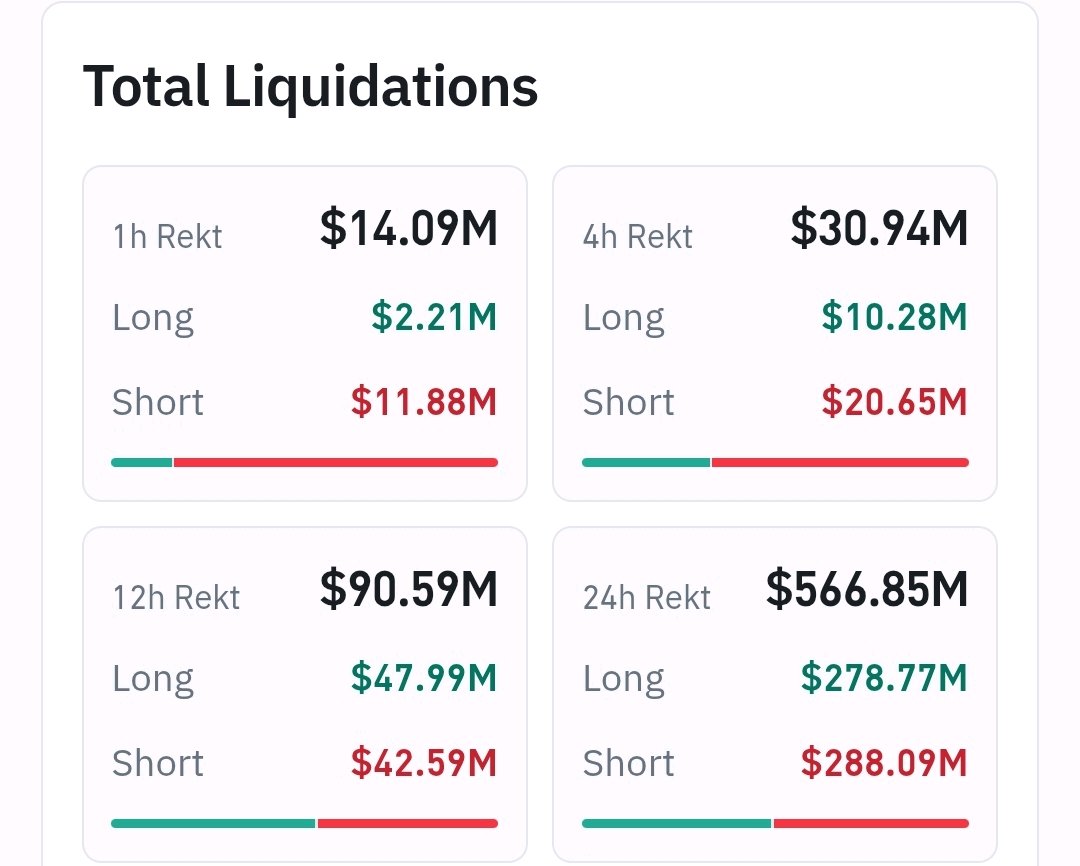
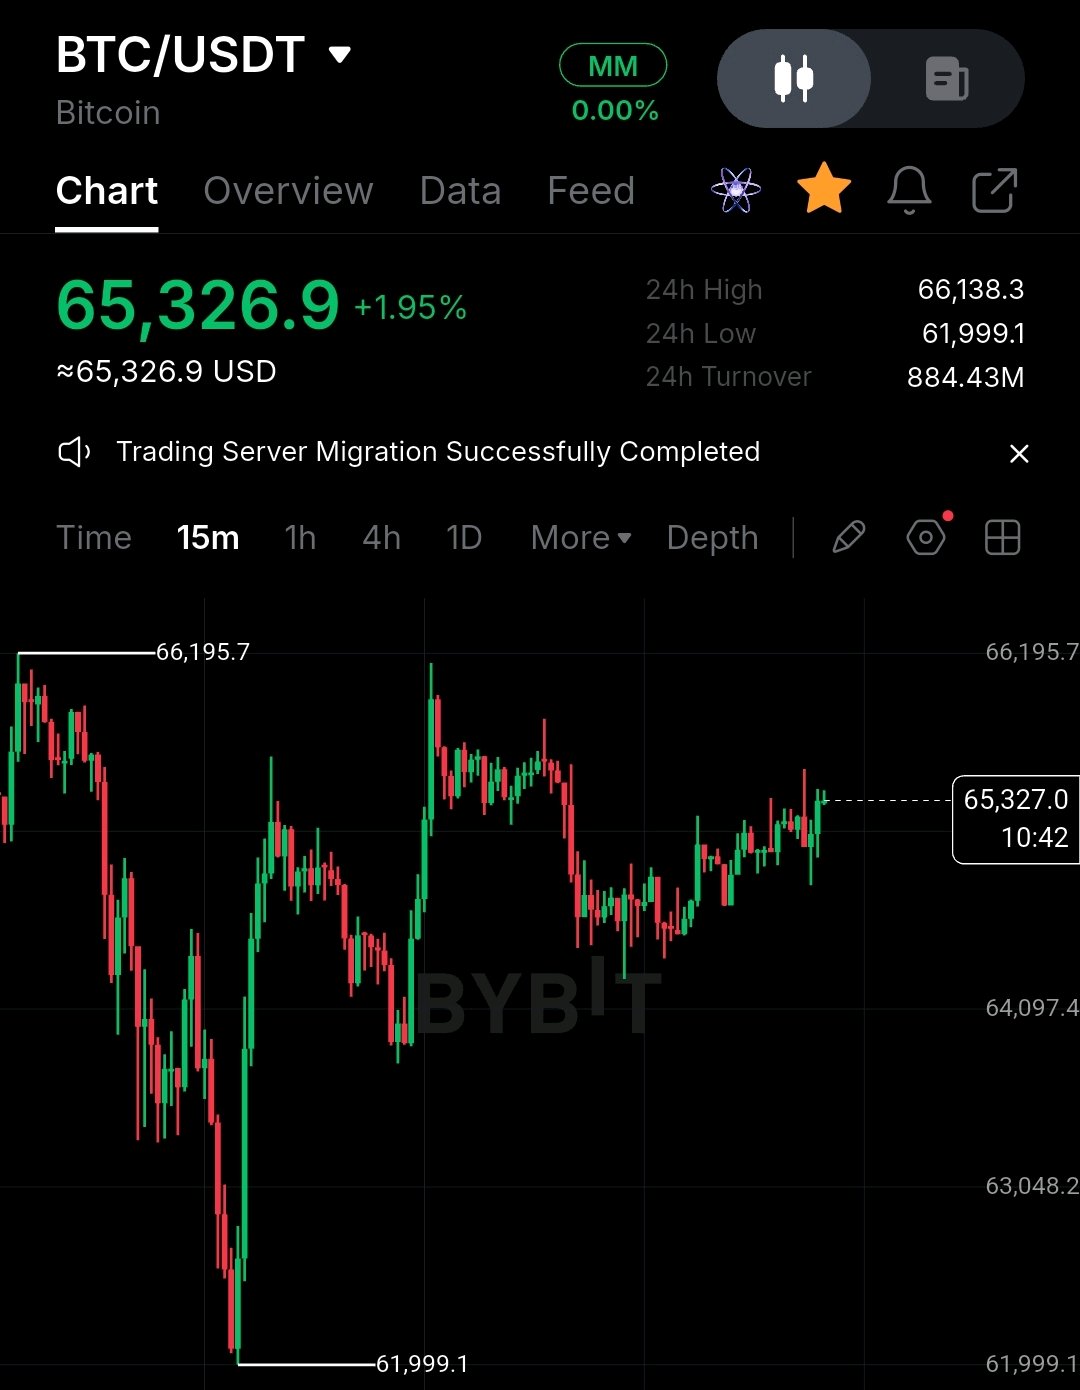
昨天我寫關於市場動態時,約有 19.3 億美元的加密貨幣期貨部位遭到清算,其中大部分是多單。 今天過去 24 小時內約有 5.6 億美元遭到清算,目前多單與空單的比例相當。這是在市場小幅回升之後的情況。$BTC 從約 62,000 美元反彈至近 66,000 美元,目前在 65,300 美元附近交易。而 $ETH 則從約 1,710 美元回升至 1,830 美元左右。 #IMPACTbyTrade $BTCUSDT $ETHUSDT

If you think $HYPEUSDT has permanently topped just because the rest of crypto is digital trash, take a hard look at its ever expanding fundamentals Why does this matter? Because Hyperliquid is a revenue machine where every dollar of collateral and every dollar of trading volume contributes to deflationary $HYPEUSDT buybacks More adoption → less circulating $HYPE overtime. Its that simple and no other asset has this. $TSLA ran hard off its early-November low, broke the prior swing high, and is now pulling back. I'm leaning long, but I'm not buying here. I want price to come down into a specific pullback zone first. Chasing the middle of a pullback is how you get a bad entry. The drop from the recent high looks like a retracement inside the up-leg, not a trend change. The 12h still prints higher lows. Why the zone matters: - The 4h, 12h and daily moving averages stack at the same level - The 62% retracement of the last up-leg lands there too - Recent equal lows sit just below it Four separate reasons on one shelf make a bounce there mean more. The ICT read: those equal lows hold a pool of stop orders. A sweep through them that snaps back into the discount zone is the setup I'd take. Targets are the liquidity resting above the recent swing highs. Where I'm wrong: if price gives up the 12h swing low, the daily 200-day average and the bottom of the optimal retracement band together, the pullback read is dead and I step aside. Risks: Nvidia earnings on Nov 18 and December rate-hike worries could shake AI and high-beta names. Thin weekend pricing means the Monday open can gap. Not investment advice. All decisions and responsibility are your own. $BTC has only been oversold on the weekly 4 times in it's entire history 📉 But, an oversold weekly RSI hasn't always marked the final bear-market bottom. 📉 2015: BTC bottomed 210 days later. 📉 2019: Oversold RSI coincided with the bottom. 📉 2022: BTC bottomed 147 days later. 2026: Already 280 days since the initial oversold signal, with a definitive bottom still to be confirmed. When BTC first became oversold this cycle, it was trading around $60,000. Yesterday's flush saw BTC trade as low as $62,000, meaning price has spent 280 days without establishing a sustained recovery. This is the longest period between an initial weekly oversold RSI signal and a confirmed cycle bottom among the historical examples examined. Only in 2019 did the oversold RSI coincide with the final bottom. The other examples tell us, an oversold weekly RSI doesn't guarantee an immediate reversal. Historically, it has often been followed by months of further consolidation or downside before a definitive bottom forms. #IMPACTbyTrade
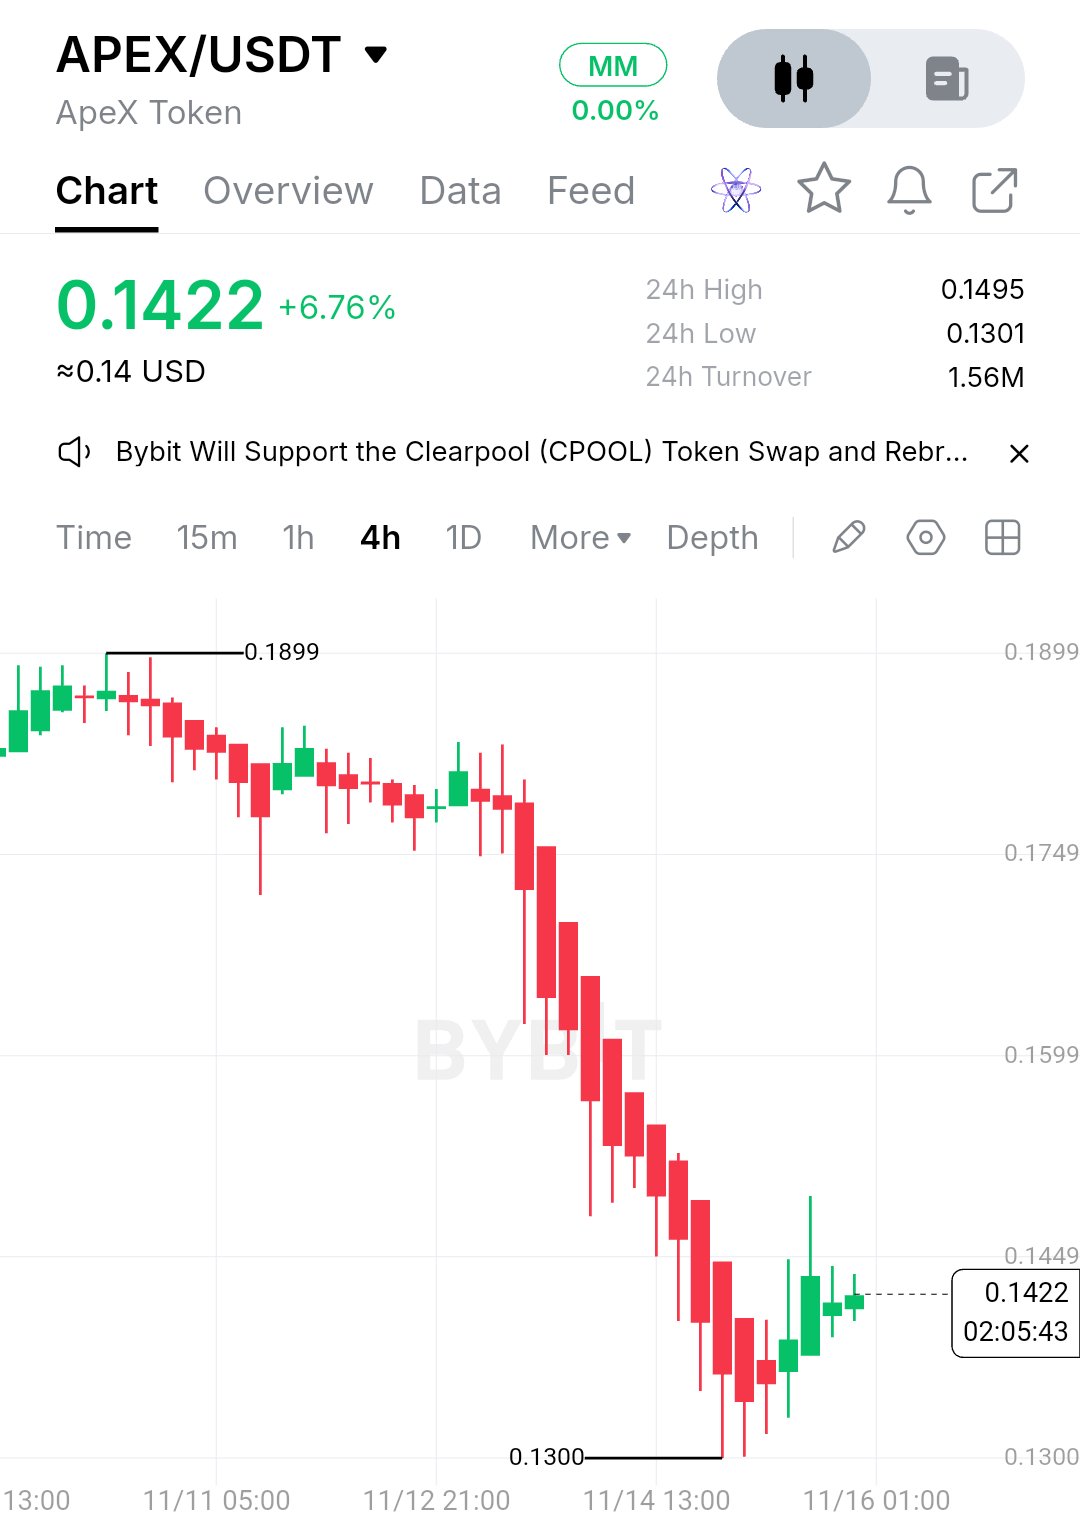
$APEXUSDT 是一種基於以太坊的代幣,而不是獨立的區塊鏈。在檢視其經濟模型時,這一區別至關重要。沒有原生的 APEX 網路交易數、交易中位數、礦工手續費收入或算力數據可用於與區塊獎勵進行比較。 因此,以支付用途來衡量該資產並不合適。APEX 與 ApeX Protocol(一個去中心化衍生品交易生態系統)掛鉤。 APEX 具備質押、治理和協議激勵等效用,這才是重點。代幣持有者可以賺取 APEX 獎勵,但目前的驗證者收入、質押收益率和手續費與獎勵比率並未由現有數據獨立建立。APEX 沒有挖礦減半或原生區塊獎勵削減機制需要計入價格。 我不認為這是一種設計缺陷。當有人引用交易次數時,對於此代幣而言,真正重要的數字是:實際的協議活動、手續費產生情況,以及這些活動是否為 APEX 創造了可持續的需求。 最新的市場數據顯示,APEX 價格約為 0.1422 美元,24 小時內上漲約 6.8%,但七天內仍下跌了 22.6%。4 小時線圖顯示從 0.18 美元區域出現急劇拋售,跌向 0.1300 美元,隨後出現反彈。 其背後是 ApeX Omni 在永續合約市場的擴張,包括加密貨幣、美股和預測市場。據報導,在 10 月 22 日的去中心化交易所(DEX)市場比較中,ApeX 的 30 天交易量記錄為 116.61 億美元。這解釋了市場的關注度,而非保證代幣價格上漲的催化劑。 在經歷如此幅度的波動後,處於區間震盪之中,我不會做出方向性的判斷。以下是關鍵點位: 高於 0.1495 美元:若日線收盤價高於此水準,則將近期高點壓力轉化為支撐測試。下一個主要阻力區在 0.1599 至 0.1749 美元左右。 低於 0.1300 美元:若日線收盤價低於此水準,則表示反彈失敗。下一個下跌區域需要新的價格發現。 0.1300 至 0.1495 美元:這是當前的即時區間,寬度約為 15%。 觀察窗口:未來幾個交易日的收盤情況。APEX 需要持續的協議活動和更強的買盤壓力來支撐復甦。如果價格有效跌破 0.1300 美元,則突破看漲觀點失效。 #IMPACTbyTrade

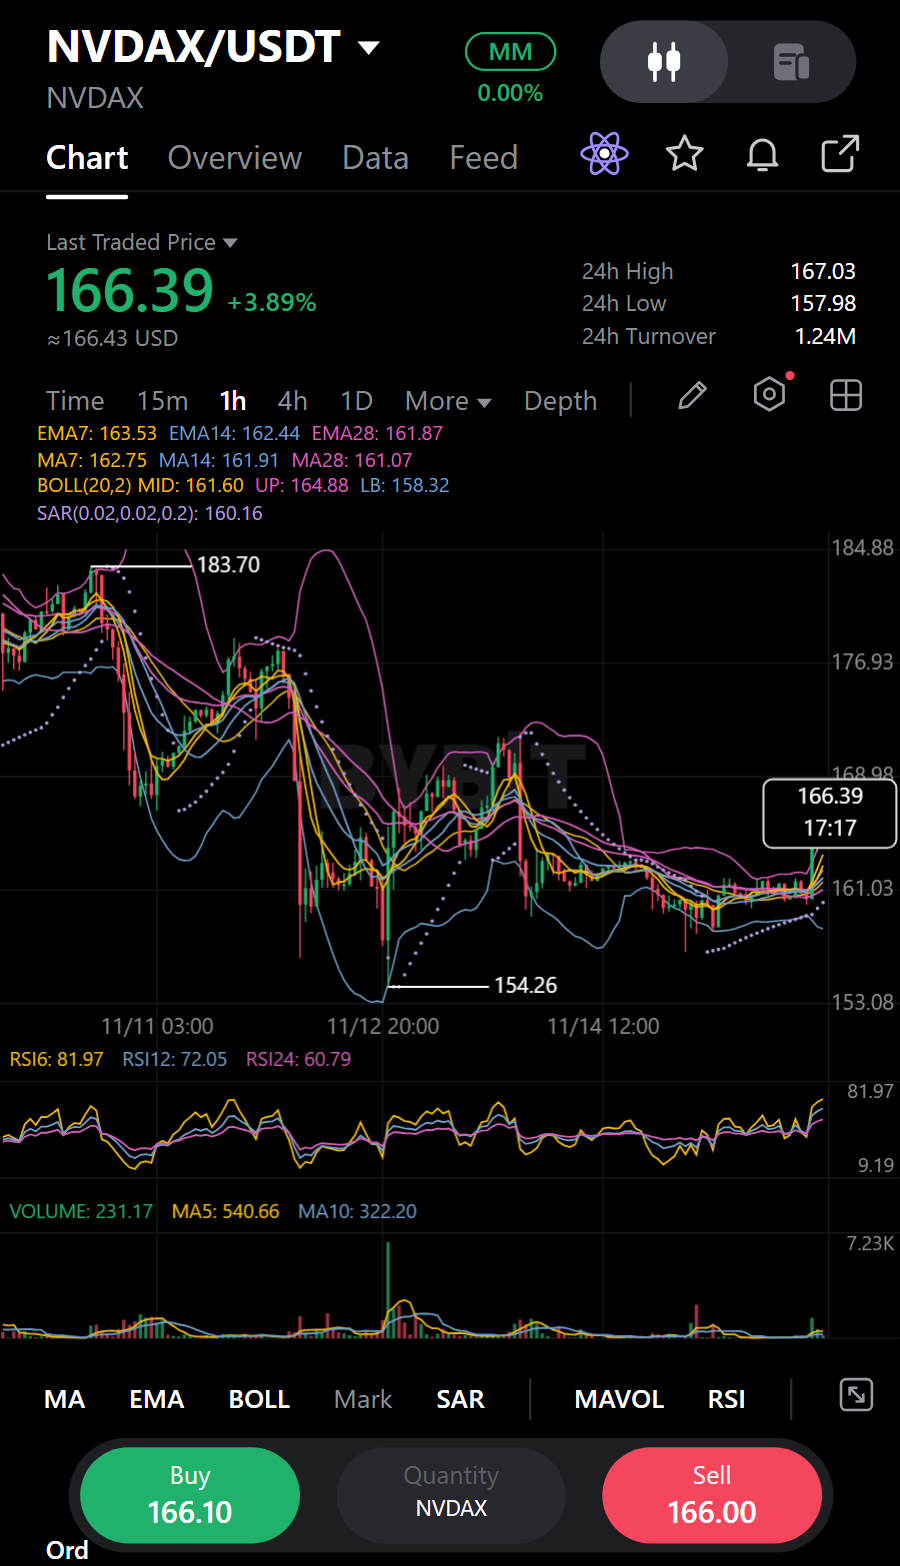
NVDAXUSDT:買方有待守住的收復價位
一個銳利的綠色小時線爆發讓 $NVDAXUSDT 回到了均線集群上方。01:00 的紅K收在 160.39;接著 02:00 的K線從 160.39 急升至 166.52,最後收在 164.04。03:00 的綠K隨後以 165.4 收盤。這看起來像是買盤強勢介入,並持續施壓,而不是將漲幅全部吐回。 價格目前位於 MA7、MA14 和 MA28 之上,支撐了看漲的論點,儘管均線之間靠得還很近,尚未明顯拉開。24 小時內的走勢是正向的,成交量也比前一日增加,為這波漲勢增添了參與度。我喜歡這樣的背景,但早先的小K線活動量較輕,所以我希望這次突破能證明它站得住腳。 我的做多計畫是觀察價格是否能守住或回測 165.8575 - 166.7625 的進場區;我持有 NVDAX 現貨,而原生持倉卡(native holding card)則載明了部位細節。若價格跌破 163.595 的停損點,這次嘗試就會失效。TP1 為 168.5725,TP2 為 170.835,從區間中間算起,風險報酬比分別約為 0.8:1 和 1.7:1。 只要價格維持在失效水平之上,且買盤能守住回測,我就傾向看多;若失守該水平,我的觀點就會改變,而不僅僅是讓這個策略看起來沒那麼漂亮而已。這波爆發也增加了波動風險,所以我會謹慎執行,避免在掛單稀薄時進場,也不會預設第一波推升就會持續走高。 交易計畫 (做多 / 看漲): • 支撐: 157.98 / 154.26 | 壓力: 167.03 / 178.7 • 進場區: 165.8575 - 166.7625 • 停損 (SL): 163.595 • 目標: TP1 168.5725 | TP2 170.835 你會信任這次的大量突破,還是會等待進場區站穩後再進場? 僅為個人觀點,非投資建議。#IMPACTbyTrade


BARD 目前交易價格接近 $0.1038,在過去 24 小時內下跌超過 14%,價格區間為 $0.0996–$0.1274。價格已回落至盤中低點附近,在 11 月 18 日供應釋放前,多頭必須守住 $0.100 的關卡。 市場快照 CoinGlass 的最新快照顯示,市場總市值接近 4,169 萬美元,完全稀釋估值約為 1.038 億美元。流通供應量估計為 3.9656 億,固定上限為 10 億。現貨交易量約為 1,406 萬美元,而合約交易額達到 1.0948 億美元,幾乎是現貨活動的 7.8 倍。 衍生性商品正在推動大部分短期波動,而現貨流動性相對稀薄。若現貨買盤未能回流,主要由永續合約主導的反彈可能會消退。BARD 目前也較其 2026 年 3 月的歷史高點 $1.716 下跌了約 94%,整體趨勢已受到嚴重破壞。 衍生性商品與持倉情況 未平倉合約總額 (OI) 約為 1,953 萬美元,24 小時內下降了 25.16%。資金費率極度負值,接近 -0.2183%,意味著空頭正在向多頭支付費用。清算總額約為 334,600 美元,其中約 251,400 美元來自多頭。現貨資金流為負值,約流出 120 萬美元,而期貨資金流則顯示約 370 萬美元的流出。 Bybit 的 BARDUSDT 永續合約快照顯示價格接近 $0.1042,未平倉合約 (OI) 約為 477 萬美元,下降了 26.2%,資金費率約為每四小時 -0.0937%。各交易所的資金費率不同,因此請使用 Bybit 的即時數據進行執行,而不要將加權平均費率視為其合約的精確指標。多頭部位已被迫出場,且持有空頭部位的成本昂貴。這可能會產生軋空潛力,但未平倉合約 (OI) 的下降和現貨資金流為負值並無法證實有新的買盤累積。 技術結構 目前的直接防禦區間為 $0.1000–$0.0996。CoinGlass 也指出在 $0.1000 附近有期貨買盤牆。如果該價位守住且價格收復 $0.1070,將出現初步的穩定跡象。若突破該點位,$0.1100 和 $0.1139 將是下一個阻力區。 若 $0.0996 被果斷跌破,需觀察 $0.0964,隨後是 $0.0930。若價格在留下影線後迅速回升至 $0.1000 之上,將減弱看跌訊號;若反覆收盤於該價位之下,賣方將繼續掌握主導權。 基本面概況 Lombard 正在構建以比特幣為核心的鏈上金融基礎設施。其旗艦產品 LBTC 是一種流動性比特幣資產,旨在讓持有者在無需出售 BTC 的情況下參與 DeFi。它致力於透過 DeFi 整合使比特幣成為生產性抵押品。 LBTC 是與比特幣掛鉤的資產;BARD 則是獨立的治理代幣。BARD 並無比特幣支持,也不代表對 BTC儲備的所有權。Lombard 的 LBTC 收益策略已經演變:官方文檔描述的是一種生成選擇權權利金的備兌看漲期權 (covered-call) 策略,而非依賴早期的比特幣質押模型。收益率是變動的,並無保證。 該項目的論點取決於 LBTC 的採用率、流動性和協議費用。僅靠鎖倉量 (TVL) 是不夠的:產品增長並不自動產生對 BARD 的需求。 代幣用途與代幣經濟學 BARD 是 Lombard 的治理代幣,其用途旨在隨著協議的發展而演變。其早期的質押計劃已經結束,空投領取也已停止。持有 BARD 並不會自動產生收益或分享協議收入。 官方分配比例為:生態系統 35%、核心貢獻者 25%、基金會 20% 以及早期投資者 20%。最大供應量固定為 10 億,剩餘代幣計劃在啟動後 48 個月內逐步解鎖。因此,對於相對較小的市值而言,供應釋放的時間點至關重要。 即將到來的解鎖風險 Tokenomics.com 列出下一次代幣釋放時間為 11 月 18 日:約 2,281 萬枚 BARD,相當於總供應量的 2.3%,以及按當前估值計算,約為目前市值約 5.6%。接收對象包括內部人士、社群、私人投資者和基金會。這並不保證會導致拋售,但會產生短期的供應壓力。 交易情境 看漲:守住 $0.0996–$0.1000,收復 $0.1070 並在更強的現貨成交量配合下突破 $0.1139。極端的負資金費率可能會推動空頭回補行情,目標位上看 $0.1200。 看跌:跌破 $0.0996 且無法收復。這將下探至 $0.0964,然後是 $0.0930。在解鎖前若現貨持續流出,可能會削弱任何由期貨推動的反彈。 這是我正在追蹤的點位圖: - 直接支撐:$0.1000–$0.0996 - 阻力位:$0.1070,隨後是 $0.1100–$0.1139 - 看漲確認:成交量上升並持續突破 $0.1139 - 看跌訊號:跌破 $0.0996 且無法收復 我的立場是防禦性的,但仍存在軋空潛力。儘管資金費率極端負值且未平倉合約 (OI) 大幅收縮,但現貨資金流依然疲軟,且 11 月 18 日的解鎖日臨近。我傾向於等待 $0.100 守住且買方收復 $0.107 後,再考慮進場交易。你會冒險在支撐位附近提前進場,還是會等到解鎖後再進行確認呢?$BARDUSDT #IMPACTbyTrade

$XRPUSDT 這是一個買入機會還是一個警訊? XRP 經歷了巨大的賣壓,因此市場確認顯得格外重要。 我正在觀察: XRP 是否能守住近期的低點。 買方是否會帶著更強勁的成交量回歸。 加密貨幣整體市場是否開始復甦。 在沒有確認訊號的情況下試圖接住下墜的市場可能會有風險。 聰明的交易者會觀察價格走勢,而不是盲目跟隨情緒。 XRP 的持有者們,你們是選擇保持耐心,還是在等待更強勁的復甦訊號? #IMPACTbyTrade

🚀 SpaceX xStock 的圖表在頭條新聞出現前就閃爍著多空交織的訊號,最近回調期間在 $SPCXXUSDT 的日線圖上發生了重要的事情。在從 167.05 高點急劇下跌後,價格在 120.55 找到了堅實的支撐。 從該低點的反彈非常強勢,但正如技術面所暗示的那樣,它精確地在 135.35 的 1.0 斐波那契延展位和 138.61 的 1.618 水平處停滯了。 50日EMA 位於更高的 144.05 位置,依然充當著天花板。 圖表捕捉到的價格在 139.13 附近,日線蠟燭圖尚未收盤,RSI 指標正在回升至 50 中間水平。 但真正的故事在流動性熱圖裡。 SPCXX 的 Coinglass 清算熱圖顯示,目前價格上方堆積了兩個巨大的槓桿簇。 140 處有大量的流動性集中,而 138 處還有另一個密集的區間,這些都是槓桿倉位堆積的區域,它們對價格走勢具有磁吸效應。 當價格接近這樣的區域時,市場往往會獵殺流動性,掃掉止損並迫使清算,然後才會決定真正的方向。 近期的頭條新聞增加了波動性的背景。SpaceX 正在處理一波內部人士解鎖,包括 5910 萬股的釋放,以及最近市場上出現的更大規模的 3.19 億股解鎖。 公司還為美國太空軍發射了一項機密國家安全任務,這為盤面增加了基本面的雜訊。 但這才是我最感興趣的地方 🤔 圖表在 138-140 區間的拒絕走勢以及清算熱圖,早在解鎖消息傳出之前就已經說明了同樣的故事。 這就是為什麼要同時研究價格結構和持倉情況,價格行為揭示了買家在何處失去控制,而熱圖則揭示了市場在何處最脆弱。 圖表無法預測特定事件,但它們可以警告我們,當槓桿以一種極有可能引發劇烈波動的方式堆積時。 今日交易視角 SPCXX 現在陷入了兩股力量之間。熱圖顯示,如果價格能突破 140 並站穩,上方的流動性可能會推動空頭擠壓,目標指向 144.05 的 50日EMA 和 143.88 的 2.618 斐波那契延展位。 但更大的機會在下方 🙂↕️ 如果 138 的支撐失敗,且熱圖下方的流動性簇被掃蕩,我看到了回到 134-135 區間的清晰路徑,如果拋壓加劇,最終會指向 120.55 的主要需求區。 那才是我對潛在多單設置特別感興趣的地方。 我不會僅僅因為價格到達了我的區域就買入。 我想要看到有意義的看漲反應、市場結構的轉變,以及買家能夠捍衛新的更高低點的證據。 只有那樣,我才會考慮佈局,目標是回升至 153-167 區域,如果基本面催化劑一致,甚至可能在該區域上方創出新的更高高點。 風險管理 ⚡️ 我還沒有確認多頭入場點。我的止損和盈虧比將取決於實際的看漲確認和入場價格。 如果跌破 134.75 且沒有令人信服的回升,將使我提出的看漲設置失效,我會選擇觀望而不是強行交易。 同樣重要的是要記住,SPCXX 是代幣化衍生品,而非實際的 SpaceX 股權。它提供 24/7 的價格敞口,但不賦予任何股東權利或股息,因此入場時必須考慮到代幣本身的流動性以及宏觀不確定性帶來的更寬的價差。 我寧願錯過反彈的第一部分,也不願在條件滿足之前投入資本。耐心比精準抓到底部更重要。 Nvidia 快速更新 🖥 考慮到最近的頭條新聞風險,我對 Nvidia $NVDAXUSDT 保持謹慎態度。 Nvidia 的股票波動極大,CEO 相關的調查頭條導致股價最初下跌 8.8% 至 170.24,隨後縮減跌幅,交易價格在 179.35 左右。 散戶投資者積極入場,據報導在開盤的前 30 分鐘內淨買入達 1.11 億美元,這顯示抄底興趣依然強勁。 我看好 Nvidia 長期的 AI 潛力,但我不會把一個有前景的商業故事與已確認的交易入場點混為一談。 該股在某些指標上仍然超賣,出現救援性反彈是有可能的,但頭條新聞的陰影意味著結構仍然脆弱。 目前,我正在觀察更強勁的價格結構,然後再考慮建立新的倉位。 機會不會因為我選擇等待確認而消失 😏 IMPACTbyTrade 黃仁勳離任考驗Nvidia的AI領導地位

XMLMUSDT
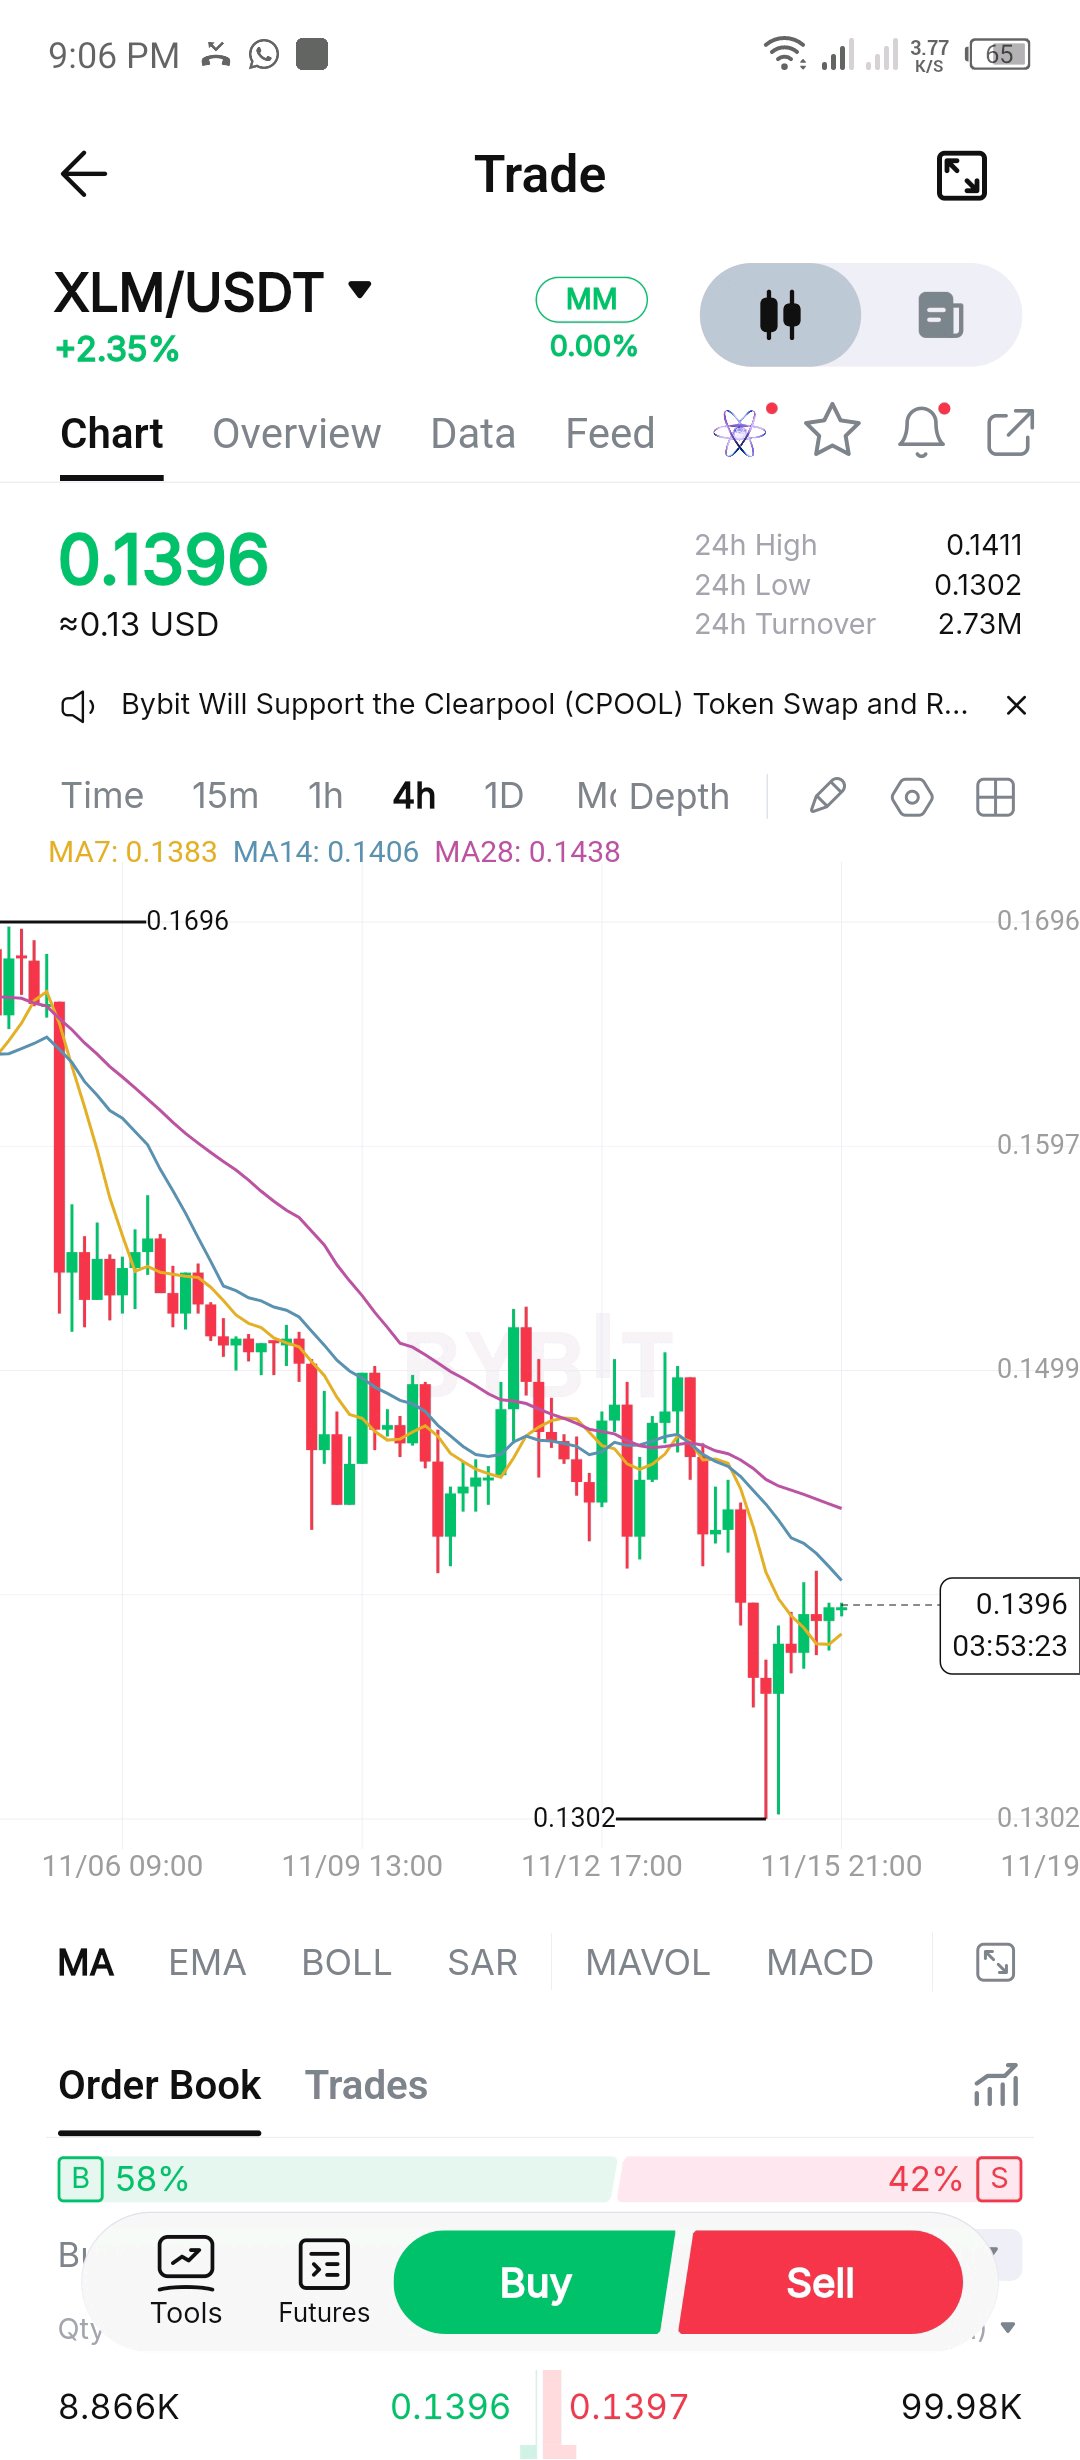
$XLMUSDT $XLMUSDT 技術分析 時間週期:4H 當前價格:$0.1396 24H 漲跌幅:+2.35% 1. 市場趨勢 整體趨勢仍為看跌 (DOWN)。 MA7:0.1383 MA14:0.1406 MA28:0.1438 價格高於 MA7,但低於 MA14 和 MA28。這顯示在更大的下跌趨勢中出現了短期回升。 2. 支撐位 $0.1380 – 即時支撐 $0.1350 – 次級支撐 $0.1302 – 主要支撐 3. 壓力位 $0.1406 – 第一壓力位 $0.1438 – 強壓力位 $0.1499 – 主要壓力位 4. 可能的市場走向 看漲情境:如果 XLM 突破並收在 4H K 線 $0.1406 上方,它可能會走向 $0.1438。 看跌情境:如果價格在 $0.1406 附近受阻,可能會下跌至 $0.1380 和 $0.1350。 5. 我的交易偏好 短期:小幅看漲回升。 整體:看跌。 我的偏好是等待確認後再進入交易。 避免急於買入或賣出。突破確認很重要。 結論:在 XLM 令人信服地突破 $0.1438 之前,維持看跌 (DOWN) 偏好。 #IMPACTbyTrade

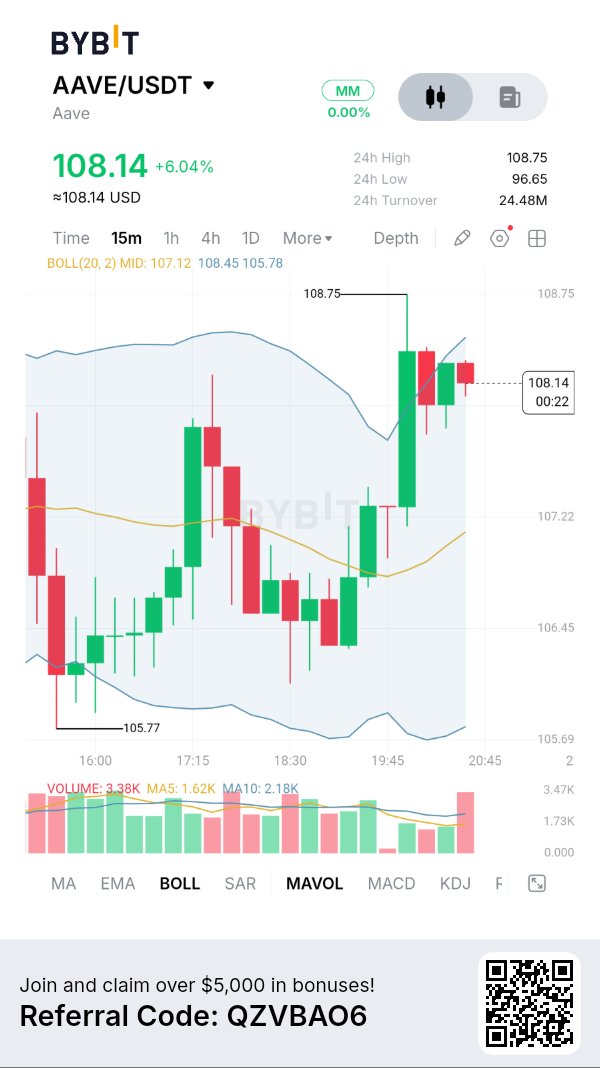
AAVE ($AAVE):買方推動價格突破 108 美元,復甦動能增強 基本面分析 Aave 仍是領先的去中心化借貸協議之一,允許用戶供應資產、賺取利息並以加密貨幣抵押品進行借貸。 其最新的重大發展是 Aave V4,它引入了「中心輻射型」(Hub-and-Spoke)架構,旨在改善流動性管理、資本效率和風險隔離。 Aave 的 10 月份開發更新報告顯示,V4 存款已超過 15 億美元,而整個協議的累計借貸量達到 1.1 兆美元。這些里程碑鞏固了 Aave 在 DeFi 領域的地位,儘管協議增長並不自動保證代幣價格上漲。 代幣經濟學 AAVE 的最大供應量為 1,600 萬枚代幣。其效用包括協議治理以及參與安全模組(Safety Module)。 DAO 還營運著一個由協議收入資助的買回計劃,這創造了另一個潛在的市場需求來源。 然而,買回、質押和協議增長必須與流通供應量、流動性和更廣泛的市場狀況一併評估。 圖表 + 指標 根據所提供的 Bybit 15 分鐘線圖: - 當前價格:108.14 美元 - 24 小時漲跌幅:+6.04% - 24 小時最高:108.75 美元 - 24 小時最低:96.65 美元 - 24 小時成交量:2,448 萬美元 - 布林通道中軌:107.12 美元 - 上軌:108.45 美元 - 下軌:105.78 美元 - 近期圖表低點:105.77 美元 $AAVEUSDT 已從 105.77 美元強勁復甦並收復了布林通道中軌。價格目前正在測試 108.45 美元附近的布林通道上軌。 成交量為 3.38K,高於 MA5 的 1.62K 和 MA10 的 2.18K。這表明在最近的復甦過程中參與度有所增強。 然而,價格正在接近阻力位,因此仍有可能出現回調。 看漲情境 若能持續維持在 108.45 美元上方,隨後成功回測,可能會為挑戰 108.75 美元打開空間。 若能令人信服地突破 108.75 美元,將會增強復甦力道,並可能吸引更多買家進場。 看跌情境 若未能突破布林通道上軌,可能會觸發回調至 107.12 美元。 若跌破中軌將削弱即時的看漲結構,而更深度的修正可能會再次考驗 105.78 美元。 我的交易計劃 我會避免追逐當前的綠色陽線。 對於看漲進場,我希望看到明確突破 108.45 美元、成交量改善以及成功回測。 如果價格遭到拒絕,我會觀察它在 107.12 美元附近的反應,再考慮下一次機會。 部位規模和止損點的設置應反映市場的波動性。 我的解讀 AAVE 顯示出令人鼓舞的復甦動能,並得到成交量增強和突破布林通道中軌的支撐。 其基本面依然有趣,特別是隨著 V4 的擴展和協議活躍度的增長。 但目前的技術挑戰在於買方能否克服 108.45 美元並在 108.75 美元上方建立穩固的支撐。 AAVE 是在準備迎來下一波上漲,還是買方正在接近賣方可能奪回主控權的阻力區? #IMPACTbyTrade


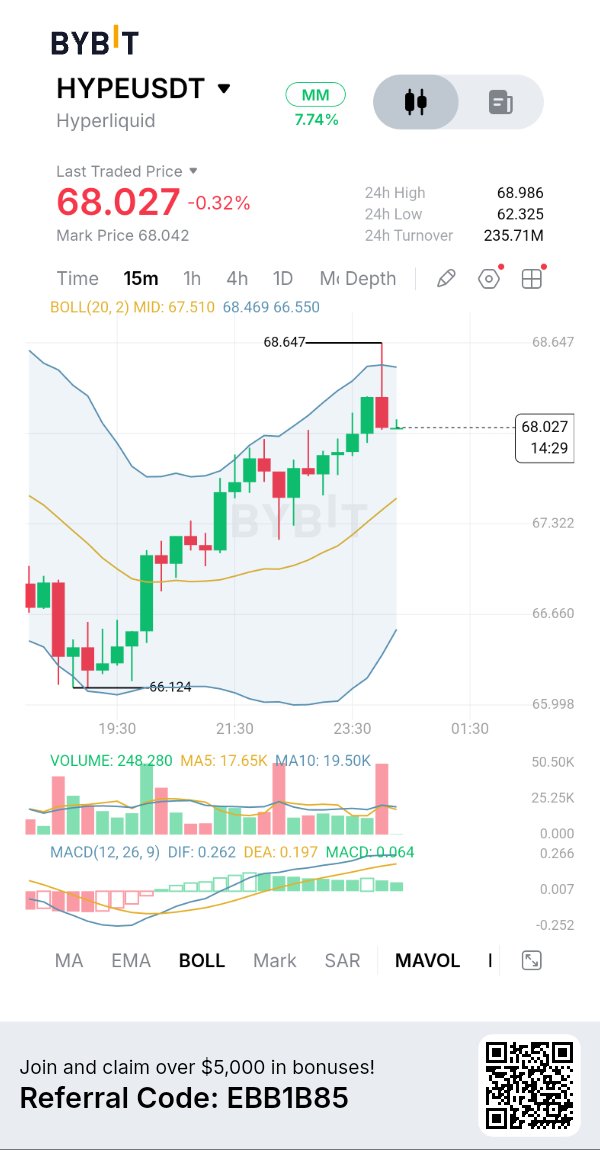
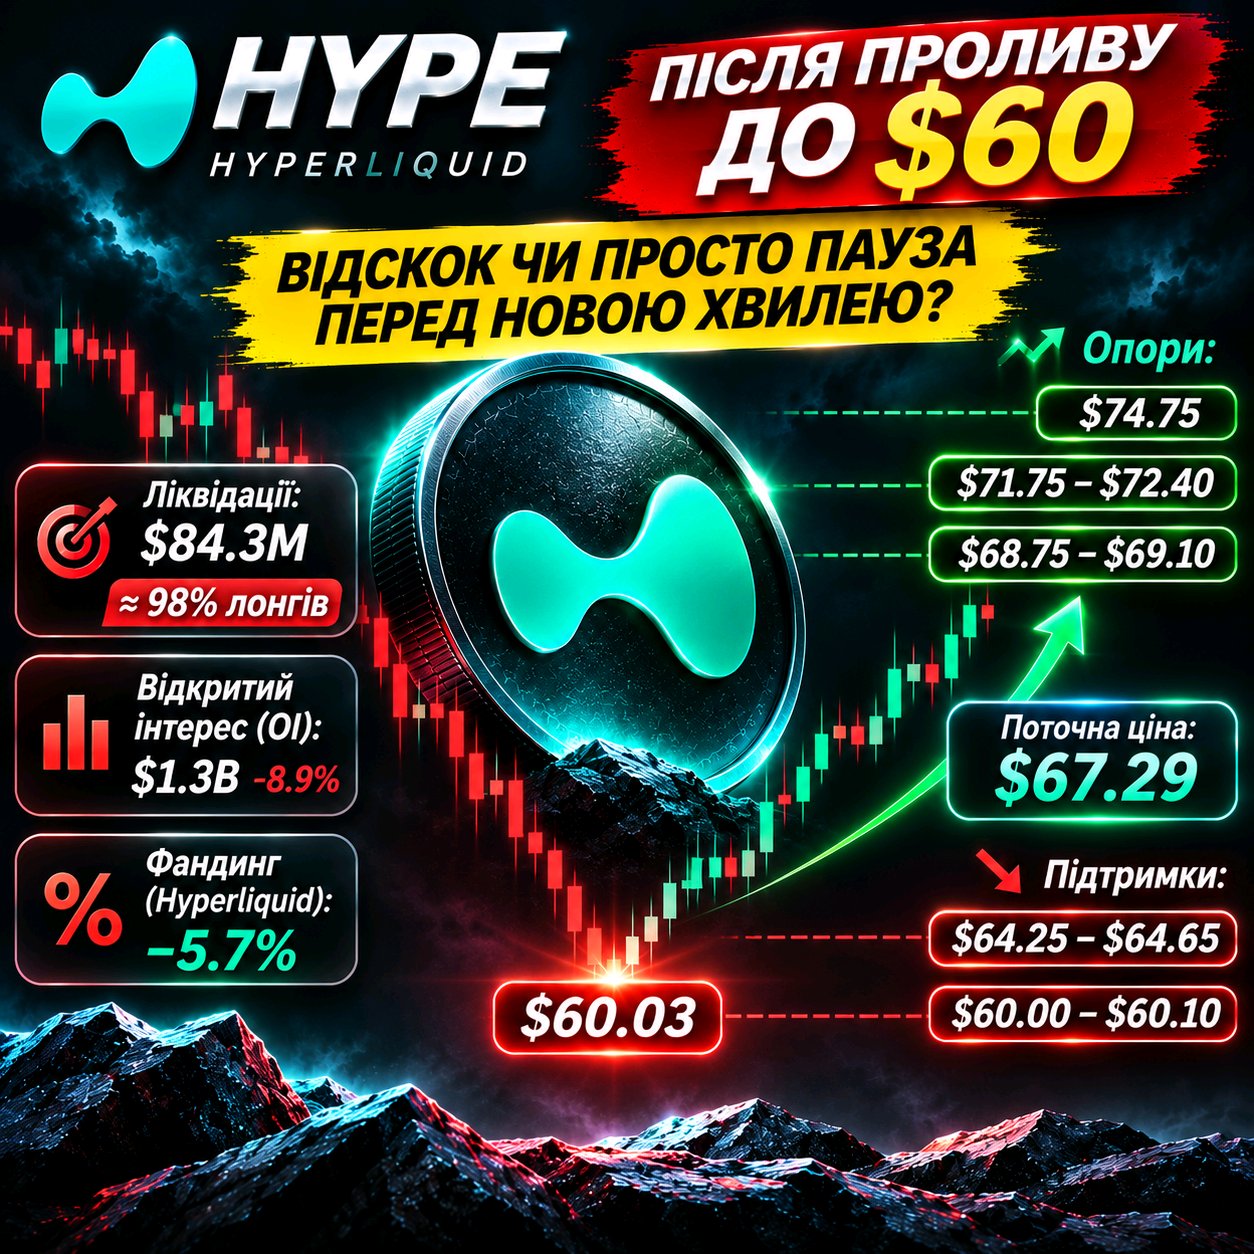
$HYPEUSDT 從 $60 反彈。但賣方真的失去控制了嗎? 經歷急劇下跌後,HYPE 展現出強勁的買盤反應。價格從 $60.03 上漲至 $67 區域,但我目前還不敢斷言這是反轉。 我保持謹慎的原因在於市場結構。 98% 的清算發生在多頭(LONG) 根據最近可用的數據,HYPE 在 24 小時內有約 8430 萬美元的倉位遭到清算。 其中約 8270 萬美元屬於多頭(LONG)。 這是一次大規模的槓桿多頭清洗,這些交易者試圖維持之前的上漲趨勢。 同時,Hyperliquid 上的未平倉合約(Open Interest)減少了 8.9%,降至約 13 億美元。 對我來說,這是一個重要的訊號:部分投機資本已經撤離市場。 資金費率(FUNDING)顯示出有趣的背離 在 Hyperliquid 上,資金費率轉為負值,而 Binance 和 Bybit 上仍保持正值。 這種差異表明,不同交易所的交易者倉位結構存在顯著不同。 負資金費率可能會為空頭(SHORT)回補創造條件,但僅憑這一點並不能保證價格上漲。 流動性目前集中在哪裡? 我關注以下區域: - $68.75–69.10 — 買方最近的阻礙。 - $71.75–72.40 — 重要的阻力區及潛在的空頭平倉點。 - $74.75 — 下一個復甦的參考點。 - $64.25–64.65 — 顯著的多頭清算集群。 - $60.00–60.10 — 最近拋售的局部底部。 特別有趣的是流動性的不對稱性:根據現有的清算地圖,價格下方的潛在多頭清算量遠大於上方最近的空頭清算量。 這意味著再次下跌的風險依然存在。 我的立場 我看到了企穩的初步跡象,但還未看到確定的反轉。 若能重回 $69 上方並形成更高的低點(higher low),將成為支持買方的第一個論點。 下一個考驗是 $72.40。如果 HYPE 能在該區域上方企穩,市場前景將會變得有趣得多。 反之,如果價格跌破 $64.60,焦點將再次轉回 $60 的低點。 現在最令人感興趣的不是 HYPE 本身的反彈,而是買方在市場已經清理了大部分槓桿多頭後,是否能守住陣地。 #IMPACTbyTrade $BTCUSDT
BTCUSDT:反彈走勢仍偏空
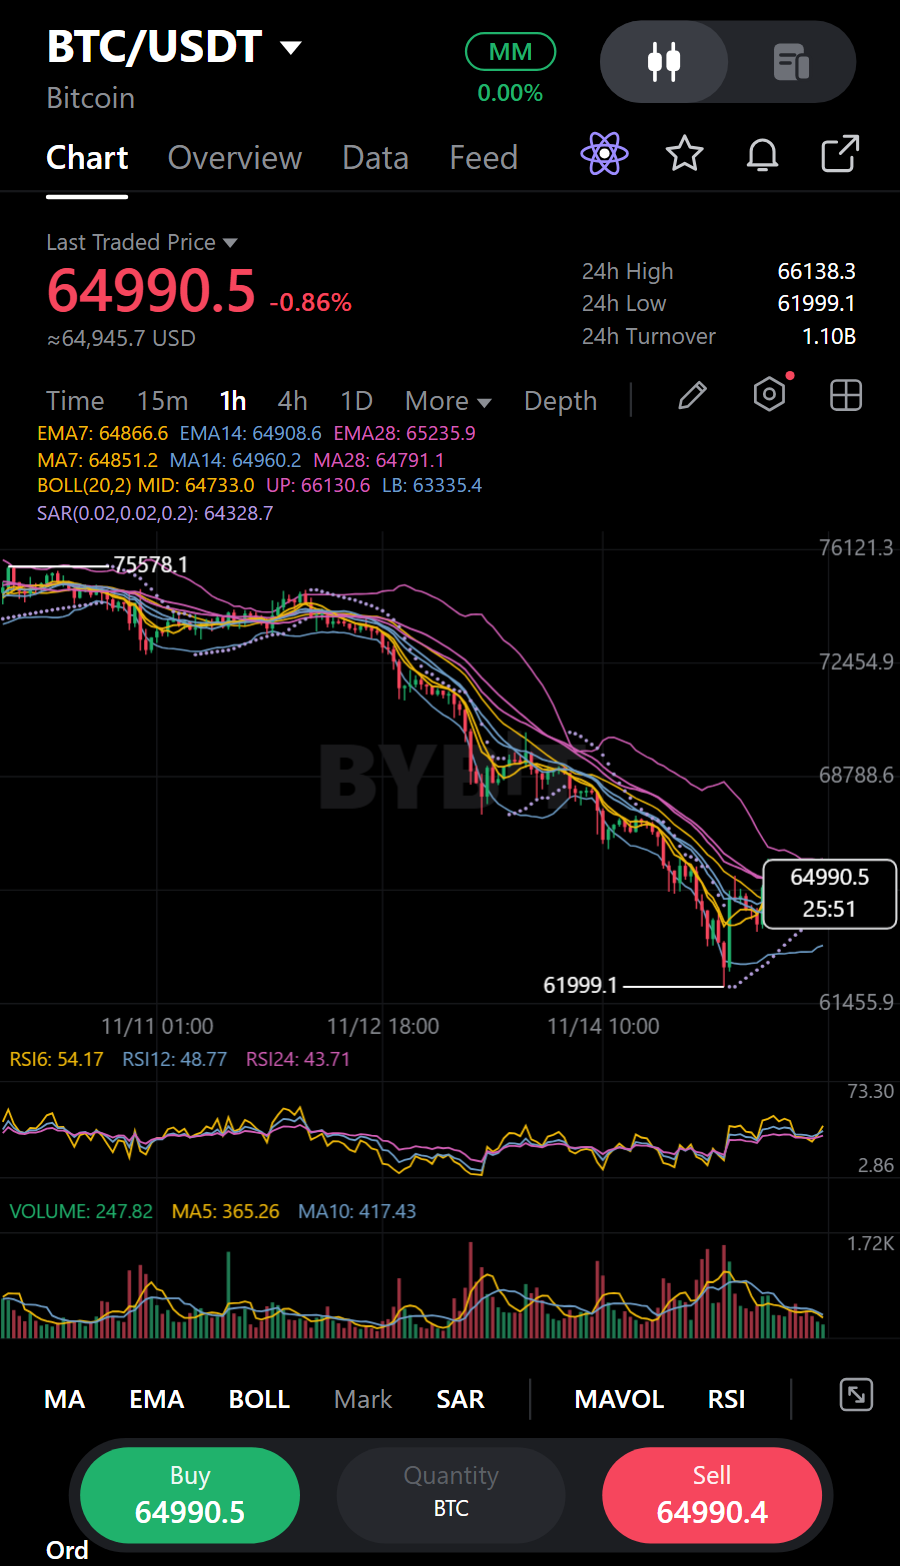
一根小綠K棒是最近的插曲,還稱不上反轉:在 01:00 時,$BTCUSDT 收在 64,735.30,成交量僅為 12 根 K 棒平均值的 0.6 倍。在此之前,21:00 的紅色 K 棒收在 64,769.40,而 23:00 與 00:00 的紅色 K 棒則將價格拉低至 64,704.60 和 64,571.60。這序列顯示賣方在反彈後持續施壓;最後的拉升看起來參與度不足。最新成交價為 64,980.60,剛好高於 MA7(64,925.11)、MA14(64,926.05)以及 MA28(64,818.47)。這讓買方有了立足點,但這些均線距離很近,無法抹去近期小時級別的疲軟。 一位策略師概述了比特幣在 2027 年可能的復甦,將拋售歸因於槓桿,並指出了支撐或推翻該觀點的點位。我將其視為更長線的對立觀點,而非 BTCUSDT 短期的觸發因素。對於這個佈局,買方仍需在均線簇周圍展現後續動能;單根低成交量的綠 K 棒尚未做到這一點。 市場證據讓我維持近期看跌的偏向:BTCUSDT 在 24 小時盤面上跌幅為 1.03%,成交量約為前一天的 1.26 倍。更多的活動伴隨著下跌,並不能證明賣方會持續佔據主導地位,但這與空頭佈局的吻合度高於確認復甦的跡象。我會希望看到小時 K 棒在均線之上建立結構,才會改變看法。 對於空單,我會觀察 64,773.64 - 65,187.56 區間是否有停滯跡象,而不是去追空。若價格高於 66,222.36 的止損點,則該觀點失效。從進場區間中點計算,TP1 設在 63,945.80,盈虧比約為 0.8:1,TP2 設在 62,911.00,盈虧比約為 1.7:1。第一個目標相對於風險來說空間有限,所以我會有所選擇;快速的震盪和小時線影線仍可能在方向明確前掃掉進場部位或止損。 交易計畫 (做空 / 看跌): • 支撐:61,999.10 / 61,999.10 | 壓力:66,138.30 / 74,822.90 • 進場區間:64,773.64 - 65,187.56 • 止損 (SL):66,222.36 • 目標:TP1 63,945.80 | TP2 62,911.00 當價格在成交量稀少的情況下短暫收復均線時,什麼樣的情況會讓你相信反彈是真的? 僅為個人解讀,非投資建議。#IMPACTbyTrade

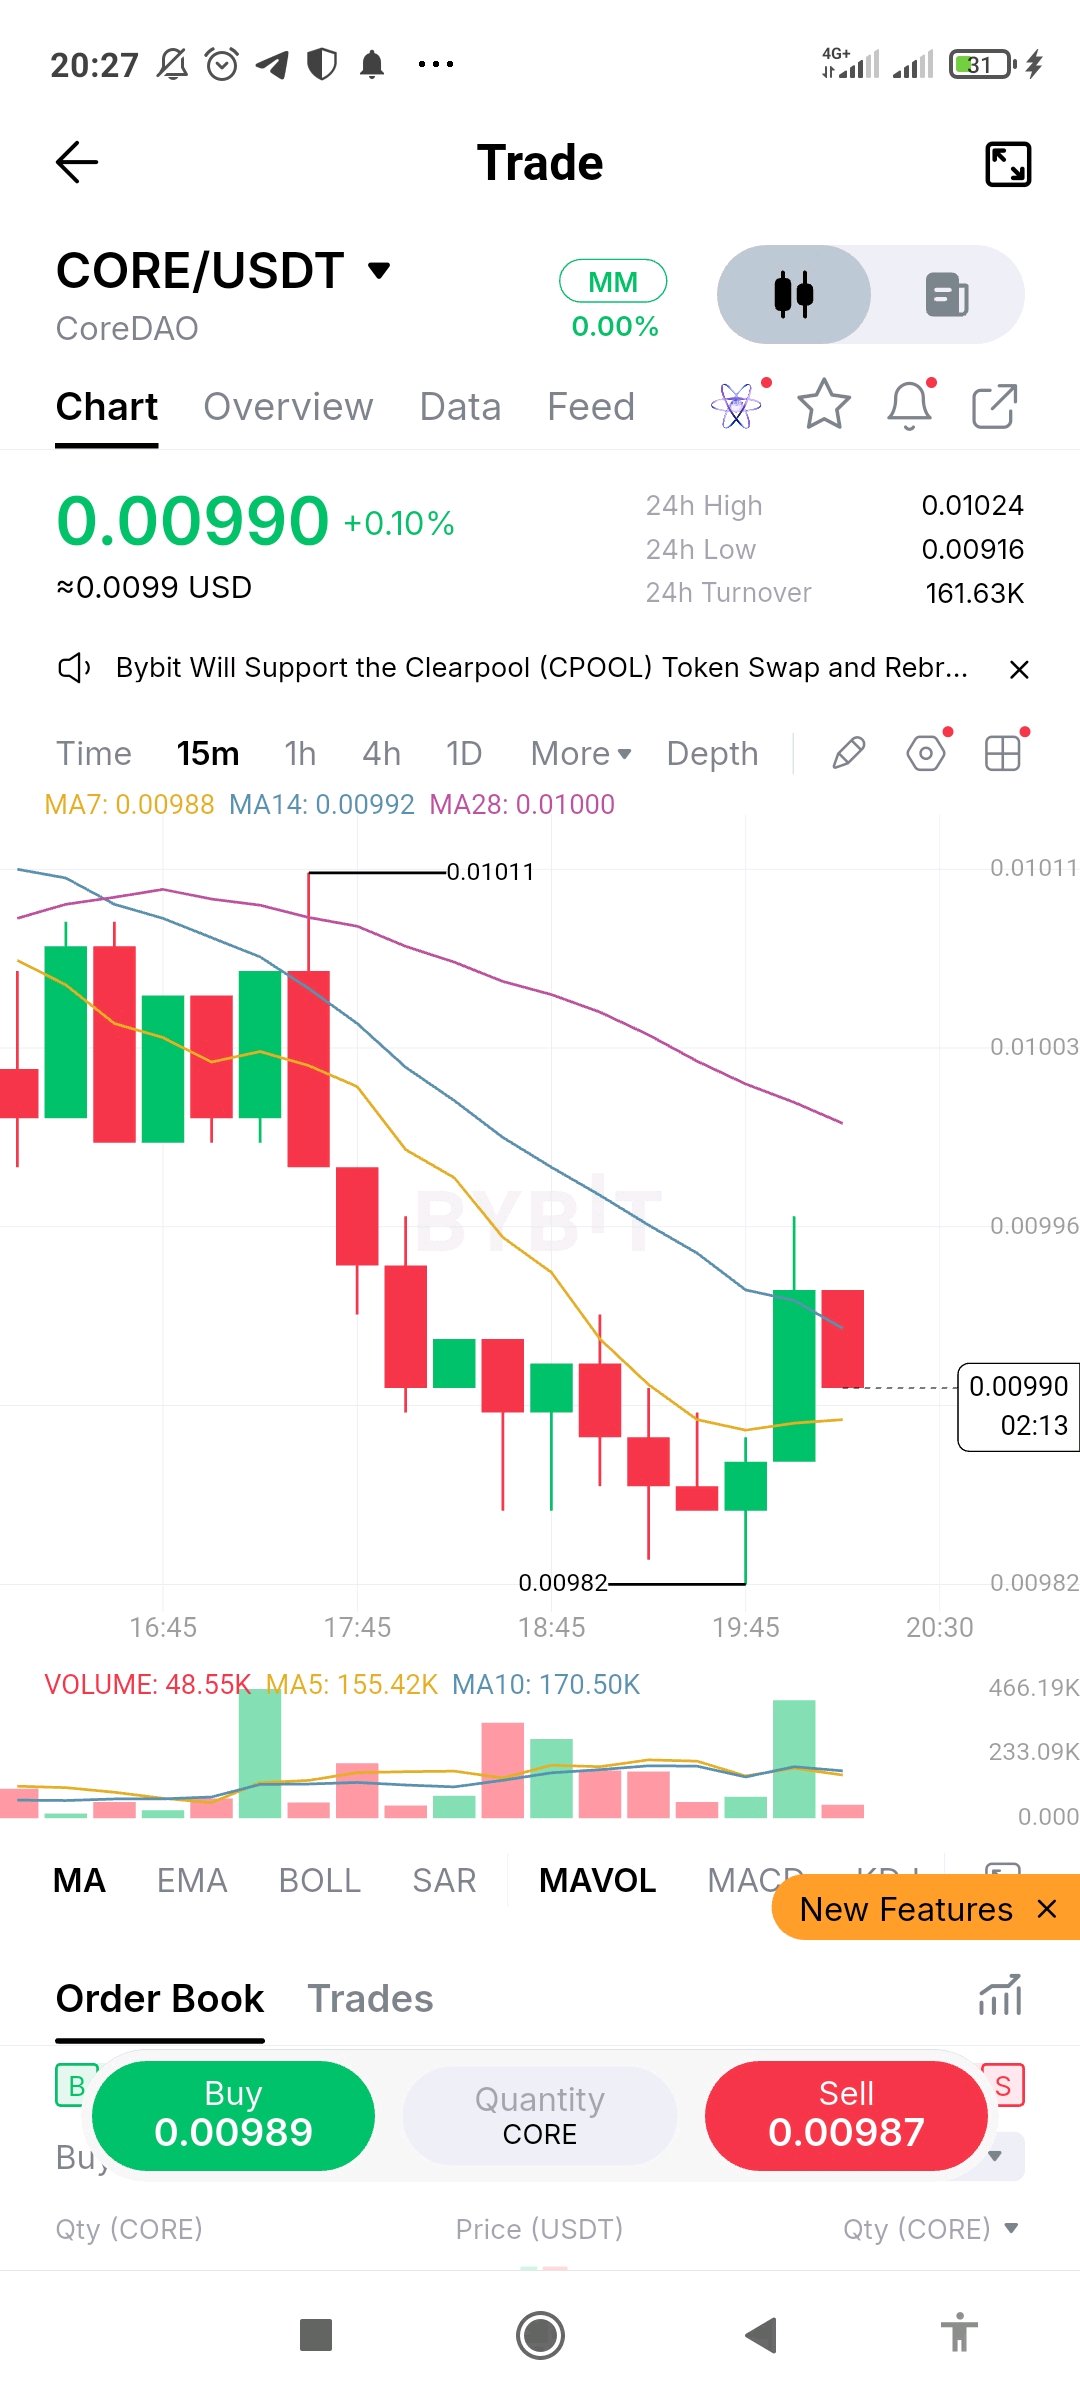
$COREUSDT 在 15 分鐘線圖上報 0.00990,日內僅微漲 0.1%,但短期趨勢向下。價格從 0.01011 區域滑落至 0.00982 的低點,隨後出現一根強勁的綠 K 棒反彈,但緊接著在下行的移動平均線下方出現一根紅 K 棒。MA7 (0.00988)、MA14 (0.00992) 和 MA28 (0.01000) 皆呈空頭排列並向下傾斜。 0.00982 的低點是關鍵觀察點。若跌破此水位,代表賣方仍掌控局面;而若能收在 0.00992 附近的 MA14 之上,將是反彈力道初步浮現的訊號。反彈時成交量雖激增,但隨後的紅 K 棒成交量卻萎縮,顯示買方尚未持續跟進。目前尚未確認任何走勢。 教訓:持平的日內漲跌幅可能掩蓋了圖表持續出現低點不斷下移的事實。下跌趨勢中的單根綠 K 棒只是反彈嘗試,並非反轉,因此請等待低點墊高後再進場,並保持小倉位。 #IMPACTbyTrade $COREUSDT $BTCUSDT

XAUT:黃金的避險需求面臨壓力
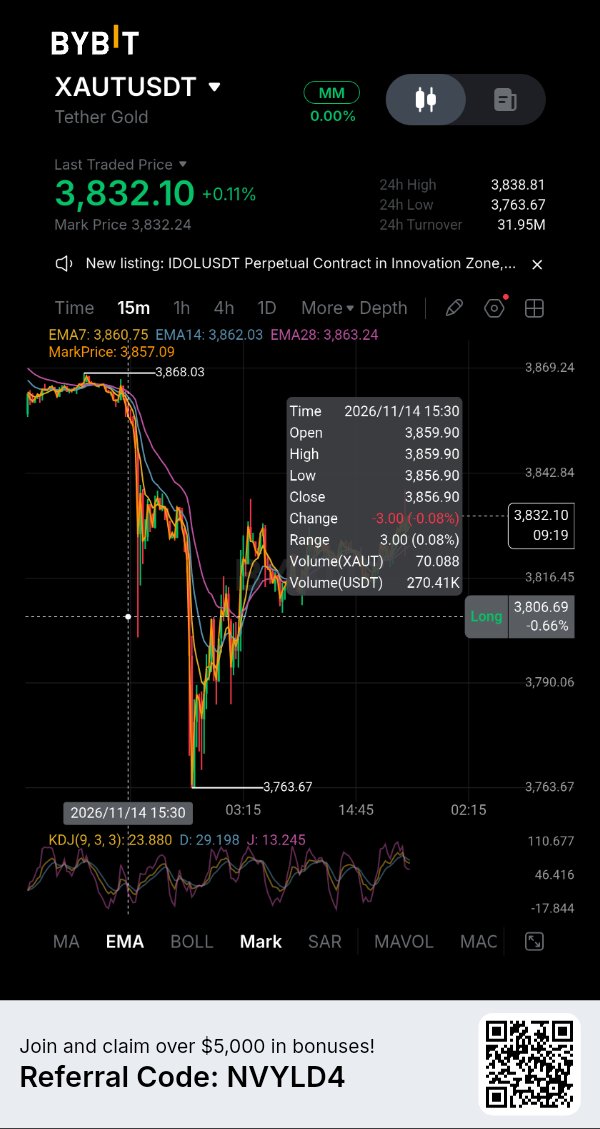
隨著投資人重新評估美國利率,Tether Gold正面臨考驗。現貨黃金週五收盤價接近每盎司3,880美元,本週下跌約4.5%,創下自6月初以來的最大單週跌幅。儘管在生產者物價通膨數據疲軟後出現短暫反彈,但未能扭轉週四3%的跌勢。 壓力源於貨幣政策。美國消費者通膨和生產者物價細節使升息預期持續存在,而10年期公債殖利率已升破5%。聯準會官員傑夫·施密德(Jeff Schmid)於11月15日表示,通膨率仍高於2%的目標。殖利率上升增加了持有黃金的機會成本,因為黃金本身不產生利息。這有助於解釋為什麼地緣政治的不確定性未能保護黃金免受拋售影響。 在最新的交易所數據快照中,Bybit的$XAUTUSDT永續合約報價接近3,823美元,24小時內下跌約1%。其24小時合約交易量約為4,336萬美元,資金費率為每四小時+0.0012%。正資金費率意味著多方正在支付給空方,但該費率適中,並未顯示多頭過度擁擠。由於交易時間、流動性和合約定價的差異,永續合約價格也可能與黃金現貨參考價格有所不同。 除了圖表走勢外,還有一個值得關注的獨立進展。Tether在9月30日的儲備報告指出,流通中的XAUT數量為827,417.63枚,由同等數量的實體金衡盎司黃金託管作為背書,相當於約25.7噸黃金。11月11日,Anchorage宣布為持有XAUT的合格客戶提供機構託管、交易和抵押服務。此次擴展可能會改善機構的准入途徑,但這並不代表每一位代幣持有者都有資格直接向發行方贖回,也不保證即時的現金流動性。 目前,XAUT的走勢仍與黃金對殖利率和美元的反應息息相關。黃金若能持續回升至3,900美元以上,將有助於穩定市場情緒;若再次跌破,將繼續對代幣造成壓力。雖然機構准入的故事正在發展中,但尚未抵銷宏觀風險。 關鍵問題: 1. 在美國公債殖利率維持高檔的情況下,黃金能否重回3,900美元? 2. 機構准入能否轉化為更深層、更可靠的XAUT流動性? 3. 目前的下跌是修正,還是黃金長期重新定價的開始? IMPACTbyTrade


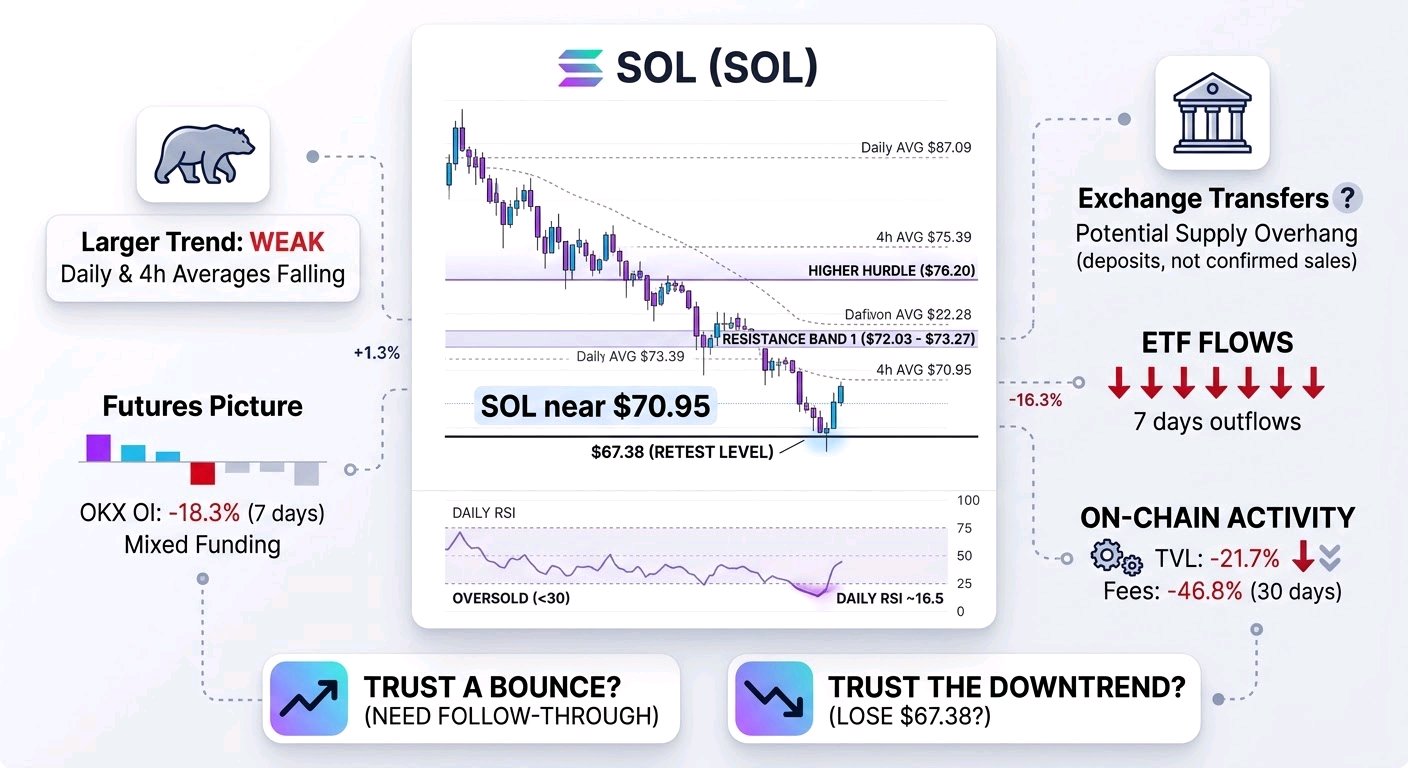
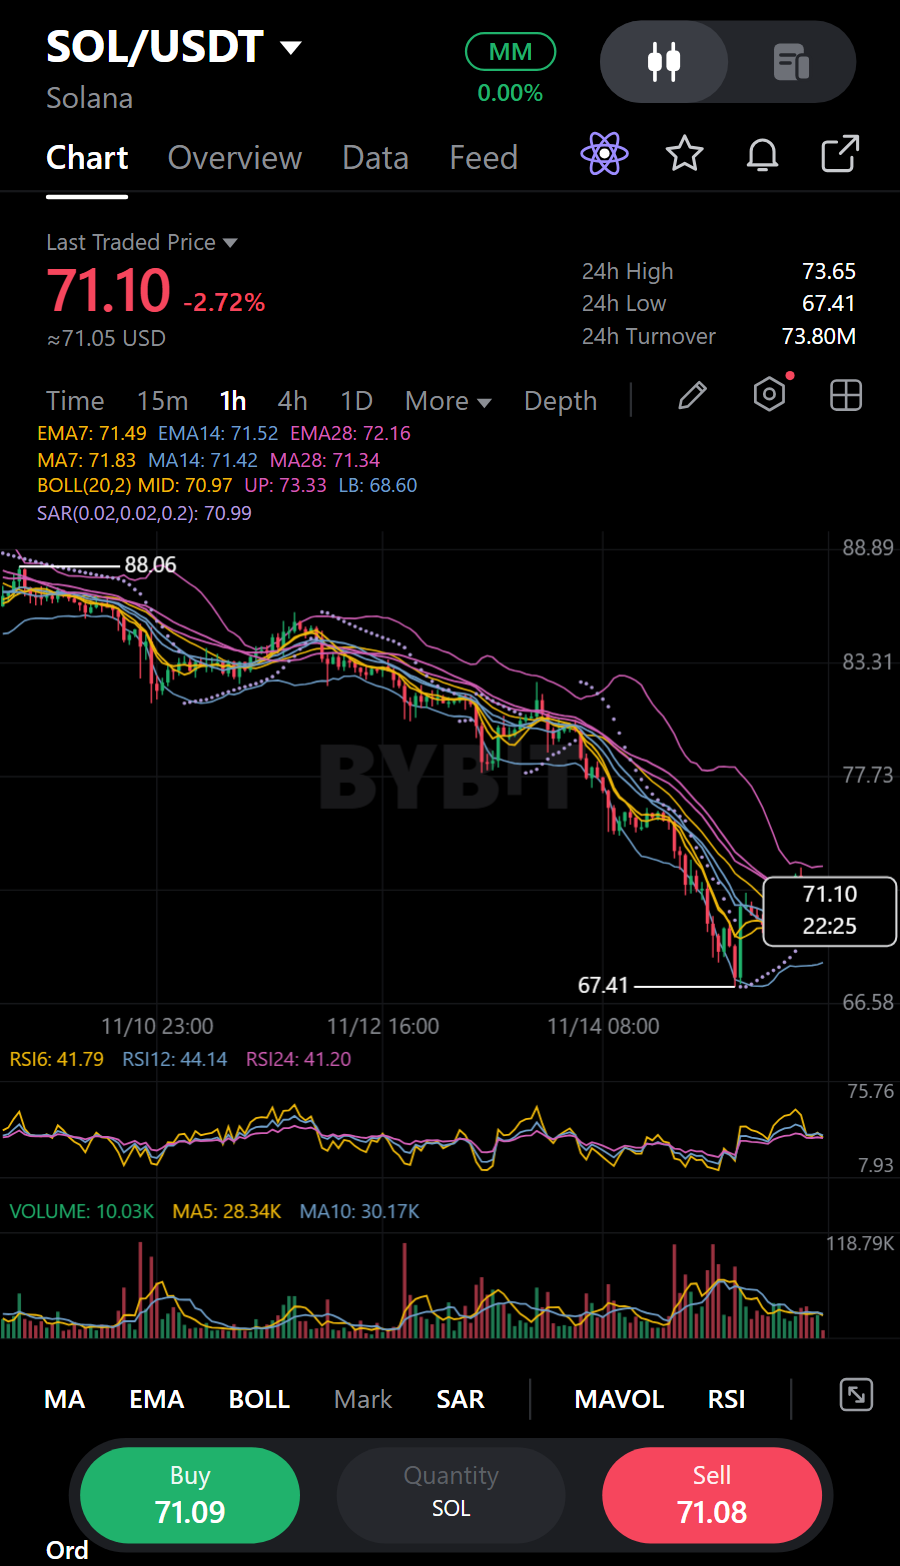
$SOLUSDT 在下跌 20.3%(7 天內)後,現價接近 $70.95。該幣價一度觸及 $67.38,創下自六月下旬以來的最低點,隨後出現反彈。這一低點是目前最關鍵的觀察點:若能守住,短期築底仍有可能;若失守,則意味著反彈未能阻止價格持續走低。目前這兩種結果尚未確認。 整體趨勢仍然明顯疲軟。SOL 處於 4 小時均線(約 $75.39 和 $80.85)及日線均線(約 $87.09 和 $95.48)下方。日線 RSI 約為 16.5,屬於極度超賣狀態。這使得技術性反彈變得合理,但並不代表拋售已經結束。在 1 小時圖上,SOL 一直難以穩守 $72.03–$73.27 的區間,這是由近期高點形成的第一個阻力帶。若能突破該區域並經受住回測考驗,將比短暫的衝高更具說服力。$76.20 是一個更高的門檻;若能收復此位,將改善短期結構,但仍無法扭轉更廣泛的下跌趨勢。 什麼樣的情況會讓我相信反彈?需要看到後續買盤跟進,而不僅僅是超賣數據。最新的 K 線顯示價格從 $67.38 反彈,但價格尚未在阻力位上方站穩。這裡提供的數據不包括可靠的 15 分鐘線圖、MACD、分時成交量、訂單簿深度或清算熱圖。因此,我們無法確認反彈背後是否有強勁的現貨買盤支撐,無法鎖定精確的清算群集,也無法斷言特定價位會引發強制買入或賣出。 期貨市場傳遞出複雜的信號。各大平台的資金費率略微偏負,意味著空方正在向多方支付費用;OKX 的持倉量在 7 天內下降了 18.3%。這表明市場已經釋放了一些槓桿,如果價格上漲,留下了空頭回補的空間。但倉位並非一面倒:OKX 帳戶偏向做多,而頂級交易員的倉位則偏向做空。持倉量下降可能反映了去槓桿化,未必是積累籌碼或即將發生軋空的跡象。現貨活動量很大——24 小時內在 63 個平台上交易額約 54.5 億美元——但單看總量無法告訴我們到底是買方吸收了供應,還是賣方主導了交易。 交易所轉帳報導值得關注,但不必過早下定論。新聞報導描述了大量的 SOL 存入,包括與 Forward Industries 相關的變動;該公司否認了其中一項報導轉帳的擁有權歸屬。鏈上動向可能是真實的,但「存入」並不等同於「拋售」。這使得它成為潛在的拋壓,而非已證實的賣盤。大盤也承受著壓力:整體加密貨幣市值在 24 小時內下跌了 5.2%,恐慌指數為 10,處於極度恐慌水平。SOL 的疲軟主要是源於自身供應與活動,還是被市場避險情緒放大?這兩種可能性都存在。 雖然存在長期利好,但它們無法左右短期走勢。DTCC 的代幣化計畫納入了 Solana,該網路也正在舉辦 Breakpoint 大會。這些進展或許長期重要,但目前尚未帶來顯著的價格反轉。同時,即時數據較為疲軟:ETF 資金連續 7 天流出,5 天內累計流出 3200 萬美元,20 天內累計流出 1.2 億美元。30 天內,鎖倉價值下降了 21.7%,穩定幣供應量下降 7.1%,手續費下降 46.8%。這些都是資金流出和活動減弱的確切跡象,但我們不能假設這些數據能預測接下來幾天的走勢。 我的解讀刻意保持條件性。在 $67.38 之上,技術性反彈依然可信,特別是如果價格在持續的參與下收復 $72.03–$73.27。一旦跌破該波段低點,看跌觀點的權重將增加。什麼因素會改變平衡?現貨需求在回測時得到支撐、持倉量隨價格上漲而回升、以及 ETF 資金流出放緩,這些將使反彈更為紮實。若再次在阻力位遇阻、資金持續流出或價格崩跌,則說明超賣狀態尚未終止下跌趨勢。目前,雙方都沒有獲得所需的確認信號。#IMPACTbyTrade
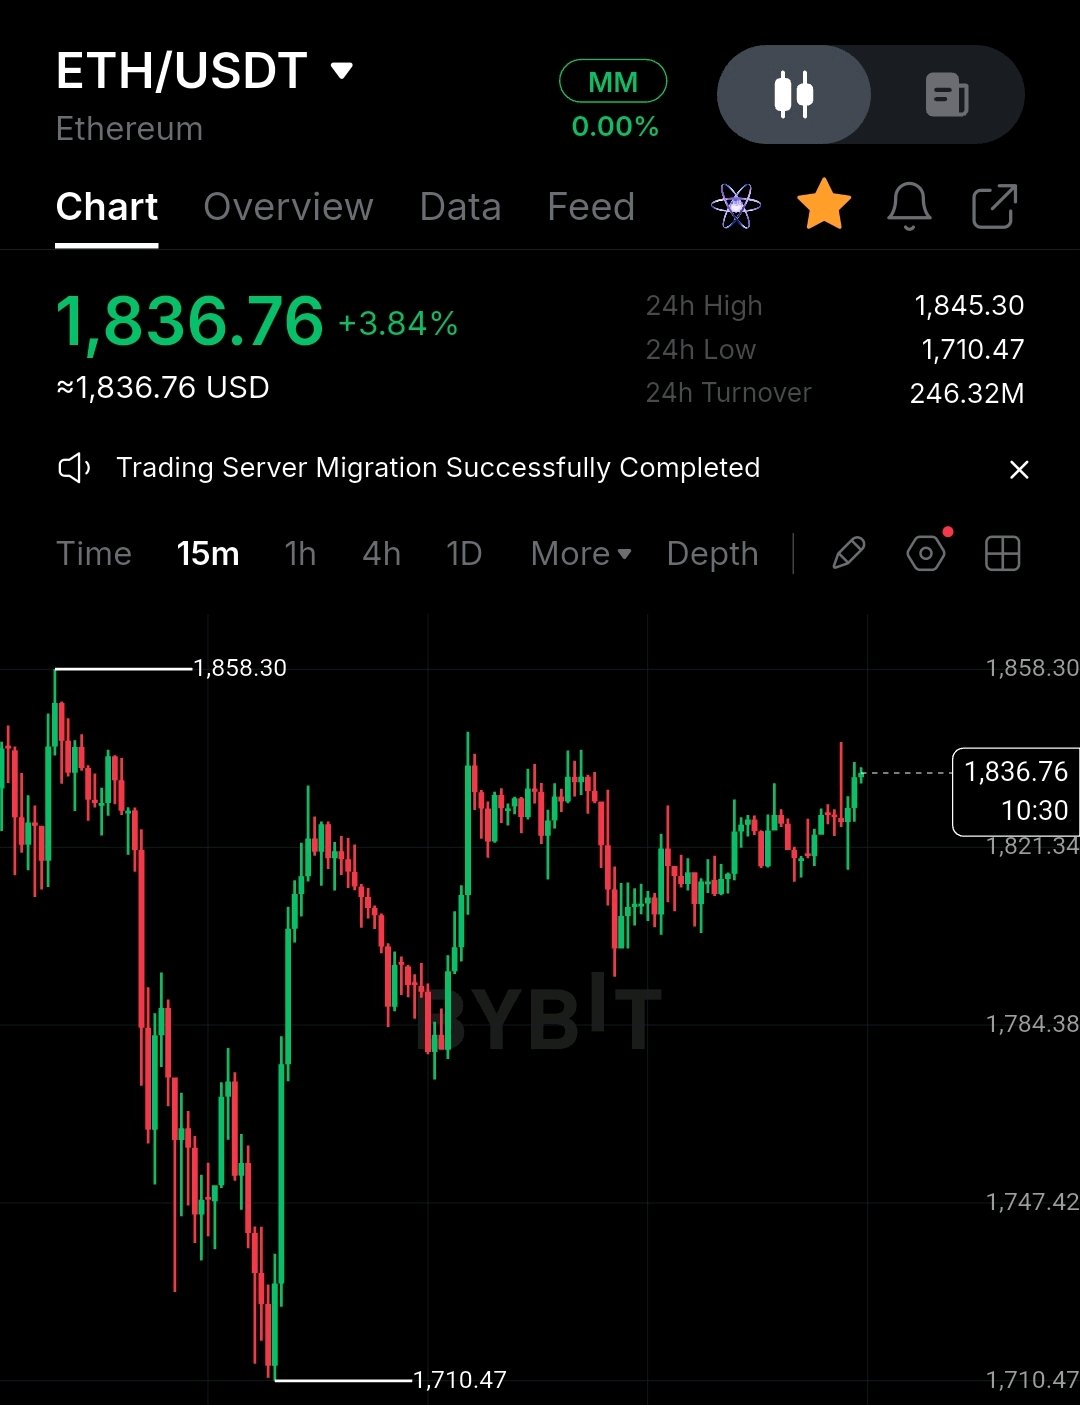
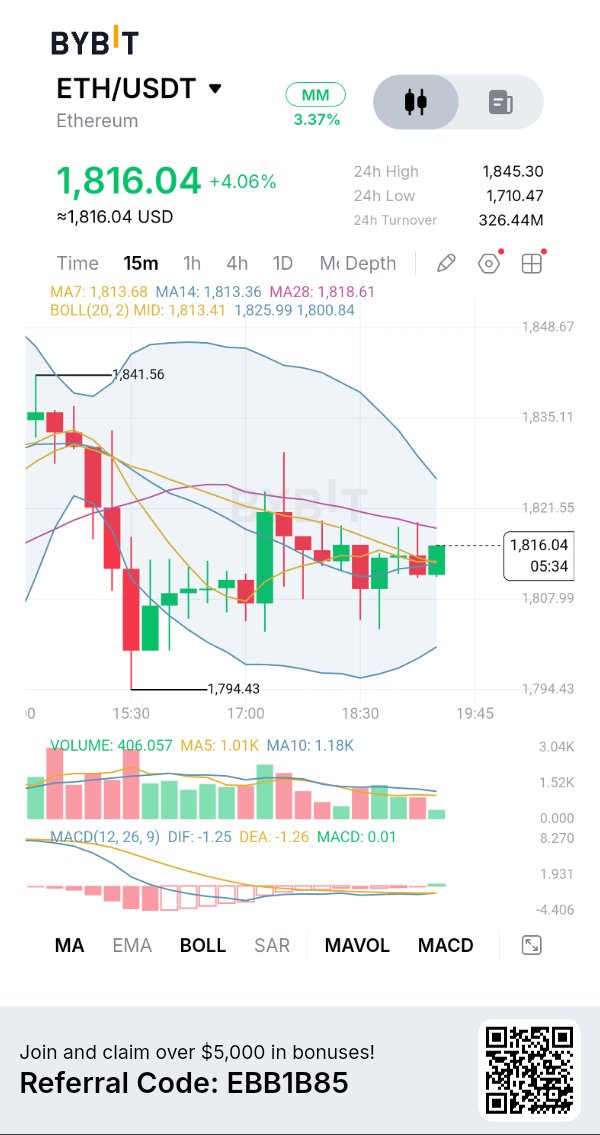
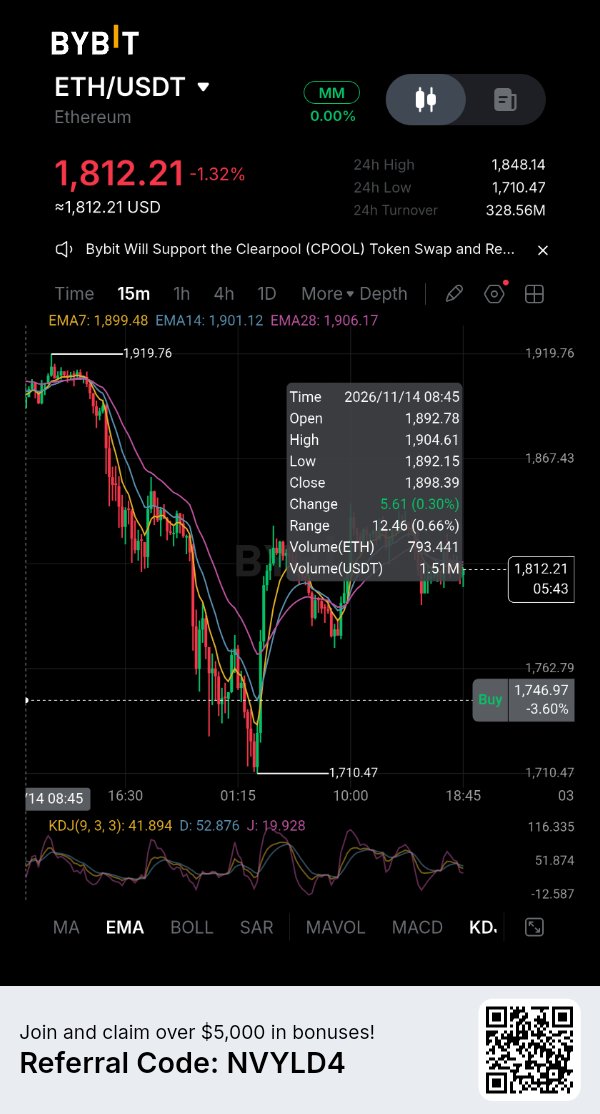
ETH 試圖在 1,816 美元上方反彈:買方是否在醞釀更強勁的逆轉? 在經歷了相當大的拋售壓力後,以太坊 (ETH) 正顯示出短期企穩的跡象,但目前的復甦仍需確認。在跌至 1,794.43 美元後,ETH 已成功收復 1,800 美元區域,目前買方正試圖在 1,816 美元附近積聚動能。 關鍵問題在於,這種復甦能否發展成可持續的上漲走勢,還是賣方會利用目前的反彈作為再次奪回控制權的機會。 圖表 + 技術分析 我的 Bybit $ETHUSDT 15 分鐘線圖顯示,ETH 目前交易價格約為 1,816.04 美元,上漲約 4.06%,24 小時高點為 1,845.30 美元,低點為 1,710.47 美元。 近期的價格結構顯示為急劇下跌後隨之而來的復甦與盤整。買方已守住 1,794.43 美元的波段低點,但價格仍接近幾個上方的阻力位。 移動平均線提供了一個有趣的畫面。MA7 約為 1,813.68 美元,MA14 約為 1,813.36 美元,MA28 約為 1,818.61 美元。ETH 的交易價格高於較短週期的均線,但仍低於 MA28,這使得 1,818.61 美元成為一個重要的即時阻力參考點。 布林通道的中軌約在 1,813.41 美元,上軌在 1,825.99 美元附近,下軌約在 1,800.84 美元。持續站穩中軌之上可能會增強復甦力道,而若在上軌附近遭遇拒絕,則表明買方仍面臨相當大的阻力。 MACD + 交易量分析 MACD 顯示出初步改善,DIF 為 -1.25,DEA 為 -1.26,柱狀圖約為 +0.01。 略微轉正的柱狀圖表明看跌動能正在減弱。然而,兩條 MACD 線仍低於零軸,這意味著完全的看漲動能逆轉尚未得到確認。 目前交易量約為 406.057,低於 MA5(1.01K)和 MA10(1.18K)。這是一個重要的隱憂,因為目前的復甦缺乏強大的參與度。 我傾向於看到向上突破時伴隨交易量放大,才會將此視為一次令人信服的逆轉。 看漲情境 如果 ETH 能維持在 1,813–1,814 美元附近的支撐,並成功收復 1,818.61 美元,我將觀察其是否會持續上漲至 1,821.55 美元。 若出現更強勁的突破,可能會開啟通往 1,825.99 美元的道路,該位置與布林通道上軌吻合。 我傾向的進場方式是等待 15 分鐘線決定性地收在阻力位之上,隨後進行成功的回測並伴隨交易量增加。 若持續跌破 1,807.99 美元,將削弱此即時看漲佈局。 我的交易計畫 當 ETH 在支撐位和阻力位之間震盪時,我不會去追逐當前的復甦。 對於多頭部位,我希望看到買方收復 1,818.61 美元,確認突破並展現出更強的交易量。 對於空頭部位,我會等待確認跌破 1,807.99 美元且復甦嘗試失敗。 #IMPACTbyTrade

Hyperliquid was built to pull leveraged trading away from centralized exchanges. So what does it say that its own token now trades on a centralized venue with a 10x leverage tag? That tension is the real fundamental question. HYPE is the native asset of Hyperliquid, a decentralized perpetual futures platform. The screenshot shows it at 66.365, up 1.18%, beside a 67.95M figure that isn't labeled, so I won't assume what it measures. What is visible is enough to ask where the token's value actually comes from. The project's strength is focus. Rather than a general-purpose chain searching for a use case, Hyperliquid is organized around one proven source of demand: leveraged derivatives trading. A token placed at the center of that activity has a clearer economic story than most Layer 1 assets. The hidden contradiction is that token price and protocol economics are different things. A modest daily gain on a leveraged listing reflects speculative flow, not platform revenue. Traders can push HYPE higher elsewhere without a single additional user touching Hyperliquid itself. Price discovery is happening off-platform, so the market may be pricing the narrative faster than fundamentals can confirm it. For monetization, the key issue is whether platform trading activity converts into durable token demand through fees, buybacks or staking utility. None of that is verifiable from this screenshot, and no revenue, supply or unlock data is shown, so I am leaving tokenomics out rather than guessing. The bullish case is a focused product, strong brand recognition and listings on major venues that widen access and liquidity. The bearish case is cyclicality. Perpetual futures volume depends on volatility and appetite for leverage, and when traders step back, both activity and the token's value proposition thin out. The critical risk is competition. Derivatives traders move wherever liquidity and fees are best, and that includes centralized exchanges, which are the very venues Hyperliquid set out to displace. My view: the thesis is credible but concentrated. HYPE is effectively a claim on one business line, and that purity cuts both ways. It deserves serious attention, not blind enthusiasm. The milestone that would change my assessment is evidence that platform revenue translates into measurable, recurring token demand independent of price momentum. Until that link is visible, price strength is a sentiment signal rather than a fundamental one. If a token's price is set mostly on centralized venues, how much of its value does the protocol itself actually control? $HYPEUSDT #IMPACTbyTrade
HYPERLIQUID (HYPE): Is the Market Underestimating Its Potential? Hyperliquid is an interesting project to watch in the decentralized trading sector. My focus is on three factors: 1. Growth in platform activity. 2. User adoption and ecosystem development. 3. Whether HYPE can regain market strength. Long-term potential and short-term price action are two different things. I want to see real ecosystem growth before becoming overly bullish. What matters more to you: HYPE's technology, adoption, or price performance? $HYPEUSDT #IMPACTbyTrade


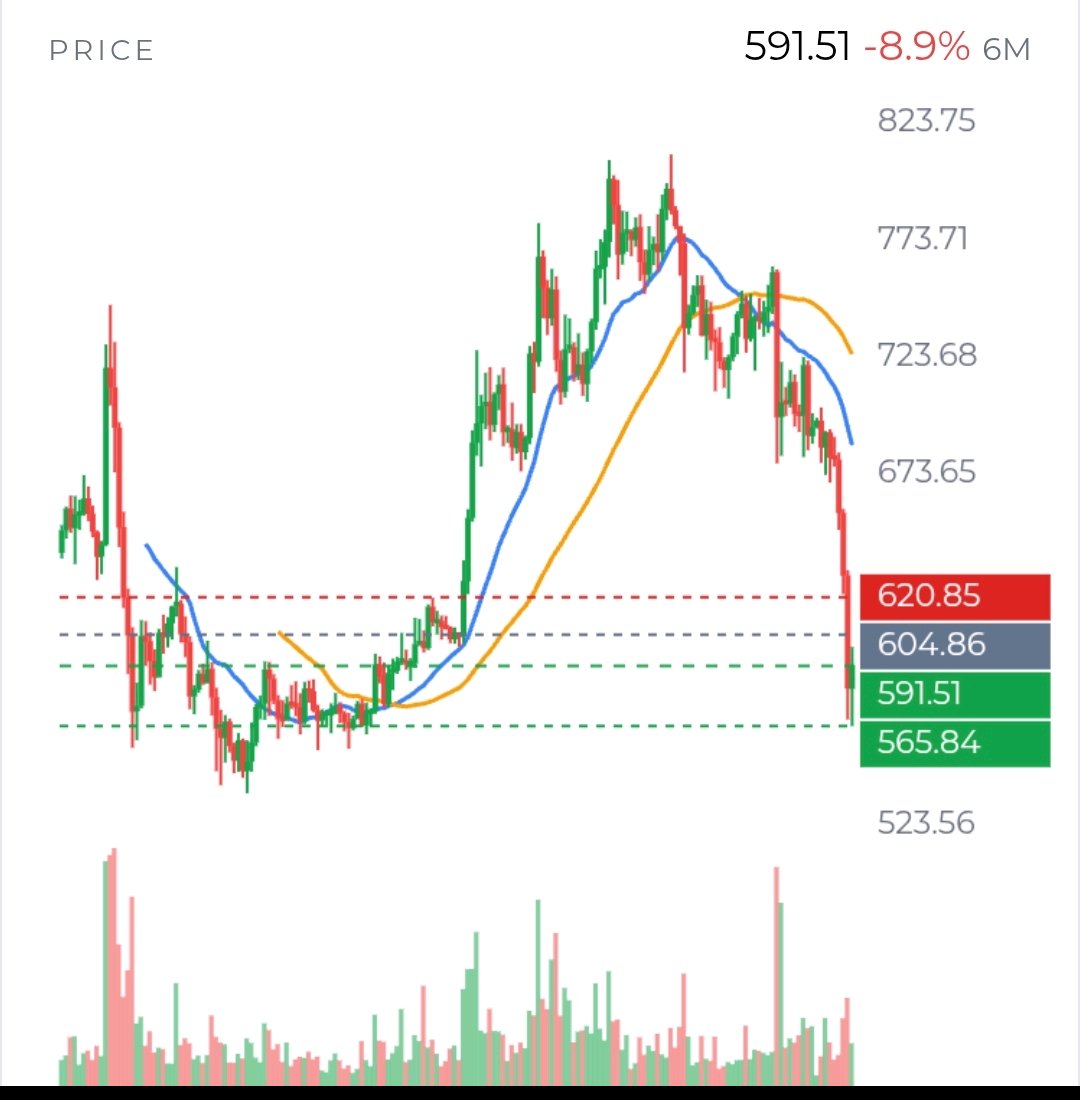
$BNBUSDT is not giving a clean signal yet. The important question is no longer simply “Is it oversold?” It is whether the market can turn a sharp drop into a stable base—or whether each bounce is an opportunity for sellers to exit. The verified picture is weak, but not one-sided. BNB is around $591, down about 15% in 7 days and 18% in 30 days. It remains below its daily EMA20 near $675 and EMA50 near $703; the hourly trend is also down. Daily RSI is 24.2, a level commonly called oversold. That tells us the decline has been forceful. It does not tell us the decline is finished. The levels closest to price matter most. Buyers have a first test at $585.72–$583.11, with the recent low at $565.84 below that. If price breaks the nearby support and cannot reclaim it, the low becomes a plausible retest. But if price holds support, could this be the beginning of a base? I would look for follow-through, not just one green candle. On the upside, $597.89–$604.84 is the first meaningful reclaim area, including the hourly EMA50. BNB has traded above part of that zone, but has not established a sustained hold. $620.60–$620.85 is the next important hurdle. Holding above it would weaken the immediate bearish interpretation; failing there would suggest the rebound has not yet changed the trend. A move all the way back to the daily EMA20 near $675 would require a much larger recovery, not merely a short-covering pop. Participation offers clues, but not a verdict. Reported spot volume is about $1.44 billion across 62 venues, though the top 3 account for 48%, including one venue at 30%. That concentration makes the aggregate number less convincing as evidence of broad buying. Perpetual open interest is reported at $563 million across 4 tracked venues; OKX open interest is down 18.8% over 7 days. That points to leverage coming out on that venue, but does not tell us what happened across the whole market. Funding is nearly flat, at roughly +0.001% per 8 hours. OKX accounts lean long, while top traders’ positioning measures lean short. The disagreement matters: it does not look like a clear, market-wide pile-up of shorts that must be squeezed, or longs that are certain to be liquidated. We also do not have verified liquidation levels, taker-flow data, or order-book evidence. So I would not claim that a particular price is a liquidation magnet or that a squeeze is underway. The wider market is a real part of this story. Total crypto market value is down about 5% in the latest snapshot, and fear is at 10, compared with 28 a week ago. Recent coverage described broad market stress and liquidations. That makes BNB’s fall look partly connected to risk aversion across crypto, not necessarily to a single BNB-specific event. If Bitcoin and the wider market stabilize, BNB could benefit; if they weaken again, local support may be less reliable. BNB Chain’s fundamentals are mixed over different timeframes. Over 30 days, fees fell 33%, TVL fell 14.7%, and stablecoin supply fell 3.7%. Those declines are a genuine headwind, though they do not identify the cause of the current selloff or time a trade. In the other direction, reported 30-day DEX volume is $29.2 billion, and a 12-month merchant-payments report found BNB Chain and Tron handled 75% of merchant USDT pay-ins. That is evidence of use, but not proof that buyers are stepping in now. My analytical view: the downtrend remains intact, while oversold conditions and nearby support make an immediate bearish continuation less certain. The most informative evidence next will be whether $565.84 holds on a retest, whether price can sustain a reclaim above $604.84, and whether any recovery comes with broader-market stability. Until those questions are answered, both a relief bounce and another leg down remain plausible. #IMPACTbyTrade
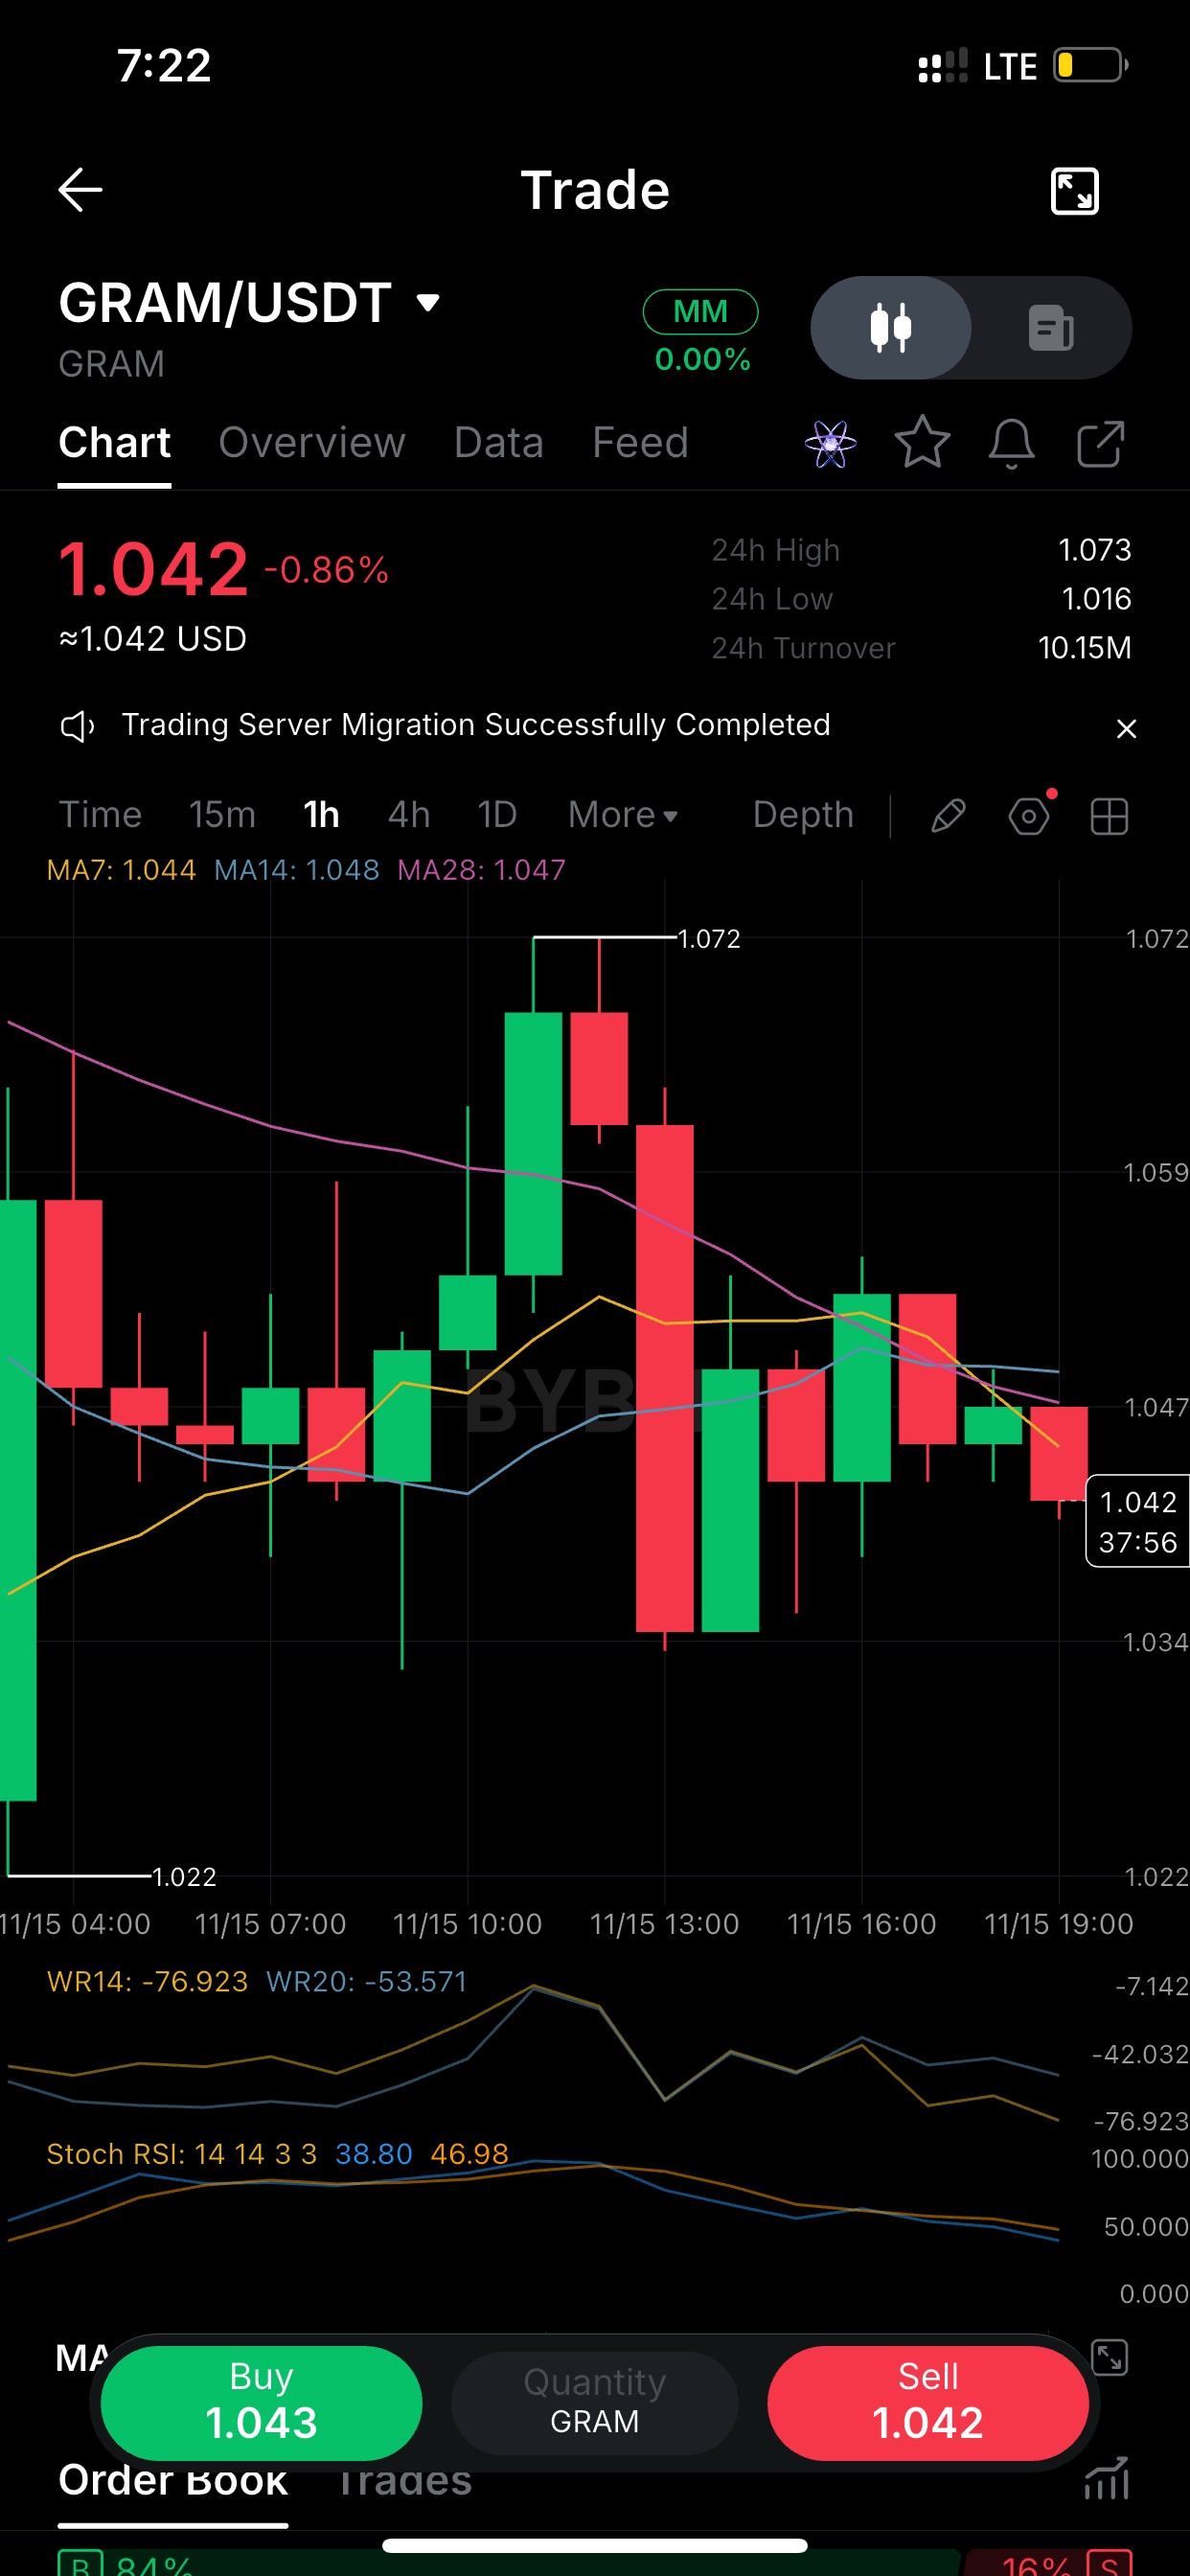
$GRAMUSDT printed 1.072 around 10:00 UTC and got sold straight back down. The red candle that followed erased almost the whole move and wicked to 1.034. Since then it's been lower highs, and price now sits at 1.042 under all three MAs (7/14/28 clustered at 1.044-1.048). That cluster is the first thing bulls need to reclaim. Until then I treat bounces as rallies into resistance, not a trend change. GRAM/USDT, 1h. Range is clean: 1.022 low, 1.072 high, and price is chopping in the lower half at 1.042. Momentum read: Stoch RSI is mid-range (about 39/47), so it's not oversold and there's room to slide further. Williams %R(14) is at -77, leaning weak but not washed out. If 1.034 (the last swing low) breaks on a closing basis, I'd expect a retest toward the 1.02 area. If buyers push back above 1.048, the bias flips neutral. Waiting on one of those two. 24h turnover on $GRAM is about 10M with a 1.016-1.073 range, so it's moving, but the 1h structure says sellers have the upper hand right now. Not chasing either side here. The setup I'd watch: a 1h close back above the MA cluster near 1.048 with a green candle that holds. Without that, every pop is just noise inside the range. One heads-up: the GRAM/USDT screen shows an MM tag and 0.00% fee badge. If this is a zero-fee or market-maker pair, trades on it are excluded from the trading impact part of the score. Your posts can still earn points on content quality, engagement and consistency, so make sure to use the coin tag or trading widget on each post. Also, spread these out over the day rather than posting all three at once, since high-frequency posting can get muted. #IMPACTbyTrade
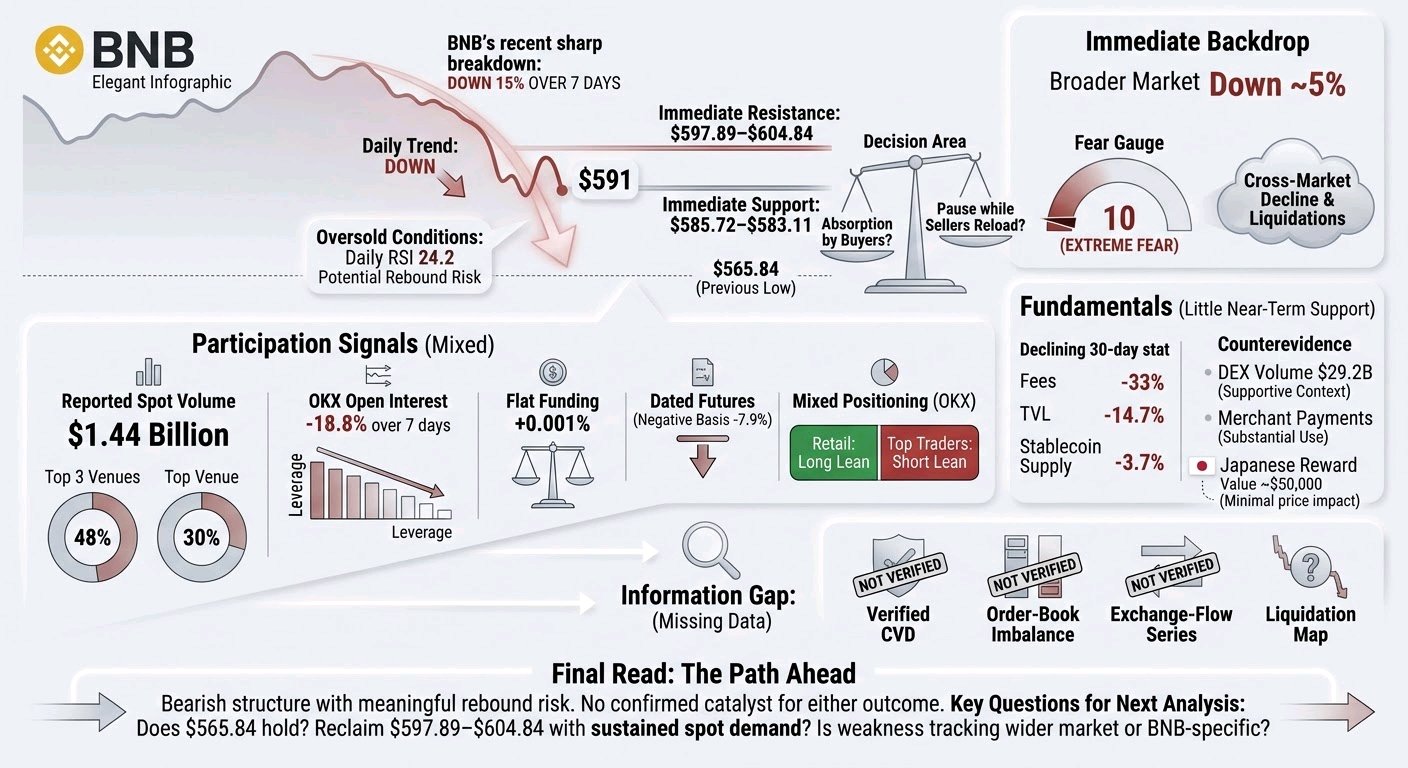
$BNBUSDT is trying to stabilize after a sharp breakdown, but I don’t yet see evidence that the market has changed character. The key distinction is whether buyers are absorbing supply—or merely taking a pause while sellers reload. Verified: BNB is near $591, down 15% over 7 days. It fell to $565.84 and rebounded as high as $599.63, but recent hourly closes failed to hold above $597.89. The 1-hour, 4-hour and daily trends remain down. Daily RSI is 24.2, which signals oversold conditions, not a confirmed bottom. Price remains below the 1-hour EMA50 at $604.84, the 4-hour EMA20 at $615.86, and the daily EMA20 at $674.78. That leaves a nearby decision area. $585.72–$583.11 is short-term support; below it, the market would be testing $565.84 again. If that low breaks and price cannot quickly reclaim it, sellers retain control. On the other hand, a sustained move above $597.89–$604.84, followed by a successful retest, would be more meaningful than a brief intraday spike. The next substantial resistance is around $620.60–$620.85. Could BNB reclaim those levels while the broader market remains weak? That would be stronger evidence of demand than oversold readings alone. Participation signals are mixed. Reported spot volume is $1.44 billion across 62 venues, but the top 3 account for 48%, with one venue representing 30%. That makes the headline volume less persuasive as proof of broad-based buying. Perpetual open interest is $563 million across 4 tracked venues; OKX open interest is down 18.8% over 7 days. That suggests leverage has been coming out there, but it does not establish the direction of aggregate market-wide positioning. Funding is nearly flat at +0.001% per 8 hours, while dated futures trade at a negative 7.9% annualized basis. On OKX, retail accounts lean long, while top traders’ positioning leans short. Those crosscurrents do not point to an obvious, crowded short that must be squeezed. The important gap is what we cannot establish from these figures: there is no verified CVD, order-book imbalance, exchange-flow series, or liquidation map here. So we cannot confidently say whether spot buyers absorbed the selloff, where forced liquidations clustered, or whether the rebound was driven mainly by short covering. A liquidation level, if identified, would be a possible volatility point—not a guaranteed turning point. The immediate backdrop also matters. The broader crypto market is down about 5% in the latest snapshot, with fear at 10, down from 28 a week ago. News on Nov. 13 described a sharp cross-market decline and forced liquidations as Bitcoin and other major assets fell. That supports the interpretation that BNB’s slide was amplified by general risk aversion, rather than being solely a BNB-specific event. But it raises a useful question: if the broader market stabilizes, does BNB recover with it—or continue to lag? Fundamentals give little near-term support for a bullish reversal. Over 30 days, BNB Chain fees fell 33%, TVL fell 14.7%, and stablecoin supply fell 3.7%; these figures reinforce a weaker activity backdrop, though they do not prove what caused this week’s price move. There is counterevidence: reported 30-day DEX volume is $29.2 billion, and a recent merchant-payments report described substantial use of BNB Chain. Those are supportive context, not evidence of new buying pressure. A Japanese company’s announced BNB shareholder reward is worth watching, but its reported value is only about $50,000 and the reference date is Dec. 31. It does not look large enough to explain this selloff or reverse it by itself. My read: bearish structure, meaningful rebound risk, and no confirmed catalyst for either outcome. The next analysis should answer three questions: does $565.84 hold on a retest; can BNB reclaim $597.89–$604.84 with sustained spot demand; and is the weakness still tracking the wider market, or becoming BNB-specific?#IMPACTbyTrade

NEAR SPOT BUY 🟢 GREAT OPPortunity
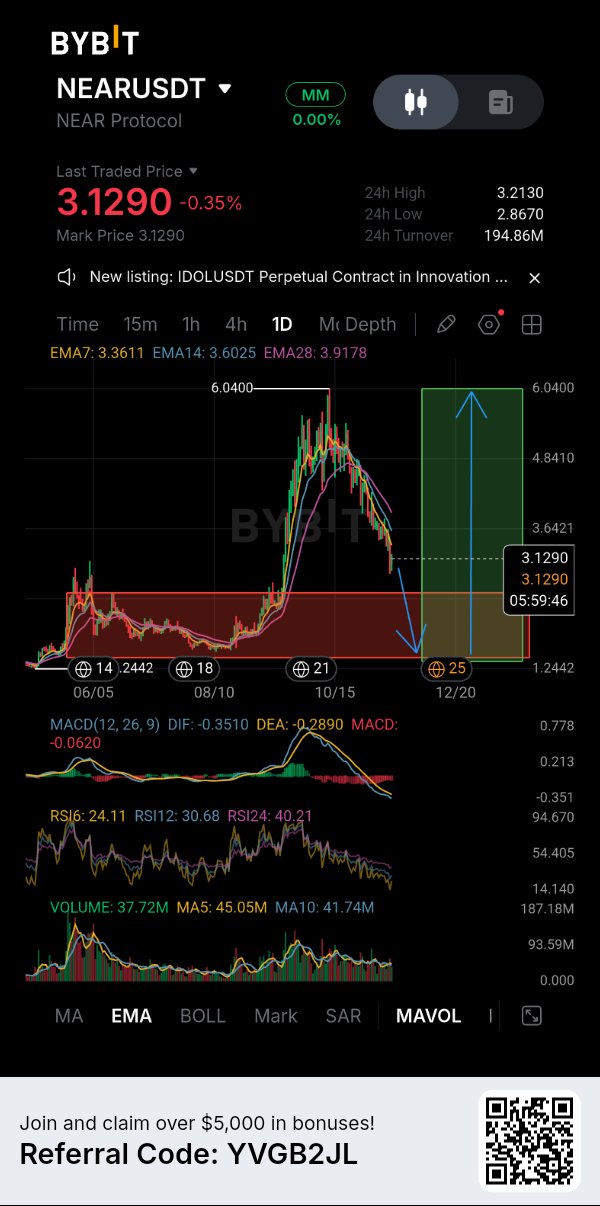
$NEAR EMERGENCY UPDATE : DOWNTREND IS GETTING DEEPER, BUT I'M WATCHING THE BIGGER OPPORTUNITY💯 $NEARUSDT is currently trading around $3.129, and the daily chart is showing clear signs of weakness. After the strong rally toward $6.04, price has gradually lost momentum and sellers have taken control. What concerns me most is that NEAR is now trading below all three visible EMAs. The EMA 7 is at $3.3611, EMA 14 at $3.6025, and EMA 28 at $3.9178. This bearish alignment tells me that buyers still have some work to do before the recovery becomes convincing. MY BYBIT 👉 WHAT THE DAILY CHART IS TELLING ME📊 RSI is another important detail here. RSI 6 is sitting at 24.11, RSI 12 at 30.68, and RSI 24 at 40.21. Short-term momentum is clearly stretched toward oversold territory. Meanwhile, MACD remains negative, with DIF at -0.3510 and DEA at -0.2890. The histogram is also below zero. So, although a relief bounce is possible, I don't want to confuse oversold conditions with a confirmed trend reversal. TWO SCENARIOS I'M WATCHING🟢🔴 BULLISH SCENARIO🟢 First, I want to see NEAR defend its current lower price region and establish some buying strength. The first recovery area I'm watching is around $3.36, followed by $3.60 and $3.92, where the visible EMAs are positioned. Reclaiming these levels would gradually improve the daily structure. A stronger recovery could eventually bring the previous $6.04 swing high back into focus, but that's a much bigger possibility, not an immediate target. BEARISH SCENARIO🔴 If sellers continue pushing price lower, the recent 24H low around $2.867 becomes an important nearby reference. A sustained breakdown could expose the much wider historical support region visible around $1.24. The chart annotation also illustrates a possible deeper correction before a larger recovery. However, I would need to see actual price confirmation before treating that projection as a realistic trading setup. FOR TRADERS ALREADY HOLDING NEAR🎯 I wouldn't make decisions based on RSI alone. If price starts recovering toward the EMA resistance cluster, partial profit-taking could be considered depending on individual entry prices. For anyone looking to build a larger position, I'd prefer seeing a confirmed recovery rather than averaging down blindly during continued weakness. RISK MANAGEMENT⚠️ $2.867 area deserves attention as the recent daily low. Losing it could increase downside pressure. A bounce without confirmation isn't a reliable entry. Liquidity zones aren't automatically buying opportunities either. Entry, stop-loss, position sizing, and risk-to-reward should all be considered before taking a trade. MY FINAL THOUGHTS🤔 I still see potential for a larger recovery in NEAR, but the current daily structure isn't bullish yet. I'd rather wait for buyers to prove themselves than rush into a falling market. Sometimes protecting capital during a weak market is the best trade. Are you accumulating NEAR at these prices, or waiting for a deeper correction before considering an entry? #IMPACTbyTrade #WSOT2026 #WSOTShowYourAITradeToEarn10USDT #JensenHuangExitTestsNvidiasAILeadership #USPPITestsTheHigherForLongerTrade


⚠️ ZRO/USDT — Is This a Deeper Correction Before Recovery, or Has the Trend Broken? ZRO is trading near $1.3765, down 10.33% in 24 hours, after falling from the recent $1.5468 high. The 24H low is $1.3421. Both 4H and daily charts remain weak; oversold RSI alone is not a buy signal. On 4H, RSI(6) is 25.94, RSI(12) 31.68 and RSI(24) 37.43. Daily RSI readings are also weak: 25.27, 34.93 and 42.69. Oversold conditions can bounce, but timing is uncertain. MACD is negative on both timeframes. On 4H, DIF is around -0.0392 versus DEA at -0.0230, with a negative histogram near -0.0162. Daily DIF is -0.0863 and DEA -0.0605. Volume is 332.60K, below MA5 at 575.88K and MA10 at 663.76K. Sellers remain in control; volume does not show a clear capitulation spike. The moving averages reinforce the caution. On 4H, MA7/EMA7 sit near $1.4406/$1.4416, MA14/EMA14 near $1.5041/$1.4792, and MA28/EMA28 around $1.5326/$1.5140. Daily averages are even higher: MA7 $1.4974, MA14 $1.5957 and MA28 $1.6837. Price must reclaim these areas; one bounce will not erase the downtrend. The Fibonacci map is important. The 4H chart marks $1.5042 as the 0.0 reference and $1.3817 as 1.0. Between them are 0.236 at $1.4753, 0.382 at $1.4574, 0.5 at $1.4430, 0.618 at $1.4285 and 0.786 at $1.4079. ZRO is now below the 1.0 level, so the full measured retracement has been exceeded. These are reference zones, not guaranteed support. Fundamentals are more nuanced than the chart. LayerZero says its interoperability protocol connects 165 networks and has moved more than $260B in cross-chain value. Its June 2026 token explanation describes ZRO as the asset intended to capture value across LayerZero, Stargate and the planned Zero network. Stargate revenue is directed to ZRO buybacks, while a separate LayerZero protocol fee switch would require governance activation before it can generate buyback-and-burn demand. Zero is designed for institutional settlement, payments and capital markets, with partners including DTCC, ICE, Citadel Securities, Tether and Google Cloud. These ambitions matter, but planned economics are not yet fully realized token value. There is also a near-term supply event. DeFiLlama lists 23.63M ZRO scheduled to unlock on November 19, around 5.91% of current circulating supply, allocated to core contributors and strategic partners. Unlocks do not mean automatic selling. LayerZero says actual investor sales have been below headline unlocks and points to Foundation and Stargate-funded buybacks. Still, new supply arrives while the chart is weak. Levels I am watching: 🔴 $1.4079: First Fibonacci reclaim level (0.786). A recovery above it would be an early sign of stabilization. 🔴 $1.4285–$1.4430: Fibonacci 0.618/0.5 zone, close to the 4H MA7 area. Reclaiming and holding this band would improve short-term structure. 🔴 $1.4574–$1.4753: Fibonacci 0.382/0.236 resistance. Buyers need to defend a retest after a breakout. 🔴 $1.5042: Fibonacci 0.0 reference and near the 4H MA14. A sustained reclaim would be a more meaningful recovery signal. 🟢 $1.3817: Fibonacci 1.0 reference, now just above price and an immediate reclaim test. 🟢 $1.3421: Visible 24H low. A decisive break below would expose further downside and weaken the case for a near-term base. I prefer evidence over trying to call a bottom. First I want price to reclaim $1.3817, then hold $1.4079 and work back through $1.4285–$1.4430 with improving volume. If rallies keep failing below the moving averages, the downtrend remains intact. A break under $1.3421 would make me more defensive. I would not treat oversold RSI as a standalone long signal. ZRO has a credible cross-chain role, but adoption, buybacks, fee-switch activation and token demand must be proven, not assumed. Strong fundamentals cannot cancel weak market structure. 🔥 Will ZRO reclaim $1.4079 and build a base, or will the November unlock and bearish momentum push it below $1.3421? $ZROUSDT #IMPACTbyTrade
ETH:槓桿重置尚未完成
以太幣在經歷上週劇烈的清算週期後,目前交易仍承受壓力。最新的 CoinGlass 快照顯示 ETHUSDT 價格接近 1,816.60 美元,24 小時內下跌 1.32%,七天內下跌 14.35%。當日價格區間在 1,710 美元至 1,857.60 美元之間。買方雖守住了低點,但並未有說服力地收復高點。 衍生品數據顯示部分槓桿已離場,儘管該過程尚未結束。以太幣期貨總未平倉量接近 219 億美元,24 小時內下降 3.02%。與此同時,被追蹤的清算額達到約 3.6082 億美元,其中 2.7974 億美元來自多頭部位。價格下跌伴隨未平倉量減少,這顯示部位正在被平倉或清算,而不一定是新的空頭部位進場。 Bybit 的 ETHUSDC 永續合約提供了一個有用的交叉驗證。其未平倉量約為 13.6 億美元,24 小時內下降 2.55%,而資金費率約為每八小時 -0.0047%。負的資金費率意味著空頭正在支付給多頭,這顯示永續合約市場正以看跌溢價進行交易。Bybit 在同一 24 小時窗口內記錄了約 3,713 萬美元的以太幣清算,其中多頭清算佔 3,332 萬美元,空頭僅佔 381 萬美元,明顯向多頭傾斜。市場曝險正在下降,但多頭仍被迫離場。 衍生品與現貨活動之間的不平衡是另一個警訊。CoinGlass 報告顯示以太幣期貨交易量約為 644.5 億美元,而現貨交易量為 44.8 億美元,比例約為 14.4 比 1。這表明短期走勢可能更多是由槓桿驅動,而非持久的現貨累積。最新的美國現貨以太幣 ETF 數據顯示,11 月 13 日的淨流入僅為 230 萬美元,不足以形成持續的需求趨勢。 若以太幣要實現可信的復甦,不僅僅是從 1,710 美元區域反彈,還需要更多證據。現貨參與度應加強,未平倉量應在資金費率未變得過於激進正向的情況下趨於穩定,且價格應保持在近期的日內復甦區上方。如果價格回落至低點,且多頭清算仍佔主導地位,那麼市場可能仍在經歷調整過程。 關鍵問題: 1. 在最新一波清算浪潮後,以太幣能否守住 1,710–1,800 美元的區間? 2. 現貨交易量是否會擴大到足以支撐超越衍生品交易的復甦? 3. 未平倉量的下降是代表槓桿削減的健康跡象,還是僅僅是另一階段的被迫離場? IMPACTbyTrade

Can a network that sells blockchain data access to everyone survive if the market barely trades its own token? That is the tension around Lava. The project positions itself as a decentralized access layer, where independent providers serve RPC requests and applications pay for reliable connectivity. The problem is real. Many "decentralized" apps still depend on a few centralized RPC vendors, which quietly reintroduces single points of failure. If Lava delivers a credible multi-provider alternative, the technology matters. The screen shows something narrower. LAVA trades at 0.01596 USDT, down 2.15% on the session, with 574.58K displayed beside the ticker. If that is LAVA-denominated volume, the notional is roughly 9,000 USDT. That is my arithmetic, not a confirmed exchange statistic, and I can't verify the time window. It does frame the question: an infrastructure token needs real market depth before any usage story can be priced with confidence. The contradiction sits in who the customer is. Developers buying data access want cheap, predictable costs, not token exposure. Paying in the token is a design choice, not a necessity. If demand comes mainly from incentives, with providers earning rewards for serving requests, the token reflects subsidy rather than consumption. Nothing supplied shows revenue, supply, unlocks or fee data, so I won't pretend to know which one dominates. The bull case is that RPC is a recurring cost for every onchain application. Capturing even a small share of that spend through token-linked settlement could make a sub-two-cent asset look mispriced. The bear case is that centralized providers already compete well on latency and price. Developers switch only when decentralization becomes a purchasing criterion rather than a talking point. The critical risk is that the token's utility can be bypassed. Entrenched competitors plus optional token payments is a hard combination, and thin liquidity makes it worse. When small orders move price, a single-day percentage change says very little. My view: the thesis is plausible, but the evidence in front of me doesn't confirm it. A 2.15% decline on light turnover is noise, not a verdict on fundamentals. The next milestone is verifiable growth in fee-paying request volume, reported separately from incentive-funded activity, along with the share of provider rewards covered by organic fees. That would show whether usage is earning its place rather than being paid for. If Lava's customers could pay in any currency, would the token still be necessary? $LAVAUSDT #IMPACTbyTrade

SOLUSDT:反彈力道減弱,面臨阻力
後續的反彈在未能完全收復失地的情況下停滯不前:$SOLUSDT 目前在 71.06,而上一根收盤 K 線收在 71.42。早些時候,12:00 的紅色 K 線收於 70.76,14:00 的紅色 K 線收於 69.98,顯示賣方在買方進場前正持續向下施壓。隨後的 15:00 綠色 K 線在該序列中以最大成交量收於 71.11,這是一個真正的回應,但尚未形成持久的控制權轉移。 復甦行情持續到 19:00,當時一根綠色 K 線收於 72.87,但隨後的推升遭到拒絕:21:00 的紅色 K 線在經歷該序列中最大的波動區間後收於 71.3。到了 23:00,買方僅能勉強收在 71.42。價格目前低於 MA7、MA14 和 MA28,因此這波反彈尚未修復小時級別的結構。24 小時跌幅為 2.78%,成交量約為前一天的 1.31 倍;下跌伴隨著成交量放大,儘管出現了反彈,我的看法仍然偏向看跌。 我持有 SOL 現貨,我將做空視為一個有條件的策略,而不是在此追逐弱勢。入場區間為 70.748 - 71.372;如果測試該區間時未能收復附近的移動平均線,賣方將擁有更明確的佈局優勢。止損點設在 72.932,目標價 TP1 為 69.5,TP2 為 67.94。從該區間的中間位置計算,TP1 的盈虧比約為 0.8:1,TP2 為 1.7:1,因此第一個目標相對於風險來說較為保守。 如果價格突破止損區並站穩,看跌觀點將減弱;若在試圖收復失敗後再度失守,則將支持此觀點。24 小時的波動區間和 21:00 那根長 K 線提醒我們行情可能劇烈波動,因此我會謹慎執行並留意滑價,而不將這些點位視為絕對保證。你會關注什麼樣的訊號來區分真正的「小時級別收復」與賣方可以隨時做空的「反彈」? 交易計畫 (做空 / 看跌): • 支撐位: 67.41 / 67.41 | 阻力位: 73.65 / 85.82 • 入場區間: 70.748 - 71.372 • 止損 (SL): 72.932 • 目標價: TP1 69.5 | TP2 67.94 你會關注什麼樣的訊號來區分真正的「小時級別收復」與賣方可以隨時做空的「反彈」? 僅為個人觀點,不構成投資建議。IMPACTbyTrade

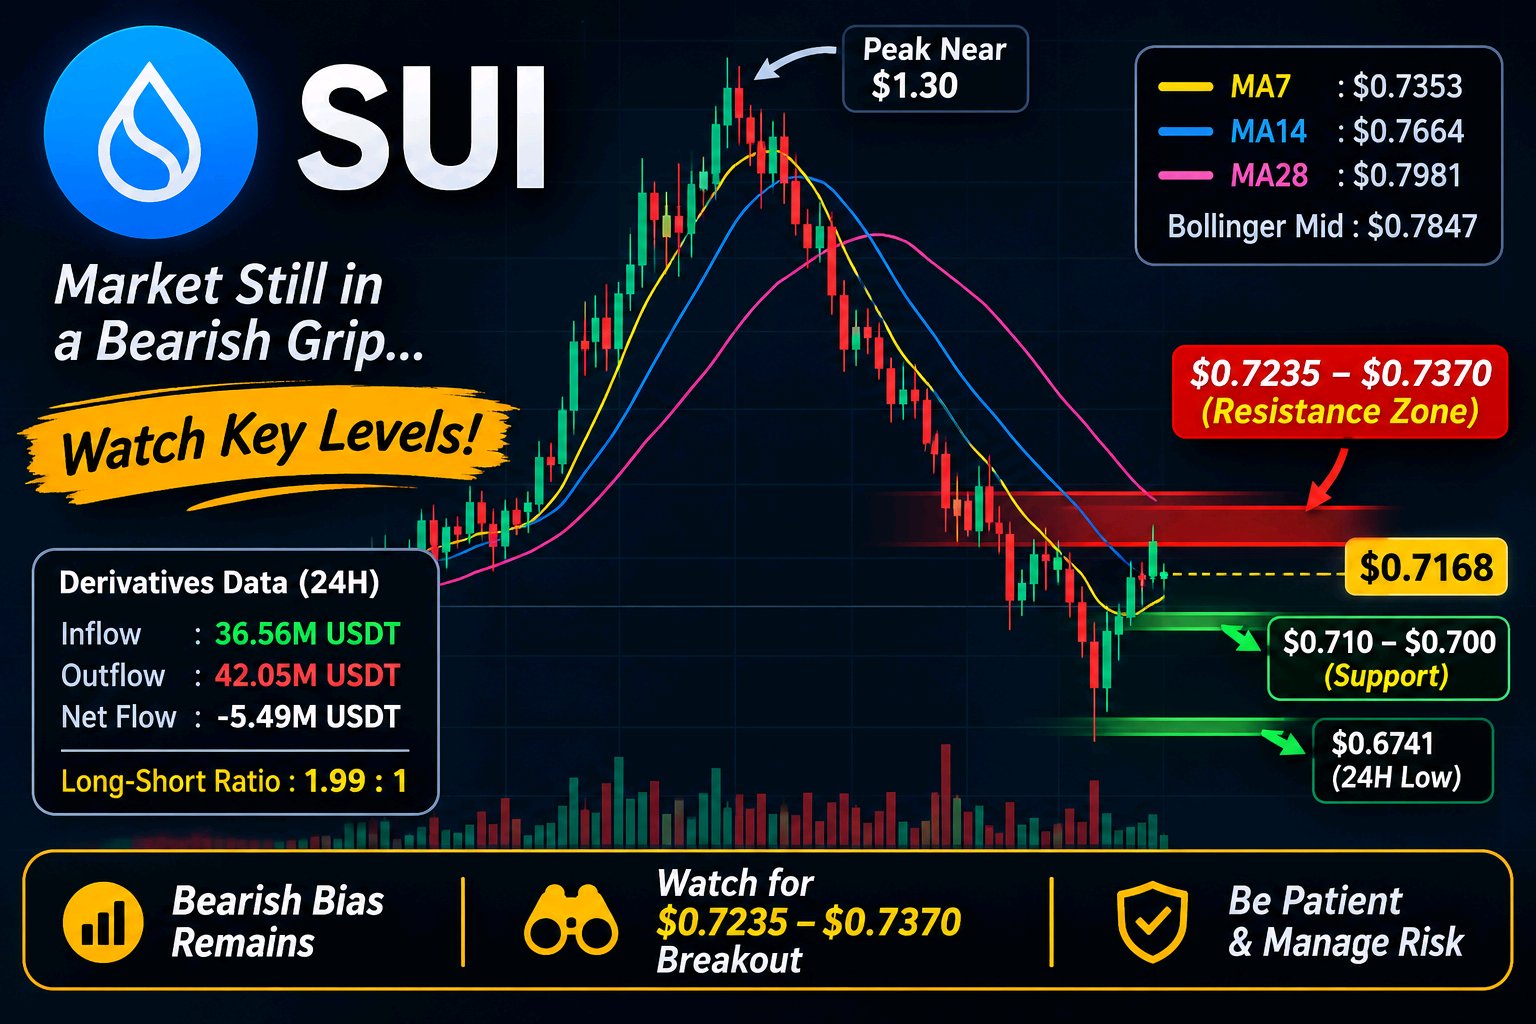
I've been watching $SUIUSDT closely, and what concerns me most right now is that the price is still struggling to build a strong recovery. Trading around $0.7168, SUI remains under selling pressure, and the overall market structure hasn't shown any convincing signs of a bullish reversal yet. There is a small recovery on the lower timeframe, but I don't think it's enough to change the bigger picture. Looking at the 6H chart, the downtrend is quite clear. SUI previously reached around $1.30, but since then, sellers have maintained control, pushing the price into a pattern of lower highs and lower lows. The moving averages support this bearish outlook. MA7 is around $0.7353, MA14 is near $0.7664, and MA28 stands at approximately $0.7981. With the current price trading below all three, buyers still have some work to do before the market can regain strength. Another level I'm paying attention to is the Bollinger middle band around $0.7847. If SUI manages to recover and hold above this area, it could be an early sign that buying momentum is improving. Until then, I would remain cautious. On the 15M chart, SUI has bounced after dropping toward $0.669. However, the recovery is facing resistance around $0.7235–$0.7370. This zone matters because it brings together the short-term moving averages and the upper part of the immediate recovery area. If buyers fail to reclaim it, the current bounce could simply develop into another lower high rather than the beginning of a new uptrend. The derivatives data adds another interesting perspective. The long-short ratio is approximately 1.99:1, showing that long positions are considerably higher than short positions. Meanwhile, 24H derivatives inflows are around 36.56M USDT, while outflows have reached 42.05M USDT, leaving a negative net flow of approximately 5.49M USDT. This suggests that more capital is leaving the derivatives market than entering it. With long positioning already elevated, another downward move could create additional liquidation pressure. For the downside, I'm watching $0.710–$0.700 first, followed by the previous 24H low at $0.6741. On the upside, $0.7386 is the first important level buyers need to reclaim. A stronger recovery would require sustained buying pressure rather than just a temporary bounce. Personally, I'm staying patient with SUI. I'm not treating this as an active long or short position. I want to see how price reacts around these levels before making a decision. Right now, protecting capital and waiting for confirmation makes more sense to me than rushing into a trade. #IMPACTbyTrade
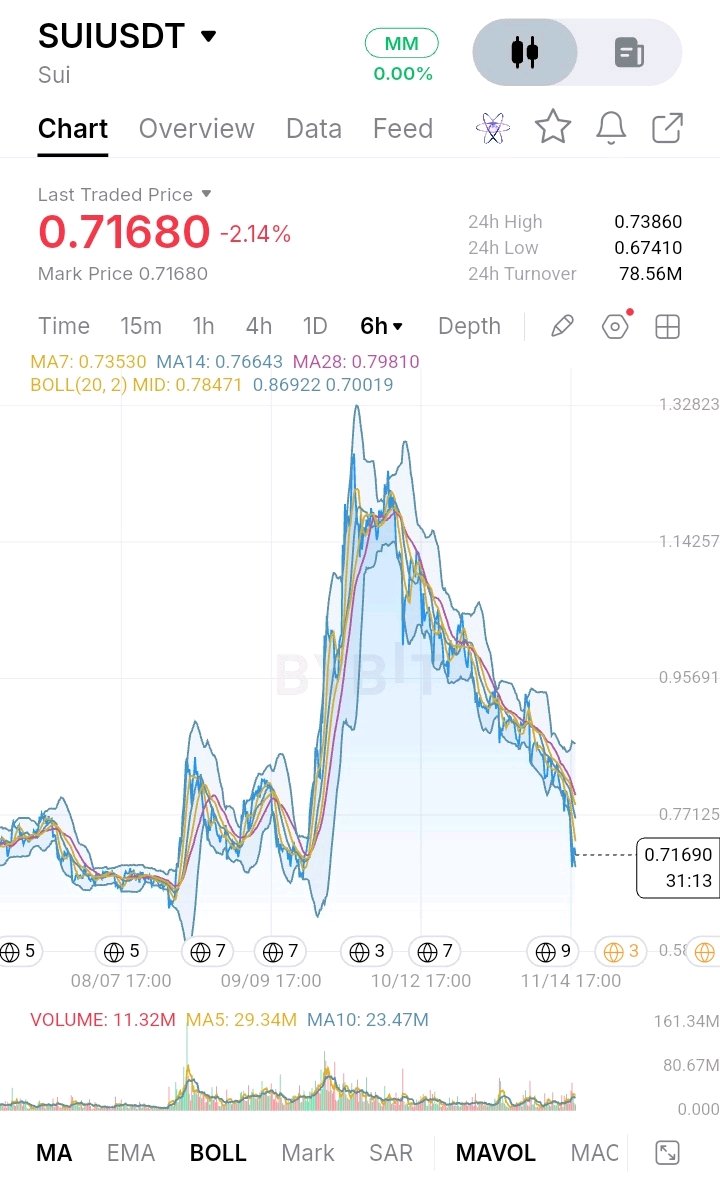
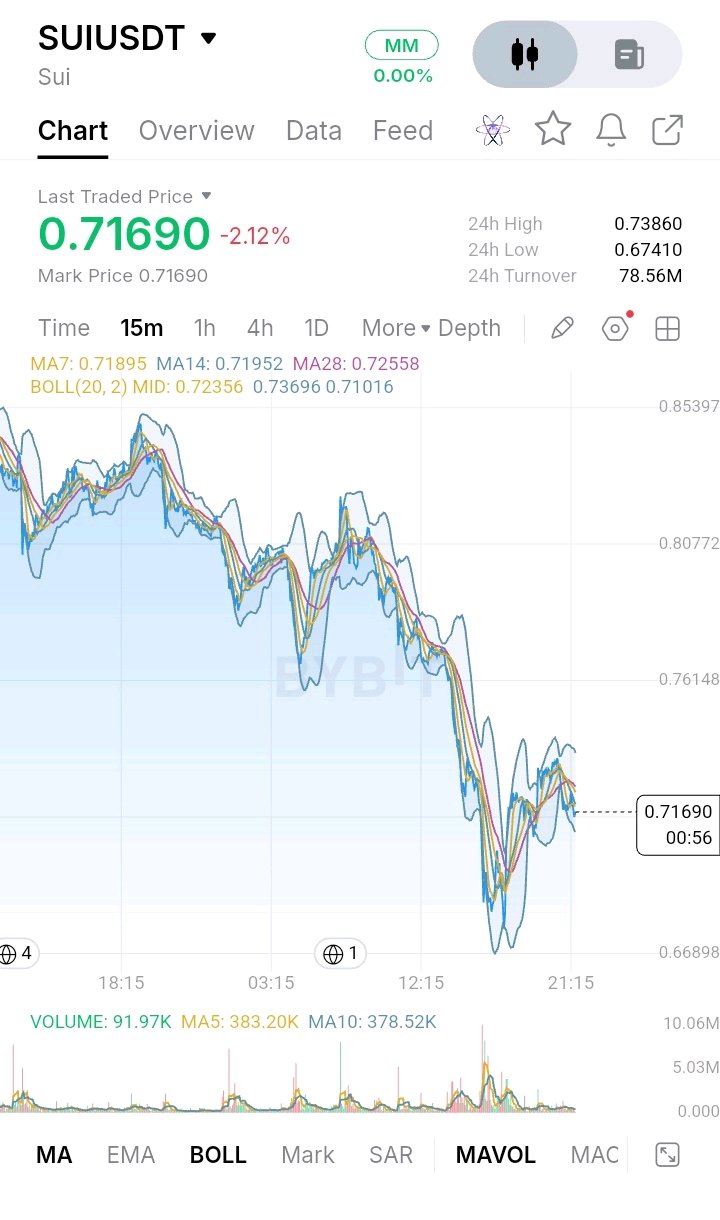

SUI Is Struggling to Hold $0.72 After Its Bounce From $0.6754 — Recovery or Another Breakdown? SUI has recovered sharply from $0.6754, but the rebound is now losing momentum around the $0.72 area. What makes this setup interesting is that buyers managed to recover a significant part of the drop, yet they have not reclaimed the resistance levels needed to change the broader trend. SUI/USDT: $0.7171 | -1.04% The 4H trend remains bearish The moving averages tell an important story: - MA7: $0.7181 - MA14: $0.7502 - MA28: $0.7816 Price is hovering around the 4H MA7 but remains well below MA14 and MA28. Both longer averages are still above the market, showing that sellers retain control of the broader structure. For buyers, reclaiming $0.7392 would be an early improvement. A stronger confirmation would require a sustained move above $0.7502. The 15-minute chart shows fading momentum The lower timeframe is also showing some weakness: - MA7: $0.7196 - MA14: $0.7201 - MA28: $0.7262 SUI is trading below all three short-term averages. The recent recovery has stalled, and the moving-average cluster around $0.7200–$0.7262 is now acting as overhead resistance. Volume adds another caution: current displayed 15m volume is 7.15K, compared with MA5 at 58.36K and MA10 at 55.71K. The rebound is not currently supported by strong trading participation. Key levels to watch Resistance - $0.7200–$0.7262: Short-term moving-average zone - $0.7392: 24H high and immediate breakout level - $0.7502: 4H MA14 - $0.7816: 4H MA28 Support - $0.7000: Nearby psychological and chart level - $0.6754: Recent low and major support Trading outlook Bias: WAIT — bearish structure, with a possible short-term recovery. A sustained breakout above $0.7392 could improve the recovery and bring $0.7502 into focus. Stronger confirmation would come if SUI reclaims the 4H MA14 with convincing volume. If price continues to struggle below $0.7262 and loses $0.7000, sellers could push it toward $0.6754 again. A decisive breakdown below $0.6754 would invalidate the current recovery structure and signal renewed downside pressure. I would avoid chasing either direction while price remains trapped between nearby support and resistance. The next confirmed move matters more than the temporary bounce. Do you think SUI can reclaim $0.7502, or will sellers push price back toward $0.6754 first? What are you watching on the 4H chart?$SUIUSDT #IMPACTbyTrade

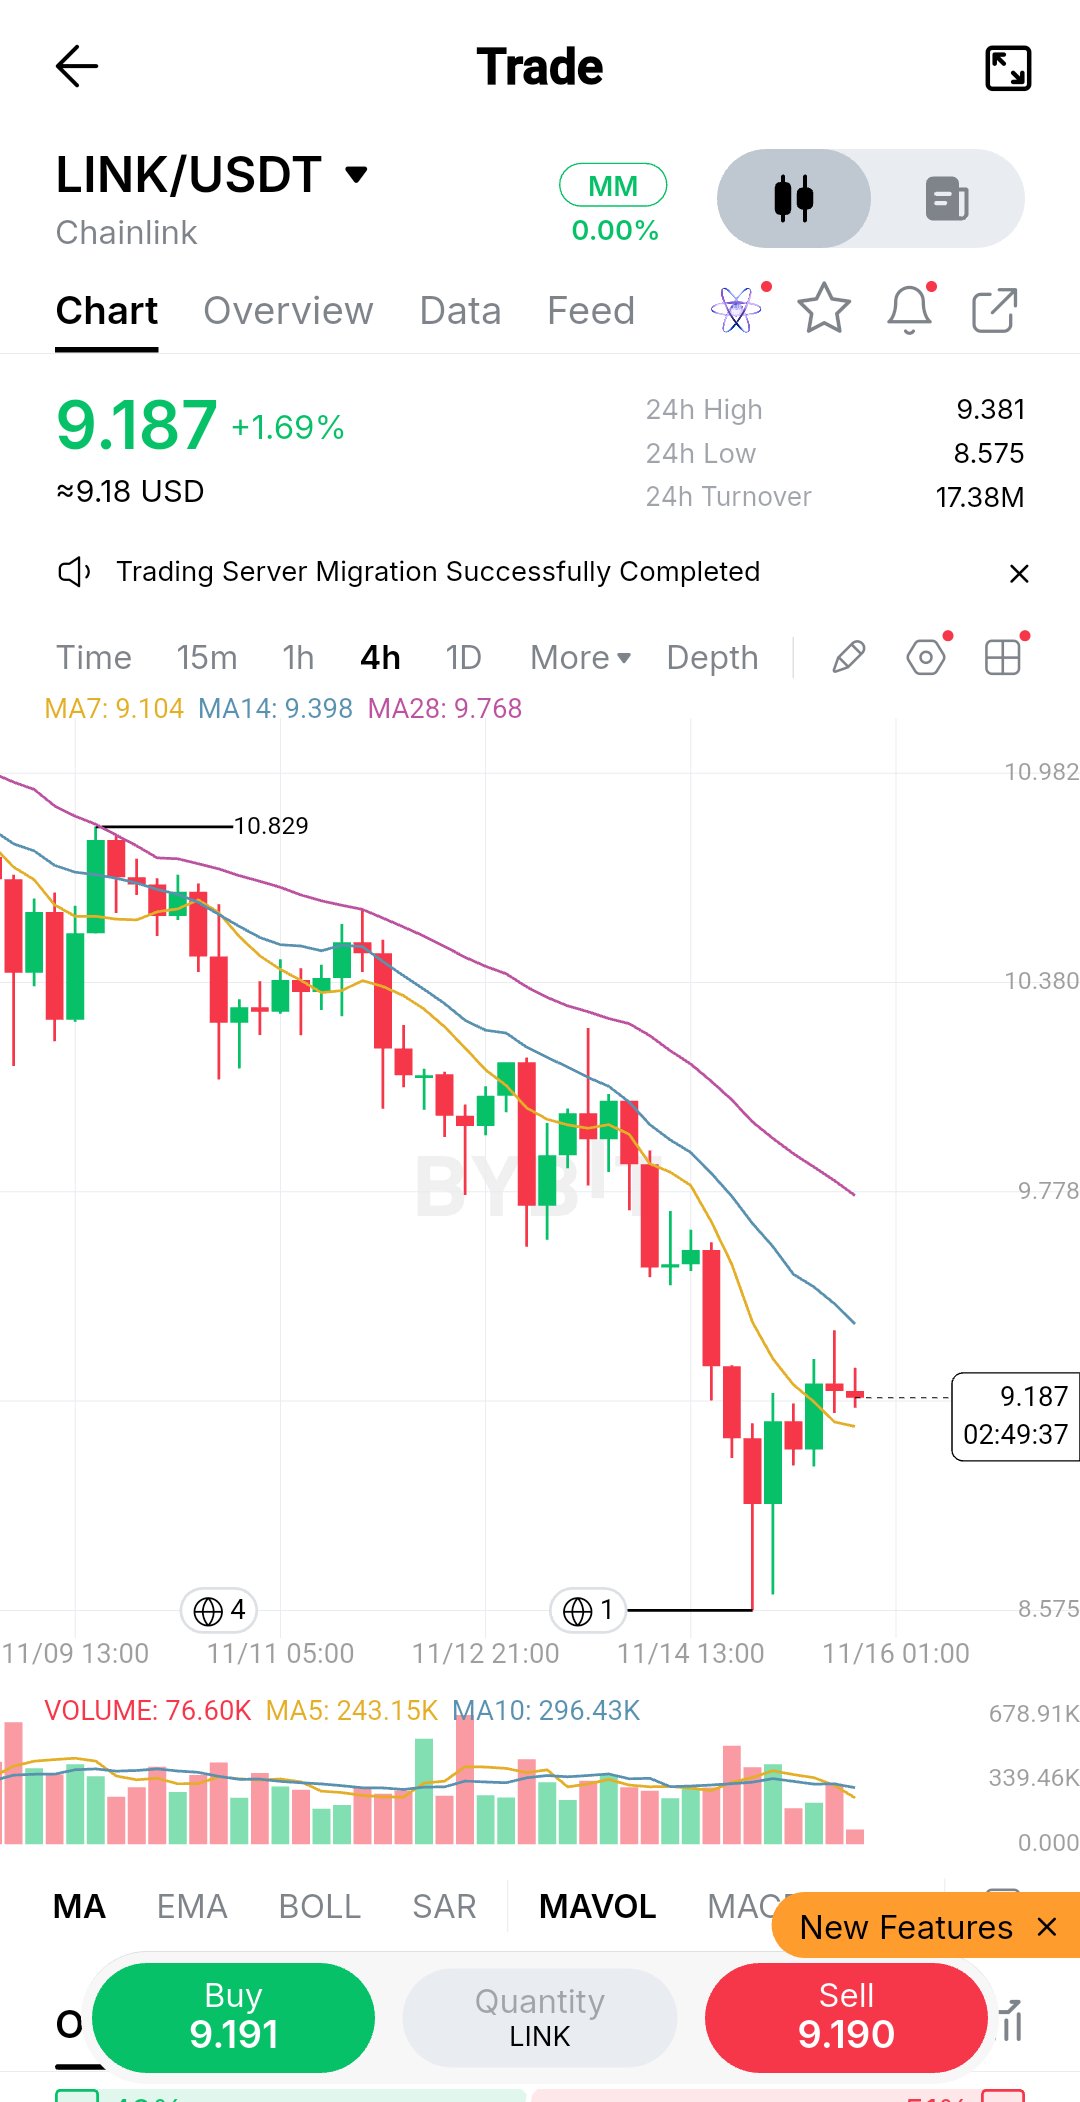
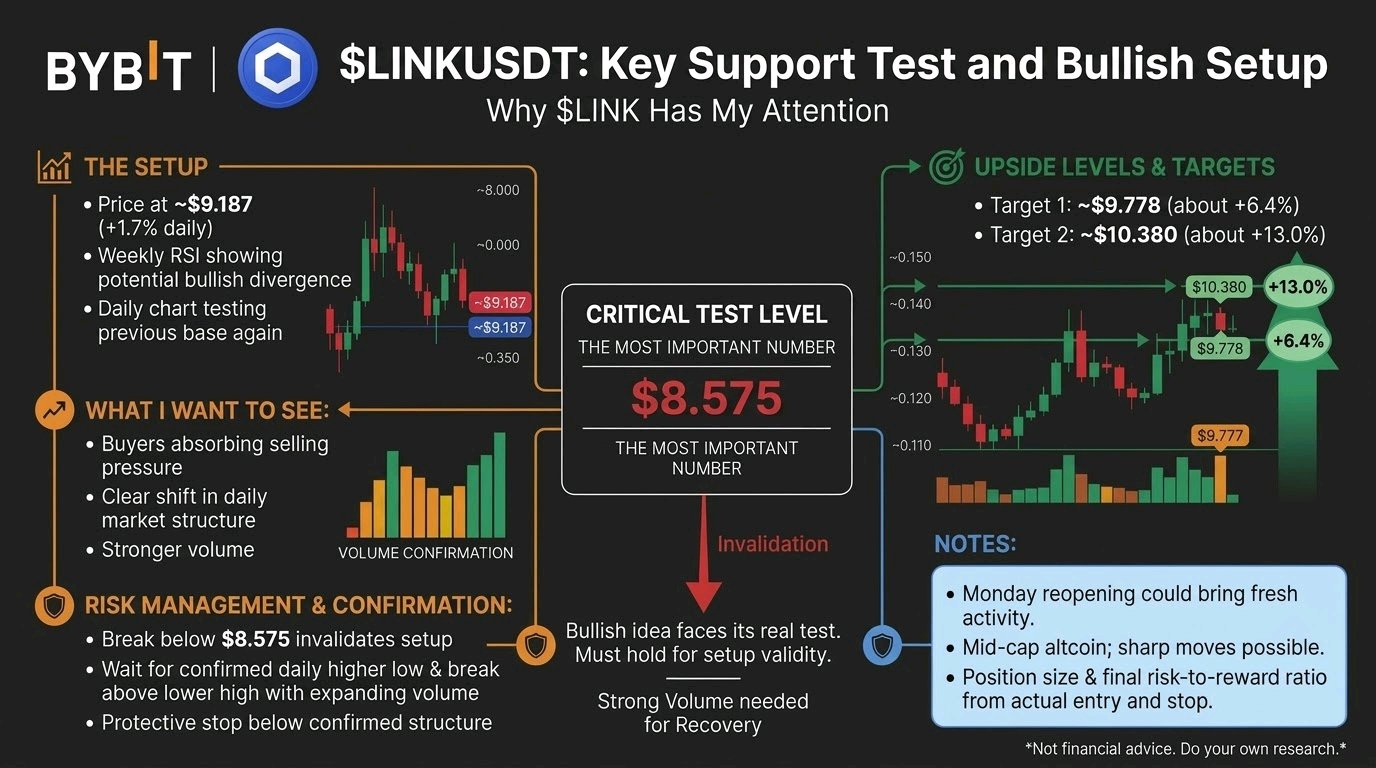
One red line. Two upside levels. This is why $LINKUSDT has my attention. The most important number on my chart is $8.575. That's where my bullish idea faces its real test. The setup $LINK is up about 1.7% on the day at roughly $9.187 after a bounce off the lows, and it is trading far below its prior highs after a steep multi-day slide. Weekly RSI analysis suggests a possible bullish divergence. The daily chart has already shown an initial reaction, and price is now testing that base again. What I want to see is buyers absorbing the selling pressure, followed by a clear shift in daily market structure. If that happens with stronger volume, I'm watching two swing levels: 🎯 Target 1: ~$9.778 (about +6.4% from $9.187) 🎯 Target 2: ~$10.380 (about +13% from $9.187) These are ambitious scenarios, not guaranteed returns. Monday's reopening of traditional markets could bring fresh activity, but $LINK needs its own buying volume to support a meaningful recovery. As a mid-cap altcoin, sharp moves can happen in either direction. Management: If price breaks below $8.575 and cannot recover that level, my bullish setup is no longer valid. For a new position, I want a confirmed daily higher low, a break above the latest lower high, and expanding volume. The protective stop belongs below the confirmed structure. Position size and the final risk-to-reward ratio must be calculated from the actual entry and stop, not assumed in advance. I'm heavily bullish on $LINK's recovery potential, but the next volume-backed move will determine whether this remains a promising chart or becomes a trade worth taking. Not financial advice. Do your own research and manage your risk. #IMPACTbyTrade

GLMR/USDT — Buyers Have Finally Stepped In, But Can They Turn This Bounce Into a Real Reversal? GLMR has caught my attention after the latest move. After spending weeks under selling pressure, buyers have suddenly stepped in and pushed the price toward $0.00790. The move is strong, and the volume makes it worth watching. But I don't want to confuse one powerful green candle with a confirmed trend reversal. There are still a few important levels that buyers need to overcome. What I'm seeing on the Daily chart GLMR is trading around $0.00778, with the latest daily candle showing a gain of nearly 38%. The first thing I noticed is that price has recovered above the EMA7 at $0.006862 and EMA14 at $0.007170. It is also approaching the EMA28 at $0.007711. However, the MA28 at $0.007912 is still an important overhead level. This means the recovery is improving the daily picture, but buyers haven't cleared every major resistance yet. Volume is particularly interesting. Daily volume has reached 46.39M, compared with the MA5 at 21.67M and MA10 at 20.71M. That's a meaningful increase in participation and gives this move more weight than a low-volume bounce. The daily RSI readings are also improving: - RSI6: 62.85 - RSI12: 52.26 - RSI24: 48.82 MACD is still slightly negative, with DIF at -0.000581 and DEA at -0.000554. So the daily momentum has not completely turned bullish yet. The 4H chart is showing something more encouraging This is where the recovery becomes more interesting. Price has moved above all the displayed short-term moving averages: - EMA7: $0.006765 - EMA14: $0.006479 - EMA28: $0.006519 - MA7: $0.006351 - MA14: $0.006203 - MA28: $0.006479 The 4H MACD has also moved into positive territory. DIF is at 0.000011, DEA at -0.000222 and the histogram at 0.000234. That's an improvement in short-term momentum. But there is one thing I wouldn't ignore: RSI6 has reached 76.59, while RSI12 is at 69.65 and RSI24 at 61.44. Short-term momentum is now quite stretched. Buyers may still push higher, but a pullback or consolidation wouldn't surprise me. The price levels I am watching Here are the areas that matter most to me: - $0.008385 — Recent high and immediate breakout resistance. - $0.00791–$0.00792 — Daily MA28 resistance zone. - $0.007823 — Important 4H Fibonacci reference level. - $0.00717–$0.00686 — Daily EMA14 and EMA7 support area. - $0.00675–$0.00620 — Important 4H moving-average support cluster. - $0.006034 — Additional downside reference from the displayed Fibonacci tool. - $0.005411 — Recent low and major structural support. What would make me more confident? I want to see GLMR hold above the $0.00782–$0.00792 region rather than simply touch it and fall back. If buyers manage to establish support above this zone, the next important test will be $0.008385. A convincing break above that high, supported by sustained volume, would make the recovery considerably more interesting. Beyond that, $0.00876 becomes the next visible chart reference. On the other hand, if price gets rejected around $0.00791–$0.008385 and starts losing $0.00717, I'll be watching for a deeper pullback toward the $0.00675–$0.00620 area. A move back below $0.005411 would seriously damage the current recovery structure. How I would approach a trade I wouldn't chase GLMR after a nearly 38% daily move. For a long setup, I'd rather wait for a pullback and see whether the $0.00782–$0.00792 region can hold as support. A confirmed breakout above $0.008385 followed by a successful retest would be another possible setup. For an invalidation level, the $0.00717 area is an important first reference, while a deeper structural failure below $0.00620 would weaken the recovery further. The actual stop should depend on the entry and position size. My view is that GLMR has finally shown buyers are willing to defend the market, and the 4H momentum supports that improvement. But the daily chart still needs confirmation. I want to see buyers prove they can hold the reclaimed levels, not just produce one impressive candle. The bounce is real. Whether it becomes a trend reversal is the next question. $GLMRUSDT #IMPACTbyTrade

BNBUSDT: A $1.19B Token Burn Couldn't Prevent the Sell-Off. Here's What Matters Now. BNB's latest correction is exposing an interesting contradiction: its token supply continues shrinking, but market demand is not strong enough to protect price. BNB is trading around $590–$599, following a sharp decline from the $680 region. On November 14, it dropped 7.68%, and the November 15 session has so far produced a rebound from approximately $566. That recovery deserves attention, but I wouldn't call it a trend reversal yet. The supply story is improving. The demand story is not. On October 19, BNB completed its 37th quarterly burn, permanently removing 1,646,196.44 BNB, worth approximately $1.197 billion at the time. This is more than a headline event. BNB's Auto-Burn mechanism gradually reduces supply toward a target of 100 million tokens. Additionally, BEP-95 burns a portion of gas fees generated through BNB Chain activity. There is a structural supply-reduction mechanism behind the asset. But here's the overlooked part: a token burn reduces available supply; it does not guarantee immediate buying pressure. Derivatives are revealing the weakness. Current aggregated market data shows: - Futures volume: approximately $1.33B. - Spot volume: approximately $193M. - Open interest: approximately $962M, down around 0.86% over 24 hours. - Funding: slightly positive at approximately 0.0008%. - Liquidations: approximately $13.4M, with roughly 97% coming from longs. Futures activity is almost seven times spot volume. More importantly, both spot and futures flows have recorded net selling over the past seven days. This suggests the correction isn't simply a temporary leverage reset. Actual spot demand also needs to improve. What the chart is telling me The $566–$582 region is becoming an important short-term demand area after the latest sell-off. The market has bounced from that zone, but buyers still need to establish control. My key levels: - $566: Recent session low. Losing this level would weaken the recovery attempt. - $582: Important short-term price reference from the previous daily close. - $600–$612: Immediate recovery territory where buyers need to demonstrate strength. - $630: A more meaningful resistance area following the recent breakdown. On the 15M, I want to see higher lows rather than another short-lived bounce. On the 1H, holding above $600 would improve the immediate structure. On the 4H, reclaiming $630 would provide stronger evidence that sellers are losing control. The broader market matters too. Binance Research's November report highlighted rising inflation, stronger expectations of a December Fed rate hike and weaker institutional demand as important pressures on crypto markets. BNB cannot completely escape that environment, regardless of its own token-burning mechanism. My approach is conditional: If buyers defend $582 and reclaim $612 with stronger spot participation, recovery toward $630 becomes more credible. If $566 breaks decisively, I would avoid assuming that the recent bounce represents a bottom. BNB's tokenomics are reducing supply, but the market is demanding something more important right now: evidence that real buyers are willing to absorb the available selling pressure. A burn supports the long-term supply story; demand must prove the short-term price story. $BNBUSDT #IMPACTbyTrade
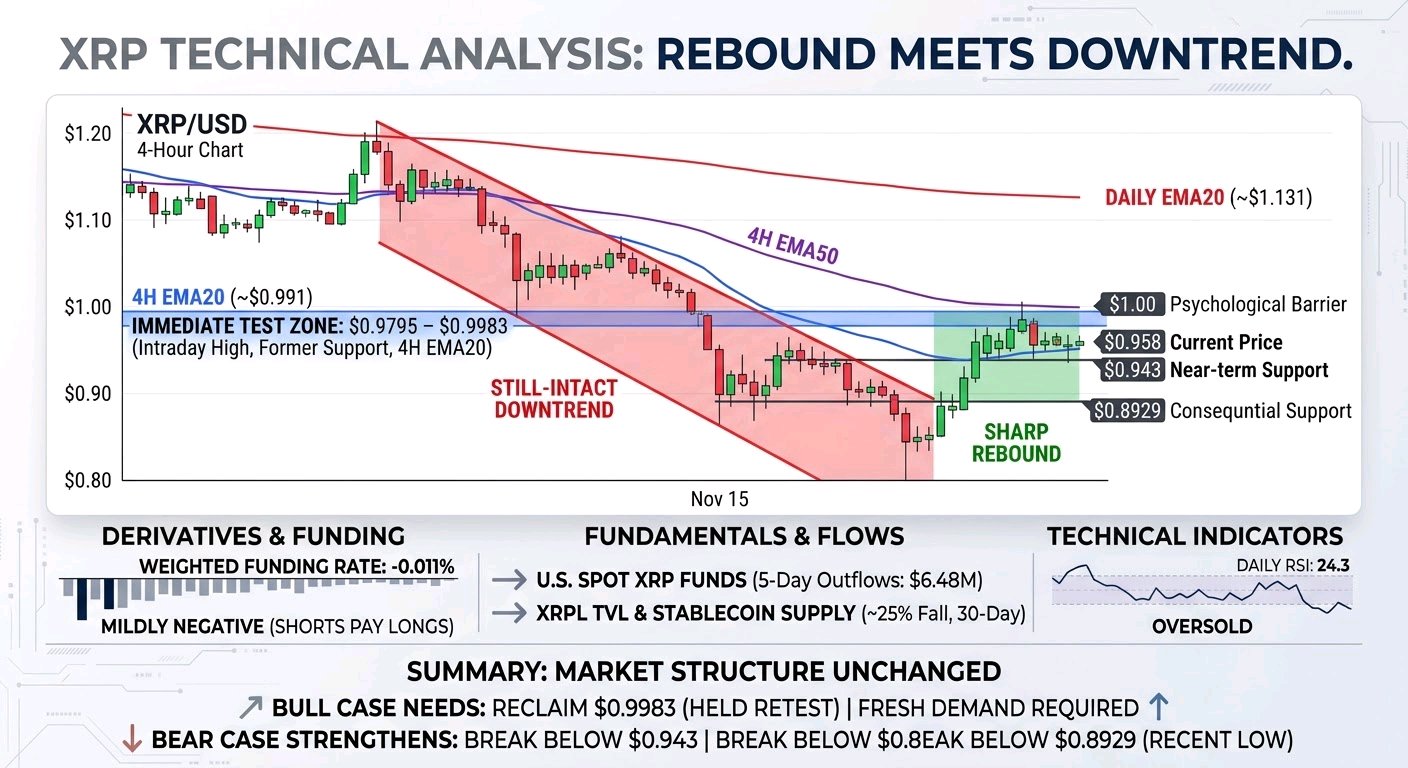
$XRPUSDT is caught between a sharp rebound from a two-year low and a still-intact downtrend. At about $0.958 on November 15, it is up 4.78% from the prior daily close, after trading as low as $0.8993. That bounce matters, but it has not yet changed the market structure: XRP remains below $1, below its 4-hour EMA20 near $0.991, and well below its daily EMA20 near $1.131. The market is asking whether buyers have found real demand—or whether they are simply responding to an oversold flush. The immediate test is $0.9795–$0.9983. That zone combines the recent intraday high, the former $1 support area, and the 4-hour EMA20. A brief move above it would not be enough by itself. I would want to see XRP hold above the zone on a retest, with meaningful spot buying and open interest rebuilding. Otherwise, a rally could be short covering or position adjustment rather than fresh demand. A break below $0.943 would weaken the near-term bounce; $0.8929, the recent low, is the more consequential support. If that level gives way, the market has not yet shown a strong nearby base. The broader technical picture is unambiguous, though not a timing signal. XRP is down 17.2% over 7 days and 28.0% over 30 days. The daily RSI is 24.3, an oversold reading, but oversold markets can remain weak. On the 1-hour chart, price is near the EMA20 and below the EMA50 around $0.976; on the 4-hour chart it remains below both the EMA20 and EMA50. These facts favor caution on the bounce, but a successful reclaim of $0.9983 would make the bearish interpretation less secure. The derivatives picture is mixed. Funding is mildly negative across the tracked venues, with the weighted rate at -0.011% per 8 hours; shorts pay longs, which can make short positions costly and leave room for a squeeze. Yet this is not evidence that a squeeze is underway. OKX open interest is down 9.4% over 7 days, but that is one venue, and dollar-denominated open interest can fall simply because the token price falls. Long/short data also conflicts: accounts are net long, while top traders’ positions lean short. Reported recent liquidations hit longs hardest, but the available figures do not establish precise liquidation clusters or prove broad market-wide deleveraging. We still need to ask: if price rises, does open interest grow with it, or do shorts merely close into thin demand? There are real fundamental headwinds, but their timing is less clear. U.S. spot XRP funds saw $6.48M in net outflows over 5 days and $1.18M over 20 days, though the latest reported session was positive. XRPL stablecoin supply and value locked each fell about 25% over 30 days. Those are signs of weaker marginal demand and network capital, not proof that they caused this week’s selloff. A reported 240M XRP transfer did not reach an exchange, and exchange-balance readings are disputed because newly tracked wallets changed the totals. Neither establishes a wave of sell-side deposits. No verified new announcement or token unlock in the retrieved recent news clearly explains the move; 36.5% of maximum supply remains outside circulation, a longer-term supply consideration, not evidence of an immediate release. My read is that broad crypto weakness, extreme fear, ETF outflows, and long liquidations explain the pressure better than any single XRP-specific event. But we lack spot CVD, order-book imbalance, and reliable whale-flow evidence, so claims of accumulation or distribution would be premature. The bull case needs a held reclaim of $0.9983, supported by spot demand; the bear case strengthens if $0.943 fails and especially if $0.8929 breaks. Which side is actually taking initiative—spot buyers or leveraged traders—and will the next move in open interest confirm it?#IMPACTbyTrade

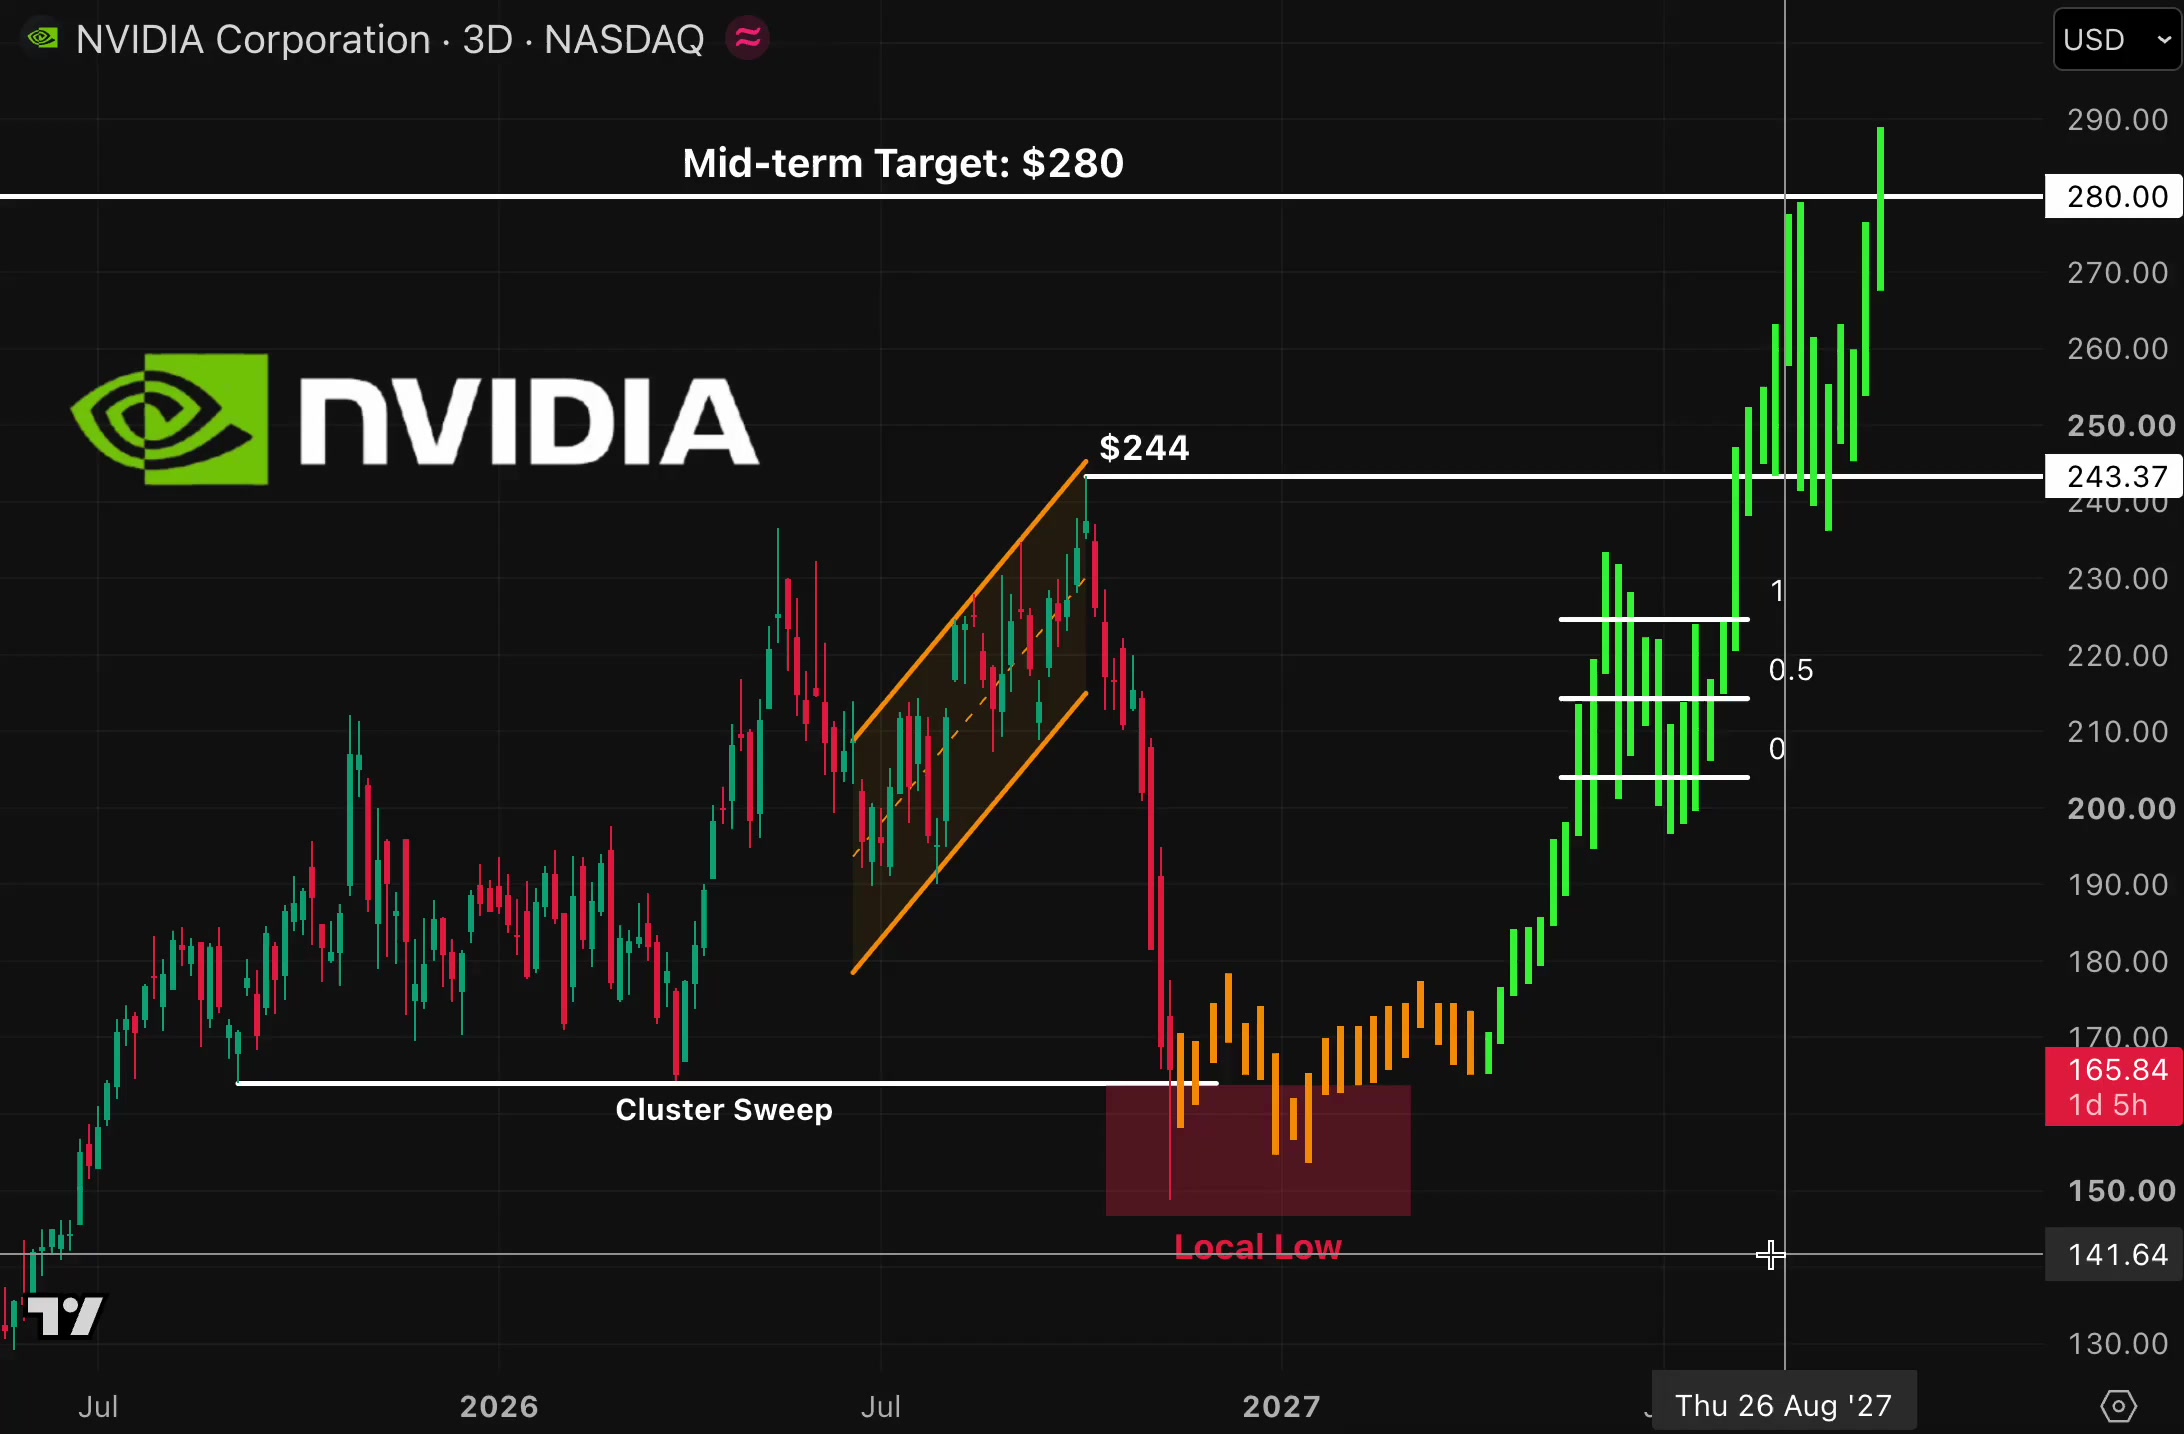
NVDA 已經從大幅滑落轉為平穩築底,這類盤整型態我傾向於在小回調時買入,而不是追高。 附上的圖表僅為大局背景參考。下方的交易策略僅基於今日 Bybit 1 小時與 15 分鐘線圖。 $NVDAXUSDT 目前報 161.55 (+1.12%),處於 24 小時區間 156.15 至 161.74 之間。 這意味著價格已處於區間高位 97% 的位置,較低點上漲 3.5%,較高點僅低 0.1%。成交額為 54.23M。 我關注的點位: 向上:161.74(24小時高點) -> 163.99(圖表網格線,一個壓力區) -> 171.84(1小時圖高點) 向下:160.89(1小時 MA7) -> 160.80(1小時 MA14) -> 160.70(15分鐘 MA14) -> 160.35(1小時 MA28) 在 1 小時線上,價格高於 MA7 (160.89)、MA14 (160.80) 和 MA28 (160.35),分別高出 0.4%、0.5% 和 0.7%。 這三條均線在從 171.84 滑落後已走平並糾結,所以我將 160.35 到 160.90 視為一個支撐區,而價格才剛開始從這裡脫離。 在 15 分鐘線上,價格高於 MA7 (160.85)、MA14 (160.70) 和 MA28 (160.84),分別高出 0.4%、0.5% 和 0.4%。 這三條線排列緊密且正在向上轉折,最近的幾根 K 線顯示連續收紅,正衝向 24 小時高點。 我不想在漲勢頂端買入,我想等它回調到均線簇。 我正在觀察成交量。15 分鐘線目前量能 2.79K,對比 MA5 的 2.66K 和 MA10 的 2.38K,距離收盤還剩 06:42,所以推升力道高於兩條均線,但仍在形成中。 1 小時線目前量能 12.87K,對比 8.80K 和 8.64K,距離收盤還剩 06:37,同樣高於兩條均線。 隨著價格上漲,市場參與度正在回升,這是我在築底時想看到的跡象,但相較於本週稍早的拋售潮,目前的量能依然較小。 交易策略,回調買入均線簇: - 入場:160.60 至 161.00(限價單,需要 0.3% 至 0.6% 的回調) - 止損:159.90 以下 - 目標 1:162.30(從 160.80 計算約 1.7R) - 目標 2:163.60(約 3.1R) 若 15 分鐘線收在 159.90 以下則策略失效,因為這會同時跌破 1 小時 MA28 和整個均線簇。 我的想法是保持小倉位,因為這是流動性較差的 TradFi 永續合約,且價格已處於 24 小時高點。 限價單、小倉位,沒回調就不交易。 #IMPACTbyTrade
SOLANA ($SOLUSDT): Can Bulls Turn the Momentum Around? Solana is facing a challenging market environment, and traders are watching closely for signs of strength. Here are three things I am monitoring: Whether buyers defend the recent support area. Whether trading volume starts recovering. Whether SOL can build a stronger market structure. A recovery needs confirmation, not just hope. SOL community: Are you waiting for a bullish reversal or expecting more downside? #IMPACTbyTrade

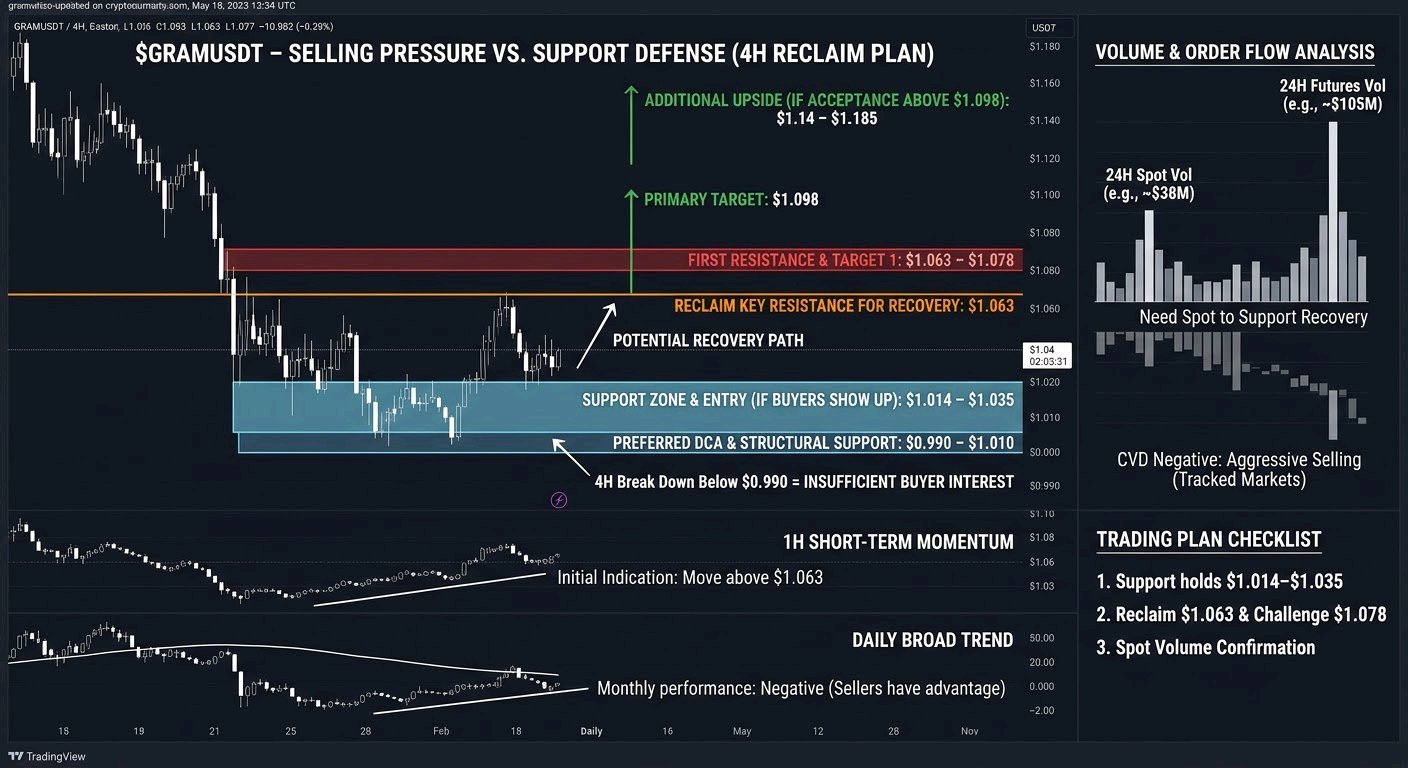
$GRAMUSDT – SELLING PRESSURE IS STILL PRESENT, BUT I'M WATCHING THE $1.06 RECLAIM FOR A POSSIBLE RECOVERY $GRAM is approaching an important decision zone, and I'm paying close attention to how price reacts around the $1.01–$1.04 support area. The market is showing mixed signals. While the 4H structure has some recovery potential, the 1H and daily trends remain under pressure. I don't want to assume a bullish reversal before buyers prove they can take control. Market Overview GRAM is trading around $1.04–$1.05, with recent price action showing continued weakness after a significant decline. On the broader timeframe, the monthly performance remains negative, suggesting that sellers still have the advantage in the bigger picture. I'm monitoring the 1H and 4H charts closely. A sustained move above $1.063 would be the first indication that short-term momentum is improving. The next important resistance sits around $1.078, followed by the $1.098–$1.14 region. Volume Analysis GRAM has maintained meaningful trading activity, with recent market data showing approximately $105M in futures volume and $38M in spot volume over 24 hours in one reported snapshot. However, trading activity alone doesn't confirm accumulation. Recent order-flow data also showed negative cumulative volume delta, indicating that aggressive selling has been outweighing buying across tracked markets. For me, the important signal will be whether spot buyers start supporting the recovery rather than relying entirely on futures activity. My Trading Plan I'm interested in a potential recovery setup, but I want confirmation before committing to a position. Initial Entry Zone: $1.014–$1.035 Preferred DCA Level: $0.990–$1.010, only if support holds and buyers show a clear reaction. First Resistance: $1.063–$1.078 Primary Target: $1.098 Additional Upside Potential: $1.14–$1.185 if momentum strengthens and price establishes acceptance above the previous resistance zones. My preferred confirmation is a strong 4H recovery followed by a successful retest. I don't want to chase a sudden green candle without evidence that buyers are taking control. What Could Go Wrong? The biggest risk is another breakdown below the $1.014 support area. If sellers push price below this level, the $0.990 region becomes an important structural support to watch. A sustained 4H breakdown below $0.990 would significantly weaken my recovery expectations and could open the door to another downward move. I also want to see improving spot demand. If futures activity increases while spot buying remains weak, any recovery could struggle to maintain momentum. Risk management remains essential. I would rather miss an entry than hold a position through a confirmed structural breakdown. My Perspective GRAM is interesting because price is approaching a major support region while trading activity remains relatively strong. However, I don't see enough confirmation to call this a confirmed bullish reversal yet. My focus is on three things: 1. Whether $1.014–$1.035 attracts genuine buying interest. 2. Whether GRAM can reclaim $1.063 and challenge $1.078. 3. Whether spot volume starts supporting upward price movement. My expectation is a possible short-term recovery if buyers defend the current support region. A move toward $1.098 and potentially $1.14 becomes more interesting after resistance is reclaimed. For now, I'm staying patient. The support reaction and the $1.063 breakout will tell me much more than simply guessing the next direction. $GRAMUSDT #IMPACTbyTrade

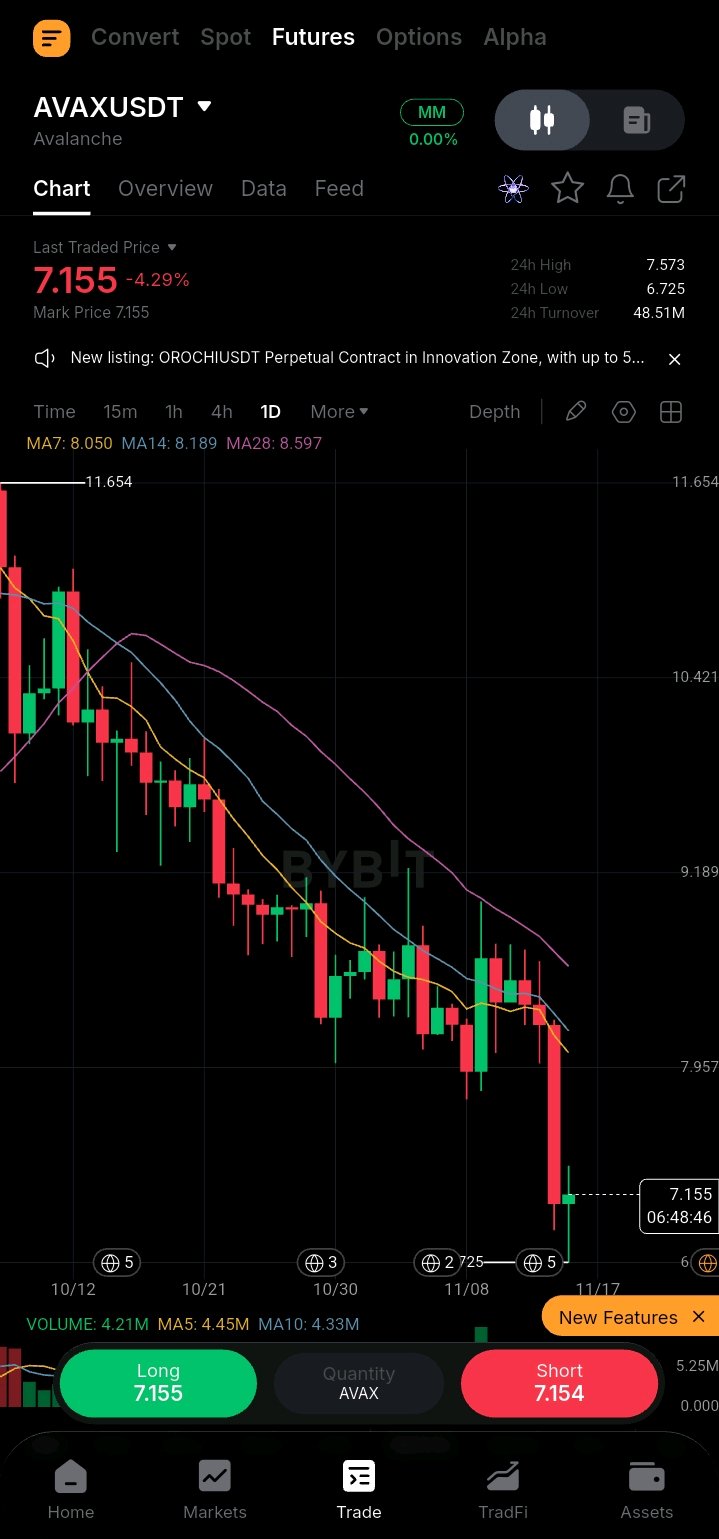
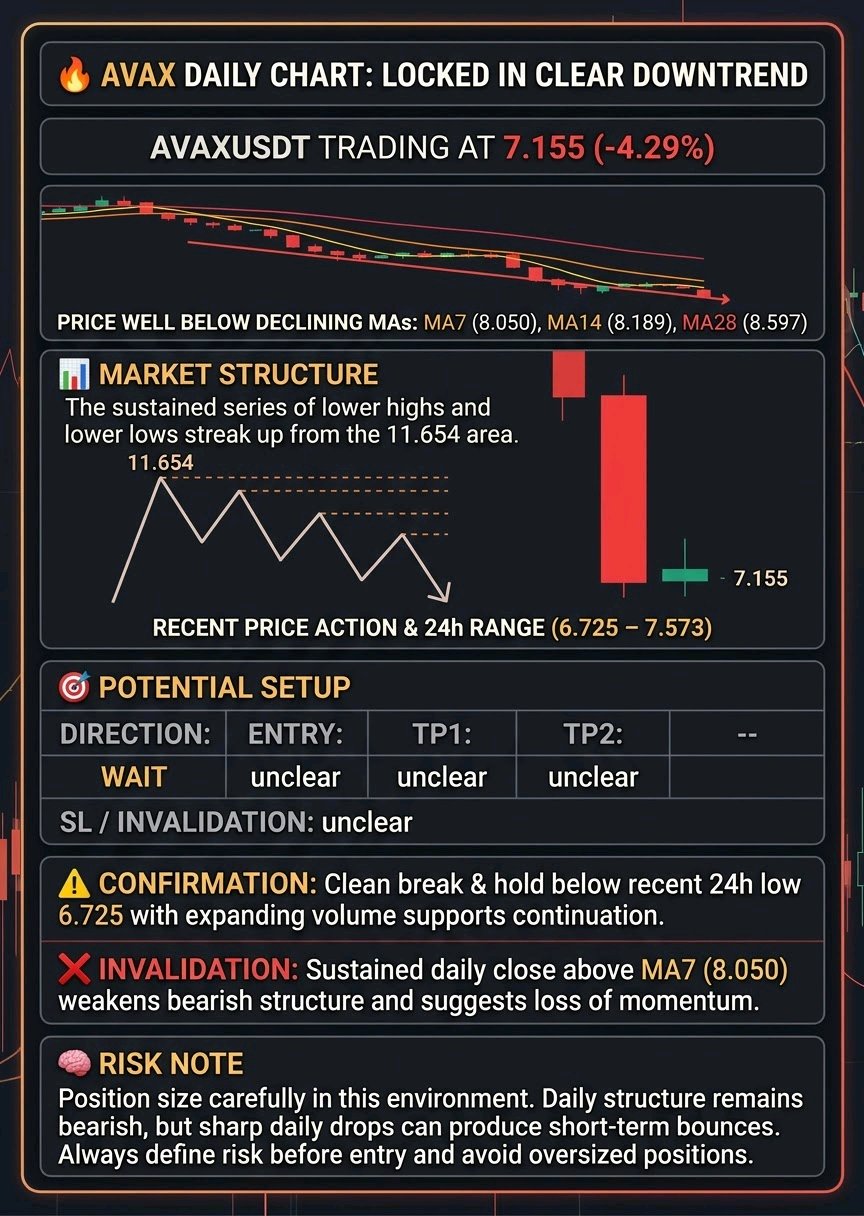
AVAX 日線圖依然處於明顯的下降趨勢中
$AVAXUSDT 目前交易價格為 7.155,在經歷 -4.29% 的大幅下跌後,目前位於日線級別 MA7、MA14 和 MA28 下方,且均線呈現下行趨勢。 📊 市場結構: 圖表顯示從 11.654 區域到目前水平,出現了一連串的高點降低和低點降低。價格保持在下行移動平均線(MA7 為 8.050,MA14 為 8.189,MA28 為 8.597)下方,確認了看跌結構。近期出現了一根大陰線,隨後在 7.155 附近出現了一根小陽線。24 小時波動區間在 6.725 到 7.573 之間。 🎯 潛在佈局: 方向:等待 (WAIT) 進場:不明確 止盈 1:不明確 止盈 2:不明確 止損 / 無效點:不明確 ⚠️ 確認訊號: 若價格能帶量跌破並站穩近期 24 小時低點 6.725,將支持下行趨勢的延續。若能重新站上並企穩於下行的 MA7 之上,將是潛在趨穩的第一個訊號。 ❌ 無效點: 若日線收盤價能持續站回 MA7(目前為 8.050)之上,將削弱當前的看跌結構,並暗示下跌趨勢正在減弱。 🧠 風險提示: 在此市場環境下請謹慎控制倉位。雖然日線結構仍偏空,但劇烈的日線下跌可能會帶來短期反彈。進場前務必定義風險,並避免倉位過大。 #IMPACTbyTrade
BR 在 Bybit 上的交易價格接近 0.4277 美元,與其交易所快照相比下跌了約 1%,而更廣泛的數據顯示其單日跌幅更為劇烈。在從 0.47 美元回調後,關鍵測試在於買方能否守住 0.416–0.420 美元的支撐位。 市場快照 CoinGlass 顯示總體報價接近 0.4415 美元,而其 Bybit 交易所數據表顯示為 0.4277 美元;我將採用 Bybit 的特定報價作為此次交易解讀的參考。CoinGlass 報告 24 小時價格區間為 0.4164–0.4732 美元,市值約 1.3225 億美元,完全稀釋估值 (FDV) 約為 4.415 億美元,現貨交易量約為 106 萬美元。期貨交易量約為 1566 萬美元,幾乎是現貨成交量的 15 倍。 CoinGlass 列出的流通量為 3.0167 億枚,最大供應量為 10 億枚,儘管其他追蹤器報告的浮動籌碼較低。請謹慎對待確切的流通供應數據;大部分最大供應量尚未進入流通。 衍生品與倉位 總持倉量 (OI) 為 2149 萬美元,下降了 4.47%。資金費率為正,接近 0.025%,意味著多頭正在支付空頭。清算金額為 48,900 美元,約 96% 來自多頭。價格疲軟伴隨正向資金費率和多頭清算,表明槓桿買家已陷入市場頹勢。 Bybit 的數據表顯示 BRUSDT 期貨交易量接近 129 萬美元,OI 約為 189 萬美元,下降了約 5.9%。資金費率維持正值,因此擁擠的多頭可能仍需平倉。若能伴隨更強勁的現貨交易量出現回升,將比單純由期貨帶動的反彈更為健康。 技術結構 支撐位位於 0.420–0.4164 美元。若能守住並收復 0.435 美元,則表明買方正在吸收賣壓。在此之上,請關注 0.450 美元,隨後是 0.470–0.473 美元的阻力位。 如果 0.4164 美元在成交量放大的情況下失守,請關注 0.400 美元和 0.380 美元。若在跌破支撐位後能迅速拉回,將會削弱看跌觀點;若連續收盤低於該水平,則會加強看跌趨勢。 基本面與產品活動 Bedrock 透過 uniBTC、brBTC 以及包括 uniETH 和 uniIOTX 在內的流動性質押資產,構建以比特幣為中心的 DeFi 基礎設施。其核心理念是讓比特幣資本在 DeFi 和多個網路中發揮生產力。 DefiLlama 的 uniBTC 儀表板報告 TVL 約為 2.478 億美元,但該數據在 30 天內下跌了約 29%,從 11 月 14 日的約 2.58 億美元下降至 10 月 16 日的約 3.55 億美元。這種萎縮表明資本正在撤離該產品。 該儀表板顯示 30 天內的 uniBTC 費用和收入僅為 1,047 美元,持有者收入為零。TVL 是存入的資本,並非持續的收入或直接流向 BR 持有者的價值。市場需要更強勁的費用收益和留存流動性。 代幣效用與治理 BR 是 Bedrock 的治理和獎勵代幣。鎖定它會產生 veBR,從而提供對協議決策和激勵權重的投票權。這種效用並不意味著持有者會自動獲得協議收入。 長期需求取決於除了代幣排放之外鎖定 BR 的理由。請關注治理參與度、產品使用率、流動性和費用成長。 代幣經濟學與解鎖風險 BR 的最大供應量為 10 億枚。Tokenomics.com 列出:20% 為戰略儲備,20% 為團隊,18.5% 為行銷,14.5% 為未來激勵,12.5% 為種子輪投資者,5.5% 為空投,5% 為 IDO,4% 為流動性。 其歸屬頁面列出 2026 年 12 月 20 日將解鎖約 7080 萬枚 BR,佔總供應量的 7.1%,分配給內部人士和私人投資者。各追蹤器對供應量和歸屬計劃的數據不一致,請務必核實官方時間表。即便如此,在現貨流動性薄弱的情況下,相對於市值如此大規模的解鎖是一個重大的實質風險。 交易情境 看漲情況:守住 0.4164 美元,收復 0.435 美元,然後在現貨交易量增加的情況下突破 0.450 美元。若能持續突破 0.473 美元上方,可能會打開上看 0.50 美元的空間。 看跌情況:失守 0.4164 美元且無法收復。這將使賣方保持控制權,並使 0.400 美元以及隨後的 0.380 美元成為目標。正向的資金費率和疲軟的現貨成交量使得槓桿驅動的反彈極易遭受再次洗盤。 以下是我正在追蹤的價格水平圖: - 即時支撐位:0.420–0.4164 美元 - 阻力位:0.435 美元,其次是 0.450–0.473 美元 - 看漲確認:在更強勁的現貨參與下持續突破 0.473 美元上方 - 看跌訊號:跌破 0.4164 美元且未能收復 我的觀點是謹慎的。Bedrock 擁有 BTCFi 產品套件和治理效用,但 TVL 下降、報告費用低、資金費率為正以及即將到來的解鎖風險都值得重視。我希望在追逐期貨帶動的反彈之前,先看到現貨需求的回升。您是在關注 0.416 美元的支撐位作為潛在切入點,還是在等待 0.473 美元的確認收復?BRUSDT #IMPACTbyTrade

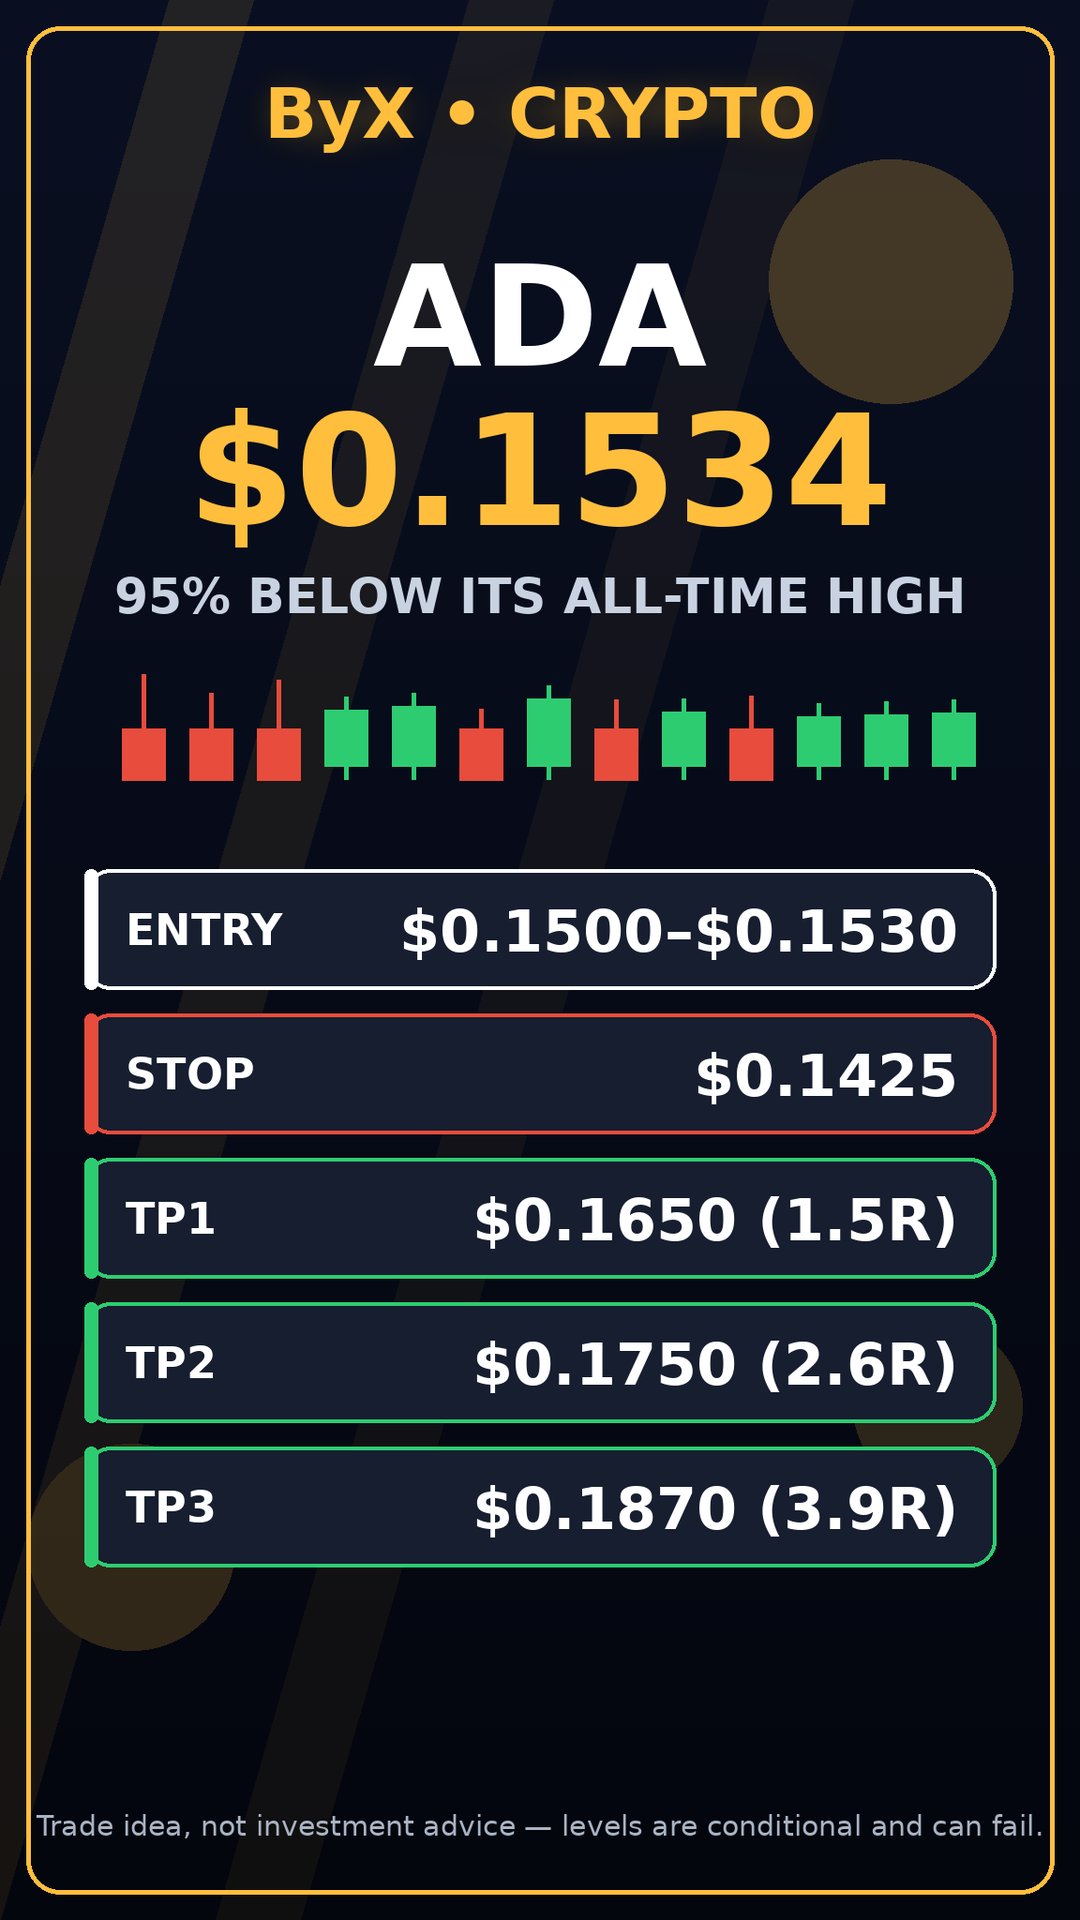
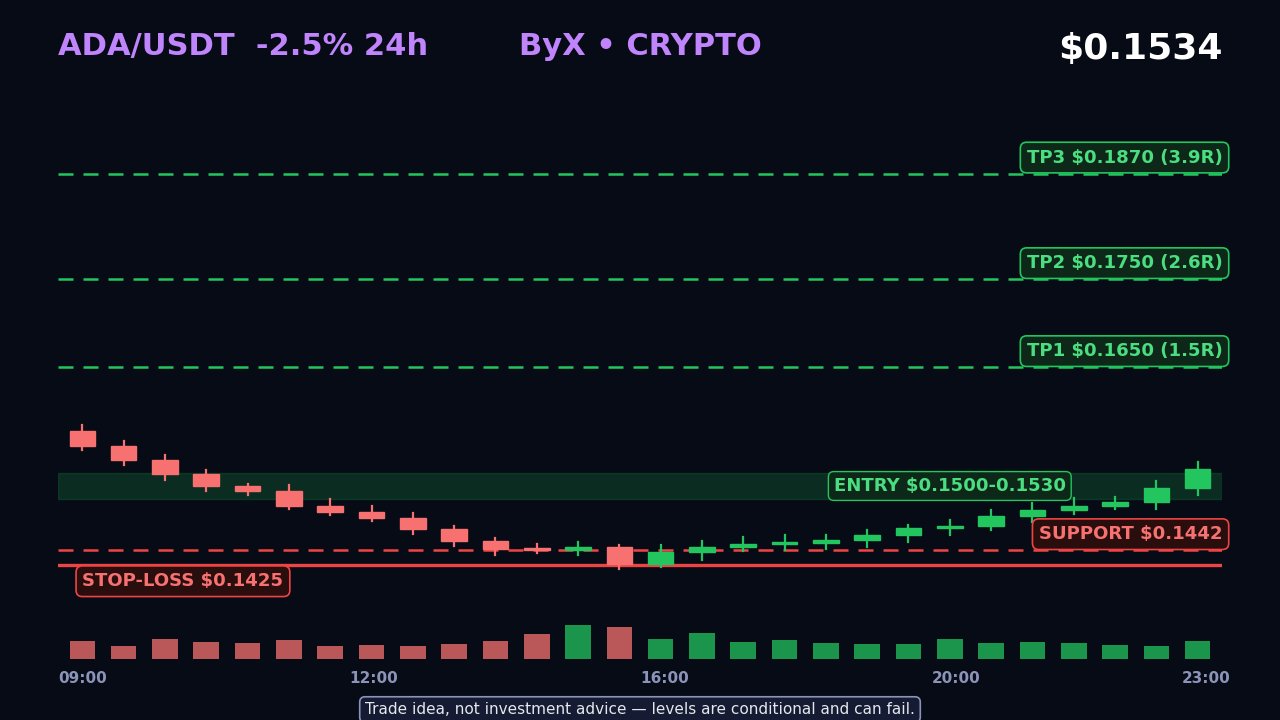
Cardano 創辦人剛宣稱路線圖已「完成」——就在 ADA 暴跌至 0.1429 美元、較歷史高點下跌 95% 的同一週。 Cardano 是一個經同行評審的權益證明 (Proof-of-Stake) Layer-1 區塊鏈。11 月 13 日,創辦人 Charles Hoskinson 在一場名為「完成 Cardano」的直播中表示,最初的路線圖已經完成。市場在一天之內給出了回應:ADA 在 11 月 14 日下跌 12.3%,收於 0.1478 美元,這是自 6 月 30 日以來的最低收盤價,盤中一度觸及 0.1429 美元。一年前它的價格是 0.5033 美元——是現價的 3 倍多。 觸發因素不僅於此。一項關於 Copper 戰略儲備 2200 萬枚 ADA 的國庫提案將於今日截止——這是一場關於 Cardano 是否囤積自身代幣的現場投票。在此背後,還有具備 Leios 擴容功能的 Dijkstra 硬分叉(測試網已於 10 月上線),以及預計於 2027 年第二季推出的 Peras。 宏觀環境險峻:聯準會在 12 月 8-9 日升息的機率高達 88.5%,比特幣在現貨 ETF 七個交易日內流出 19.1 億美元後,交易價格徘徊在 65,000 美元附近,恐懼與貪婪指數停留在 12。ADA 的跌幅是比特幣的兩倍多。 軋空條件已在數據中顯現:ADA 七日內下跌 16.6%,一年內下跌 67.9%,市值為 55 億美元。11 月 14 日日線 RSI 觸及 25.7——處於深度超賣狀態。未平倉合約減少至 2.84 億美元,24 小時內下降 13%,資金費率為每 8 小時 -0.0139%,年化約為 -15.2%:空頭支付給多頭以維持空單。期貨交易量激增 79% 至 7.26 億美元;24 小時內有 630 萬美元被清算,其中 95% 為多單。弱手已被清洗;空頭部位正處於年度低點。 從技術面來看,ADA 低於其 50 日均線 30%,低於 200 日均線 27%——就像被拉伸的橡皮筋。0.1426–0.1442 美元區間是關鍵防線:這是今天的低點和 6 月 30 日的收盤價。守住這裡,反彈就有空間;跌破這裡,下一個目標就是 0.13 美元區間。 交易策略:做多 ADA,區間 0.1500–0.1530 美元,停損 0.1425 美元(今日低點下方)。TP1 0.1650 美元 (1.5R),TP2 0.1750 美元 (2.6R),TP3 0.1870 美元 (3.9R)。預計 24–48 小時持倉;觀察日線 RSI、50/200 日均線、資金費率、未平倉合約。 看漲觀點:RSI 25.7 配合深度負資金費率是經典的軋空設置——空頭在年度低點支付費用以持有倉位,若價格穩定在 0.1500 美元上方,將迫使空頭在流動性稀薄的市場中回補。如果 Copper 投票在今天通過,「完成」這個詞將從投降轉變為圓滿。 看跌觀點:創辦人在代幣價格較高點下跌 95% 時宣佈勝利,這被解讀為投降。衣索比亞項目從未落實,聯準會即將升息,而 ADA 表現出零相對強度。日線收盤價若低於 0.1425 美元,一切邏輯失效,並將開啟新一輪下跌。 A:ADA 本週軋空回升至 0.1650 美元以上——「完成」標誌著底部。B:跌破 0.1425 美元,ADA 緩步跌向 0.13 美元——路線圖完成了,買盤也結束了。你站在哪一邊? $ADAUSDT #ByXIMPACT #IMPACTbyTrade 僅供交易參考,非投資建議——水平點位均為條件性的,且可能失效。

$GRAMUSDT 剛剛出現了一個罕見的情況:所有平均線都對價格達成了一致。 在從 1.113 滑落至 1.016(跌幅約 8.7%)後,GRAM 目前報價 1.049,其 7、14 和 28 週期的移動平均線(MA)重疊在 1.051、1.049 和 1.049。在 1 小時圖上,這顯示市場已經停止了自我分歧。 在這一波走勢的大部分時間裡,28 日均線一直是向下的壓制,每一次反彈都在其下方夭折。現在它已經走平,而價格正處於它之上,而不是下方。這還不是反轉,這是單邊壓力的終結。 讓我困擾的是成交量。最近一根 K 線的成交量為 156K,而 5 根 K 線的平均成交量為 384K。之前的拋售是在巨大的成交量下發生的,而從 1.016 的回升成交量卻較輕且在萎縮。買方確實進場了,但他們還沒有為這波漲勢付出代價。 訂單簿顯示 91% 是買單,但我不會太依賴這個數據。買單可以在幾秒鐘內撤銷,在成交量萎縮的情況下出現一面倒的訂單簿,通常意味著人們只是在掛單,而不是在主動吃單。 我正在關注的點位: - 高於 1.073:24 小時高點,也是下跌以來的第一個更高的高點。這才是真正的信號。 - 低於 1.016:低點被跌破,之前的回升僅僅是暫停。 - 1.016–1.073:一個約 5.6% 寬度的區間,目前價格正處於中間位置。 大多數人會跳過的部分: 假設 GRAM 突破 1.073 而你追漲,將止損設在 1.016 下方,風險約為 5.3%。第一個合理的目標價 1.113 距離僅約 3.7%。這大約是 0.7R(風險回報比),即使你判斷對了方向,這也是一筆糟糕的交易。 更好的做法是等待價格重新站穩 1.073,經過測試確認支撐有效,並使用更緊湊的止損。在此之前,這還稱不上是一個交易設置。這是一個壓縮盤整,而這種成交量萎縮的盤整最終會透過一根大 K 線來決定方向,而不是靠猜測。 我不做多空預測。我需要看到收盤價高於 1.073 且成交量遠高於 384K 的平均水平,或者價格跌破 1.016 且無法反彈。 #IMPACTbyTrade

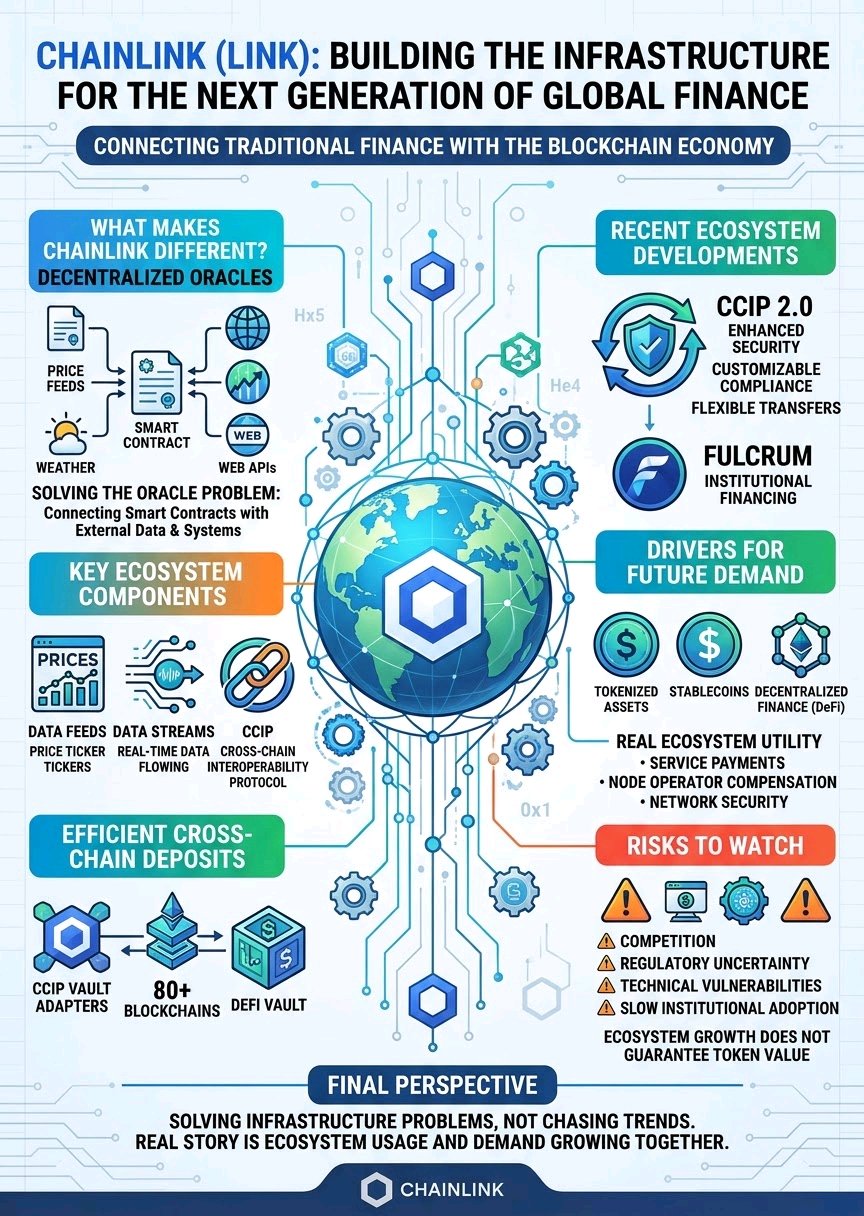
Chainlink (LINK): Building the Infrastructure for the Next Generation of Global Finance 🌐 Chainlink is becoming much more than an oracle network. It is building essential infrastructure that could help connect traditional finance with the expanding blockchain economy. What Makes Chainlink Different? Blockchains cannot independently access real-world data or communicate seamlessly with other networks. Chainlink addresses this challenge through decentralized oracles, connecting smart contracts with external information, financial systems, and blockchain networks. Its ecosystem includes Data Feeds, Data Streams, and the Cross-Chain Interoperability Protocol (CCIP). Ecosystem Development Recent progress makes the bigger picture interesting. CCIP 2.0 introduced enhanced security, customizable compliance, and more flexible cross-chain transfers. Chainlink also introduced Fulcrum for institutional financing and collateral management. Additionally, its CCIP Vault Adapters enable DeFi vaults to accept deposits from more than 80 blockchains. Why Future Demand Matters As tokenized assets, stablecoins, and decentralized finance expand, reliable data and secure interoperability become increasingly important. LINK also has real ecosystem utility through service payments, node operator compensation, and network security. Risks Worth Watching Competition, regulatory uncertainty, technical vulnerabilities, and slower institutional adoption remain important challenges. Ecosystem growth does not automatically guarantee higher token value. My Final Perspective I believe Chainlink deserves attention because it is solving infrastructure problems rather than chasing temporary crypto trends. If blockchain adoption continues expanding, Chainlink could become an increasingly important part of that transformation. The real story is whether ecosystem usage and demand for LINK continue growing together. $LINKUSDT $BTCUSDT #IMPACTbyTrade