ByXIMPACT
在這裡,ByX 的創作者每週爭奪 8,000 USDT。發佈你的市場觀點、交易布局與圖表解析,或開啟直播,將每一次觀看都轉化為排行榜積分。提升排名,就能領取獎勵。🔥 v0804

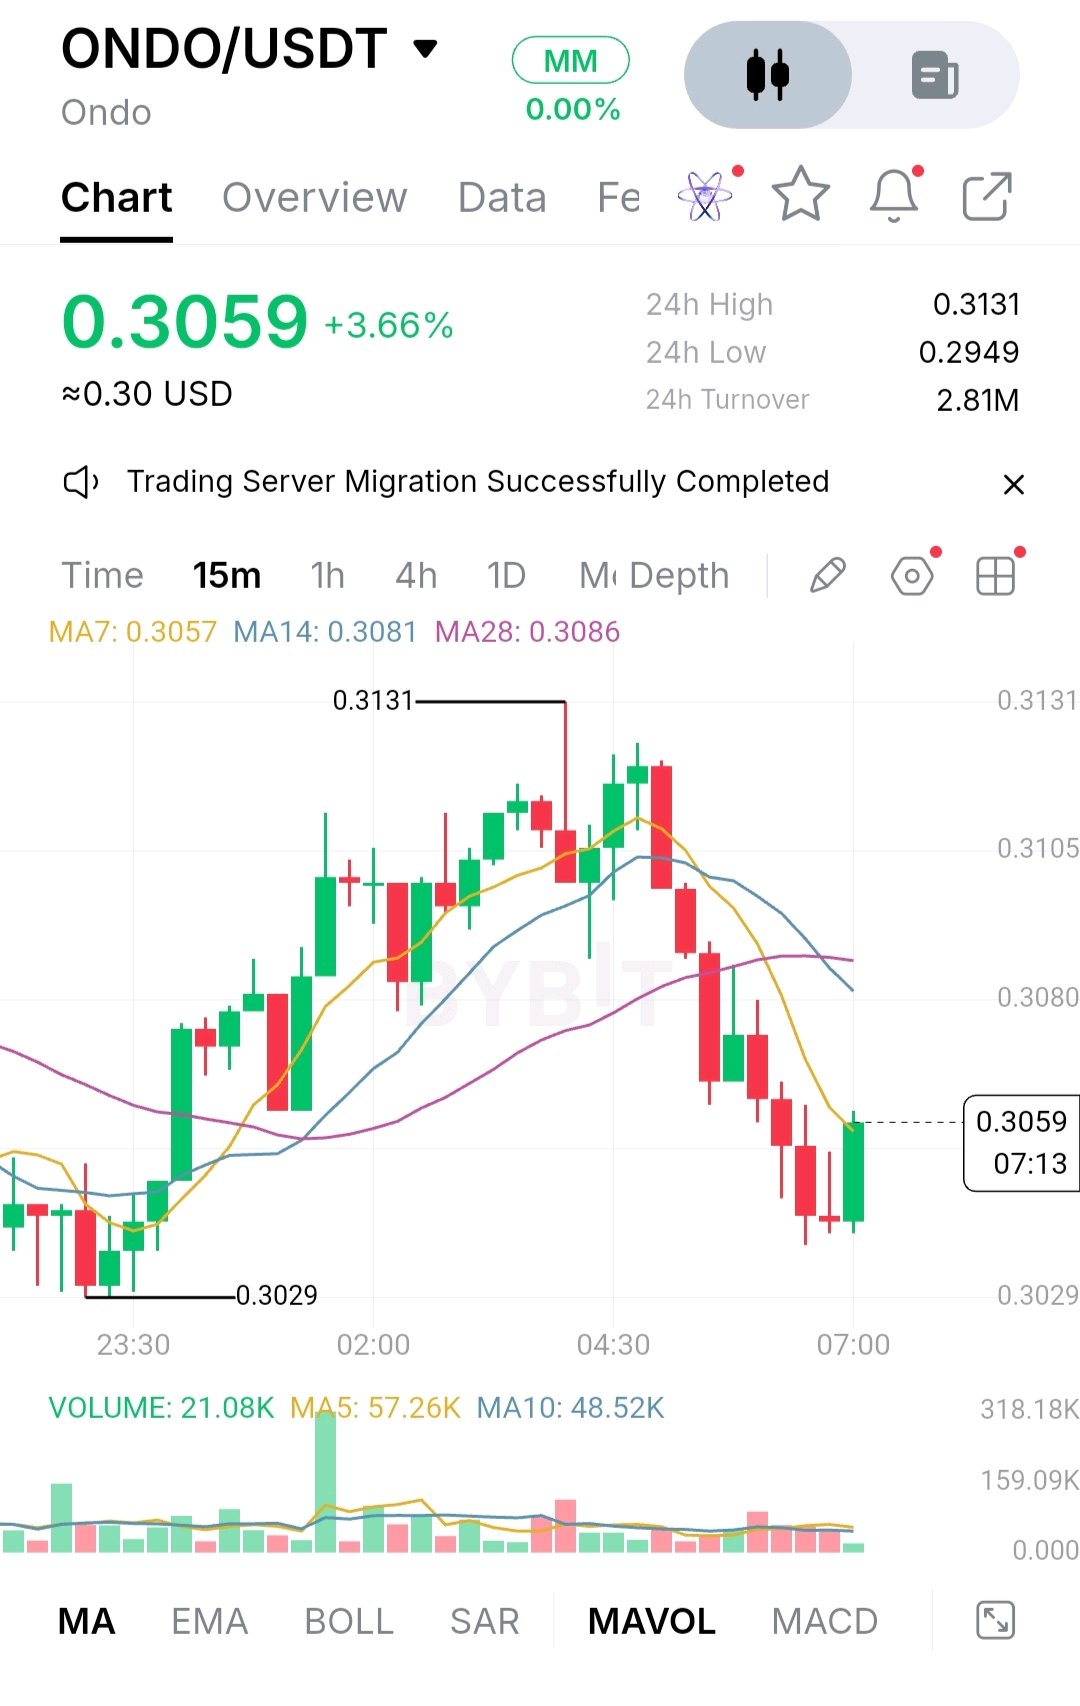
ONDO/USDT: Buyers Are Trying to Recover, But the Pressure Has Not Disappeared There is something worth paying attention to in ONDO's recent price action. Buyers managed to push the price higher, but when it approached $0.3131, the momentum quickly faded. Now the token is trading around $0.3059, attempting to recover some of those losses. The question is whether buyers genuinely see value at these levels or are simply taking advantage of a temporary pause in selling. A Bounce That Still Needs Convincing ONDO is showing a 3.66% daily gain, which initially looks positive. However, looking at the 15-minute chart tells a more complicated story. After reaching $0.3131, the price experienced a noticeable pullback. Sellers gradually took control, pushing ONDO below its 14-period and 28-period moving averages. The latest recovery has brought it close to the seven-period average at $0.3057, but the other two averages, sitting at $0.3081 and $0.3086, are still above the current price. That matters because a recovery becomes more convincing when buyers can reclaim these levels and hold them. So far, ONDO has only managed to slow the decline. Trading activity raises another question. The displayed volume is 21.08K, below both the five-period average of 57.26K and the ten-period average of 48.52K. This suggests that the latest bounce is happening without particularly strong participation. Are Buyers Stepping In or Are Sellers Simply Taking a Break? This is probably the most important question facing ONDO right now. The reaction around $0.3029 suggests that buyers are still willing to defend lower prices. However, the rejection near $0.3131 shows that sellers have not disappeared either. There is not enough evidence to call this accumulation just yet. A few green candles can improve sentiment, but sustained buying, particularly when price approaches resistance, is what would make the recovery more believable. The Bigger Picture Behind Ondo Ondo has a business model that gives it a meaningful place in the growing real-world asset sector. Its ecosystem focuses on bringing traditional financial products, including US Treasuries and other financial instruments, onto blockchain networks. Institutional interest and ecosystem expansion could support its long-term relevance. Still, investors should distinguish between the success of Ondo's platform and the actual value captured by the ONDO token. Its governance role does not mean that every new integration automatically creates additional token demand. Future token unlocks are another factor worth watching because additional circulating supply can influence market sentiment and selling pressure. Where the Market Needs to Make a Decision For now, $0.3050–$0.3029 is the immediate support area. Below that, $0.2949 becomes an important level to watch. On the upside, ONDO needs to reclaim $0.3080–$0.3086 before buyers can seriously challenge $0.3105 and the previous high of $0.3131. A convincing move above $0.3131, supported by stronger volume, would improve the recovery outlook. On the other hand, losing $0.3029 would suggest that sellers are still controlling the short-term direction. What Matters Most Now? There is no real reason to rush into a trade while the market is still searching for direction. Buying immediately means facing nearby resistance, while selling directly into support also carries its own risks. ONDO has shown that buyers are still present, but showing up once is not the same as taking control. $ONDOUSDT #ByXIMPACT

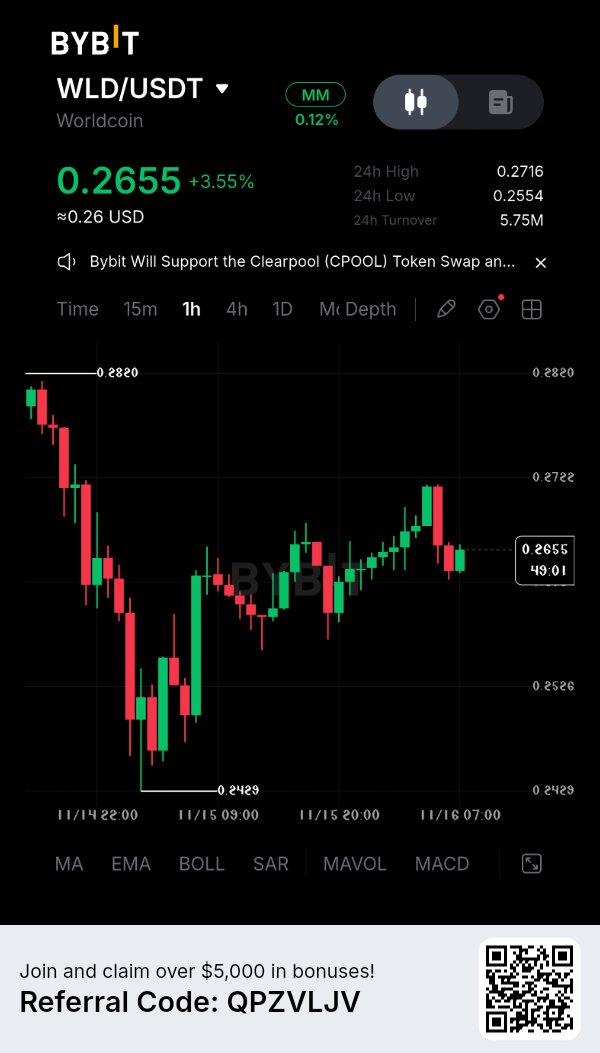
$WLDUSDT Bulls Are Trying to Take Control. Is Another Move Coming? Worldcoin is showing signs of recovery on the 1H chart after a strong bounce from the $0.2429 support area. WLD is currently trading around $0.2655, up approximately 3.55%. Buyers have managed to recover from the recent low, but the price is now facing resistance after rejection near $0.2716. Key Levels to Watch Support Zones: - $0.2625 – $0.2635 - $0.2550 – $0.2560 - $0.2525 – Major support area Resistance Zones: - $0.2680 – $0.2690 - $0.2715 – Immediate resistance - $0.2820 – Major upside target Potential Trading Setup Entry 1: $0.2625 – $0.2640 on a confirmed bullish bounce. Entry 2: Above $0.2690 after a strong 1H candle close and successful retest. Take Profit: - TP1: $0.2715 - TP2: $0.2760 - TP3: $0.2820 Stop Loss: Below $0.2590 for the pullback setup. Bearish Scenario If WLD loses the $0.2625 support with a strong 1H candle close, the bullish setup becomes weaker. A breakdown could open the way toward $0.2555 and potentially $0.2525. My Trading View The structure is showing recovery, but bulls still need to reclaim the $0.2690–$0.2715 resistance zone to confirm stronger upside momentum. I would rather wait for confirmation than chase a green candle. Patience and proper risk management matter more than entering every move. Keep your eyes on WLD. The next reaction around support and resistance could define its short-term direction. Trade smart. Protect your capital. Let the setup come to you. #ByXIMPACT

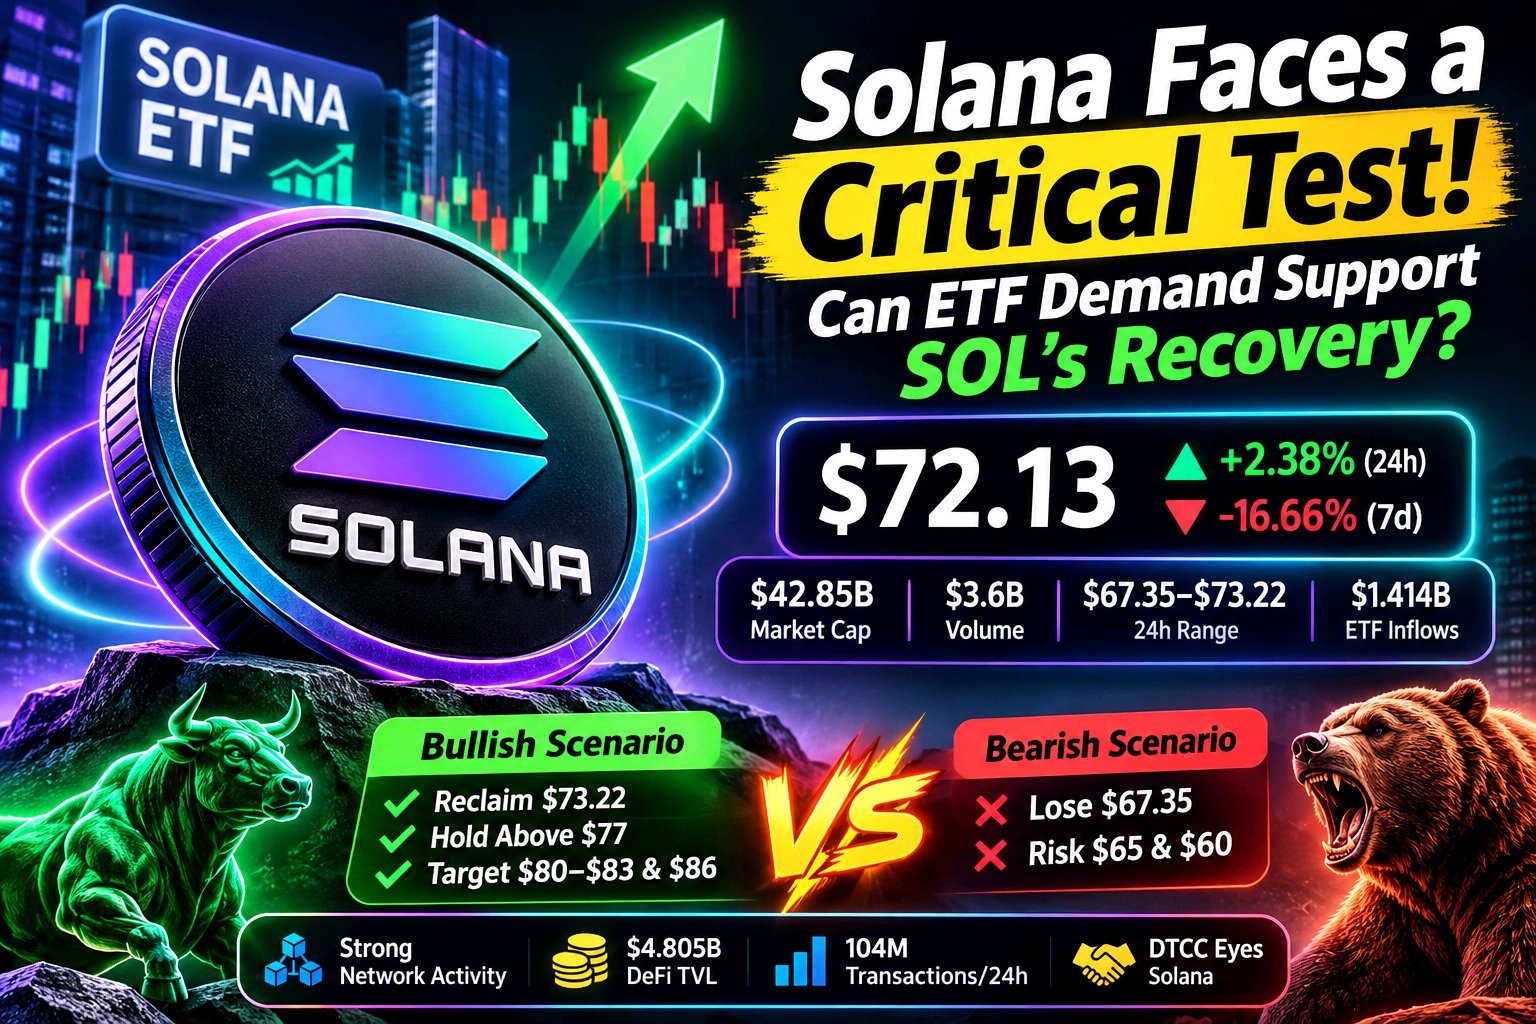
Solana is showing a mixed picture. Network activity remains strong, but SOL has dropped more than 16% over the past seven days. Meanwhile, spot ETF inflows are showing signs of recovery, and derivatives markets have experienced a significant reduction in leverage. The key question is whether institutional buyers can support the market or whether this rebound will lose momentum. SOL is trading around $72.13, with a market cap of approximately $42.85 billion and daily trading volume near $3.6 billion. Although the price has recovered 2.38% in 24 hours, its weekly performance remains weak at -16.66%. The recent trading range is $67.35–$73.22, making these levels important for the next move. Institutional activity is showing some positive signs. U.S. spot Solana ETFs recorded around $1.69 million in net inflows on November 12, ending five consecutive sessions of outflows. Total cumulative inflows remain near $1.414 billion. This suggests institutional interest has not disappeared, but one positive session is not enough to confirm a lasting trend. Solana's network fundamentals also remain meaningful. DeFi TVL stands around $4.805 billion, while stablecoin supply is approximately $13.96 billion. The network processed roughly 104 million transactions in 24 hours, generated around $448,750 in fees, and recorded $1.386 billion in daily DEX volume. However, weekly DEX activity declined by 19.11%, showing that ecosystem activity is also facing some pressure. Another development worth watching is DTCC's tokenization initiative, which has identified Solana among the blockchain networks being considered for future integration. This could create opportunities for Solana in traditional finance, although actual adoption and measurable usage will determine its long-term importance. Derivatives positioning has also changed considerably. Aggregate perpetual open interest is around $4.13 billion, with funding rates negative at approximately -0.0102% every eight hours. Around $23.24 million in positions were liquidated over 24 hours, including $14.63 million in long positions. Reduced leverage may help create a healthier market structure, but it does not automatically mean a bullish reversal is coming. Key levels to watch: - Resistance: $73.22, $77 and $80–$83. - Major upside target: $86. - Support: $67.35 and $65. - Further downside risk: $60. For bulls, reclaiming $73.22 and holding above $77 with stronger spot buying would improve the recovery outlook. On the other hand, losing $67.35 could bring renewed selling pressure. My view is that Solana still has strong infrastructure, meaningful DeFi liquidity and growing institutional exposure. But strong network activity doesn't automatically translate into higher SOL demand. I want to see consistent ETF inflows and stronger spot buying before considering this recovery convincing. For now, the market looks interesting, but confirmation is still missing. $SOLUSDT #ByXIMPACT

DOGE is attempting to reclaim the $0.0605 area after a sharp weekly decline. The bounce is encouraging, but daily and weekly trends remain bearish. I want spot demand to confirm it. MARKET SNAPSHOT Dogecoin is trading near $0.05976, up 4.37% over 24 hours but down 14.51% over seven days. The latest reported daily range is $0.05542–$0.06010. Market capitalization is around $9.38B, with approximately 156.77B DOGE circulating. DOGE has no fixed maximum supply. Aggregated spot volume is near $188.88M, futures volume around $1.39B and open interest approximately $763.69M. These are cross-exchange snapshots, not Bybit-only figures. Futures turnover is roughly 7.4 times spot volume, showing derivatives still dominate short-term activity. TECHNICAL STRUCTURE Daily RSI is around 27.1, with four-hour RSI near 38.1 and weekly RSI around 34.6. All three timeframes show a bearish bias, and price remains below all eight tracked daily moving averages. Oversold RSI is not a bottom signal; DOGE can bounce while the larger trend stays weak. The nearest resistance is $0.0605, followed by $0.0630 and $0.0803. A close above $0.0605 signals stabilisation; holding $0.0630 on a retest is stronger confirmation. Support is $0.0549, then $0.0519 and $0.0492. A daily close below $0.0549 would expose lower levels. A wick is not a breakout. DERIVATIVES: SHORT COVERING OR FRESH DEMAND? Open interest is around $763.69M, with the latest aggregate snapshot showing a 1.29% increase over 24 hours. However, the same dashboard's intraday explanation attributes the price bounce to OI falling about 2.95%, suggesting short positions are closing. The readings use different update windows, so they do not confirm a bullish leverage build-up. Funding is positive near 0.0033% per eight hours, below the 0.01% reference level. Longs are paying shorts, but positioning is not showing extreme long crowding. Around $2.67M in positions were liquidated, with approximately 63% from longs. Other trackers use different windows, so liquidation totals should not be combined. Spot net inflow is around $221K, while futures net inflow is approximately $28.5M. Futures demand is much stronger than spot participation. That makes the bounce vulnerable if leveraged buyers lose momentum. FUNDAMENTAL OUTLOOK Dogecoin remains a proof-of-work payment network with low-cost transfers, tipping and a large global community. Its next growth test is whether it can move beyond being mainly a transferable meme asset and support useful applications. DogeOS is the main ecosystem catalyst. Its public EVM-compatible testnet opened on September 30, allowing developers to build trading, lending, stablecoin, gaming and consumer applications. On November 11, the CEO said version-one development and audits were complete, with wallet, exchange and builder integrations being coordinated ahead of mainnet. No firm launch date was provided. More than 100 builders are reportedly working on projects, but testnet activity is not the same as live adoption. Dogecoin Labs has also brought MyDoge, DogeOS and other product teams together under one organisation focused on payments, commerce, consumer apps and infrastructure. The opportunity must translate into repeat users, transactions and DOGE demand. TOKENOMICS AND SUPPLY DOGE has no maximum supply and no halving schedule. Miners receive 10,000 DOGE per block, with blocks targeted approximately every minute. This creates roughly 5.2B new DOGE each year. Annual issuance is broadly fixed, so percentage inflation declines as supply grows, but dilution continues. There is no scheduled unlock calendar or protocol-level burn mechanism. Mining rewards secure the network but add supply; payments and applications must create enough demand to absorb it. BEARISH SCENARIO — SUPPORT BREAKDOWN Entry: $0.0547–$0.0550, only after a confirmed daily close below $0.0549 and a failed reclaim. Stop-loss: $0.0585. TP1: $0.0519 TP2: $0.0492 TP3: $0.0466 This is conditional, not a prediction. A sustained reclaim above $0.0585 invalidates the setup. With daily RSI oversold, a sharp relief bounce remains possible; I would not chase a breakdown without a failed retest. MY TAKE DogeOS and Dogecoin Labs could give DOGE a more useful application layer, but mainnet deployment and sustained user activity still need to prove the thesis. For now, the daily and weekly charts remain weak, derivatives activity outweighs spot participation and new mining supply continues every minute. The next test is whether $0.0549 holds and buyers can reclaim $0.0605 with stronger spot volume. Would you trust this bounce before DogeOS reaches mainnet, or wait for a broader demand shift? $DOGEUSDT #ByXIMPACT

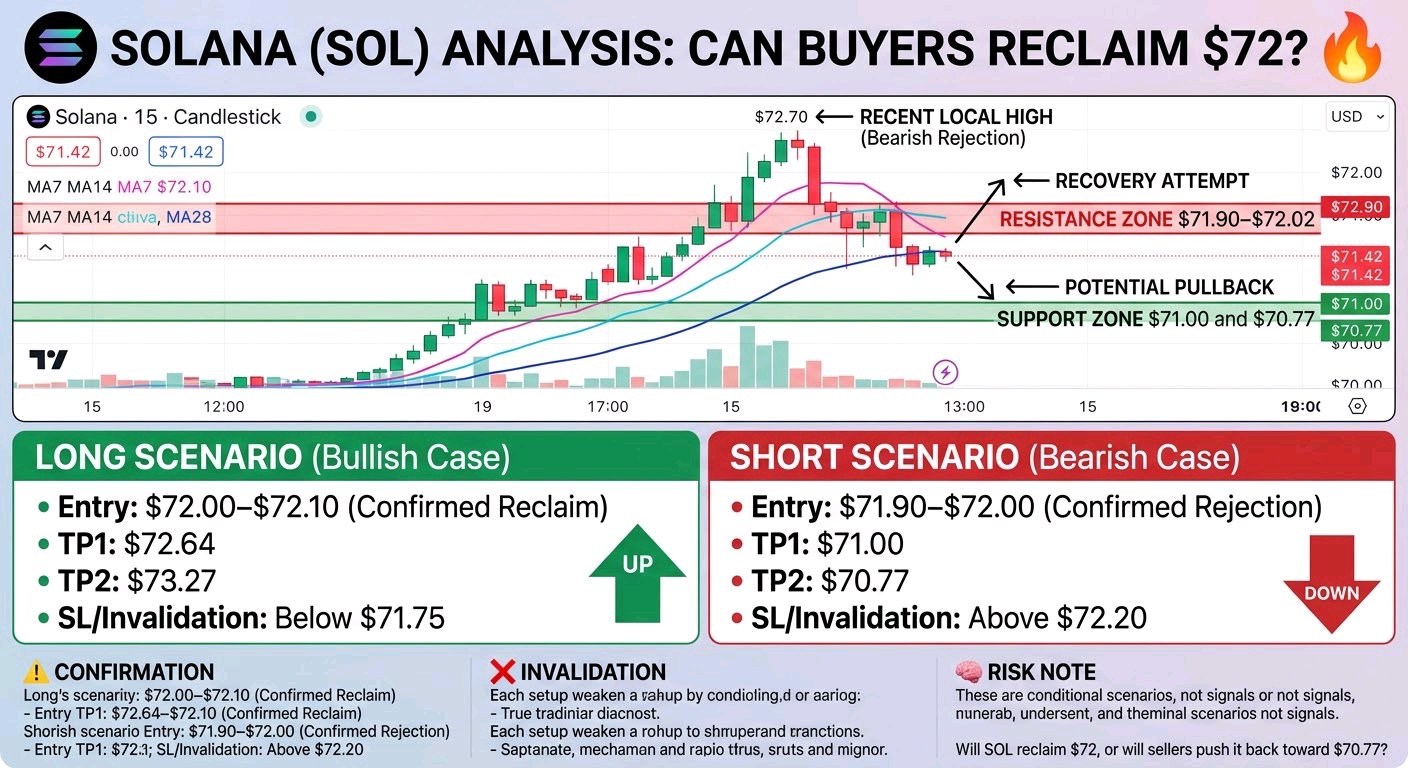
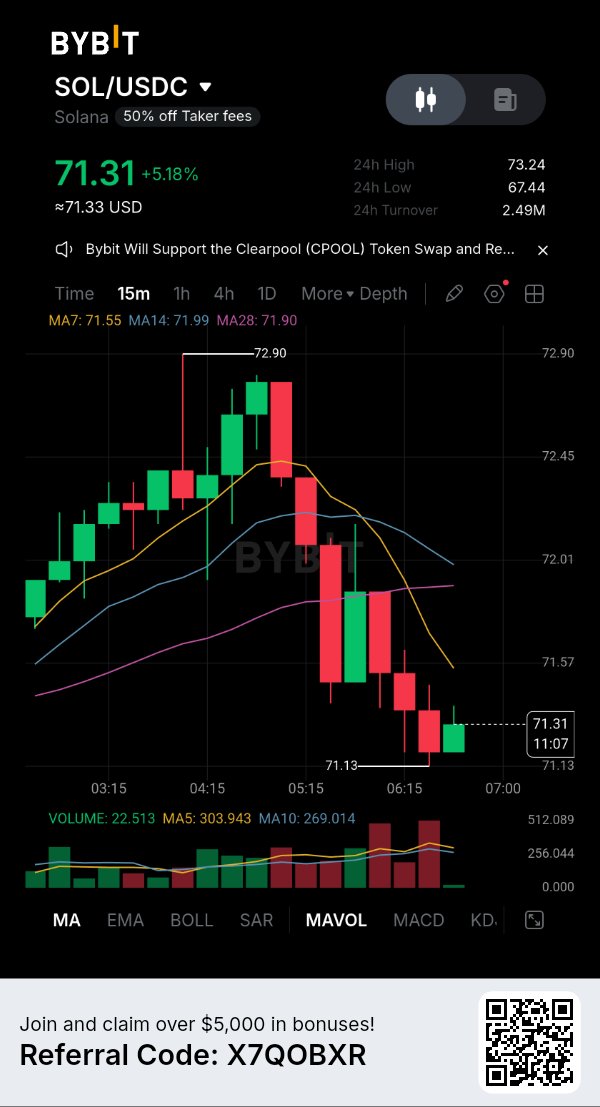
$SOLUSDT Faces a Critical Test: Can Buyers Reclaim $72? SOL is trading at $71.42, up 5.09% over 24 hours. However, the 15-minute chart shows a sharp pullback from the recent local high, followed by a small recovery. The next move around the moving-average resistance could determine short-term direction. Market Structure: Short-term structure looks bearish after the rejection near $72.6–$72.7. Price is currently below MA7 ($71.47), MA14 ($71.94), and MA28 ($71.90), showing that sellers still have an advantage. Key Support: $71.00 and $70.77 Key Resistance: $71.90–$72.02 and $72.64–$72.70 Potential Setup: LONG Scenario Entry: $72.00–$72.10 after a confirmed reclaim TP1: $72.64 TP2: $73.27 SL / Invalidation: Below $71.75 SHORT Scenario Entry: $71.90–$72.00 if price faces a confirmed rejection TP1: $71.00 TP2: $70.77 SL / Invalidation: Above $72.20 Confirmation: A strong 15-minute close above $72.00 could support a recovery attempt. Continued rejection around the moving averages may favor another move toward support. Invalidation: A sustained breakout above the resistance zone weakens the bearish scenario, while a decisive breakdown below $70.77 invalidates the current support-based recovery idea. Risk Note: These are conditional chart scenarios, not guaranteed signals. Wait for confirmation, manage position size, and always use appropriate stop-loss protection. Do you think SOL can reclaim $72, or will sellers push it back toward $70.77? #ByXIMPACT

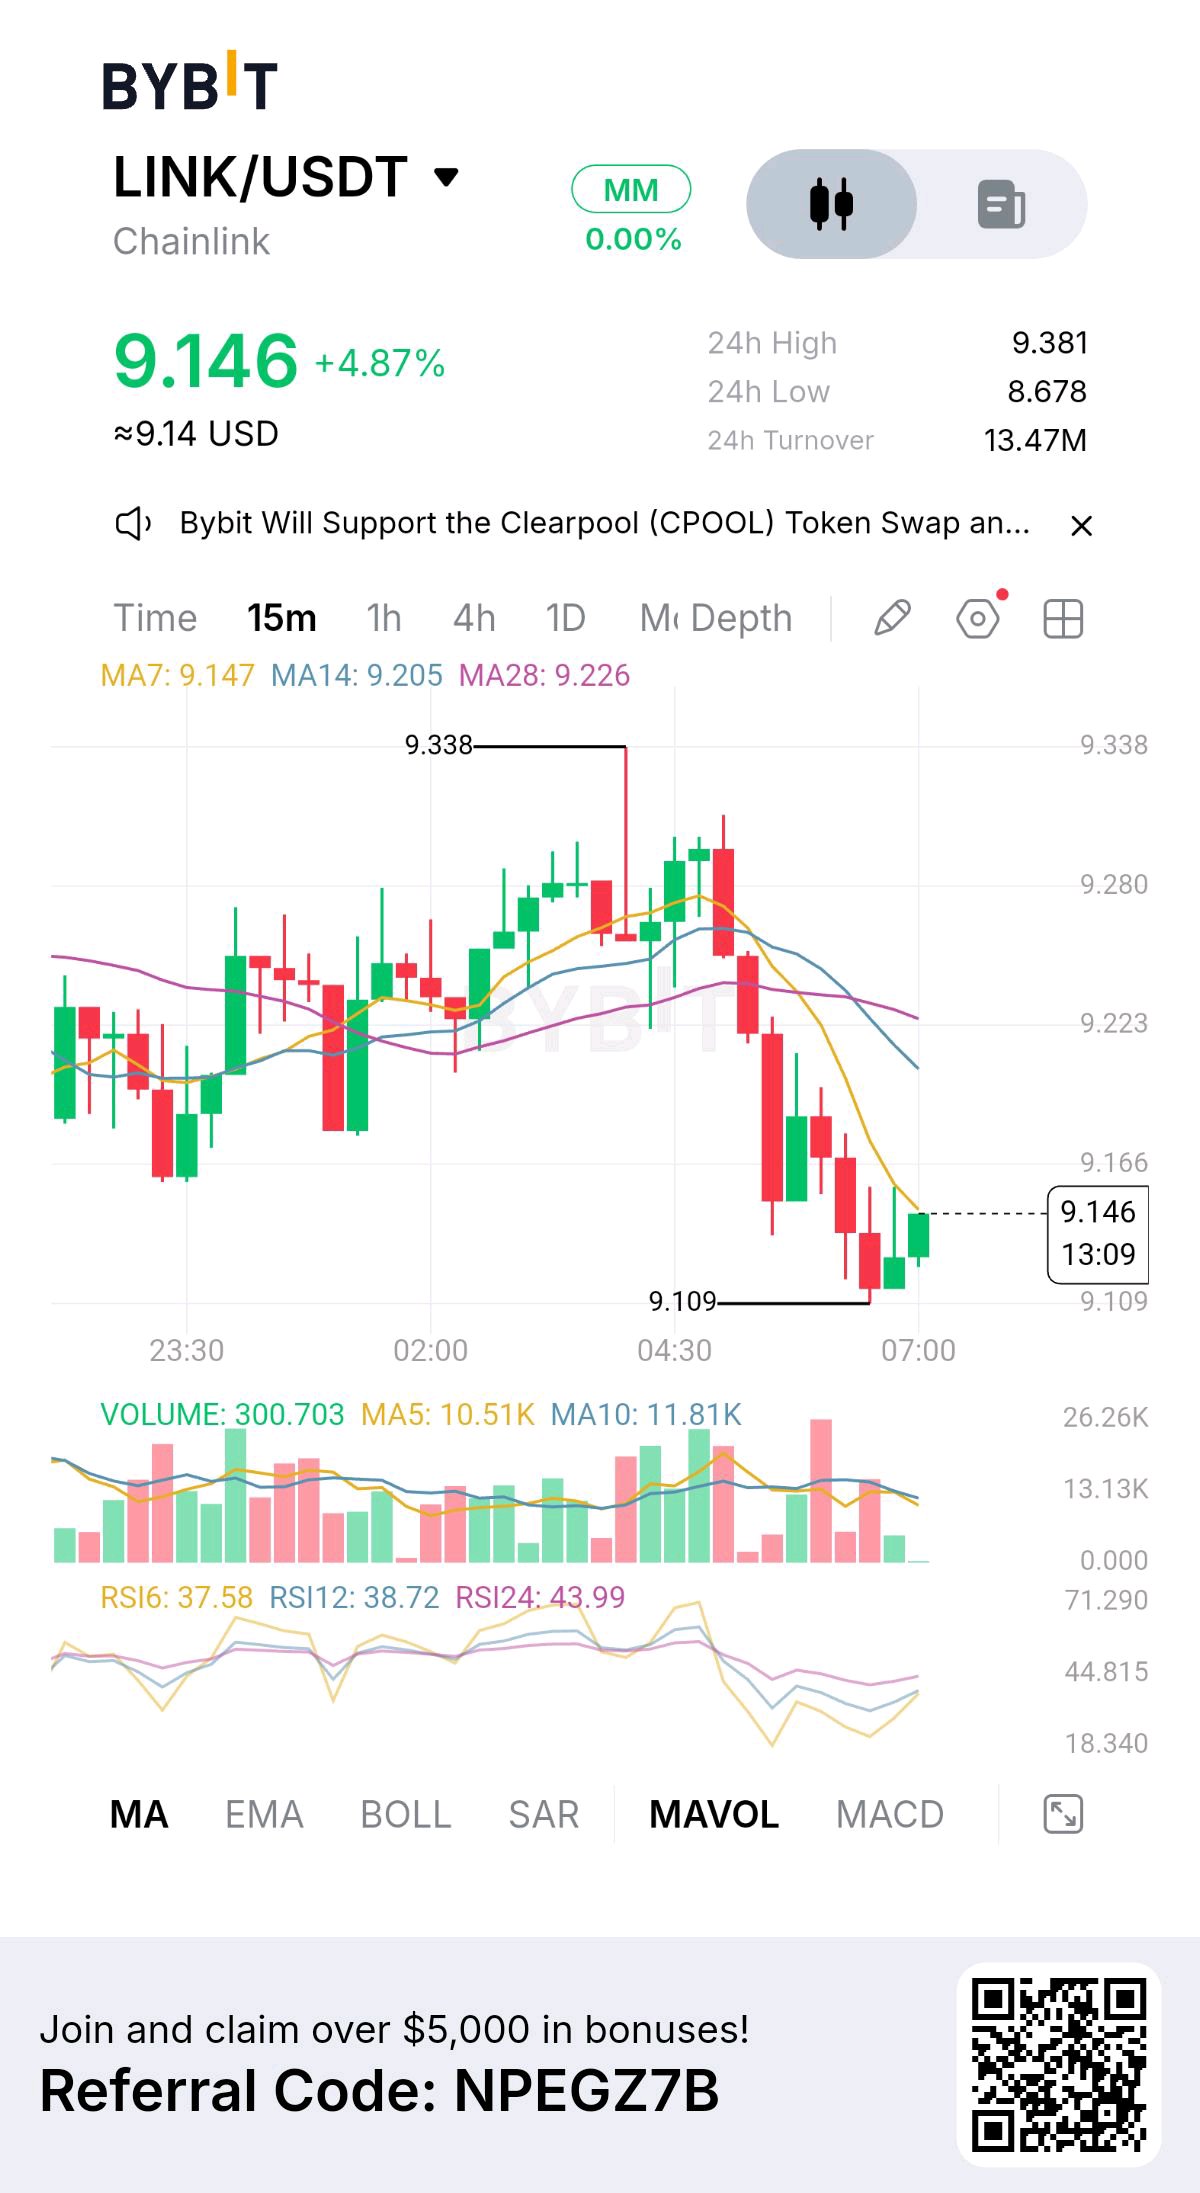
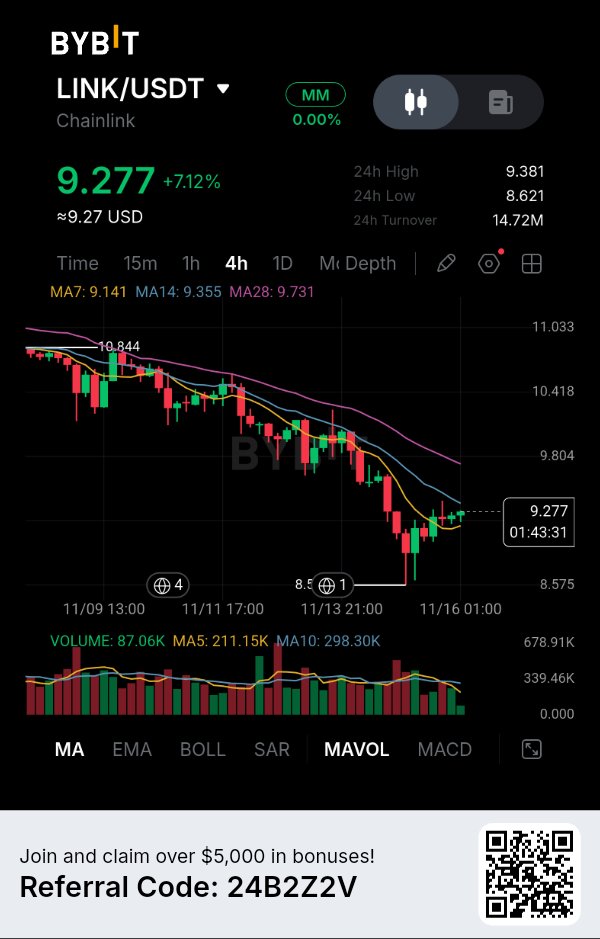
LINK is bouncing above $9.20 after briefly falling toward $8.60, but the recovery is happening while its weekly structure remains deeply negative. What makes this move interesting is that Chainlink is gaining institutional relevance at a time when its token price is still struggling. The latest development involves Moody's Ratings successfully testing Chainlink's cross-chain infrastructure for distributing credit-rating information across multiple blockchains. The question is whether institutional adoption can eventually translate into measurable demand for LINK. LINK recently traded near $9.25, up approximately 6.2% over 24 hours but down around 10.9% over seven days. Its latest 24-hour range stands at $8.616–$9.379, with market capitalization around $6.92B and trading volume near $337M. The $9.35–$9.40 zone is immediate resistance, while $9.00–$8.60 represents the important support region. A sustained move above $9.40 would strengthen the short-term recovery, but buyers still need to overcome the previous selling pressure. The fundamental catalyst is particularly important. On November 10, Chainlink and Moody's Ratings announced the successful completion of a pilot using Chainlink's Cross-Chain Interoperability Protocol (CCIP). The project demonstrated how Moody's credit-rating information could be distributed simultaneously across permissioned and permissionless blockchain networks. This matters because tokenized financial assets need reliable credit information regardless of which blockchain they operate on. However, there is one important distinction: the pilot was conducted in a testnet environment using representative data, not a live production deployment. It demonstrates technical capability, but commercial adoption still needs to follow. Another development strengthens the institutional narrative. Chainlink has introduced a revenue mechanism through which offchain and onchain enterprise revenue is converted into LINK and accumulated in the Chainlink Reserve. This creates a more direct connection between institutional adoption and token economics. The strategic opportunity is significant, but the actual impact depends on the amount of revenue generated and converted into LINK. Partnerships and integrations alone do not establish meaningful buying pressure. Tokenomics also deserve attention. Approximately 748.1M LINK are circulating against a maximum supply of 1B, meaning around 74.8% of the maximum supply is already in circulation. The remaining supply can still create distribution pressure as additional tokens enter circulation. However, the Reserve mechanism introduces a different demand-side consideration: if enterprise revenue grows and more LINK is accumulated, it could gradually strengthen the connection between network adoption and token demand. The important question is whether this demand can become large enough to offset circulating supply. Derivatives reveal another interesting development. CoinGlass reports approximately $397.26M in aggregate futures open interest, up 5.24% over 24 hours. Futures volume reached approximately $396.24M against $77.39M in spot volume, making derivatives activity roughly 5.1 times larger than spot trading. Funding is slightly positive at approximately +0.0002% per eight hours, while 24-hour liquidations reached approximately $681K, with longs accounting for around $496K. This suggests speculative participation is increasing alongside the recovery, but the relatively larger futures activity means buyers still need stronger spot confirmation. Key figures $9.25 — Current price area $9.35–$9.40 — Immediate resistance $9.00–$8.60 — Important support zone $8.616 — Recent 24H low $6.92B — Market capitalization $337M — 24H trading volume 748.1M / 1B — Circulating / maximum supply $397.26M — Aggregate futures open interest $396.24M / $77.39M — Futures / spot volume +0.0002% — Funding per eight hours $681K — 24H liquidations Bullish confirmation: Reclaim $9.40 and hold above it with stronger spot volume. That would put $9.80–$10.00 in focus, followed by the possibility of a broader recovery toward $10.50. Bearish confirmation: Lose $9.00 and fail to recover it. That would expose $8.60, with further weakness possible toward $8.20 if spot demand remains weak and leveraged positions begin unwinding. Chainlink is building a stronger institutional infrastructure story through Moody's, cross-chain interoperability and its revenue-funded Reserve mechanism. But institutional adoption and token appreciation are two different things. The decisive signal is whether real enterprise activity starts translating into sustained LINK demand while buyers reclaim $9.40—or whether derivatives-driven recovery fades under continued selling pressure. $LINKUSDT #ByXIMPACT

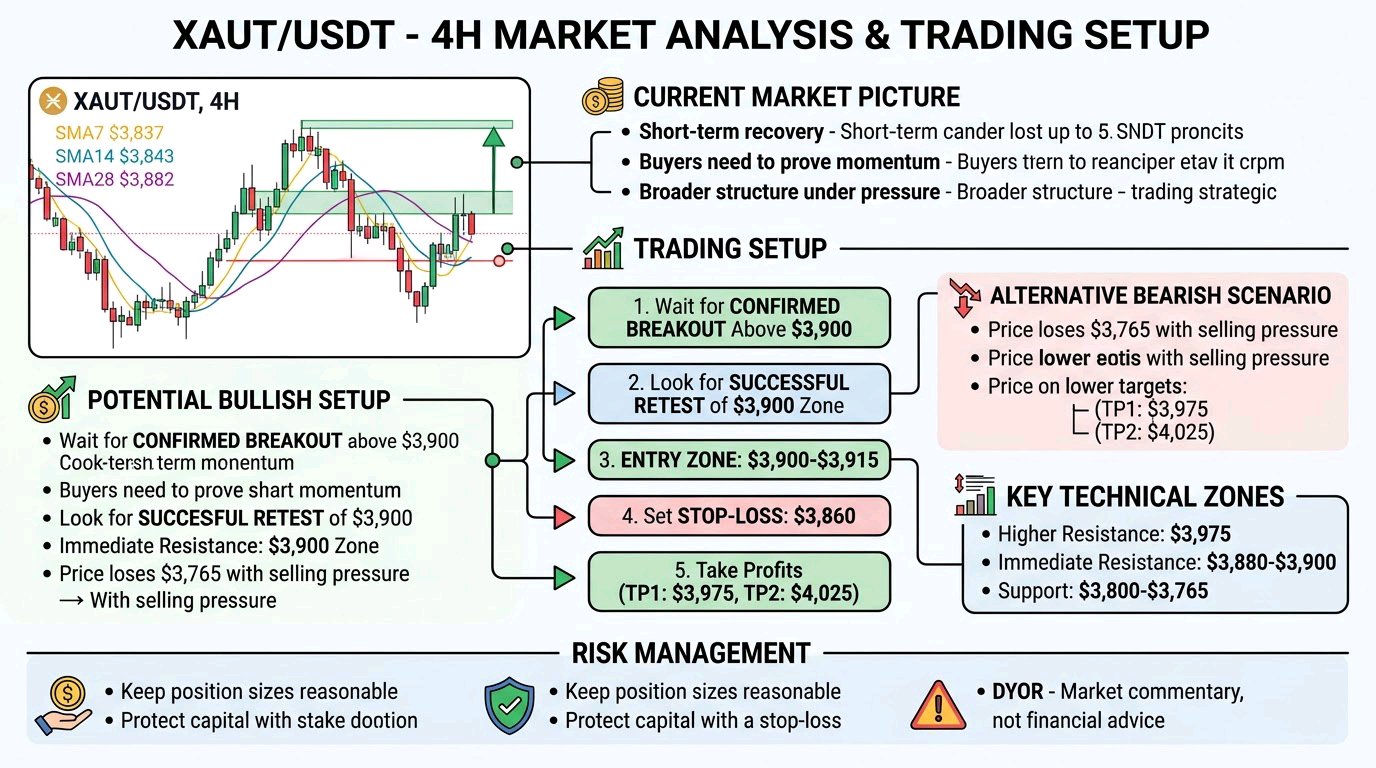
#ByXIMPACT $XAUTUSDT /USDT is showing a short-term recovery after a strong bearish move, but buyers still need to prove that this rebound is more than a temporary relief rally. On the 4H chart, Tether Gold is trading around $3,855.79, up 1.38%. Price has bounced from the recent support area near $3,765–$3,800. However, the broader structure remains under pressure after a series of lower highs and lower lows.# Current Market Picture and Key Levels The moving averages show an important battle: * MA7: $3,837.15 * MA14: $3,843.77 * MA28: $3,882.07 Price has moved above the short-term moving averages, suggesting improving buying momentum. However, the MA28 near $3,882 remains an important resistance. Key technical zones: * Support: $3,800–$3,765 * Immediate resistance: $3,880–$3,900 * Higher resistance: $3,975 * Bullish breakout level: Above $3,900 * Bearish breakdown level: Below $3,765 # Trading Setup Wait for confirmation The safer approach is to avoid chasing the current bounce and wait for a confirmed breakout or a fresh rejection. Potential bullish setup: * Entry zone: $3,900–$3,915 after a confirmed breakout and successful retest. * Stop-loss: $3,860 * TP1: $3,975 * TP2: $4,025 * Invalidation: A sustained 4H move back below $3,860 would weaken the bullish breakout scenario. The alternative bearish scenario becomes relevant if price loses $3,765 with strong selling pressure. These are conditional levels, not an active confirmed signal.# Why This Setup Matters The interesting detail is that XAUT has recovered above its MA7 and MA14, but remains below its MA28. This creates a short-term momentum improvement without confirming a complete trend reversal. Another important factor is the previous rejection around $4,080–$4,100. Sellers have already demonstrated strength in that region, making it important not to assume that one recovery candle will reverse the broader structure. Current market data also shows XAUT trading around the $3,860–$3,880 area, keeping the nearby resistance zone relevant. CoinGlass +1 Entering after a sharp recovery can expose traders to a sudden pullback. Waiting for a 4H candle close above resistance and a successful retest offers a more structured opportunity# Risk Management Keep position sizes reasonable and always define risk before entering a trade. Avoid excessive leverage, protect capital with a stop-loss, and do not move your invalidation level simply because the market moves against your position. If buyers cannot reclaim $3,900, patience may be more valuable than forcing a trade. Do you think XAUT can reclaim $3,900 and continue toward $3,975, or will sellers push the price back toward $3,800? DYOR. This is market commentary, not financial advice. #WSOTShowYourAITradeToEarn10USDT $LAVAUSDT

$DOGEUSDT deserves a closer look, but the first priority is identifying the exact asset and separating genuine market demand from speculative activity. Market Structure and Liquidity DODGE has multiple tokens circulating under similar names and tickers. Publicly indexed market data does not establish a reliable, unified DODGEUSDT market with verified current price, market capitalization, seven-day performance or derivatives positioning. Therefore, assigning precise support, resistance or price targets without confirming the Bybit contract would create false precision. For traders, liquidity is particularly important. A sharp price increase in a thin market can reflect limited selling liquidity rather than sustained buying demand. A credible breakout requires expanding trading volume, consistent spot participation and successful retests of reclaimed resistance. Technical Intelligence The key signals to monitor are the 20 and 50 EMA for short-term momentum and the 100 and 200 EMA for broader trend direction. RSI and MACD should confirm improving momentum rather than simply reacting to a sudden price spike. A higher high followed by a higher low would strengthen the bullish structure. Conversely, repeated rejection near resistance and a breakdown below the previous swing low would indicate that sellers remain in control. The Market Contradiction The most important potential contradiction is price momentum versus market depth. A token can display impressive percentage gains while having insufficient liquidity to support meaningful buying or selling activity. This means price appreciation alone cannot establish genuine market strength. Volume quality and executable liquidity deserve greater weight until stronger evidence emerges. Fundamental and Token Economics Unlike established utility-driven protocols, DODGE cannot be assigned measurable network adoption, recurring protocol revenue or sustainable token demand without identifying its exact project and verified documentation. Token holders should examine circulating supply, wallet concentration, minting permissions, liquidity distribution and contract ownership. A concentrated supply can create substantial downside risk if large holders decide to sell. Trading Strategy Bullish scenario: Wait for a confirmed resistance breakout with expanding volume, followed by a successful retest. Only then should traders consider a potential continuation setup. Bearish scenario: If price loses its established support and selling volume expands, a further decline becomes possible. Avoid treating temporary rebounds as confirmed reversals. Without verified exchange-chart data, specific entries, TP1, TP2, TP3 and stop-loss levels would be speculative. The Overlooked Factor The biggest risk may not be chart direction but market identity and liquidity. Two tokens sharing the same ticker can have completely different contracts, supply distributions and trading conditions. Contract verification must come before technical analysis. Final Verdict DODGEUSDT needs stronger confirmation before it can be classified as a sustainable bullish opportunity. The most important condition is a verified market with sufficient liquidity and a breakout supported by genuine spot demand. Would you prioritize DODGE's price momentum, or wait for stronger liquidity and volume confirmation before considering a position?#ByXIMPACT


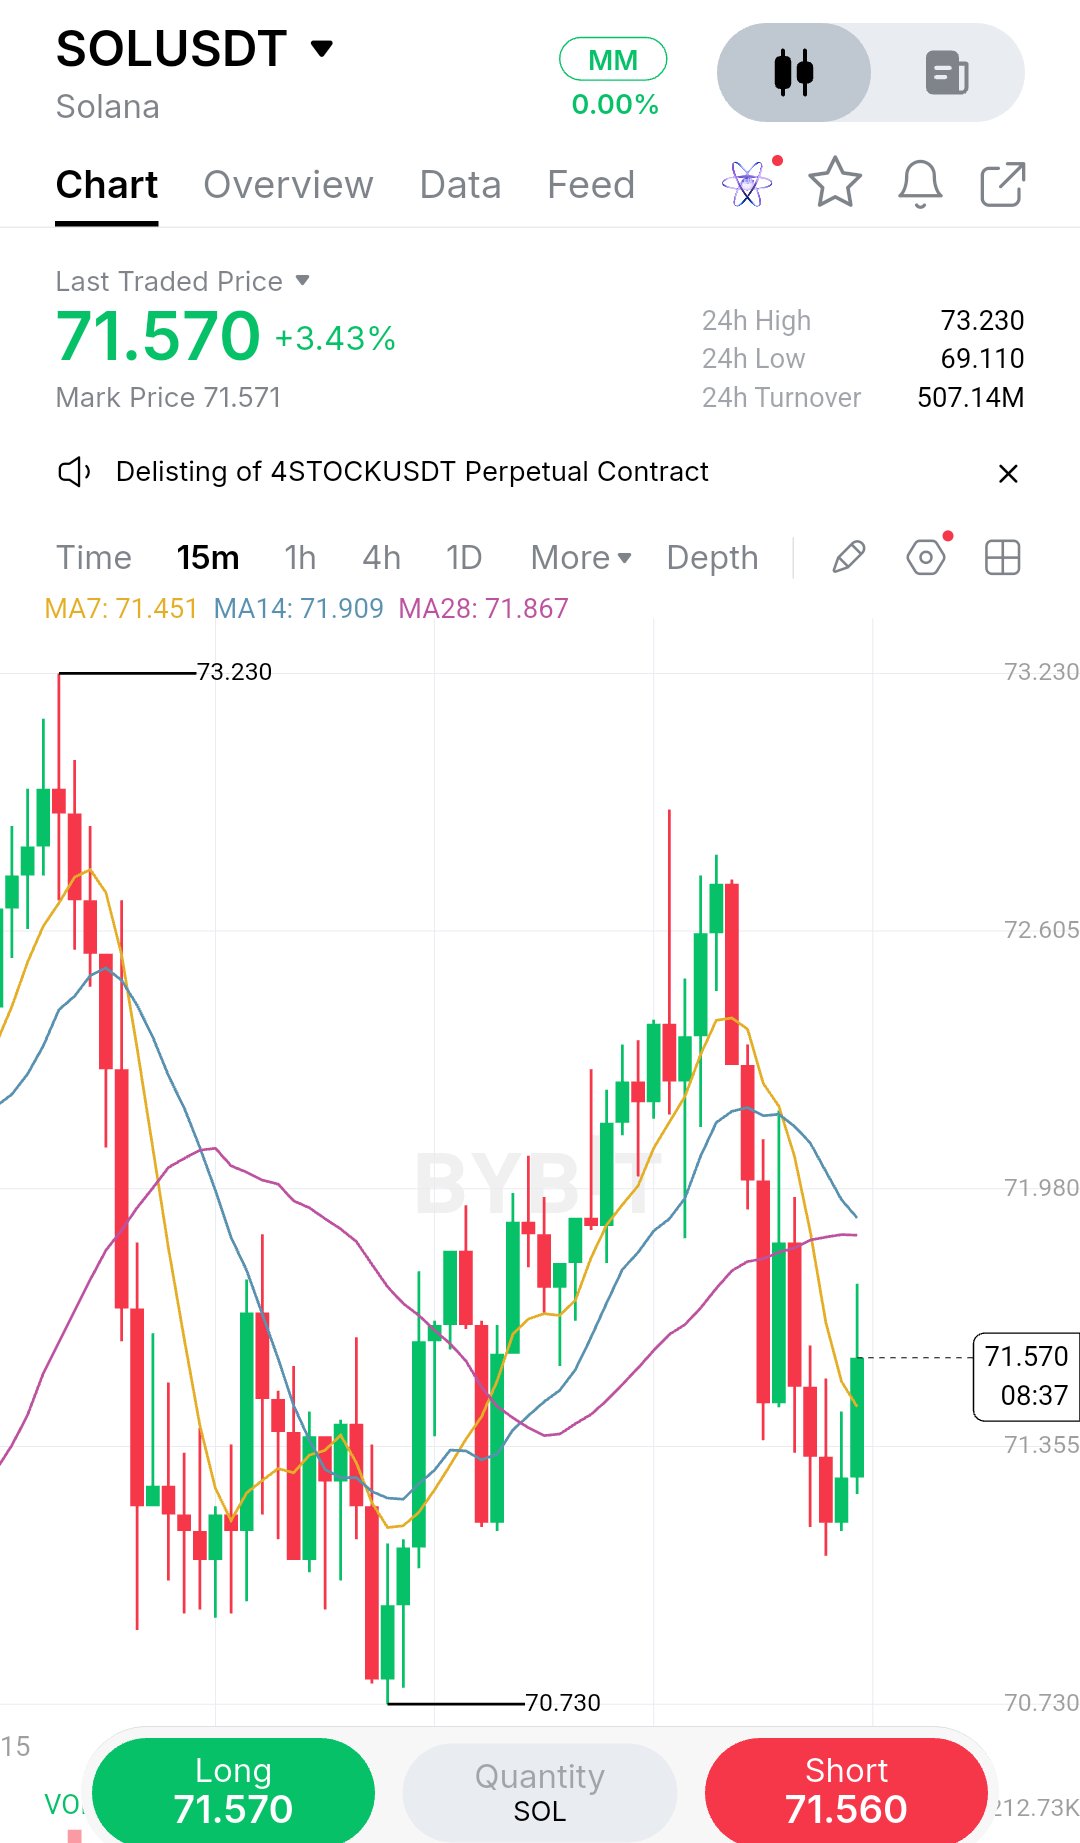
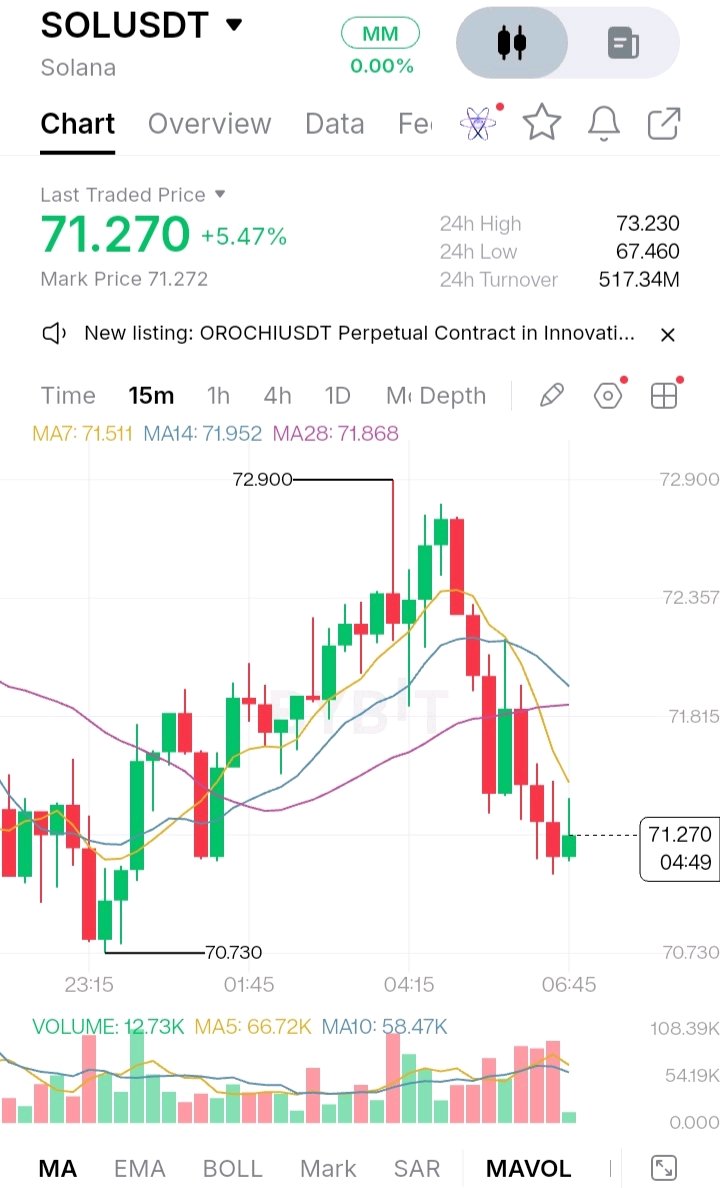
Solana is testing trader nerves right at a make or break intraday pivot after a sharp rejection near $72.900. Despite holding onto a solid 5.47% gain on the day with over 517.34M in 24h turnover the 15-minute SOLUSDT chart shows momentum hitting a clear wall. After climbing steadily off the 70.730 local low and pushing toward the 24h high of 73.230 sellers stepped in aggressively just under 72.900. That rejection triggered a swift pullback right through the short-term moving averages. Price is now trading at 71.270 sitting below the MA7 (71.511), MA14 (71.952) and MA28 (71.868), turning previous intraday support into immediate overhead resistance. For bulls, defending the 71.000 to 70.730 zone is now critical to keep the broader upward structure intact. If buyers can absorb this selling pressure and reclaim the 71.950 cluster, another run at the 73.230 high comes right back into play. Lose 70.730, however and the door opens for a deeper flush toward the 67.460 24h low. Watch how price reacts around 71.270 over the next few candles this level will decide whether the dip gets bought or turns into a full trend reversal. $SOLUSDT #ByXIMPACT

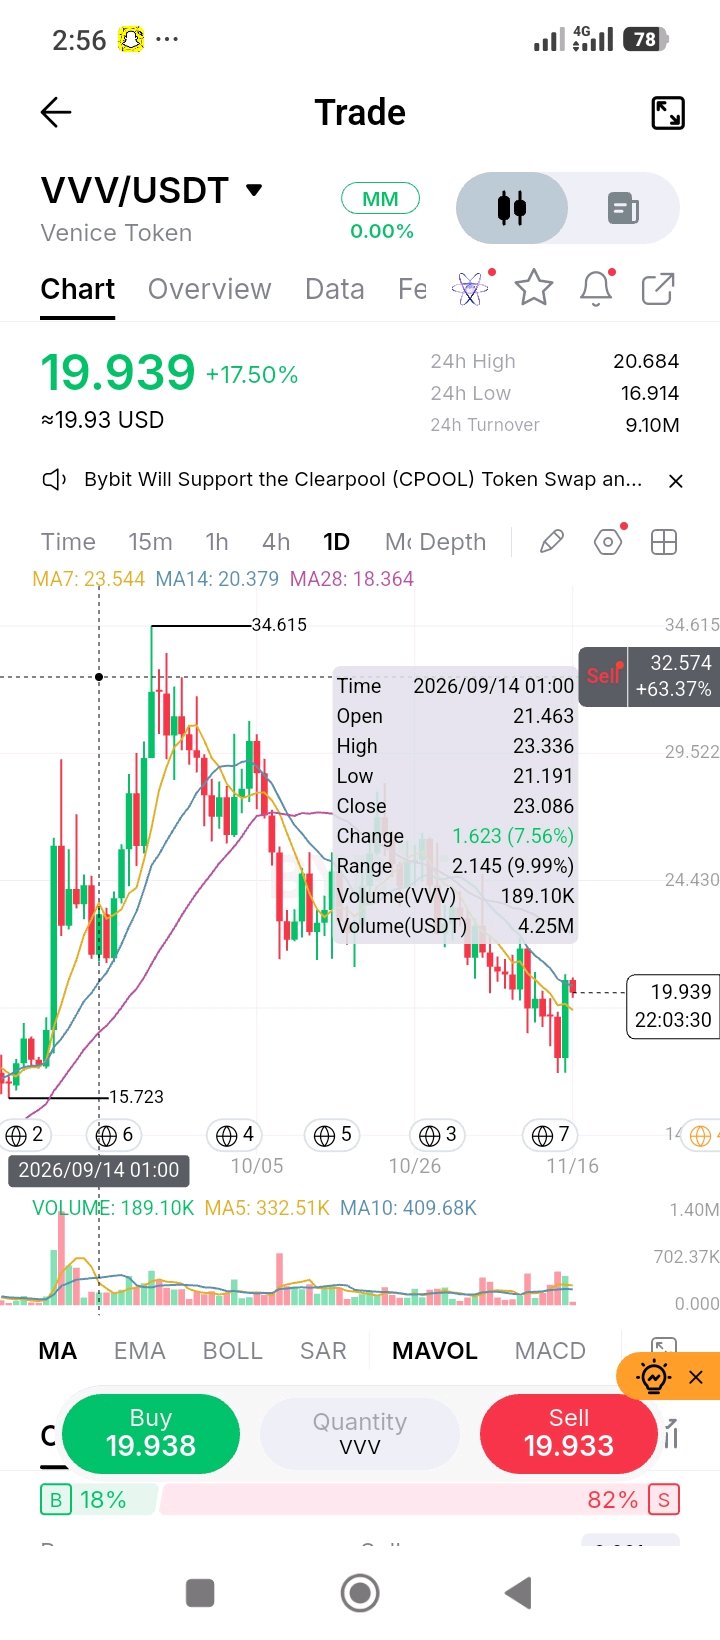
#ByXIMPACT $VVVUSDT is staging a massive relief bounce on the Daily chart, currently trading at 19.939, up a staggering 17.50% on the day. Happy new week. If you want to make the Top 100 on ByX this week, this is exactly the type of high conviction setup you need to master. The macro structure has been a bloodbath. Price collapsed from a major high of 34.615 all the way down to a swing low of 16.914. However, today is a different story. After bleeding for days, the market finally found a hard floor. Buyers aggressively stepped in at the lows, and the current daily candle is printing a massive, full bodied green candle, completely engulfing the recent selling pressure. This is a classic mean reversion bounce after an extended downtrend. Turnover 24 hour turnover is sitting at 9.10M USDT. For a daily chart, this is a moderate but not deep liquidity environment. The key data point here is the historical context you pulled up in the tooltip. Back on September 14th, during the initial breakdown phase, a single candle saw 4.25M USDT in volume with a range of 9.99%. That tells us there is real capital moving this asset when it trends. The current daily turnover shows enough liquidity to trade, but it is still sensitive to sudden flow. Volume Current volume is tracking solidly. Looking at the visual volume profile, the recent red selling candles were losing volume as they dropped, which signaled seller exhaustion. Now, this massive green bounce candle is accompanied by an uptick in volume. The tooltip shows that historical September candle traded 189.10K VVV. If today’s volume closes near or above that historical average, it confirms that real buyers, not just short covering, are driving this reversal. Moving Averages MA7 is at 23.544, MA14 is at 20.379, and MA28 is at 18.364. This is the most important technical setup on the chart. Price aggressively dumped, sliced through the MA14, but found perfect, textbook support exactly at the MA28 at 18.364. It has now bounced violently and is currently battling the MA14 at 20.379. The MA7 is still far above price, meaning the macro trend is still down, but the short term momentum has completely flipped. Levels to Watch • 16.914 is the daily swing low and the hard floor. • 18.364 is the MA28. The structural support that just held perfectly. • 20.379 is the MA14. This is the immediate battleground. A daily close above this confirms the momentum shift. • 23.544 is the MA7. The next major resistance. • 34.615 is the macro high. Consideration Look at the order book. It is extremely skewed, showing 18% buyers and 82% sellers. Retail is aggressively trying to short this bounce. They are looking at the macro downtrend and assuming this is a dead cat bounce. This is a massive trap. When price rejects a major moving average like the MA28 and rips 17% in a day, shorting it is dangerous. If price pushes through the MA14 at 20.379, those 82% of sellers will be forced to cover, creating a violent short squeeze that could easily push the price back to the 23.00 region. Trade Plan • The Bullish Path: A confirmed daily close above 20.379 (MA14). This traps the 82% of short sellers and opens a run to the MA7 at 23.544. • The Bearish Path: A rejection here leaving a long upper wick, followed by a daily close back below the MA28 at 18.364. This invalidates the bounce and sends price back to the lows. • My take: The setup is incredibly juicy, but you do not chase a candle that is already up 17.50%. I want to see how the daily candle closes. If it closes strong above the MA14, I will look for an intraday pullback to enter a long and ride the short squeeze. If it rejects here, I will wait for a daily close to look for a short. Support and Resistance Support is heavily layered at 18.364, followed by the major floor at 16.914. Resistance sits at the immediate battleground of 20.379, followed by 23.544. Invalidation and Risk Note The bullish thesis is invalidated on a daily close below 18.364 (MA28). The biggest risk here is a failed breakout at the MA14. In a macro downtrend, relief rallies often die at the first major moving average. If it rejects here, the 18% of buyers will get trapped. Do not use market orders. Wait for the daily candle to close. Size your position so you can survive a 15% wick in either direction.

MANTLE (MNT): More Than Just
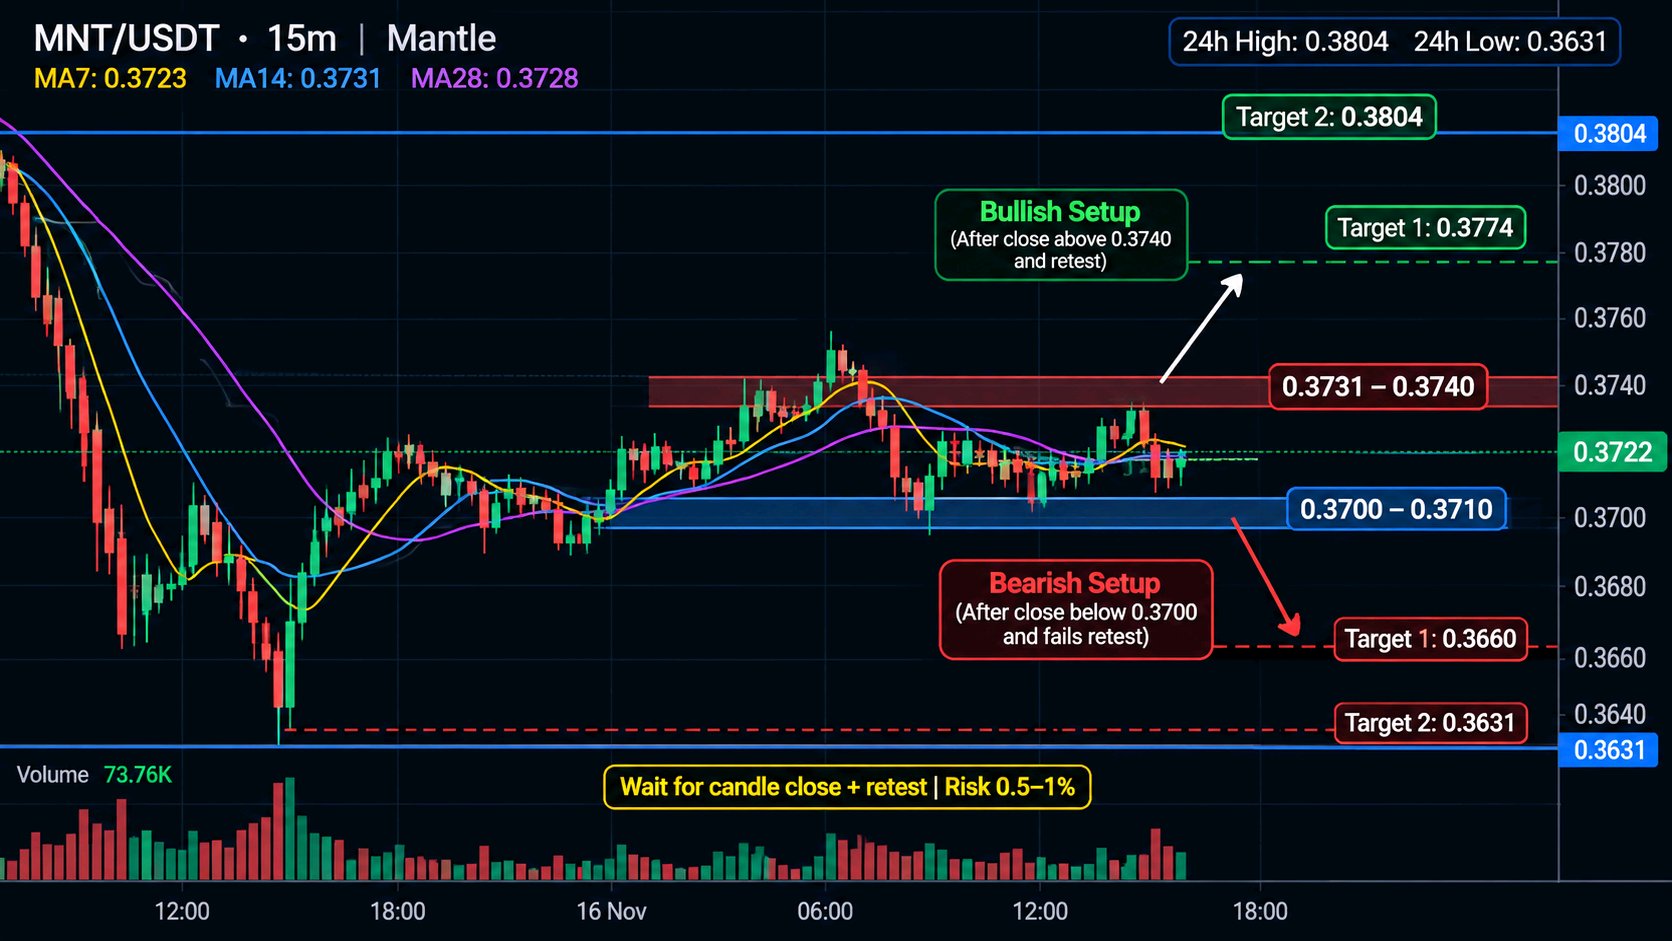
MANTLE (MNT): More Than Just Another Ethereum Layer-2 Token Mantle is building around a real blockchain challenge: making Ethereum-based applications more scalable and efficient. Its modular architecture separates key blockchain functions, while its Ethereum compatibility helps developers work with familiar tools and smart contracts. What makes $MNT important? - Network Utility: MNT is used to pay transaction fees on Mantle Network. - Governance: MNT holders can participate in ecosystem and treasury decisions. - Ecosystem: Mantle supports decentralized applications and on-chain financial activity. The interesting part is that MNT has an actual role inside its network, beyond market speculation. Its long-term progress depends on real usage, ecosystem growth and execution. 📊 MNT/USDT | 15M Trading Strategy Current price: 0.3722 My unique setup: MA Compression + Retest Trigger Instead of chasing every green candle, I watch the three moving averages compress and wait for price to prove its direction. 🟢 LONG SETUP - Trigger: 15m candle closes above 0.3740. - Entry: 0.3735–0.3740 after a successful retest. - Stop Loss: 0.3710. - TP1: 0.3774. - TP2: 0.3804. 🔴 SHORT SETUP - Trigger: 15m candle closes below 0.3700. - Entry: Failed retest of 0.3700. - Stop Loss: 0.3725. - TP1: 0.3660. - TP2: 0.3631. The trading edge: Let the market reveal its direction first. A breakout without a successful retest is not my entry signal. Risk only 0.5–1% of trading capital per setup. These are conditional levels from the supplied chart, not guaranteed outcomes. What interests you more about Mantle: its Ethereum scaling technology or the trading opportunity in $MNT? #ByXIMPACT $MNTUSDT

Bitcoin is showing a serious battle between exhausted sellers and buyers desperately searching for a floor. After suffering a massive correction from the $87,000 region, BTC is now hovering around $65,000, and the broader daily structure remains heavily damaged. What makes this situation particularly interesting is that the market is approaching a critical demand region where the next reaction could determine whether Bitcoin stabilizes or extends its correction even further. Looking closely at the daily chart, Bitcoin is trading significantly below its major moving averages. The EMA50 is around $77,131, while the EMA200 is near $77,735 on the reference daily analysis. This leaves a substantial resistance structure overhead, confirming that the broader trend remains under pressure. The RSI is sitting around 24, deeply inside oversold territory. Meanwhile, the daily MACD histogram remains negative, showing that bearish momentum is still a major concern. However, I would not ignore the possibility of a temporary relief rally after such an aggressive decline. Here is what I am watching closely: 📉 Critical Support Zone: Bitcoin is approaching the $62,830–$62,180 region. This is an important support area where buyers need to demonstrate meaningful strength. A decisive daily close below this zone could expose BTC to another wave of downside pressure. 🎯 Downside Targets: If the current support fails, the next levels I am watching are $60,350 and $58,720. A sustained breakdown below these areas would indicate that the corrective structure is extending further. 📈 Recovery Scenario: On the upside, Bitcoin first needs to reclaim $66,937. Above that, the $68,565 region becomes the next important resistance. A convincing move beyond $70,000 would provide stronger evidence that buyers are beginning to regain control. Momentum & Market Structure The most important thing right now is understanding the difference between an oversold market and a confirmed reversal. RSI near 24 tells us that selling pressure has been extremely aggressive, but it does not guarantee that the bottom is already in. Bitcoin can remain oversold while sellers continue controlling the trend. I want to see a meaningful change in market structure, stronger buying volume, and a confirmed higher low before considering a bullish shift. Trading Strategy & Risk Management I am not interested in chasing Bitcoin with a fresh short position after such an extended decline. Selling directly into major support without confirmation can expose traders to an aggressive relief bounce. My focus is on two possible scenarios. If BTC bounces toward the $66,937–$68,565 resistance region and sellers produce a clear rejection, a potential lower-high short setup could develop. I would require a confirmed entry, a stop-loss above the resulting swing high, and a worthwhile risk-to-reward ratio. On the other hand, if buyers successfully defend the $62,180 support region, establish a higher low, and reclaim nearby resistance, a short-term recovery opportunity could emerge. A sustained daily breakdown below $62,180 would invalidate the immediate recovery scenario. Conversely, a strong reclaim above $68,565 would weaken the bearish continuation thesis and bring the $70,000 region into focus. Bitcoin is at a critical technical decision point. The market has already experienced substantial damage, but the next move still needs confirmation. I would rather miss the first part of a recovery than enter blindly and risk unnecessary losses. Respect the trend, protect your capital, and let price action reveal the next opportunity. $BTCUSDT #ByXIMPACT
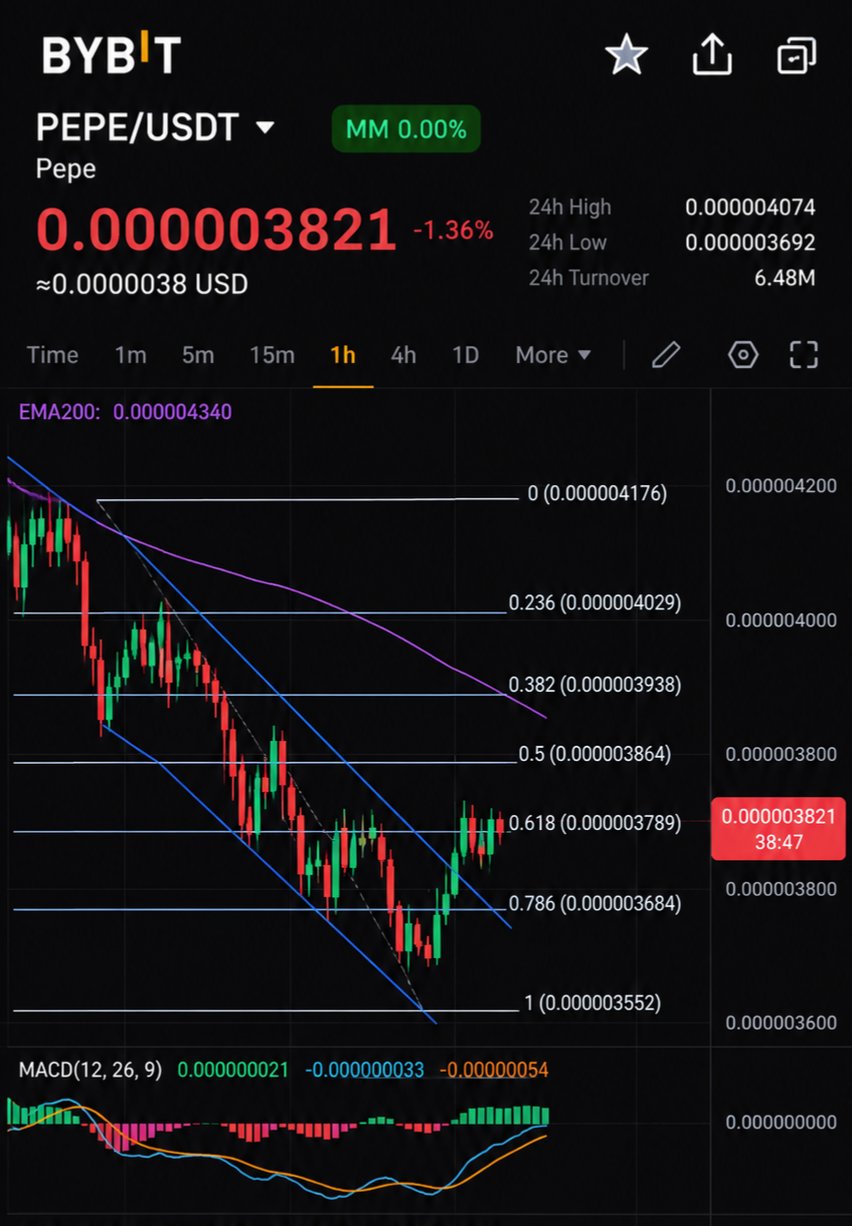
PEPE is showing a small recovery, but the 1H chart suggests buyers still have work to do. $PEPE is trading around $0.000003821, up 0.45% over 24 hours. However, price remains below all three key moving averages: MA7: $0.000003858 MA14: $0.000003902 MA28: $0.000003909 This is the level I’m watching closely. The recent bounce from $0.000003692 has not yet changed the short-term structure. PEPE needs to reclaim the $0.00000390 to $0.00000392 zone with stronger volume to show that buyers are gaining control. On the downside, $0.000003764 is the first important support, followed by the recent swing low at $0.000003692. My observation: PEPE is trying to stabilize after a sharp decline, but a green 24H reading alone does not confirm a trend reversal. The real signal will be whether buyers can reclaim resistance and sustain it with volume. $PEPEUSDT #ByXIMPACT

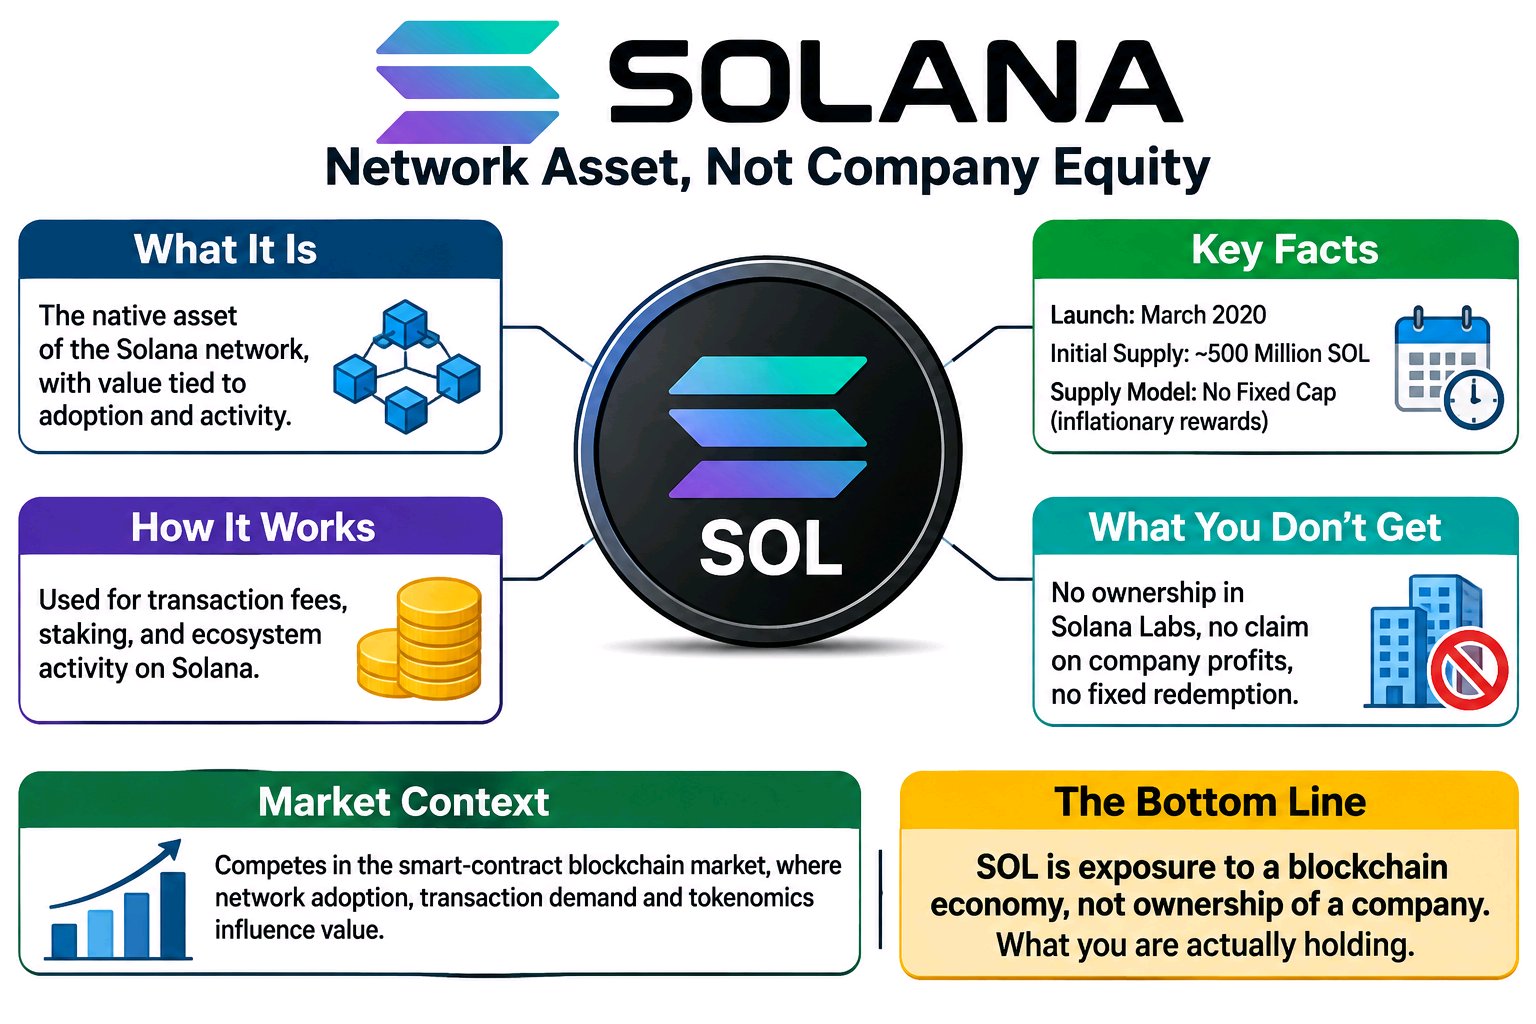
SOL may be treated as a bet on Solana's success, but it is neither company equity nor a dollar-pegged asset. It is the native asset of the Solana network, with its value tied to market demand, network activity, and its role in securing the blockchain. Solana launched in March 2020 with an initial supply of approximately 500 million SOL. Unlike Bitcoin, SOL does not have a fixed maximum supply; new tokens enter circulation through inflationary staking rewards, while transaction fees are partly burned. That distinction is easy to miss if you only read the headline. Holding SOL does not give you ownership of Solana Labs, a claim on company profits, or a guaranteed redemption value. It gives you exposure to a network asset used for transaction fees, staking, and economic activity across Solana's ecosystem. Staking can generate rewards, but those rewards come with inflation and validator-related considerations. The scale matters. Solana competes in the broader smart-contract blockchain market, where network adoption, transaction demand, competing ecosystems, token issuance, and market liquidity all influence the asset's value. A growing network does not automatically guarantee a rising SOL price, because network usage and token-holder returns are not the same thing. SOL is exposure to a blockchain economy, not ownership of a company. What matters is what you are actually holding. #ByXIMPACT$SOLUSDT

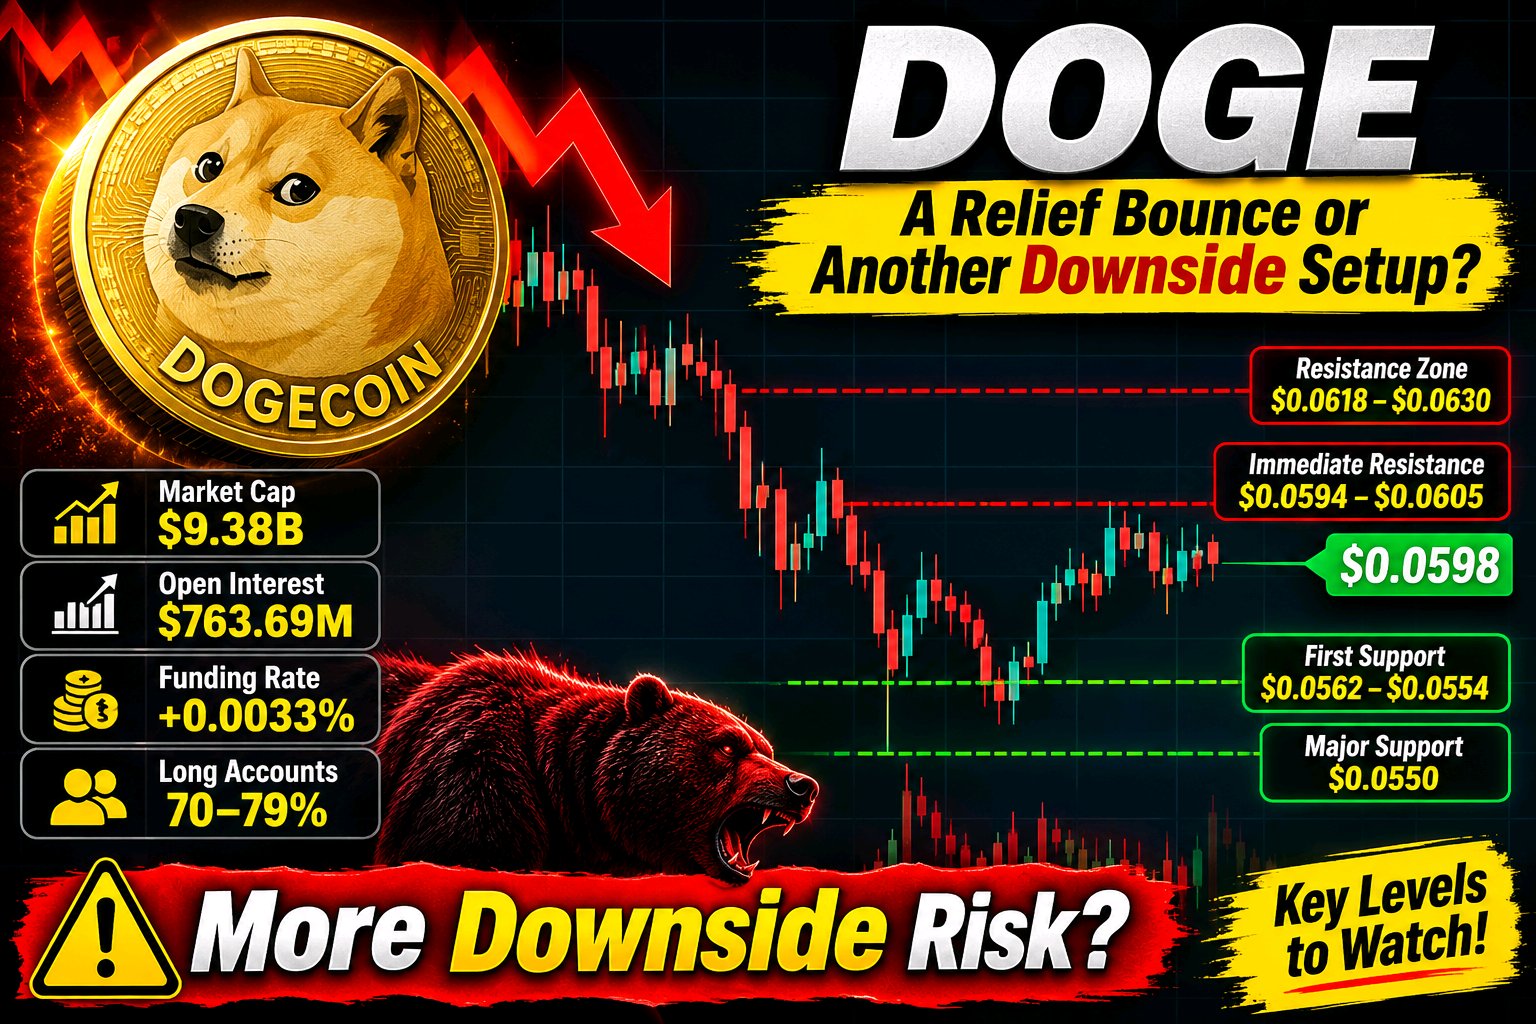
#ByXIMPACT $DOGEUSDT – A Relief Bounce or Another Downside Setup? Dogecoin is trading near $0.0598, recovering from a recent low around $0.0554. Despite the roughly 4.4% 24-hour rebound, DOGE remains down approximately 14.5% over seven days. I am not treating this stabilization as a confirmed recovery yet. The bigger concern is weak institutional demand, elevated futures exposure, and heavily long-tilted positioning that could create additional downside pressure. CoinGlass +1 DOGE has a market capitalization of approximately $9.38 billion. The recent decline has left its broader daily structure under pressure, despite the latest bounce. * Immediate resistance: $0.0594–$0.0605 * Next resistance: $0.0618–$0.0630 * First support: $0.0562–$0.0554 * Major nearby support: $0.0550 A sustained reclaim of $0.0605 would improve short-term momentum and potentially open $0.0618–$0.0630. However, the broader bearish structure remains intact until stronger buying confirms a trend change. Borearis +2 The institutional demand picture remains unconvincing. U.S. spot Dogecoin ETFs reported no net flows on November 13, with two of three funds reporting. The latest 30-session data showed approximately $539K in net outflows and virtually no fresh inflow activity. Meanwhile, DOGE futures volume is approximately 7.4 times spot volume. This suggests derivatives activity is dominating price participation rather than strong, consistent spot accumulation. Crypto ETF +1 The key question remains whether spot buyers can absorb available supply or whether the latest rebound is primarily leveraged positioning. DOGE is attempting to stabilize after a substantial decline, with the recent trading range developing around $0.0554–$0.0601. A narrow range following a sharp sell-off is not evidence of accumulation. The market needs stronger spot volume and sustained acceptance above resistance. Otherwise, another liquidity sweep below $0.0554 remains possible, potentially exposing lower support zones. Current derivatives data deserves close attention. * Total open interest: approximately $763.69M * 24-hour OI change: +1.29% * Weighted funding rate: +0.0033% * Binance long accounts: approximately 70.3% * Bybit long accounts: approximately 79.0% * 24-hour liquidations: approximately $2.67M, including $1.67M in longs. Funding is positive overall, meaning longs are paying shorts, although funding differs across exchanges. The important issue is that a substantial majority of accounts are positioned long. This creates vulnerability if support breaks, particularly with open interest increasing during the latest rebound. A downside move could trigger fresh long liquidations. CoinGlass +1 | Metric | Level | | -------------------- | -------- | | Current price | $0.0598 | | Market cap | $9.38B | | 7-day change | -14.5% | | Immediate resistance | $0.0605 | | First support | $0.0562 | | Recent low | $0.0554 | | Open interest | $763.69M | | Funding rate | +0.0033% | | Long accounts | 70–79% | Bullish confirmation: A decisive reclaim and sustained hold above $0.0605 would improve the short-term structure, opening potential tests of $0.0618 and $0.0630. Strong spot participation is necessary to validate this move. Bearish confirmation: A confirmed breakdown below $0.0554 would expose $0.0536, followed by the $0.0499 region. Elevated long positioning could accelerate the decline through forced liquidations. fullswing.ai +1 DOGE is showing temporary stability, but the broader recovery argument remains unproven. Weak institutional ETF demand, derivatives-heavy trading activity, and crowded long positioning continue to create an unfavorable risk profile. A short-term bounce does not automatically mean selling pressure has disappeared. The decisive signal is whether genuine spot buyers return while leverage remains controlled, or whether another support breakdown triggers a fresh wave of long liquidations. For now, DOGE deserves a cautious, neutral-to-bearish outlook until stronger market structure confirms otherwise.

Solana is showing an interesting divergence: network activity remains substantial, but SOL has lost more than 16% in seven days. Spot ETF inflows have started returning after a series of withdrawals, while derivatives positioning has undergone a major reset. The important question is whether institutional demand can absorb the selling pressure or whether the latest bounce is simply another temporary recovery. SOL is trading near $72.13, with a market capitalization around $42.85B and 24-hour trading volume near $3.6B. Price is up approximately 2.38% over 24 hours but remains down 16.66% over seven days. The latest 24-hour range is $67.35–$73.22. Buyers have recovered from the recent low, but $73.22 remains the immediate resistance. A sustained move above $77 would provide stronger evidence that the recovery is gaining momentum. The institutional picture is beginning to improve. U.S. spot Solana ETFs recorded approximately $1.69M in net inflows on November 12, ending a five-session outflow streak. Cumulative net inflows remain around $1.414B. This is important because institutional products provide another source of regulated exposure to SOL. However, one positive session does not establish a sustained return of institutional demand. Consistent inflows will matter more than a single recovery in ETF activity. Network fundamentals provide another important signal. DeFiLlama reports approximately $4.805B in Solana DeFi TVL, with stablecoin supply around $13.96B. The network processed approximately 104M transactions over 24 hours and generated around $448,750 in chain fees. Daily DEX volume reached approximately $1.386B, although weekly DEX activity declined 19.11%. This shows that Solana continues to support substantial financial activity, but the weekly slowdown suggests ecosystem demand is not immune to broader market weakness. There is also a longer-term institutional development worth watching. DTCC's tokenization initiative has identified Solana among the blockchain networks being considered for future integration of its tokenization services. This could strengthen Solana's position in traditional financial infrastructure. However, the planned expansion is a future development, not current institutional capital flowing directly into SOL. The actual impact will depend on implementation and measurable usage. Derivatives show that speculative exposure has been reduced significantly. Aggregate perpetual open interest is approximately $4.13B, while funding is negative near -0.0102% per eight hours. Approximately $23.24M in positions were liquidated over 24 hours, with around $14.63M coming from longs. Historical positioning data also shows that open interest has fallen sharply from approximately $558M on November 4 to $327M on November 14 on one tracked venue. This leverage reduction could make the market less vulnerable to crowded long positions, but negative funding alone does not confirm a bullish reversal. Key figures $72.13 — Current price area $42.85B — Market capitalization $3.6B — 24H trading volume $67.35–$73.22 — 24H range -16.66% — Seven-day performance 591.63M SOL — Circulating supply $4.805B — DeFi TVL $13.96B — Stablecoin supply $1.386B — 24H DEX volume 104M — 24H network transactions $1.414B — Cumulative spot ETF net inflows $4.13B — Aggregate perpetual open interest -0.0102% — Weighted funding per eight hours $23.24M — 24H liquidations Bullish confirmation: SOL needs to reclaim $73.22 and establish acceptance above $77 with stronger spot buying. That could open the way toward $80–$83, followed by the $86 area if institutional inflows continue improving. Bearish confirmation: Losing $67.35 and failing to recover it would weaken the current stabilization attempt and expose the $65 psychological support, followed by the $60 area if selling accelerates. Solana still has substantial network liquidity, active DeFi infrastructure and an established institutional investment channel. But the market is highlighting an important distinction between network activity and immediate token demand. I'm watching whether ETF inflows become consistent while spot buyers reclaim resistance. The derivatives reset has reduced some leverage risk, but without stronger spot participation, this recovery remains unconfirmed. $SOLUSDT #ByXIMPACT

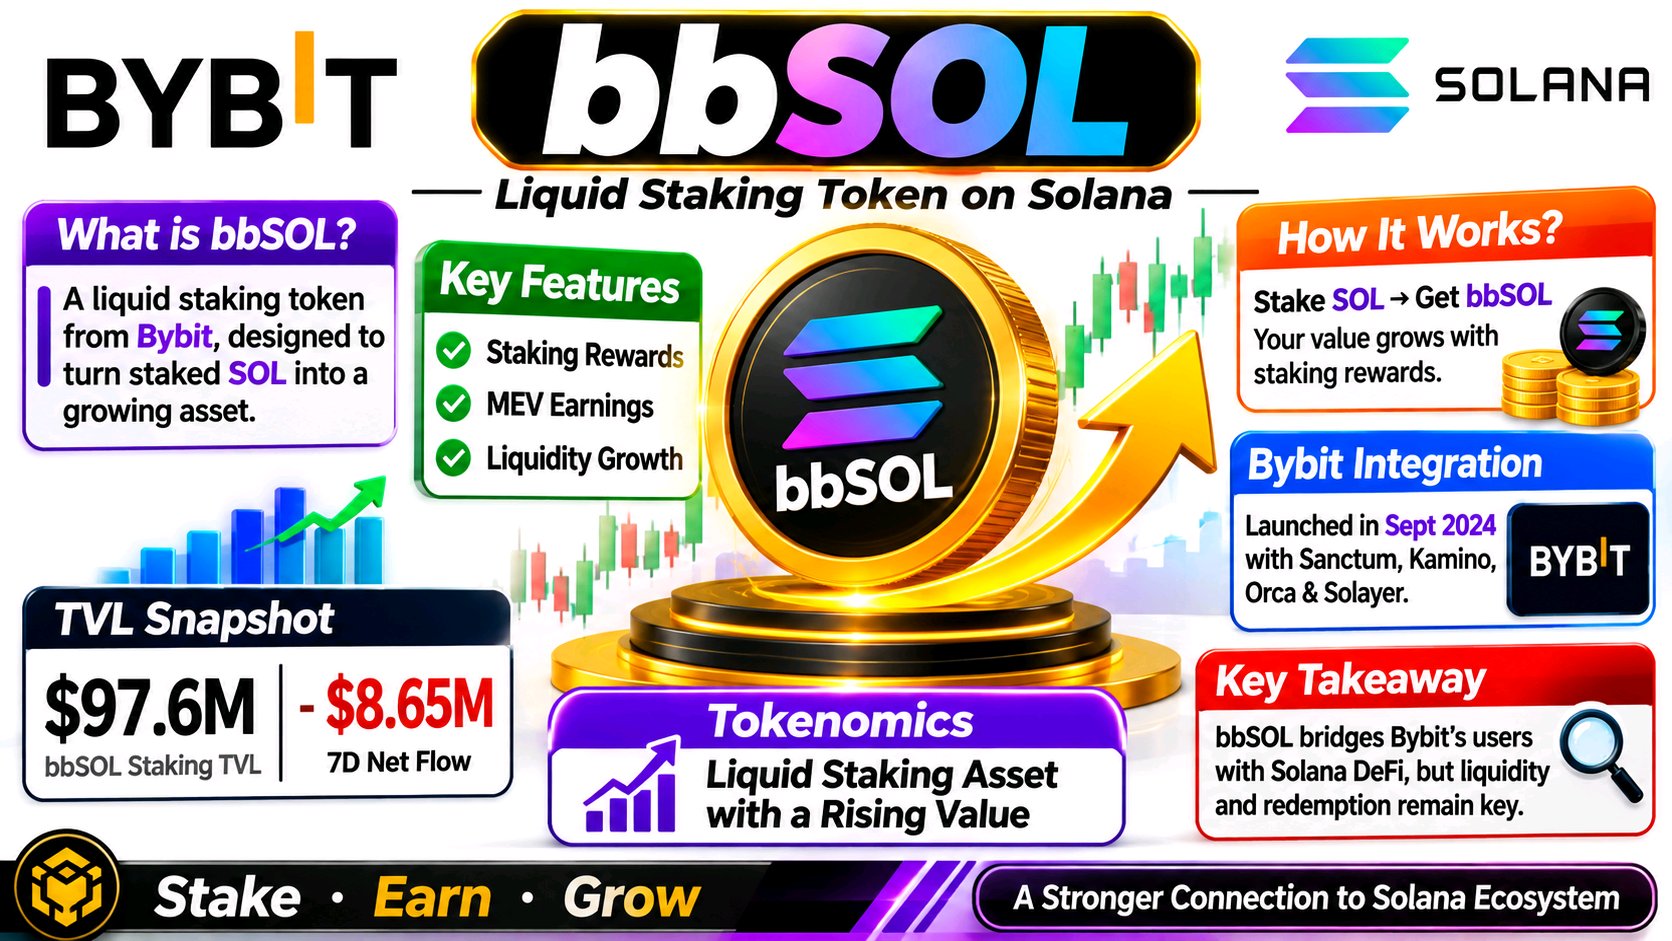
What stands out about bbSOL is that its real value is not simply earning Solana staking rewards. The more important question is whether Bybit can turn a centralized exchange's user base into sustained liquidity across Solana DeFi. That distinction matters because bbSOL is not an independent blockchain or a conventional governance token. It is a liquid staking asset issued through Bybit, with its value designed to appreciate against SOL as staking rewards accumulate. What caught my attention about bbSOL is the gap between its institutional story and the liquidity actually moving through its markets. Bybit introduced bbSOL in September 2024 with Sanctum, Kamino, Orca and Solayer. The product turns staked SOL into a liquid receipt: staking rewards, MEV and liquidity-related earnings accrue through a rising bbSOL-to-SOL exchange rate rather than regular cash payouts. Bybit’s documentation also makes the trade-off clear: a 0.1% deposit fee applies, and larger redemptions can take an epoch, roughly two to three days. So “liquid” does not mean frictionless under every condition. prnewswire.com +2 The more interesting development is distribution. Bybit announced Anchorage Digital custody support in October 2025, potentially making bbSOL easier for institutions to hold. But institutional access is not the same as institutional demand. DeFiLlama’s latest snapshot lists roughly $97.6 million in bbSOL staking TVL and an approximately $8.65 million negative seven-day net flow. That suggests capital has recently been leaving, despite the expanded custody route. Bybit Press +1 This is the tension traders should focus on: bbSOL’s value proposition depends on SOL staking economics, but its market quality depends on redemption confidence and usable DeFi liquidity. A yield-bearing token can still trade with meaningful slippage or discount if exits become crowded. I would watch net flows, bbSOL/SOL pricing, pool depth and redemption conditions before treating new integrations as adoption. The key question is whether institutional access turns into persistent on-chain liquidity—or remains mostly a distribution headline. #ByXIMPACT $BBSOLUSDT

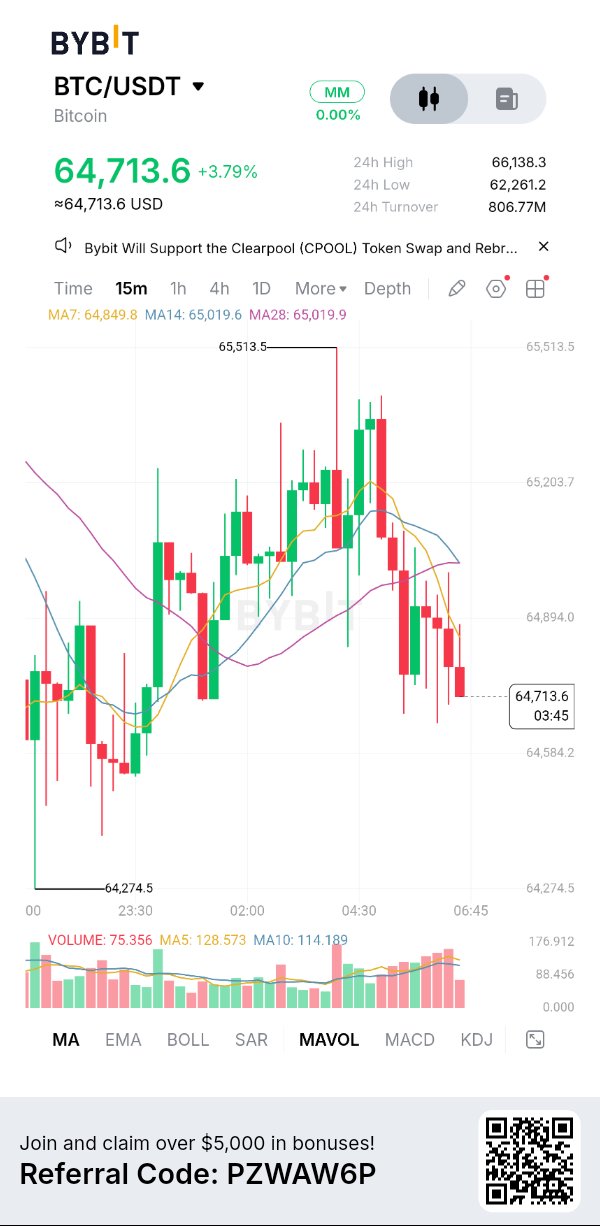
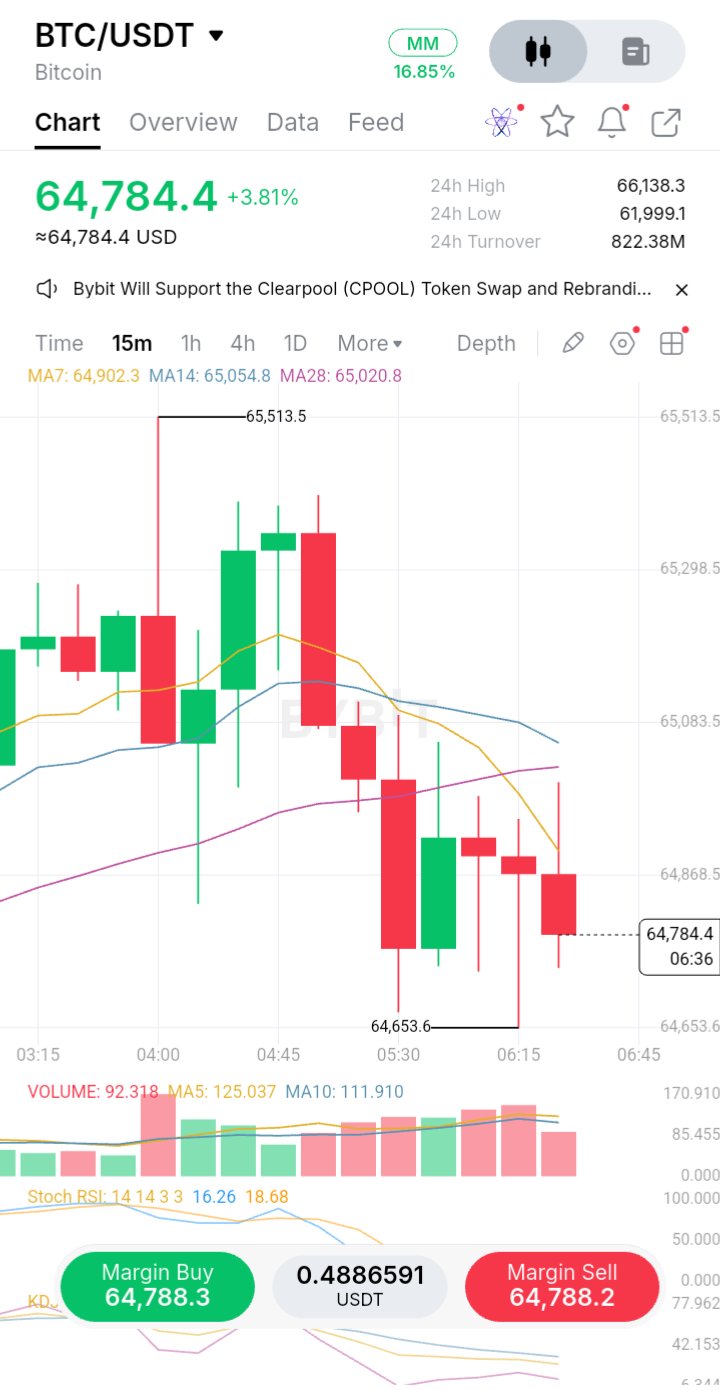
$BTCUSDT is attempting to stabilize after a sharp sell-off, but the recovery is facing a more important test than simply holding above $64,000: can spot demand absorb selling pressure, or is this rebound being driven mainly by short-term derivatives activity? Bitcoin is trading near $64,804 in the supplied Bybit snapshot, up 3.42% over 24 hours. However, the broader move remains weak. BTC has fallen roughly 12.6% over seven days, while the recent decline pushed price toward $61,999 before buyers stepped in. Market Structure: The 4H chart remains bearish. BTC is below MA7 at $64,862, MA14 at $65,655 and MA28 at $68,633. On the 1H chart, price is also below MA7 ($65,058) and MA14 ($64,992), while the 15M structure shows sellers defending the $65,000 area. The immediate recovery therefore needs confirmation, not just green candles. The Derivatives Contradiction: CoinGlass data shows futures volume around $78.5B against spot volume of $7.56B — more than 10 times higher. Open interest is down 4.68% to approximately $41.6B, while 24H liquidations reached $335M. This combination points to significant leverage being removed rather than clear evidence of fresh, sustained accumulation. Funding remains close to neutral. Institutional demand is another concern: US spot Bitcoin ETFs recorded approximately $185.4M in net outflows on November 13. The November 10–13 period saw roughly $864M in cumulative outflows. Key Figures - Bybit price: $64,804.5 - 24H change: +3.42% - 24H high/low: $66,138 / $61,999 - Bybit turnover: $825.80M - Market cap: approximately $1.31T - Circulating supply: approximately 20.11M BTC - 7D performance: approximately -12.6% What Changes the Outlook? A sustained 4H reclaim of $65,655 would be the first meaningful improvement, followed by $68,633. Failure to hold $61,999 would put the recent recovery at risk. The key signal is not whether BTC can bounce, but whether spot buyers return strongly enough to support the move. Are we seeing early accumulation, or simply a relief rally during a broader deleveraging phase? NFA. DYOR. #ByXIMPACT


$BTCUSDT — Emergency Update: Bitcoin has recovered from its weekly low, but I am not convinced the market has repaired the damage. Bitcoin is trading around $65,000, with its latest available market snapshot showing a 24-hour recovery of approximately 1.5%. Its market capitalization is near $1.30 trillion, while spot trading volume is approximately $7.5 billion. The latest 24-hour range extends from $61,956 to $66,093. More importantly, Bitcoin has fallen roughly 14% over seven days. That is not an ordinary pullback. What concerns me is the pressure behind this move. Approximately $328 million in BTC futures positions were liquidated over 24 hours, while open interest declined almost 5%. This tells me leveraged exposure is being reduced, but it does not yet prove that selling pressure has finished. U.S. spot Bitcoin ETFs also recorded $185.4 million in net outflows on November 13, marking seven consecutive sessions of withdrawals. The Binance security incident on October 29 added another layer of uncertainty. The exchange confirmed that approximately $6.34 billion in digital assets were affected and stated that it would cover the losses. However, I have seen no verified evidence connecting that incident to deliberate liquidation activity. I prefer confirmed facts over explanations built around market rumours. My biggest concern is Bitcoin's failure to defend the $66,700–$72,500 higher-timeframe region that I previously considered important. Price has moved below that entire area. The weekly structure is therefore damaged, and I will not call that support intact simply because Bitcoin has bounced from its lows. The $62,000–$63,300 region is now the immediate downside area. A sustained recovery above $66,700 would be the first sign of improvement, while reclaiming $72,500 would provide stronger evidence of structural recovery. A weekly breakdown below $60,000 would put the broader bullish recovery thesis under serious pressure. My short-term outlook remains bearish until Bitcoin proves otherwise. Long term, I am not ready to abandon the broader investment thesis, but that conviction does not give me permission to ignore deteriorating market conditions. My approach is straightforward: protect existing exposure, avoid chasing relief rallies, and wait for genuine buying strength before increasing risk. The weekly candle has not closed, so I want confirmation rather than assumptions. I still believe Bitcoin can rebuild its structure, but the market must earn that confidence back. If the $60,000 region fails on a sustained weekly basis, I will reconsider my broader outlook instead of defending an outdated prediction. For me, capital preservation matters more than being right about the bottom. #ByXIMPACT


當我打開 Bybit 看到 SPCXX 回升至 140 美元附近時,我的第一直覺是感到興奮。在看著這張圖表從 147.56 美元區域跌向 133.51 美元後,看到買家重新進場感覺就像是一個潛在的轉折點。 但經驗教會我要將興奮與證據區分開來。 以下是我注意到的重點:$SPCXXUSDT 目前交易價格為 139.35 美元,上漲 2.85%。在 1 小時圖上,價格已重回三條移動平均線之上:MA7 位於 139.31 美元,MA14 位於 138.98 美元,MA28 位於 137.74 美元。MACD 也呈正值,顯示短期動能正在改善。 然而,我還不敢稱這是一個確認的趨勢反轉。 140.53 美元的阻力位是即將面臨的考驗。若能伴隨更強的成交量果斷突破,可能會開啟通往更高水平的大門。若是遭遇拒絕,價格可能會跌回 138 美元甚至 137 美元。 我的策略是什麼?觀察確認訊號、管理風險,並避免追漲。 我經歷過足夠多的市場週期,深知復甦並不等於反轉。 #ByXIMPACT $DOGEUSDT



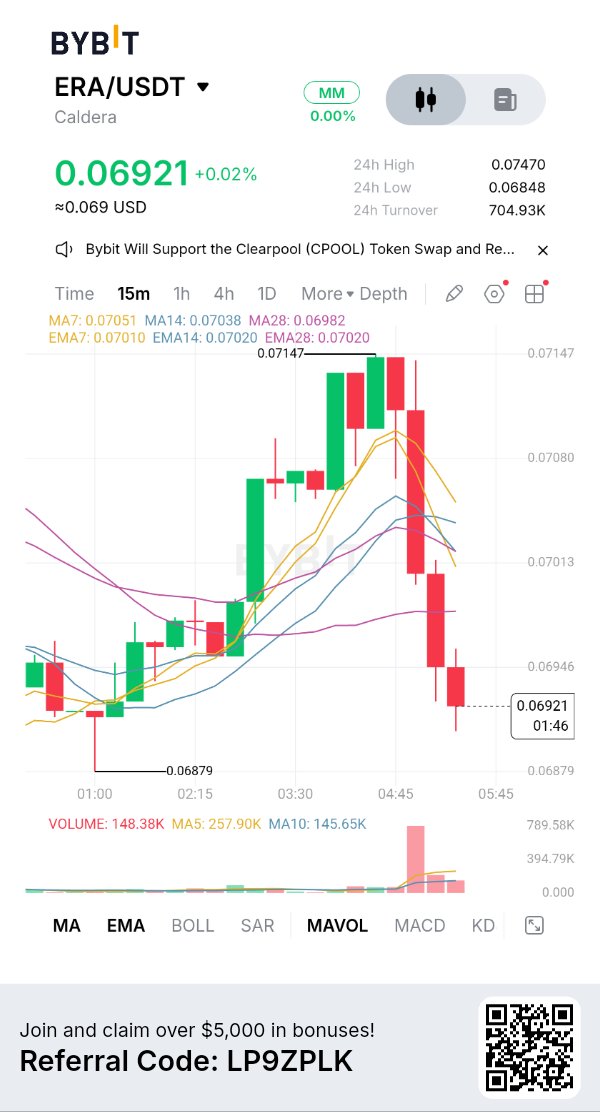
#ByXIMPACT $ERAUSDT ERA 「Rollup 論述」將於明日面臨供應衝擊。 Caldera 的 ERA 目前交易價格約為 $0.070,市值接近 1,040 萬美元,完全稀釋估值(FDV)約為 6,990 萬美元。根據 CoinGlass 數據顯示,價格區間在 $0.0666 至 $0.0743 之間,七天內下跌 7.4%,但 30 天內上漲 20.8%。整體結構依然脆弱。 Caldera 旨在解決以太坊(Ethereum)的 Rollup 分片問題。其 Rollup Engine 允許團隊使用 OP Stack、Arbitrum Orbit 和 ZK Stack 部署客製化鏈。Metalayer 的設計初衷是透過訊息傳遞、意圖(intents)和跨鏈資產移動將這些鏈連接起來。Caldera 報告稱擁有超過 60 個 Rollups、170 萬個獨立錢包和 8 億美元的鎖倉量(TVL)。這些屬於生態系統指標,並非每條鏈都能產生經常性收入的證明。 第二個訊號是採用率與代幣效用之間的差距。ERA 被設定為 Metalayer 的跨鏈 Gas 資產、質押代幣和治理工具。但去中心化中繼器、驗證者質押、共享流動性存取和費用銷毀(fee sinks)機制仍處於開發階段,並非持續性 ERA 需求的已驗證來源。除非跨 Rollup 活動能夠消耗或鎖定代幣,否則鏈數量的增加並不自動意味著 ERA 購買力的提升。 明天的解鎖是迫在眉睫的事件。Tokenomics.com 列出 11 月 17 日將有 2,640 萬枚 ERA 解鎖,按當前價格計算價值約 190 萬美元。這佔總供應量的 2.64%,以及市值的 8.4%。其中約 50.6% 分配給私募投資者,23.4% 分配給內部人士;其餘分配給社群和基金會接收者。並非所有解鎖的代幣都會被拋售,但相對於 CoinMarketCap 和 CoinGlass 報告的 1.485 億流通供應量,這一規模相當可觀。如果這些代幣全部進入市場,將相當於該流通量的約 18%。請密切關注交易所充值情況,而不僅僅是日期。 衍生品市場顯示出不尋常的設置。CoinGlass 報告顯示期貨交易量為 2,535 萬美元,對比現貨交易量 1,304 萬美元,比例約為 1.9 倍。未平倉合約(OI)為 1,106 萬美元,下降了 10.5%,而 OI 超過市值的 100% —— 相對於報告的流通量而言,槓桿比例極高。資金費率深陷負值,每八小時為 -0.13%;在 11.69 萬美元的清算額中,93% 為多頭。價格和 OI 同時下跌,暗示多頭部位正在平倉。負資金費率雖提高了逼空(squeeze)的可能性,但 150 萬美元的現貨淨流出表明買方尚未吸收這些供應。 交易地圖:$0.067–$0.0666 為即時支撐位。若失守將下探 $0.060;重新站上 $0.0744 為第一個復甦訊號。行情確認需要現貨資金流入以及解鎖後 OI 的穩定。 立場:高風險;等待供應吸收。Caldera 確實解決了 Rollup 分片問題,但 ERA 的價值捕捉仍處於發展階段,且明日的解鎖規模相對於市值而言較大。請持續觀察解鎖後的資金流向、Metalayer 的活躍使用情況,以及質押/費用效用是否真正落地。 關鍵優勢:對 ERA 的持續性跨 Rollup 需求。
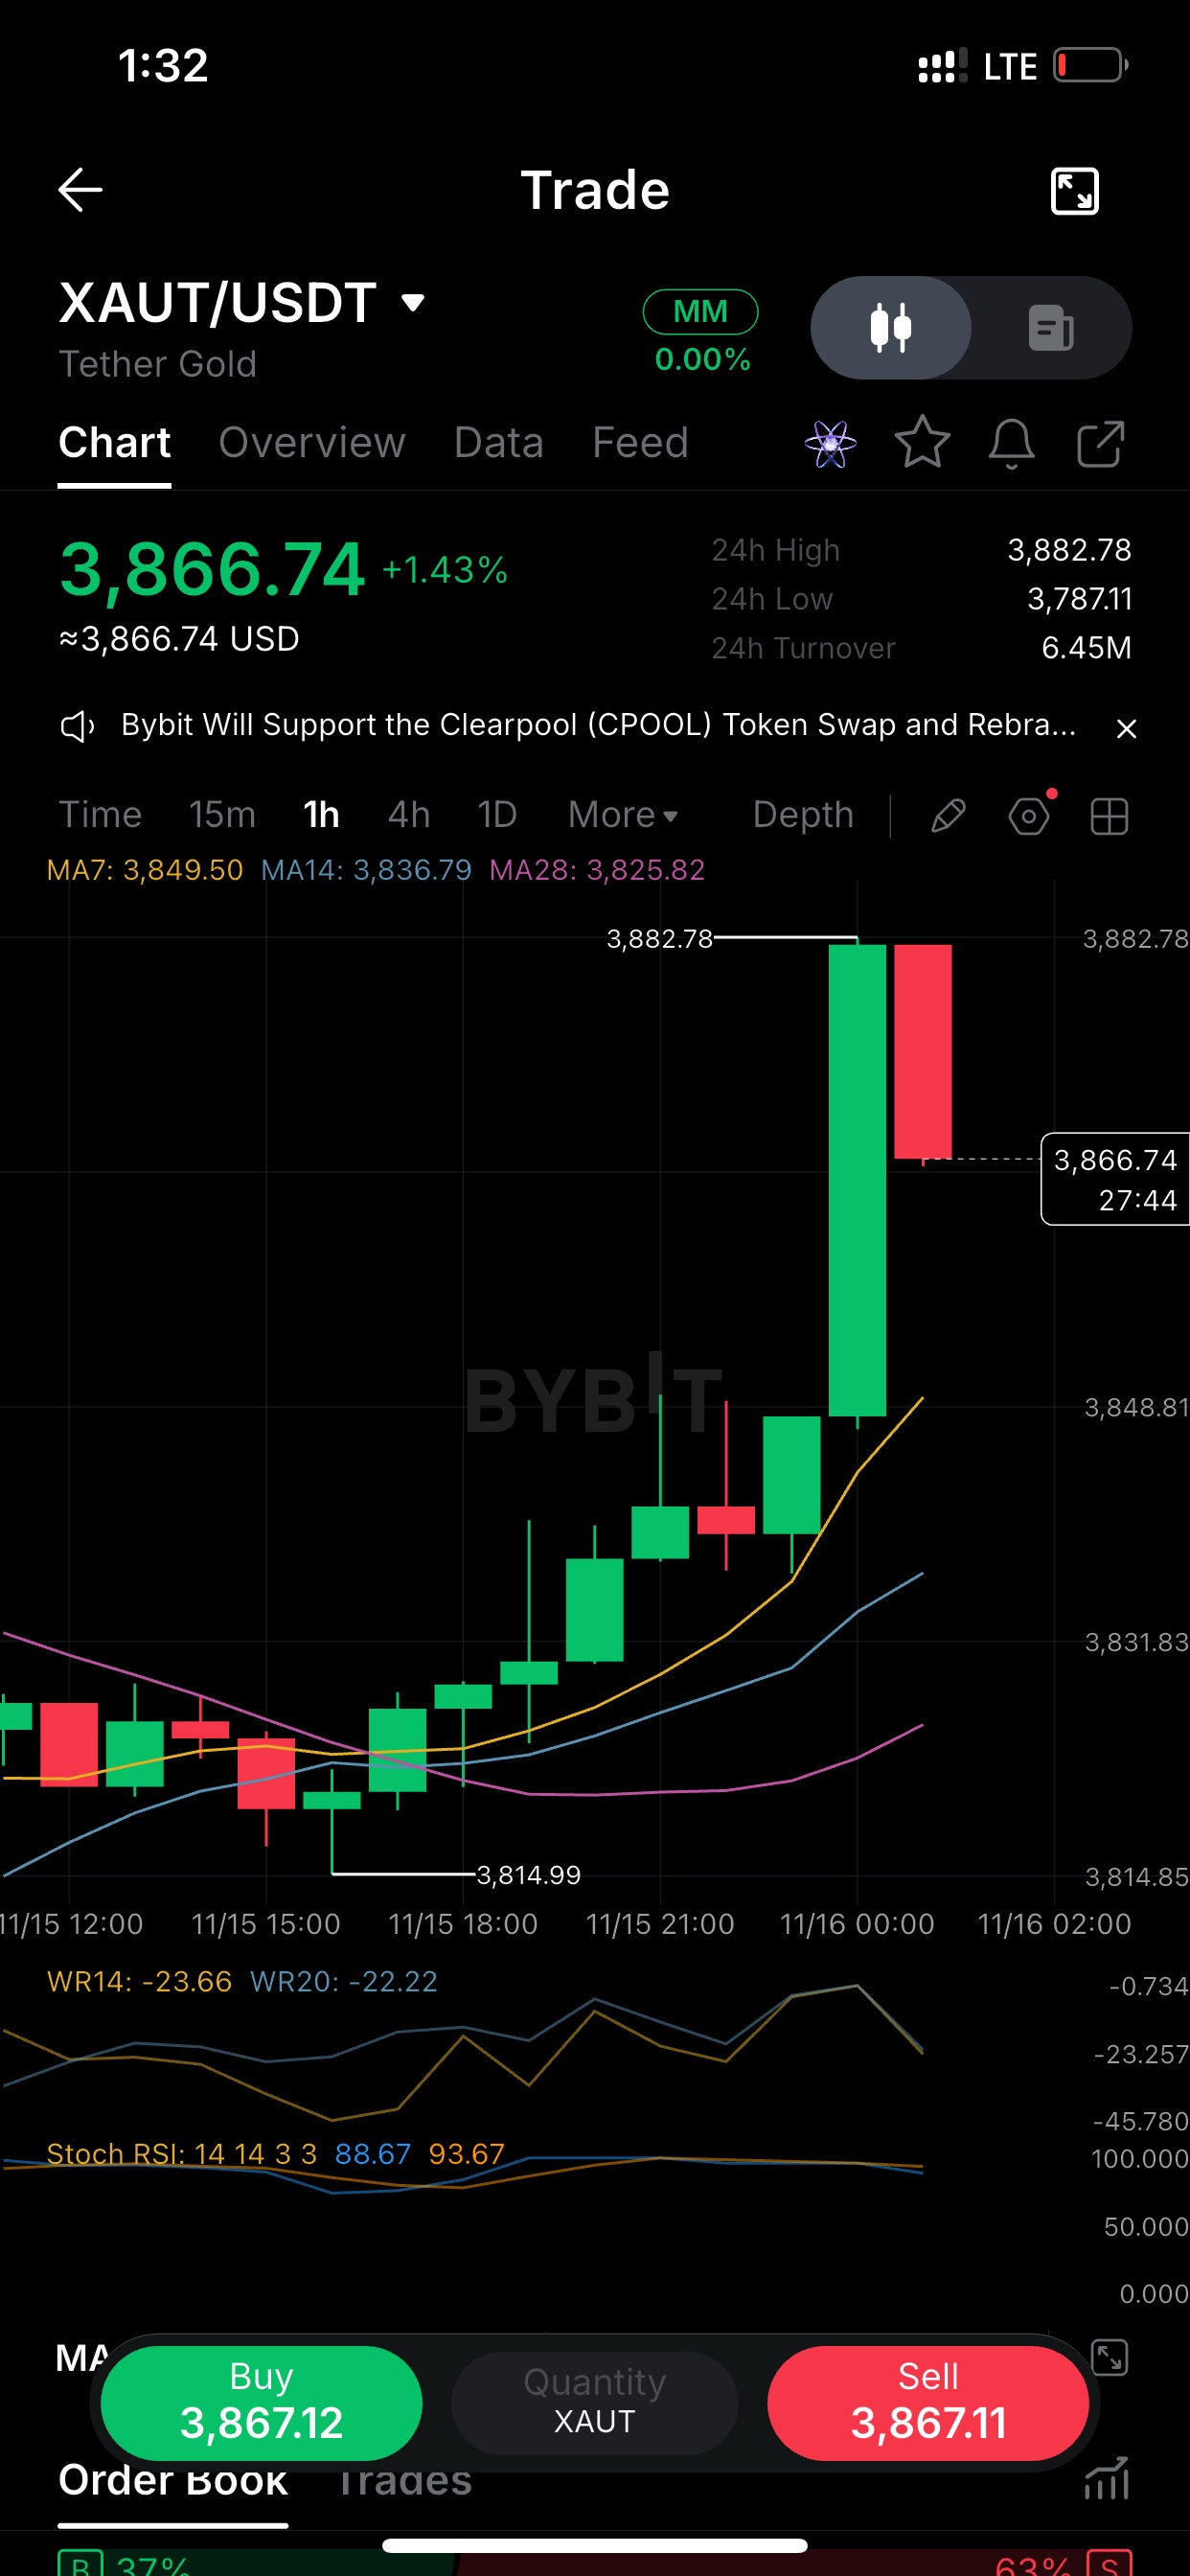
1: 結構 $XAUT 1H:3,882.78 的飆升是這波走勢的第一個真正考驗,而價格已經回吐了一些漲幅。 不過均線結構很漂亮。MA7 3,849 > MA14 3,837 > MA28 3,826,全部向上,且 3,815 的波段低點現在已經被我們遠遠甩在後頭。 我不會去追那根綠棒。靠近 MA7 的第一次回調是我會觀察反應的區間。 2: 動能解讀 XAUT 1H 的 Stoch RSI 處於 88/93。在經歷了 +1.4% 的一天後,這並不令人意外,但這確實意味著這波漲勢輕鬆的部分可能已經結束了。 威廉指標 (Williams %R) 已經從接近零的位置回落至 -23,這表示在價格還沒回調太多之前,動能已經在冷卻。 趨勢依然向上,重點是進場品質。我寧願等待,也不願買在避雷針的高點。 3: 點位 我目前在 $XAUT (1H) 上使用的點位: 壓力:3,882.78,24 小時高點,已經測試過一次並受阻 支撐:3,849 (MA7),接著是 3,837 (MA14) 失效點:跌回 3,826 下方 目前價格在 3,866,所以距離支撐還有約 17 點的空間,距離壓力約 16 點。在區間中間操作沒什麼優勢。 耐心在這裡是有回報的。等它來到關鍵點位再說。 針對你的排行榜分數的幾點說明: - 每天最多發布一篇,並分散時間發布,這樣才能避開重複內容和高頻發布的規則。XAUTUSDT - 發布時請加上 $XAUT 標籤或交易小工具,因為貼文必須包含其中之一才算數。 - 如果你想要不同的語氣(更激進或更具教育意義),告訴我,我會幫你重新調整這些內容。 ByXIMPACT

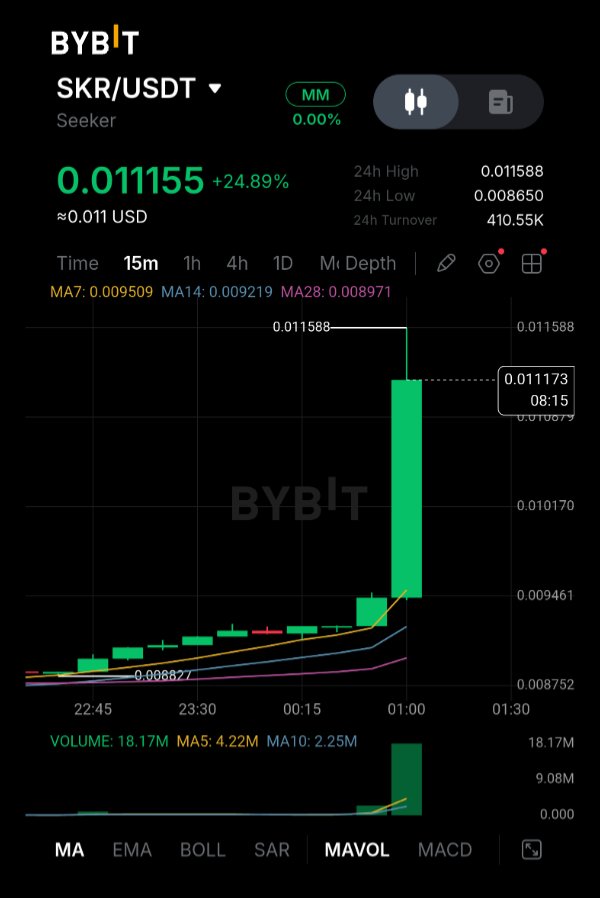
SKR 上漲了 24.89%,來到 $0.011155,而且幾乎全部漲幅都來自那根 15 分鐘線。我找不到今晚波動的任何相關新聞,所以我把它當作純粹的市場事件來看待,不去瞎猜原因。 這張圖表很不尋常。SKR 好幾個小時都以小碎步慢慢爬升,7、14 和 28 週期的移動平均線緊密堆疊在 $0.0090 到 $0.0095 之間。接著一根陽線直接從約 $0.0095 拉升至 $0.011588 的高點,現在價格維持在 $0.0112 附近。成交量也說明了同樣的情況:那一根線的成交量是 18.17M,而 5 週期平均成交量約為 4.2M,大約是平常的四倍。這是一波突然的激進買盤,但因為才剛走完一根線,還沒經過任何驗證。 背景面則好壞參半。正面來看,Solana Mobile 有一個由營收支撐的「買入並銷毀」計畫(截至 11 月 5 日已銷毀約 180 萬顆 SKR),CLOCK IN 黑客松在 11 月 10 日發放了獎金,而且 SKR 持有人數超過 5 萬。不過,銷毀量相比通膨來說微不足道:代幣第一年通膨率約 10% 並隨時間遞減,且鏈上檢查顯示鑄造權限在 10 月下旬依然活躍。SKR 目前也比 1 月份 $0.060 的歷史高點低了約 80%。它從 11 月 6 日的 $0.0130 下跌至 11 月 12 日的約 $0.0108,所以今晚這根線是在回補之前的跌幅。另外,11 月 1 日出現了一個假的 SKR 申領應用程式隨後被下架,這點對於在拉盤時隨意點擊連結的人來說值得留意。 今晚的關鍵價位是 $0.0116 的高點。如果能收在這個價位之上,將是買方守住漲勢的第一個確認訊號,下一個目標位是 11 月 6 日的 $0.0130 區域。支撐位在大約 $0.0095,也就是那根大陽線的底部和 7 週期移動平均線所在的區間。如果跌回這個價位之下,就意味著這波漲勢完全被回吐了。 我正在觀察的重點:接下來幾根線能否守在 $0.0105 之上,還是價格會滑回 $0.0095 附近。 $SKRUSDT #ByXIMPACT


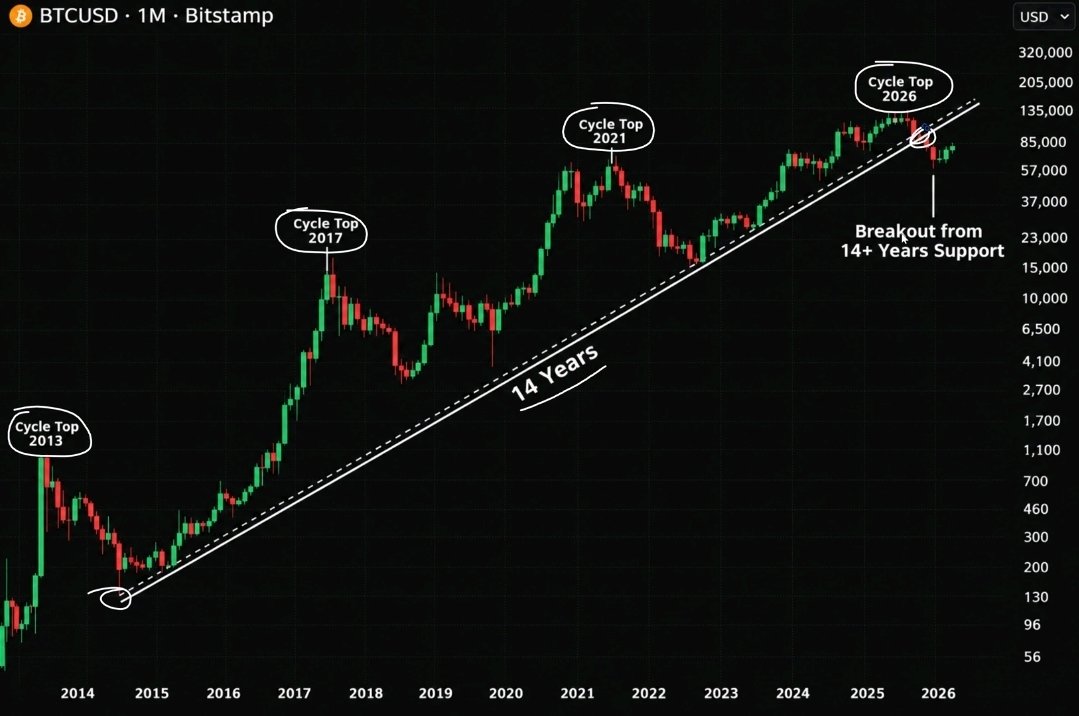
比特幣終於跌破了它 14 年來的趨勢線。 幾乎沒人意識到這件事有多嚴重。 看看歷史規律: 2013 → 週期頂部。 2017 → 週期頂部。 2021 → 週期頂部。 2026 → 又一次重大崩盤。 十多年來,這條上升趨勢線一直定義著比特幣的長期看漲結構。 現在,比特幣首次跌破了這條線。 但大家忽略了關鍵點: → 比特幣已失守 7 萬美元。 → 接近 6.8 萬美元的 200 週移動平均線已被跌破。 → 6.2 萬美元是下一個關鍵水準。 → 再往下,5.8 萬美元將重新進入視野。 這不只是一次普通的修正。 如果比特幣無法重回跌破的支撐位,我們可能正在目睹整個市場週期出現「重大」轉變。 現在只有一件事重要:月線收盤。 如果能回升,這可能會變成一場大規模的「空頭陷阱」。 但如果確認月線收盤跌破,那將是一個嚴重的警告。 同樣的比特幣,不同的市場結構。 $BTCUSDT $SPCXXUSDT #ByXIMPACT


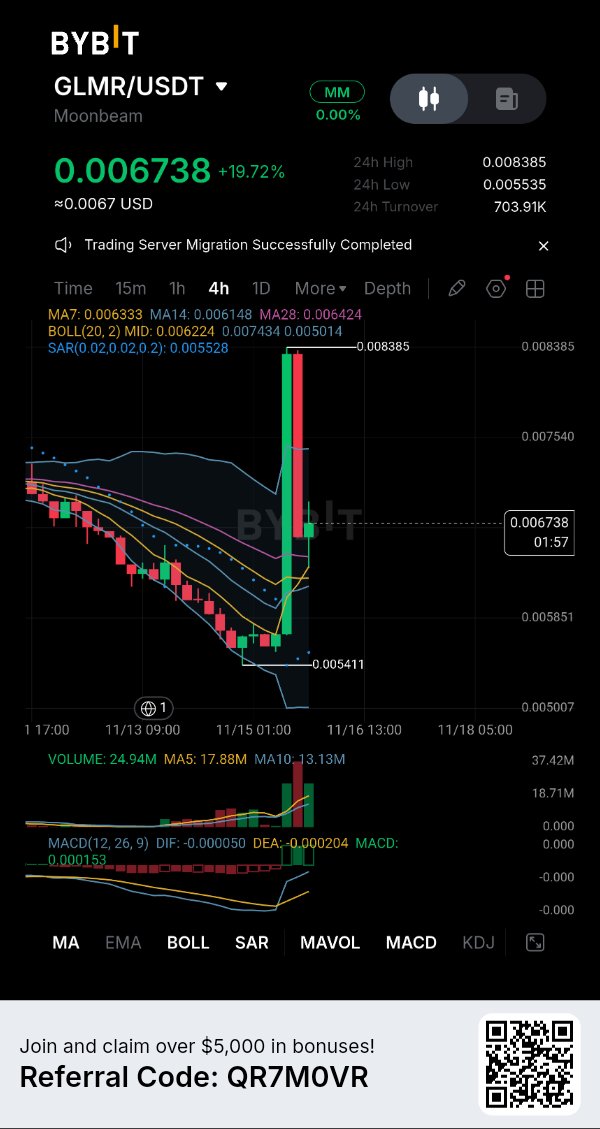
GLMR:回吐了 58% 的漲幅,目前為 0.006738
$GLMRUSDT — 價格比布林通道上軌(0.007434)低 9.4%,此前曾一度飆升至 0.008385。 看看 24 小時區間:0.005535 到 0.008385。價格回吐了約 58% 的漲幅,成交量仍是五日平均值的 1.4 倍。 目前尚無定論:這究竟是大趨勢中的回調,還是拉升後的盤整? 在大回調之後成交量依然很高。這是買方進場,還是賣方離場? 4H,Bybit 上的 GLMR/USDT,0.006738,24 小時漲幅 +19.72%。 宏觀備註 2026 年 11 月 14 日:美國現貨比特幣 ETF 連續兩週出現 23.5 億美元的淨流出(Cointelegraph)。僅供背景參考,並非此次行情的動因。 圖表顯示 價格連跌數日至 24 小時低點 0.005535。隨後拉升至 0.008385,較低點波動 51.5%,目前回調至 0.006738。飆升的高點比當前價格高出 24%。 成交量顯著。當前柱狀圖為 24.94M,是 17.88M 五日平均值的 1.4 倍,也是 13.13M 十日平均值的 1.9 倍。最高的一根柱狀圖(約 37M)出現在拉升期間。因此,回調是在成交量活躍的情況下發生的,而非悄無聲息的消退。 價格高於 MA7 (0.006333)、MA14 (0.006148) 和 MA28 (0.006424)。MACD 出現金叉:DIF -0.000050 高於 DEA -0.000204,兩者均在零軸下方。SAR 指示為 0.005528,位於價格下方。這些指標支持短期動能。它們並不證明趨勢發生了改變。它們是基於價格計算的,MA7 仍然低於 MA28,一次拉升會將所有均線拉高。 關鍵點位 支撐位:0.006333 (MA7),其次是 0.006224 (布林通道中軌)。24 小時低點為 0.005535。 阻力位:0.007434 (布林通道上軌),其次是 0.008385 (24 小時高點)。 什麼情況會增強看漲信號 價格比上軌低 9.4%,所以我現在還不要求突破。首先,我希望 4 小時收盤價能維持在 0.006333 和 0.006224 上方。然後是 4 小時收盤價突破 0.007434,且成交量高於 17.88M 的平均值。如果回調後能出現高於 0.006224 的更高低點,也會有所幫助。 擔憂 如果 4 小時收盤價低於 0.006224,價格將回到中軌下方,抹去此次反彈。飆升的高點 0.008385 已遭到拒絕,價格回吐了 58% 的漲幅。這些都是需要謹慎的原因。 什麼會改變我的看法 4 小時收盤價低於 0.006224。 教訓 拉升顯示了價格能走多遠。收盤價顯示了價格能站穩哪裡。 我的觀點 我的解讀:反彈目前仍在持續,只要 GLMR 的 4 小時收盤價保持在 0.006224 上方,我傾向於稍微看好。我可能會錯,如果 4 小時收盤價跌破 0.006224,那就證明我錯了。參考點位,不要參考我的傾向。這是一個情境分析,而非預測。這是發布時的解讀,而非保證。 對你來說,0.006224 的支撐還是突破 0.007434 的收盤價更重要? #ByXIMPACT
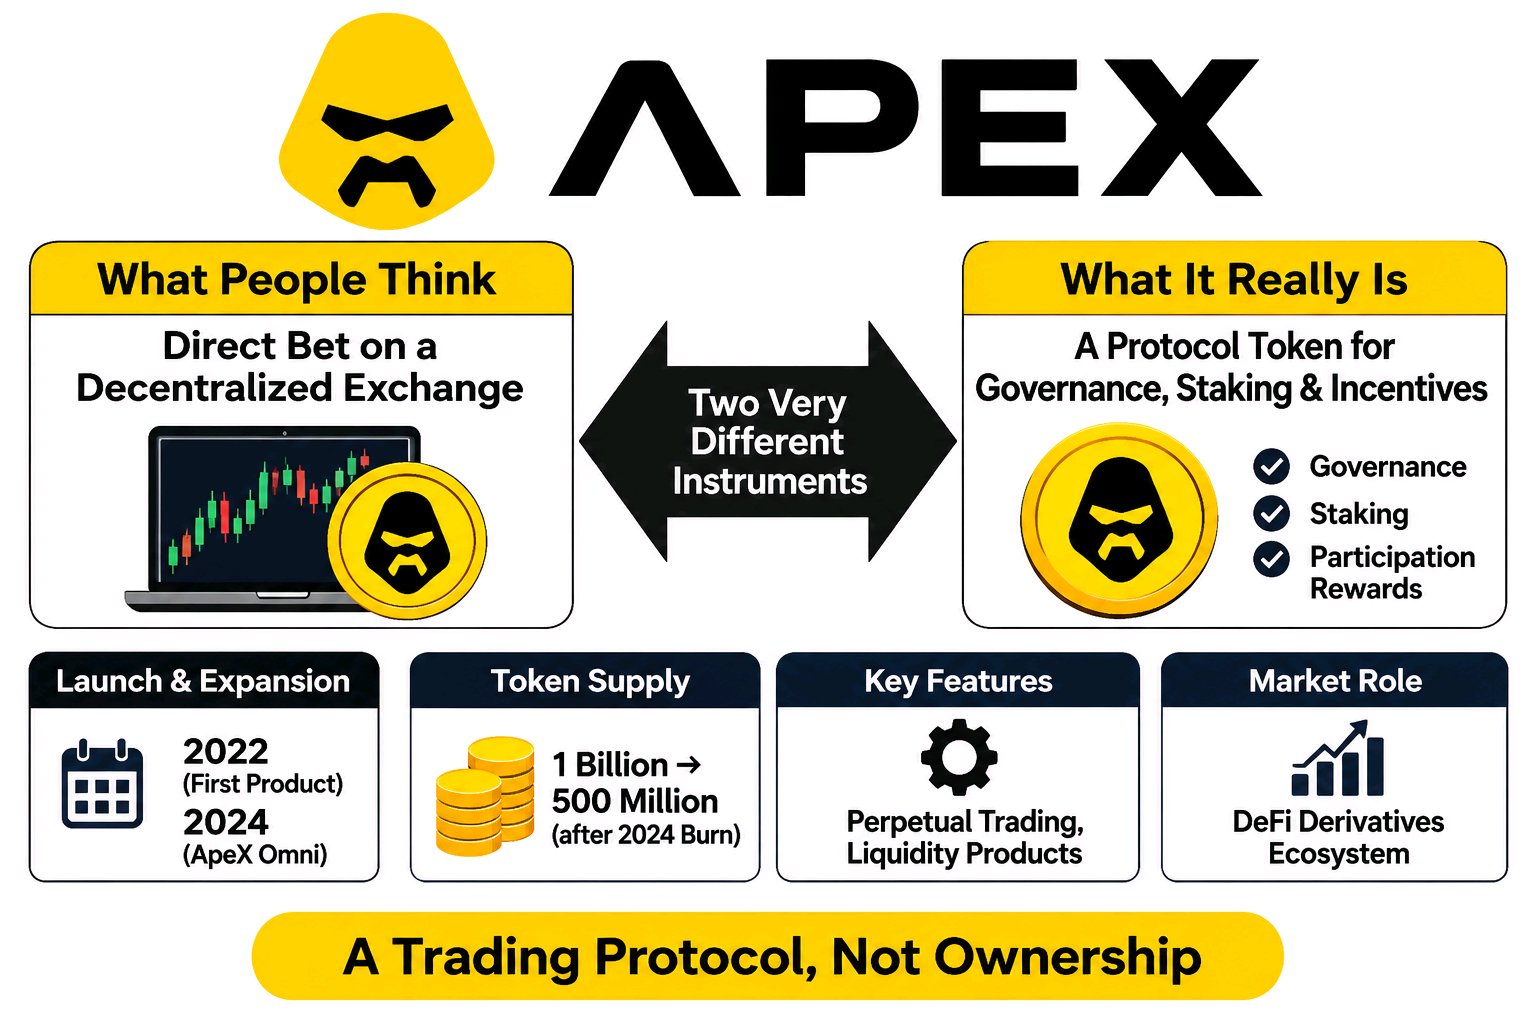
APEX 看起來可能像是對去中心化交易所的直接押注,但持有代幣並不等同於擁有該交易所或對其資產擁有索賠權。 ApeX Protocol 於 2022 年推出了其首款產品,隨後於 2024 年通過 ApeX Omni 進行了擴展。在 2024 年銷毀代幣後,其代幣供應量從 10 億枚減少至 5 億枚 APEX。 如果你只看標題,很容易忽略這一點。 APEX 是一種協議生態系統代幣,旨在用於治理、質押和參與激勵。持有者可以質押 APEX 以賺取獎勵並參與協議決策,但該代幣並不代表公司股權、對交易基礎設施的直接所有權,也不保證對交易所利潤的索賠權。其市場價格由供需、實用性和市場預期決定,而非固定的贖回價值。 規模很重要。ApeX 運營著一個包含永續合約市場、流動性產品及其他交易功能的去中心化衍生品交易生態系統。但交易所的規模並不自動轉化為每個代幣持有者相應的財務索賠權。 區別很簡單:接觸交易協議並不等於擁有該業務。APEX 代表的是對生態系統的參與,而非對其背後一切的所有權。 #ByXIMPACT $APEXUSDT

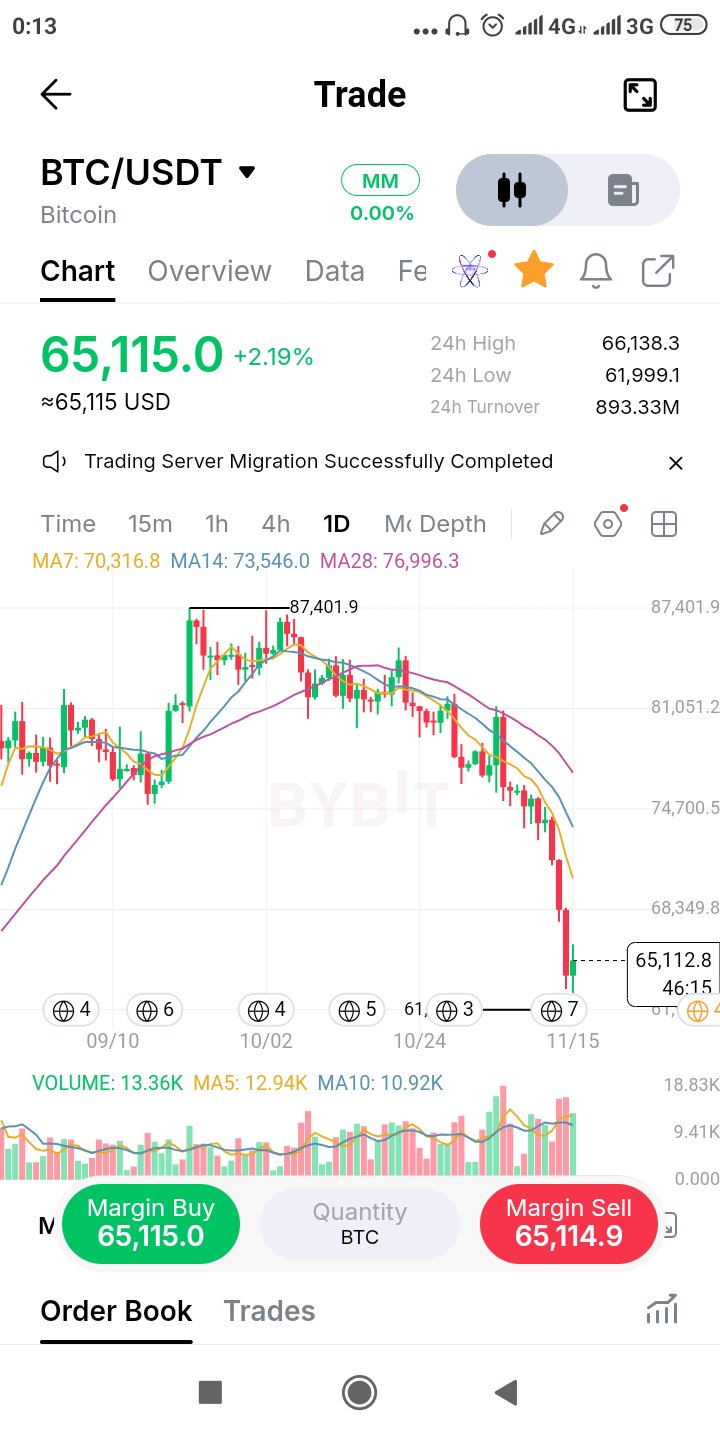
#Bitcoin #BTCUSDT #CryptoMarket #MDFUNDS
Bitcoin's $62K reaction: Is the market beginning to absorb selling pressure? Bitcoin's daily chart is showing something worth examining beyond the headline price decline. After failing to sustain its advance from the $87,401 peak, BTC entered a persistent sequence of lower highs and lower lows. The latest downside expansion pushed price towards $61,999, where buyers have started producing a visible response. BTC is now trading around $65,115, but the broader structure remains under considerable pressure. Here's the detail that interests me. Daily volume stands at 13.36K, above both its five-day average of 12.94K and ten-day average of 10.92K. That tells us participation has increased during this volatile phase. In Wyckoff terms, increased selling effort followed by a reaction from buyers can be worth monitoring. However, high volume alone does not confirm accumulation or a selling climax. The subsequent price behaviour must provide that evidence. The moving averages reinforce the caution: MA7: $70,316 MA14: $73,546 MA28: $76,996 All three remain above current price, reflecting the prevailing bearish alignment. The levels I'm watching: $61,999 — The immediate downside reference. A decisive loss could expose BTC to another leg lower. $68,350 — The first meaningful recovery hurdle visible on the chart. $70,316 — The daily MA7, which could become an important test of short-term trend recovery. What I want to see is whether BTC can establish a higher low, recover lost resistance and sustain that move with meaningful participation. Until then, calling this a confirmed bottom would be premature. My question to the market: Are we witnessing the early stages of selling-pressure exhaustion, or is this simply a temporary pause before another bearish expansion? #Bitcoin #BTCUSDT #CryptoMarket #MDFUNDS $BTCUSDT #ByXIMPACT
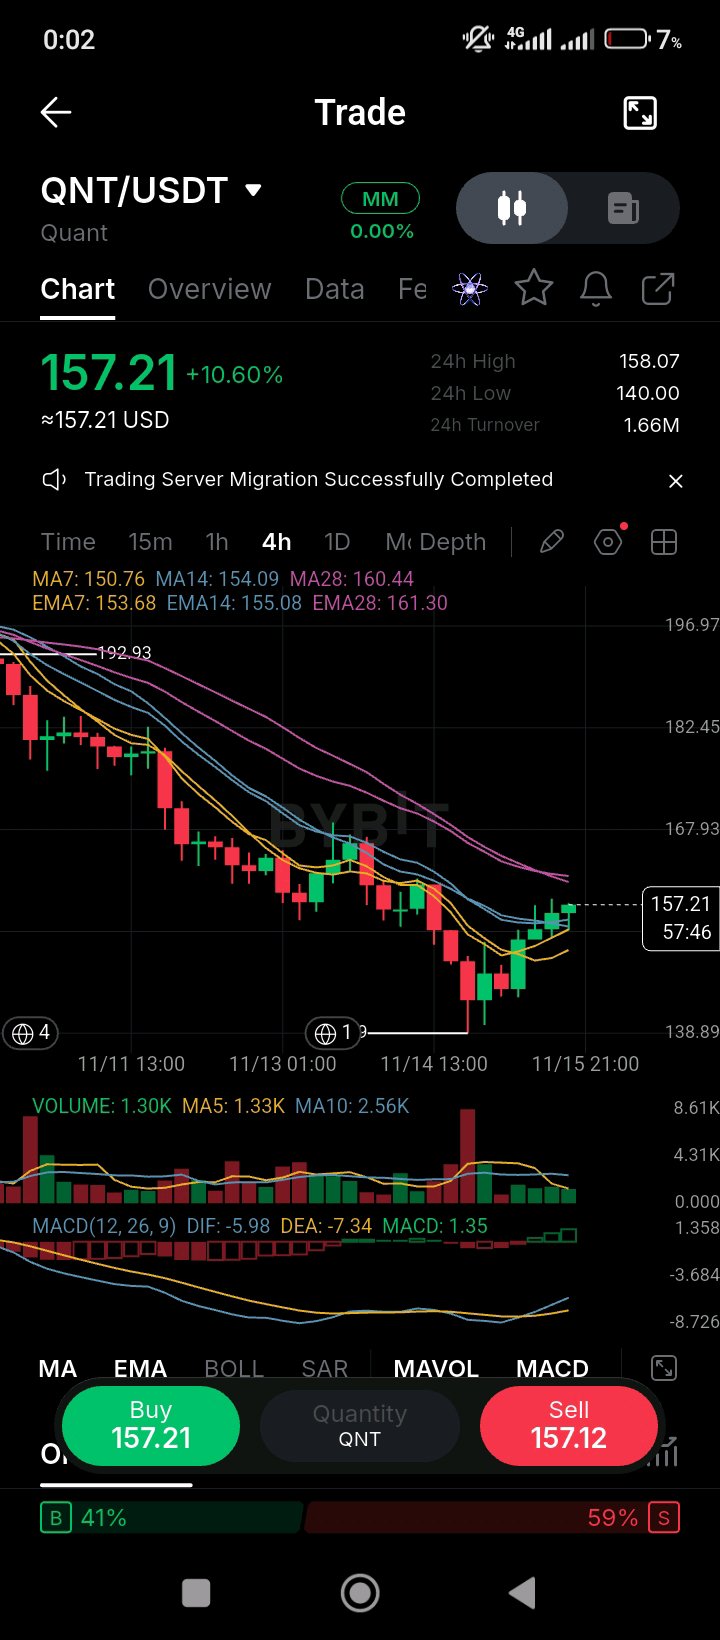
QNT bounced 10.6% off a 140 low today to 157.21, but it's still about 19% below where it traded at the start of the week and the order book is leaning sell. The November 5 move was a market-wide selloff: CoinMarketCap put QNT's 5.7% drop that day at roughly the same size as a 5.2% fall in total crypto market cap, with no Quant-specific news. The same day, COINOTAG reported a 6.9% rally on reports that The Clearing House was moving tokenized-deposit payments onto Quant's network. So the token is still trading on two different stories: the banking adoption that drove September's surge, and the risk appetite that sets the day-to-day moves. The bank pilots haven't been reversed, but they haven't produced steady buying either. On the chart, QNT is up 10.60% to 157.21, with a 24-hour range of 140.00 to 158.07. Price is above the MA7 (150.76), MA14 (154.09) and EMA7 (153.68) and EMA14 (155.08), but still under the MA28 (160.44) and EMA28 (161.30). MACD is positive (1.35), with the DIF (-5.98) crossing above the DEA (-7.34). Volume (1.30K) is roughly level with the MA5 (1.33K) and well below the MA10 (2.56K), so the bounce isn't drawing much buying. The order book is 59% sell-side. The 160.4 to 161.3 MA28 and EMA28 are the level to clear. A close above them on rising volume would bring the 165 area back into view. A loss of 140 would reopen the early-week lows. $QNTUSDT #ByXIMPACT

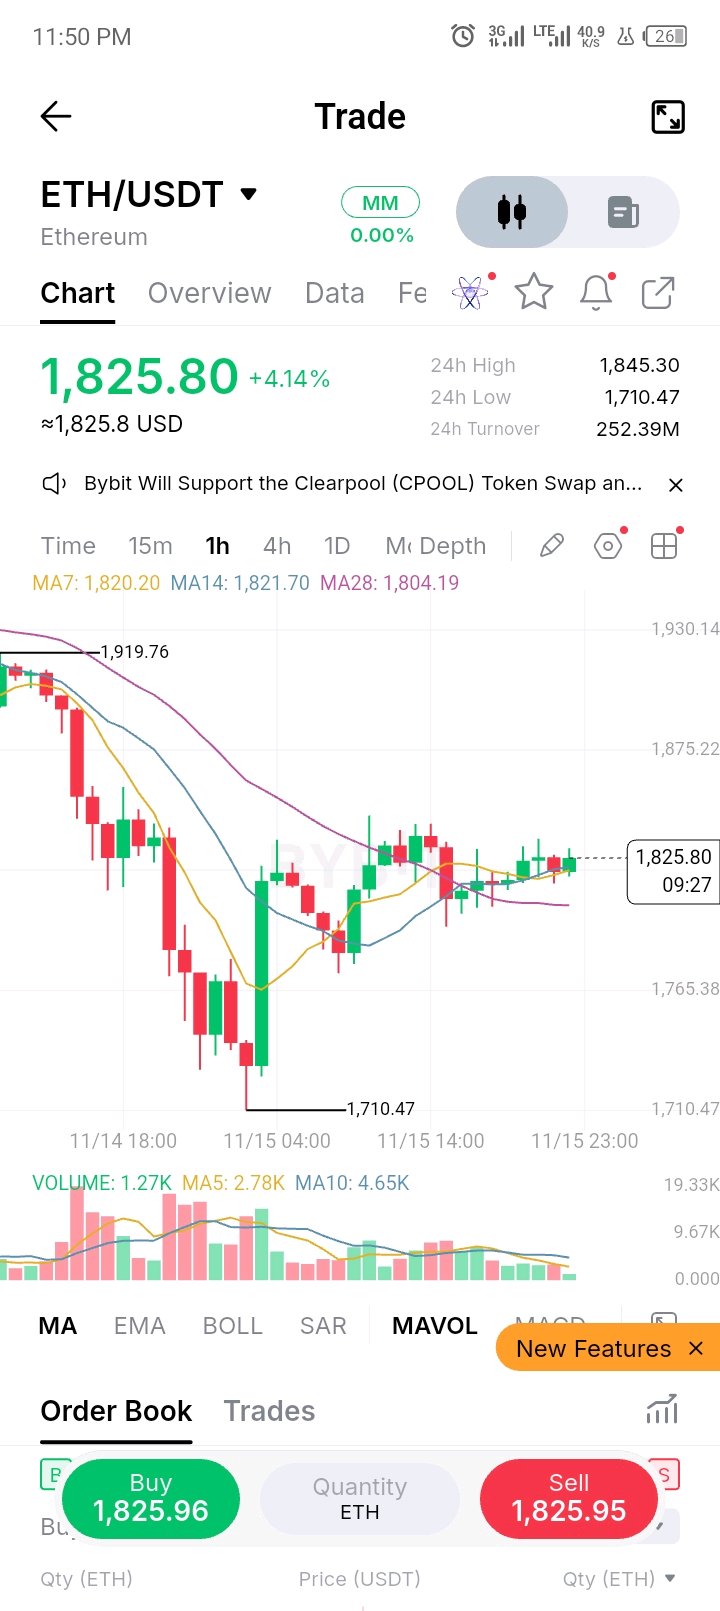
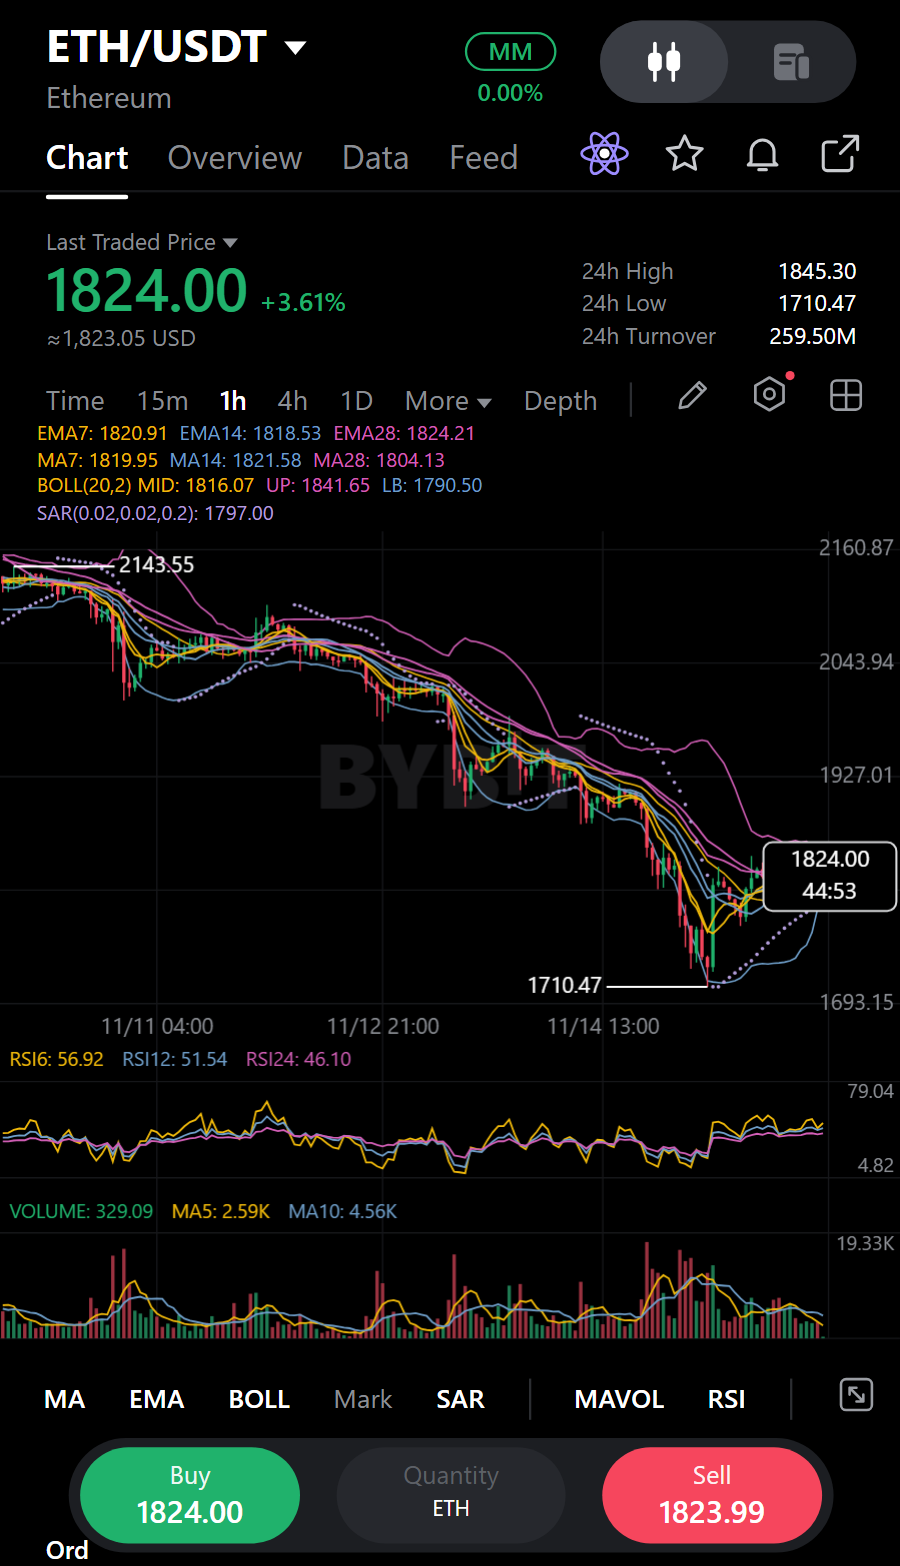
$ETHUSDT 收復了所有移動平均線,並從 1,710.47 反彈了 6.7%。底部已經出現了嗎?還是 1,845.30 是個誘多陷阱? 背景 ETH 目前距離圖表高點 2,271.33 下跌了約 20%,且已回吐了大部分從 1,710.47 上漲以來的漲幅。在觸及 1,710.47 的低點後,價格來到 1,825.80 (+4.14%),處於 7 日均線 MA7 (1,820.20) 上方 0.31%,下方還有 MA14 (1,821.70) 和 MA28 (1,804.19),均線呈多頭排列。現在是週日深夜,1 小時 K 線剛開盤約 30 分鐘。 成交額與成交量 24 小時成交額約為 2.5239 億 USDT,大約是 13.8 萬 ETH,僅在本小時 K 線上就達到 5 日均量(2.78K)的 0.46 倍和 10 日均量(4.65K)的 0.27 倍。5 日均量低於 10 日均量,顯示在反彈過程中成交量一直在萎縮,且今天的 K 線已經交易了 1.27K。之前的崩跌伴隨著真實成交量,這通常是洗盤的特徵,但並不能證明跌勢已結束。 動能 價格高於所有三條均線,且均線開始轉向上揚。上次反彈在 1,919.76 遭遇賣壓,隨後價格跌至 1,710.47 的更低點,之後又收復了 1,820.20。動能正在轉變,所以我會在採取行動前先觀察市場反應。收復並站穩才能確立反彈,但如果反彈後無法收盤在阻力位之上,那也只是曇花一現。 支撐與阻力 支撐:1,804.19 (MA28)、約 1,820.20 (MA7),然後是 1,710.47 (24 小時低點),下方暫無經過驗證的水平。 阻力:1,845.30 (24 小時高點,現在是關鍵阻力位)、約 1,875.22 (下一個水平)、1,919.76 (前高),然後是 2,271.33。 觀察點位 1,804.19 - 1,820.20 是地板,均線作為分界線。1 小時收盤價若低於 1,804.19 將打開通往 1,765 及更低點的空間。在上行方面,1,845.30 是關鍵阻力,這是 24 小時高點與整數關卡的匯合處。 交易計畫 反彈:僅在市場出現反應時(留下拒絕影線或 1 小時收盤價站穩 1,820.20 之上)於 1,804 - 1,820 區間買入,止損設在 1,795 下方。目標位為 1,845.30 和 1,875.22,從 1,812 入場計算,盈虧比約為 1.5R 和 2.5R。 續跌(做空或乾脆不做多):等待 1,845.30 的回測並遭到拒絕,止損設在 1,855 上方。目標位為 1,820.20 和 1,804.19,從 1,845 入場計算,盈虧比約為 1.5R 和 2.2R。 我不打算在 +4.14% 的 K 線中途追買 1,825.80。止損位必須設在 1,804.19 以下,而第一個阻力位 1,845.30 僅高出約 19,盈虧比不到 1R。 風險提示 ETH 在過去 24 小時內波動約 7.9%(1,710.47 至 1,845.30),週末流動性較差,影線可能會掃過任何點位,因此倉位管理比進場點更重要。超賣讀數可能持續維持在超賣狀態。均線是區間而非精確的線。點位來自於我個人的圖表分析。非財務建議。 底部已現,還是 1,845.30 是個誘多陷阱?市場在 1,845.30 的反應將給出答案。 僅供教育參考,非財務建議。 $ETHUSDT#ByXIMPACT
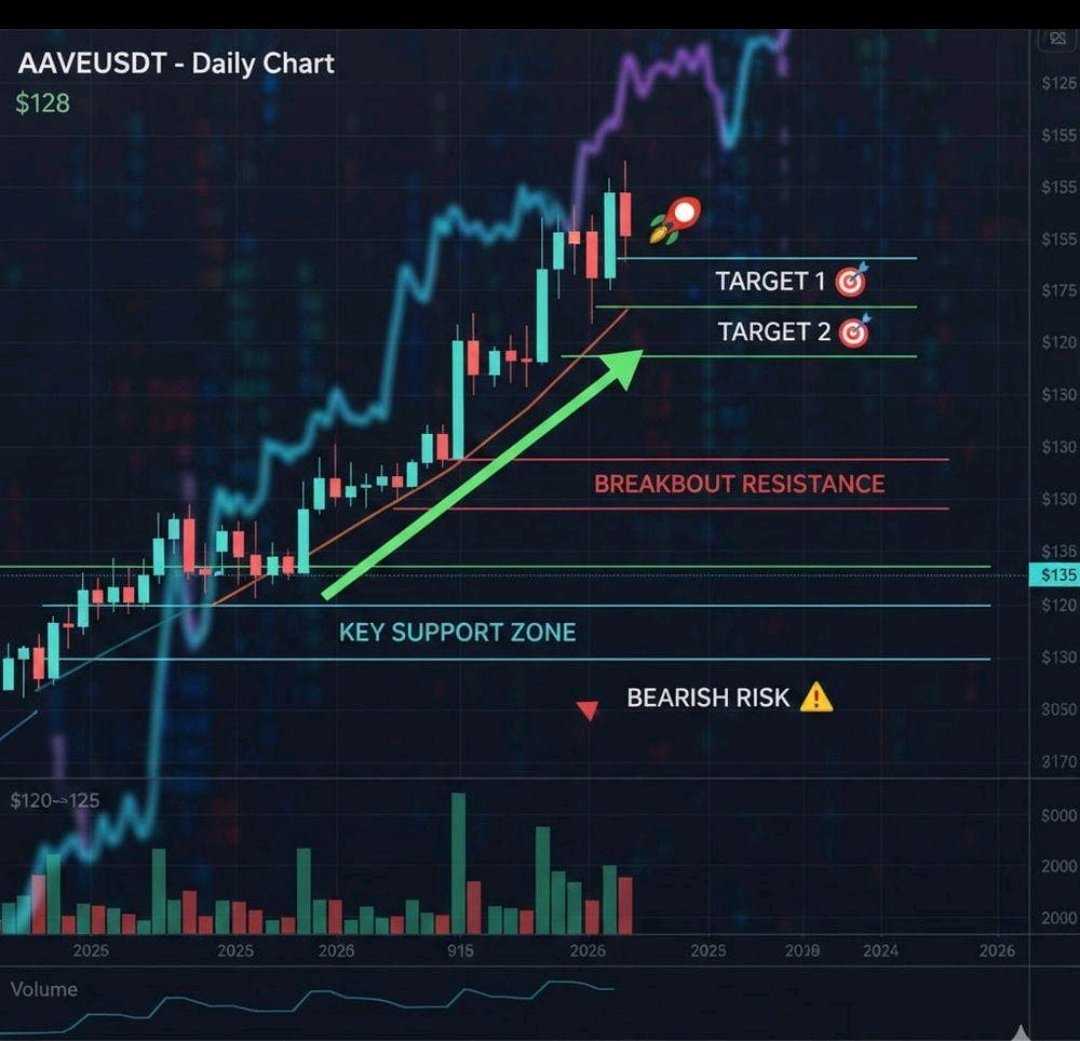
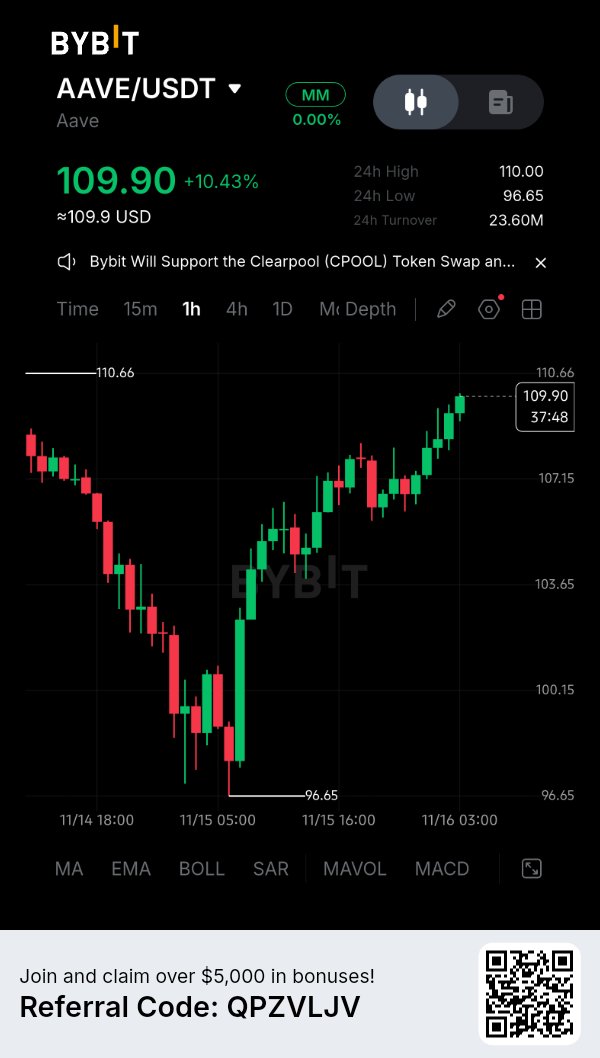
🚀 $AAVEUSDT 技術分析 – 多頭正醞釀重大突破! AAVE 在從 $96.65 的支撐區回升後,展現出強勁的買盤壓力。 目前價格在 $109.90 附近交易,漲幅達 10.43%。1 小時圖表顯示出清晰的復甦結構,買方正逐步將價格推向 $110 的阻力區。 但目前最大的疑問是,多頭能否成功突破這一水平。 讓我們來分析一下關鍵的交易點位。 📊 當前市場概況 交易對:AAVE/USDT 現價:$109.90 24 小時漲跌幅:+10.43% 24 小時最高價:$110.00 24 小時最低價:$96.65 24 小時成交額:$2,360 萬美元 時間週期:1 小時 🟢 重要支撐位 $107.15 – $106.50:即時支撐與潛在回調區。 $105.00 – $104.50:次要支撐區。 $103.65 – $102.00:重要需求區。 $100.15 – $96.65:主要下行支撐區。 🔴 重要阻力位 $110.00 – $110.66:即時阻力與突破區。 $111.50 – $112.00:下一個潛在上漲目標。 $113.00:若看漲動能持續,心理價位目標。 📈 做多 (LONG) 交易策略 策略 1 – 回調進場 進場區間:$107.50 – $108.50 止損位:$106.50 以下 止盈 1:$110.00 止盈 2:$111.50 止盈 3:$113.00 進場前請等待看漲反轉 K 線及確認訊號。 策略 2 – 突破進場 進場點:1 小時 K 線確認收於 $110.70 上方後。 回踩區間:$110.00 – $110.70 止損位:回踩結構確認點以下。 止盈 1:$111.50 止盈 2:$112.00 止盈 3:$113.00 若突破時伴隨強勁成交量,該設置的勝率會更高。 📉 做空 (SHORT) 交易策略 若 AAVE 無法突破 $110.00 – $110.66 的阻力區並形成強勁的看跌反轉訊號,則可能會出現做空機會。 進場區間:在確認看跌後,於 $110.00 – $110.50 進場。 止損位:$111.00 以上 止盈 1:$108.50 止盈 2:$107.50 止盈 3:$106.50 若買方成功突破並站穩阻力位,請避免做空。 🧠 專業交易小撇步 1. 密切關注 $110.66 附近的 1 小時 K 線收盤價。 2. 利用交易量確認突破力道。 3. 避免直接在阻力位進場。 4. 突破交易建議等待回踩後再操作。 5. 將風險控制在交易資本的 0.5% – 1% 以內。 6. 務必設置止損,並考慮分批止盈。 🎯 我的市場展望 AAVE 在從 $96.65 強勁反彈後,短期內呈現看漲結構。 $110.00 – $110.66 區間是目前最關鍵的觀察區域。 確認突破後,可能會開啟邁向 $111.50 甚至 $113.00 的路徑。 然而,若在此阻力位遭到拒絕,則可能觸發回調至 $107.15 或 $105.00。 我的策略很簡單:我傾向於等待確認,而不是追逐目前的綠色 K 線。 交易要有計畫。保護好您的資本。讓市場來確認您的策略設置。 您的預測是什麼呢? AAVE 會突破 $110.66 並向 $113 前進,還是賣方會守住這個阻力位? 歡迎在下方分享您的看法。 #ByXIMPACT #WSOT曬出你的AI交易即可贏取10USDT #黃仁勳離任考驗Nvidia的AI領導地位 #美國PPI測試「更高更久」交易策略 #美國通膨升溫,升息押注升高 $AAVEUSDC
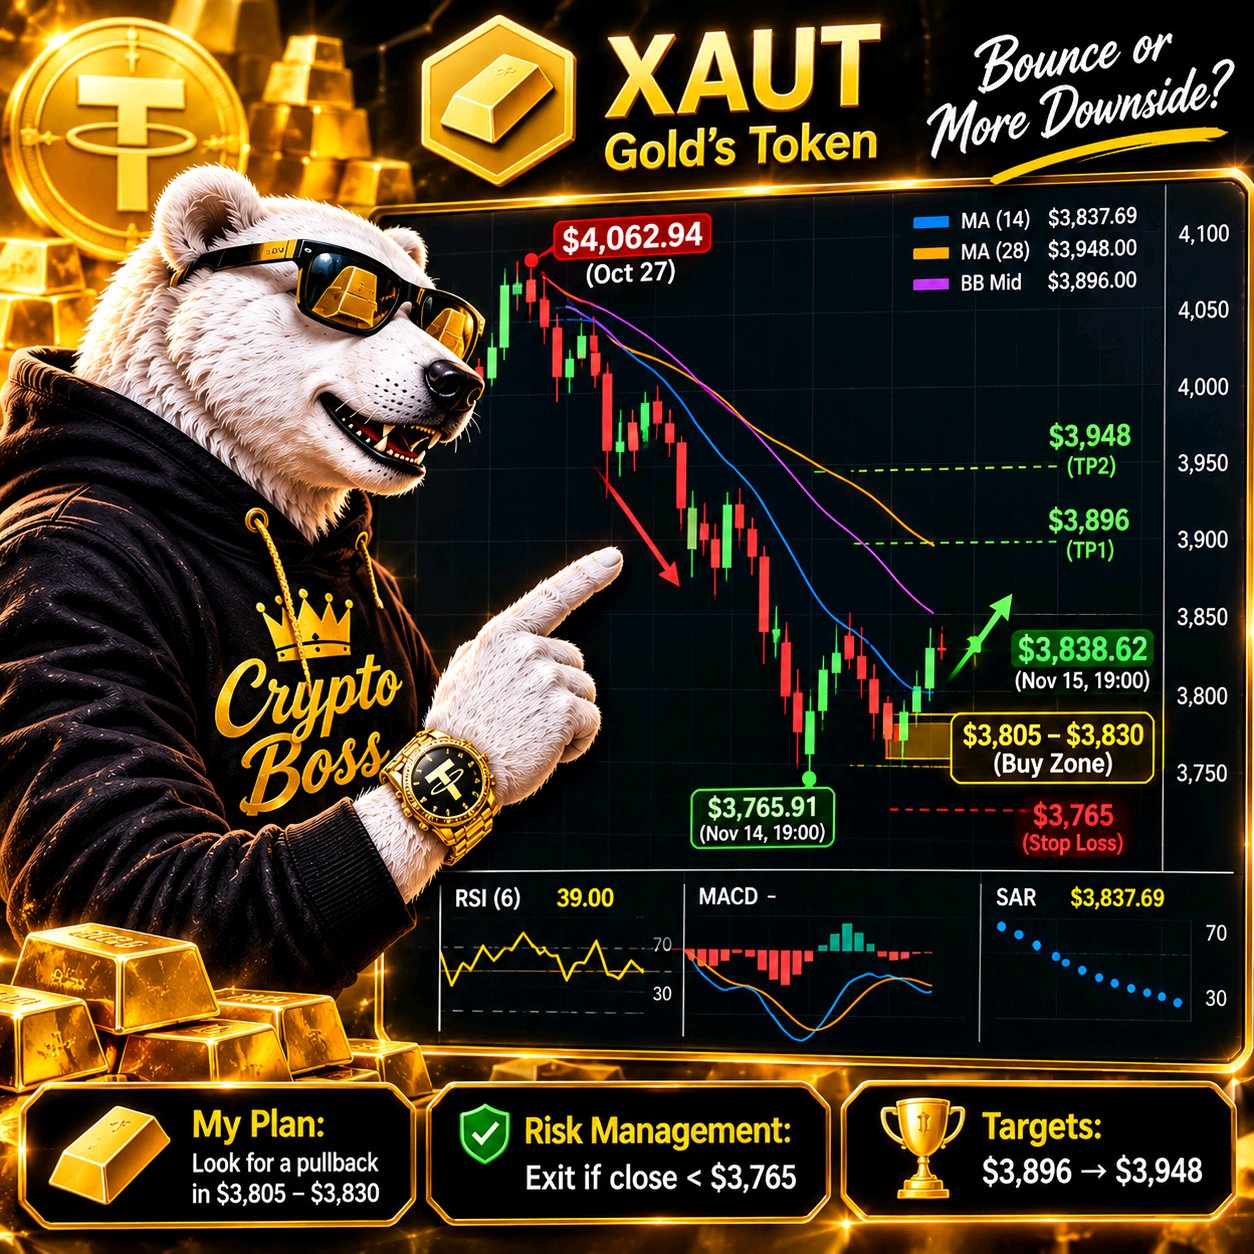
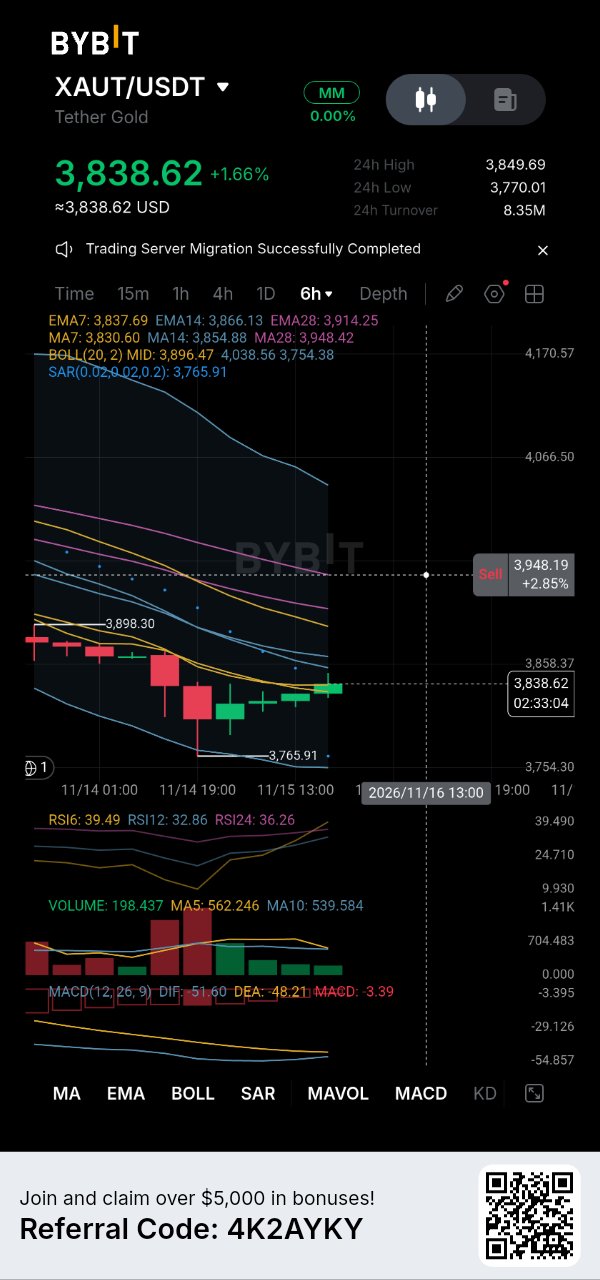
Tether Gold 目前交易價格接近 3,838.62 美元,在 6 小時線圖跌至 3,765.91 美元附近後,上漲了 1.6%。 最新的 K 線顯示買方正試圖穩定價格。XAUT 已回升至 3,837.69 美元的 EMA7 和 3,830.60 美元的 MA7 之上。這雖是好轉跡象,但我不會將短期的穩定與確認的趨勢反轉混為一談。 上方仍存在較大的阻力。EMA14 位於 3,866.13 美元,隨後是 3,896.47 美元的布林通道中線。若能持續突破這些水平,將提供更強有力的證據,表明買方正在重掌控制權。 動能指標仍需保持耐心。RSI6 為 39.49,RSI12 為 32.86,RSI24 為 36.26。MACD 仍維持負值,DIF 為 -51.60,DEA 為 -48.21。賣壓或許正在減輕,但看漲動能尚未確立。 成交量則增添了另一層謹慎態度:成交量為 198.4,相較於 MA5 的 562.2 和 MA10 的 539.6。此次反彈的市場參與度相對有限。 我目前的關注點在於 XAUT 能否守住 3,830 美元並收復 3,866 美元。如果做到了,3,896 美元將成為下一個重要的測試點。若未能守住短期均線,可能會讓 3,800 美元以及先前 3,766 美元附近的低點再次成為焦點。 我傾向於等待確認,而不是過度看重一次小幅的反彈。 這究竟是更強勁復甦的開始,還是再次測試低點前的短暫停歇? 非投資建議。 $XAUTUSDT $BTCUSDT #ByXIMPACT

7% 的反彈看起來很有趣,但買方仍面臨關鍵的阻力區。 Chainlink 正顯示出強勁的短期反彈,LINK 上漲了 7.12%,並重回 4 小時 MA7 之上。然而,引起我注意的是,這次反彈是在一個更廣泛的下跌結構中進行的。 有趣的是,買方已成功將價格推離近期 8.62 美元的低點,但他們現在正在接近一個多條移動平均線可能挑戰反彈的區域。我想了解這是一次真正趨勢反轉的開始,還是僅僅是賣方回歸前的超跌反彈。 市場概況 LINK 目前交易價格約為 9.277 美元,此前從近期跌向 8.621 美元區域的走勢中反彈。 4 小時圖顯示,先前的下跌結構尚未完全消失。儘管價格已回升至 MA7 之上,但仍低於 MA14 和 MA28。 這創造了一個有趣的技術局勢。 買方表現出重拾的強勢,但他們仍需要克服 9.35–9.73 美元的阻力區,我才會認為這次更廣泛的反彈令人信服。 對我來說,該區域附近的下一步反應比目前的 7% 漲幅更重要。 數據與證據 以下是所附 Bybit 截圖中的重要數據: 當前價格:9.277 美元 24 小時變化:+7.12% 24 小時高點:9.381 美元 24 小時低點:8.621 美元 24 小時成交額:1,472 萬美元 先前可見高點:10.844 美元 移動平均線揭示了短期動能與更廣泛趨勢之間的重要差異: MA7:9.141 美元 MA14:9.355 美元 MA28:9.731 美元 LINK 已收復 MA7,這表明短期買盤壓力正在改善。 然而,MA14 和 MA28 仍高於當前價格。這意味著更廣泛的 4 小時結構在建立看漲反轉之前仍需確認。 交易量提供了另一個重要細節: 當前成交量:87.06K 成交量 MA5:211.15K 成交量 MA10:298.30K 儘管價格上漲了 7.12%,但當前顯示的成交量仍低於這兩條平均線。 這是我不會忽略的一點。價格正在反彈,但參與度尚未達到近期的平均水平。更強勁的成交量擴張將使反彈更具說服力。 我的看法 我在 LINK 當前的結構中看到了兩個重要水平。 第一個是 9.355 美元,這是 MA14 的位置。第二個是 9.731 美元,這是 MA28 形成另一個潛在阻力的地方。 如果買方收復這兩個水平並將價格維持在其上方,目前的復甦可能會發展成更廣泛的趨勢反轉。 然而,如果 LINK 在此阻力區掙扎並出現確認的 4 小時看跌拒絕訊號,則有可能再次跌向 9.14 美元,甚至可能跌至 8.62 美元。 我的偏好是在 7% 的漲幅後避免追高。在決定方向之前,我寧願觀察價格在移動平均線附近的表現。 交易設置 LINK — 空頭方案 (SHORT) 看跌觸發:在 9.35–9.73 美元的阻力區遭到拒絕,隨後出現確認的 4 小時看跌 K 線。 進場區間:9.40–9.65 美元 止損:9.85 美元 TP1:9.14 美元 TP2:8.85 美元 TP3:8.62 美元 看漲失效:4 小時線持續站穩在 9.85 美元上方,削弱了看跌延續的設置。 下行目標是根據可見圖表結構的估計,TP3 位於先前 8.621 美元的低點附近。 潛在下行至 TP3:約 8%–10%。 估計盈虧比:約 2.5:1,具體取決於進場和執行情況。 此設置是有條件的。在考慮啟動空頭部位之前,我會等待實際的拒絕訊號。 最終觀點 Chainlink 目前的有趣之處在於短期動能改善與尚未恢復的廣泛趨勢之間的對比。 7.12% 的漲幅表明買方已經回歸,但移動平均線顯示他們仍有重要的阻力需要克服。 對我來說,9.35–9.73 美元的區域將決定這次反彈是否有足夠的實力來挑戰現有的看跌結構。 如果買方以令人信服的成交量收復該區域,前景就會改變。如果賣方守住該區域,近期的反彈可能會成為更廣泛下跌趨勢中的另一個更低高點。 下一個重要訊號將來自 LINK 在遇到此阻力區時的反應。 $LINKUSDT #ByXIMPACT


⚠️ $ETH:機構資金正在撤出 ETF,但交易所儲備也在下降——究竟發生了什麼? 以太坊目前面臨嚴峻的市場環境,但情況並非僅僅是價格下跌那麼簡單。 截至 11 月 15 日,在經歷了顯著的拋售壓力後,ETH 的交易價格在 1,800 美元附近徘徊。 最耐人尋味的是機構基金流出與交易所儲備下降之間的對比。 讓我們跳脫 K 線,審視更大的格局。 🔴 1. 市場正承受壓力 以太坊正與比特幣及整個加密貨幣市場一同走低。 多種因素導致了這種疲軟: - 對利率上升的預期。 - 市場範圍內的拋售壓力。 - 衍生品市場的強制清算。 - 現貨 ETH ETF 的機構需求疲軟。 這表明目前的下跌未必是由以太坊本身的新基本面問題所引起的。 📉 2. 機構流向:一個警示訊號 一個重要的發展是,在 11 月 9 日至 11 月 13 日期間,美國現貨以太坊 ETF 錄得約 3.989 億美元的淨流出。 這顯示機構投資產品在那段期間承受了顯著的拋售壓力。 然而,ETF 的資金流出不應被自動解讀為對以太坊的長期信心已蕩然無存的證據。 它們只是更宏大市場圖景的一部分。 📊 3. 交易所儲備悖論 這是另一個值得關注的動態。 據報導,幣安(Binance)上的以太坊儲備已降至約 290 萬枚 ETH,達到近五年來的最低水平。 這造成了一種有趣的對比: - ETF 的流出顯示機構投資需求承受壓力。 - 交易所儲備的下降顯示交易所標籤錢包中持有的 ETH 變少了。 這是否反映了更長期的提幣行為以及交易所即時可用供應量的減少? 有可能。 但交易所提幣並不自動證明是積累或新買盤。 這正是為什麼鏈上數據需要謹慎解讀的原因。 ⚡ 4. 關鍵的技術點位 根據 11 月 15 日的市場分析,我正在監控以下關鍵區域: 支撐區間:1,790–1,814 美元 守住這一區域可能會讓 ETH 嘗試反彈。 首個反彈阻力:1,838–1,868 美元 若能持續收復此區間,短期技術前景將有所改善。 關鍵下行參考點:1,712 美元 若跌破此支撐結構,可能會讓 ETH 面臨另一次重大考驗。 這些是監控點位,而非保證達到的目標。 🧠 5. 什麼會改變我的市場觀點? 如果出現以下情況,我會變得更樂觀: - ETH 維持在 1,790–1,814 美元的支撐位。 - 價格收復 1,838–1,868 美元。 - 現貨買入活動改善。 - ETF 的流出開始趨於穩定。 - 衍生品倉位變得更健康。 另一方面,若持續跌破支撐位,且伴隨著拋售壓力的增加,將使短期復甦的情境失效。 🎯 6. 自律的方法 與其因為 ETH 下跌就盲目買入,我會將潛在的曝險分為幾個階段來觀察: 1. 觀察支撐是否守住,以及拋售壓力是否減弱。 2. 尋求價格回升與參與度增強的確認訊號。 3. 僅在阻力位被收復後,才評估增加曝險。 總曝險額應由預設的風險限額決定。 如果支撐失效,正確的反應是重新評估論點,而不是自動增加曝險。 🔥 我的大局觀 以太坊目前面臨兩股相互抗衡的力量。 一方面,機構 ETF 的流出和全市場的清算正在造成壓力。 另一方面,交易所儲備的下降引發了關於 ETH 供應移動與可用性的有趣問題。 這兩項發展都不足以單獨決定下一個市場方向。 真正的確認必須來自價格行為、流動性、機構資金流向以及持續的需求。 我相信接下來的幾個交易時段對於判斷以太坊能否企穩,或是賣方是否還有進一步打壓的空間至關重要。 你對現在的 ETH 有什麼解讀? 我們目睹的是暫時由流動性驅動的修正,還是市場正在進入更深度的看跌階段? 讓我們討論數據,而不僅僅是預測。 $ETHUSDT $ETHUSDC #ByXIMPACT


NVIDIA 董事會正在體會更換創始人有多困難,而加密貨幣領域對此場景並不陌生。 本週,NVIDIA 的傳奇故事出現了令人驚訝的轉折。在關於黃仁勳(Jensen Huang)因婚外情醜聞辭職的報導傳出後,一份要求他回歸的請願書連署人數迅速攀升至近 15 萬人。包括伊隆·馬斯克(Elon Musk)、多位科技公司執行長,以及兩位持有價值超過 20 億美元股票的大型投資者,都公開支持他回歸,或是至少要求董事會重新考慮。這些連署數據為自報,董事會尚未回應,且股東對於誰來經營公司並沒有直接投票權,因此這僅僅是施壓,而非正式程序。在財報即將發布之際,NVIDIA 正同時面臨訴訟與尋找執行長的問題。 之所以與我們相關,是因為這涉及關鍵人物風險(key person problem)。NVIDIA 的股價因消息傳出而重挫,因為市場已經將「AI 故事」與單一領導者的連結程度納入了定價。加密貨幣領域對這種感覺非常熟悉。MicroStrategy 倚重 Michael Saylor,幣安(Binance)曾倚重趙長鵬(CZ),每當創始人動搖,相關的代幣或股票也會隨之震盪。 對於交易員來說,這堂課在於治理風險就是實質風險。董事會的行動速度可能超乎預期,公開宣傳活動也可能在一夜之間扭轉輿論;當市場熱門主題的領軍人物突然陷入質疑,風險資產往往會受到衝擊,包括目前交易走勢與科技股相近的加密貨幣。 從本週正面消息來看,Coinbase 已獲得其國家信託銀行執照的最終批准,將其機構託管業務納入單一聯邦監管機構旗下;德意志銀行(Deutsche Bank)也在歐洲推進其自身的託管服務。儘管市場價格下跌,這些進展仍在持續累積,這也是為什麼即便短期前景看淡,我仍對長期佈局保持樂觀的原因。 我正密切關注 NVIDIA 的財報以及董事會的下一步行動,因為一個混亂的解決方案將使 AI 和加密貨幣的風險情緒持續脆弱。 你認為董事會應該讓黃仁勳回歸還是繼續前進?失去創始人對公司代幣或股票的打擊,是否比人們承認的還要嚴重? ByXIMPACT

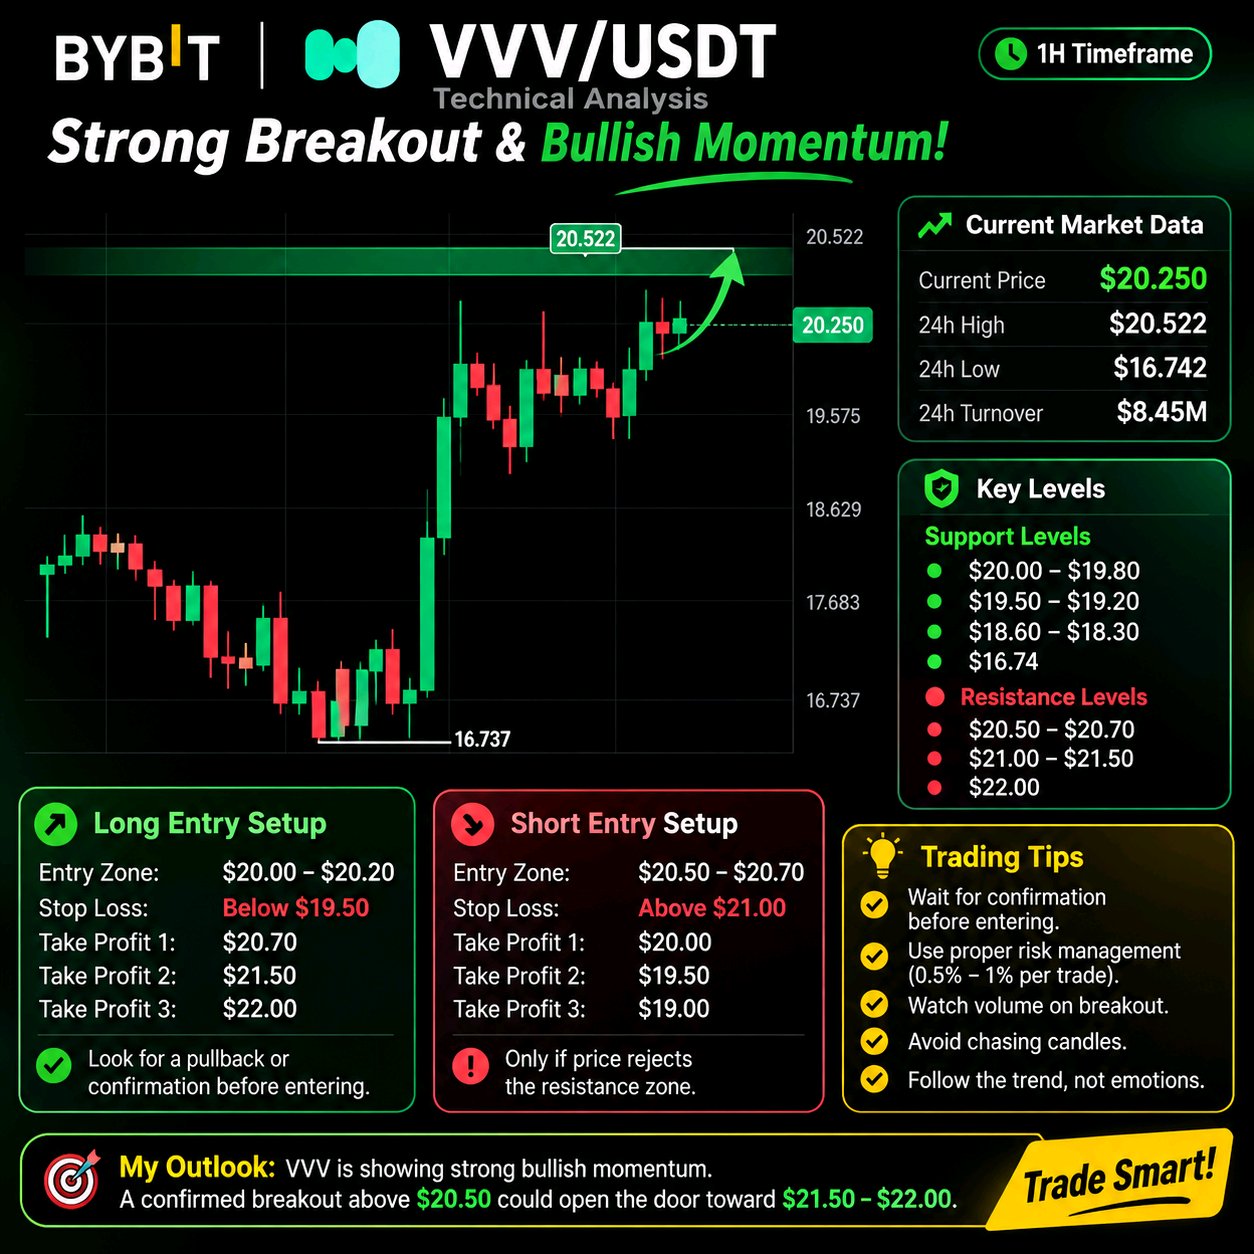
🚀 $VVVUSDT 多頭勢力正掌控全局!$22 會是下一個目標嗎? VVV 在從 $16.737 的支撐區回升後,正展現出強勁的看漲動能。 價格已攀升至 $20.250,記錄了驚人的 19.54% 漲幅。買方顯然力道強勁,但下一個阻力區對於延續這波走勢至關重要。 讓我們看看關鍵點位和可能的交易機會。 📊 當前市場概況 交易對:VVV/USDT 當前價格:$20.250 24 小時漲跌幅:+19.54% 24 小時最高價:$20.522 24 小時最低價:$16.742 24 小時成交額:$8.45M 時間週期:1 小時 🟢 重要支撐區 $20.00 – $19.80:即時支撐與潛在回調買入區。 $19.50 – $19.20:次級支撐,買方可能在此試圖捍衛價格。 $18.60 – $18.30:重要需求區與先前的盤整區。 $16.74:近期主要波段低點。 🔴 重要阻力區 $20.50 – $20.70:即時阻力與突破區。 $21.00 – $21.50:下一個潛在阻力區。 $22.00:若看漲動能持續,心理上的上行目標。 📈 做多 (LONG) 交易策略 策略 1:回調買入 (Pullback Entry) 進場區:$19.80 – $20.10 停損:$19.40 以下 止盈 1:$20.50 止盈 2:$21.00 止盈 3:$21.50 進場前請等待支撐位附近的看漲確認訊號。切勿僅因為價格在上漲就盲目買入。 策略 2:突破買入 (Breakout Entry) 進場:確認 1 小時 K 線收盤價高於 $20.55 後。 回測區:$20.40 – $20.55 停損:$20.00 以下,並根據回測結構調整。 止盈 1:$21.00 止盈 2:$21.50 止盈 3:$22.00 若突破伴隨強勁成交量,將提供更好的確認。 📉 做空 (SHORT) 交易策略 如果 VVV 無法突破 $20.50 – $20.70 阻力區並形成強勁的看跌拒絕訊號,可能會出現做空機會。 進場區:確認看跌訊號後 $20.45 – $20.70。 停損:$21.00 以上 止盈 1:$20.00 止盈 2:$19.50 止盈 3:$19.20 如果買方成功突破並站穩阻力位,請勿建立空頭倉位。 🧠 專業交易建議 1. 觀察 $20.50 附近的 1 小時 K 線收盤。 2. 在信任突破之前,請先檢查交易量。 3. 等待回測,而不是追逐綠色陽線。 4. 每一筆交易都務必設置停損。 5. 每筆交易的風險控制在交易資本的 0.5%–1% 以內。 6. 考慮在每個目標位進行分批止盈。 🎯 我的市場展望 在從 $16.737 強勁反彈後,VVV 目前具有看漲的短期結構。 $20.50 點位是目前最重要的觀察區域。 確認突破可能創造邁向 $21.50 甚至 $22.00 的機會。 然而,若遭到阻力位拒絕,可能會引發向 $20.00 或 $19.50 的健康回調。 我的策略會是等待確認,而不是追逐目前的漲勢。 交易你的策略,而不是情緒。 你怎麼看? VVV 會突破 $20.50 並邁向 $22,還是賣方會將價格推回 $19.50? #ByXIMPACT #WSOT曬出你的AI交易即可贏取10USDT #黃仁勳離任考驗Nvidia的AI領導地位 #美國PPI測試「更高更久」交易策略 #美國通膨升溫,升息押注升高 $BTCUSDT
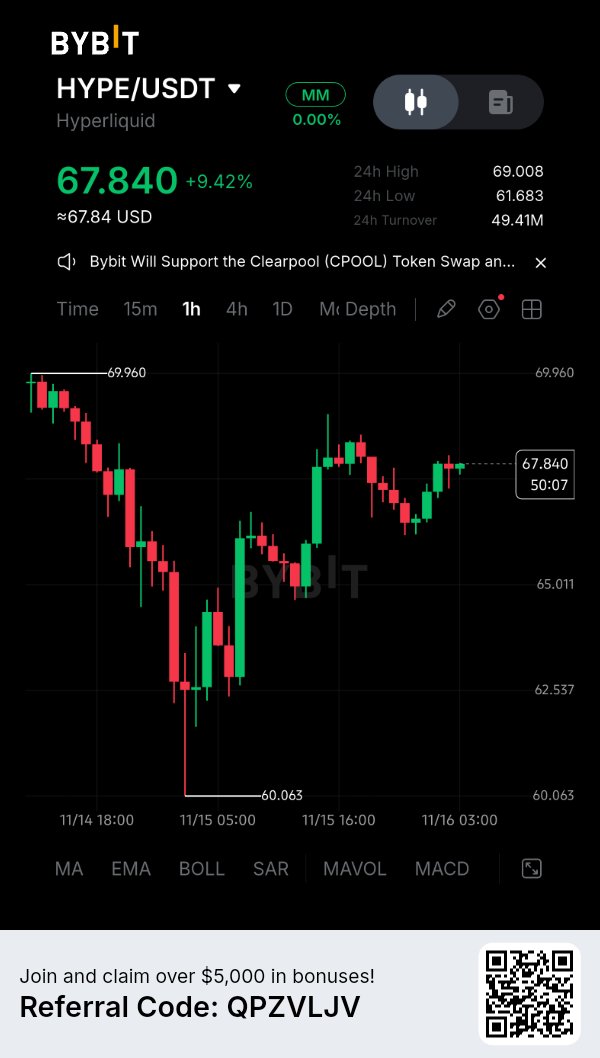
🚨 $HYPEUSDT 技術分析 – 多頭正在反擊! HYPE 在跌至 60.06 美元支撐區附近後展現出強勁復甦。買盤積極進場,將價格推回 67.84 美元,圖表顯示漲幅約為 9.42%。 然而,接下來的走勢至關重要。價格正接近一個主要阻力區,交易者在進場前應等待確認信號。 📊 當前市場結構 (1小時線) 當前價格:$67.84 24小時高點:$69.00 24小時低點:$61.68 主要圖表低點:$60.06 市場已從近期的低點強勁復甦。短期動能看漲,但 68.50 美元至 69.00 美元區間可能會造成拋售壓力。 🎯 重要支撐位 1. $67.00 – $66.50:即時支撐位及潛在回調區。 2. $65.50 – $65.00:買方的重要支撐區。 3. $63.00 – $62.50:前一波復甦的主要需求區。 4. $60.06:近期圖表低點及主要下行參考點。 🔴 主要阻力位 1. $68.50 – $69.00:即時阻力區。 2. $69.90 – $70.50:突破確認後的潛在上行目標。 3. $72.00:若看漲動能持續,下一個心理關卡目標。 📈 潛在的多頭 (LONG) 進場策略 策略 1 – 回調進場 進場區間:$66.50 – $67.20 止損:$65.80 以下 獲利目標 1:$68.00 獲利目標 2:$69.00 獲利目標 3:$70.00 進場前請等待看漲的反轉蠟燭或確認支撐測試。 策略 2 – 突破進場 進場:在 1 小時 K 線確認收盤於 $69.10 以上後。 確認:等待 $69.00 的成功回測。 止損:回測結構下方。 獲利目標 1:$70.00 獲利目標 2:$70.50 獲利目標 3:$72.00 避免在未確認的情況下追漲。 📉 潛在的空頭 (SHORT) 進場策略 若 HYPE 無法突破 $68.50 – $69.00 阻力區並出現明顯的看跌反轉: 進場區間:在看跌確認後 $68.30 – $68.90。 止損:$69.50 以上 獲利目標 1:$67.20 獲利目標 2:$66.50 獲利目標 3:$65.00 僅在賣方重新掌握主導權時才應考慮空單。若出現強勢突破阻力位,此策略失效。 🧠 專業交易策略 我在進行交易前會關注以下五點: 1. 觀察 1 小時 K 線在 $69.00 附近的收盤情況。 2. 檢查任何突破過程中的成交量。 3. 避免在阻力區中間進場。 4. 等待回測,而不是追逐綠色蠟燭。 5. 將每筆交易的風險控制在交易資本的 0.5% 到 1% 之間。 我的市場展望 HYPE 目前具有正向的短期復甦動能,但 69.00 美元是關鍵決策點。 確認突破可能開啟通往 70 至 72 美元的大門。 另一方面,若在阻力位遇阻回落,可能會帶來向 67 美元甚至 65 美元的回調。 最好的交易不見得是第一筆交易。耐心、確認信號和適當的風險管理比預測每一根 K 線更重要。 你對 HYPE 的預期是什麼? 多頭會突破 69 美元並推向 72 美元,還是賣方會再次守住阻力位? 在下方分享你的分析。 #ByXIMPACT

ETHUSDT 多頭正權衡是否進行回測
這段行情中最關鍵的線索在於拋售與試圖反彈之間的對比。21:00 時,紅色蠟燭在該序列最大成交量下收於 1,807.04;到了 04:00,經過幾根綠色蠟燭後,價格收於 1,819.45。這顯示買方已有回應,儘管最新的蠟燭是紅色的。$ETHUSDT 位於 MA7 和 MA14 附近,且高於 MA28,這是一個溫和的支撐排列,但並不能證明反彈將會持續。 看漲傾向也有 24 小時走勢的支撐,然而混合的移動平均線表現以及較低的成交量,讓我無法將此走勢視為確認。我持有 ETH 現貨,我對圖表的解讀取決於買方能否維持近期的反彈,而不是假設早先的拋售已經結束。蠟燭序列顯示了需求與賣壓並存,因此我會觀察後續走勢,再給予這次反彈更多權重。 我的做多設置是可能回測 1,817.20 - 1,830.68 的進場區間,止損點設在 1,783.49,這是判定該設置無效的價位。TP1 為 1,857.65,TP2 為 1,891.36。從區間中間算起,提供的風險報酬比分別約為 0.8:1 和 1.7:1,因此相對於所述風險,第一個目標的獲利空間較小。 在進場區域附近的持穩將支撐我的看漲觀點;若跌破止損則會改變看法。近期的大成交量蠟燭提醒我們,這些價位附近的波動可能是不均勻的,因此我在評估突破時會考量流動性和潛在的影線。移動平均線描述了當前的圖表,但它們不能保證價格接下來的走勢。 交易計畫 (做多 / 看漲): • 支撐:1,710.47 / 1,710.47 | 阻力:1,845.30 / 2,103.98 • 進場區間:1,817.20 - 1,830.68 • 止損 (SL):1,783.49 • 目標:TP1 1,857.65 | TP2 1,891.36 當反彈發生在大量拋售之後,什麼因素能幫助你判斷買方是否已重拾主導權? 這僅是我的解讀,非投資建議。#ByXIMPACT


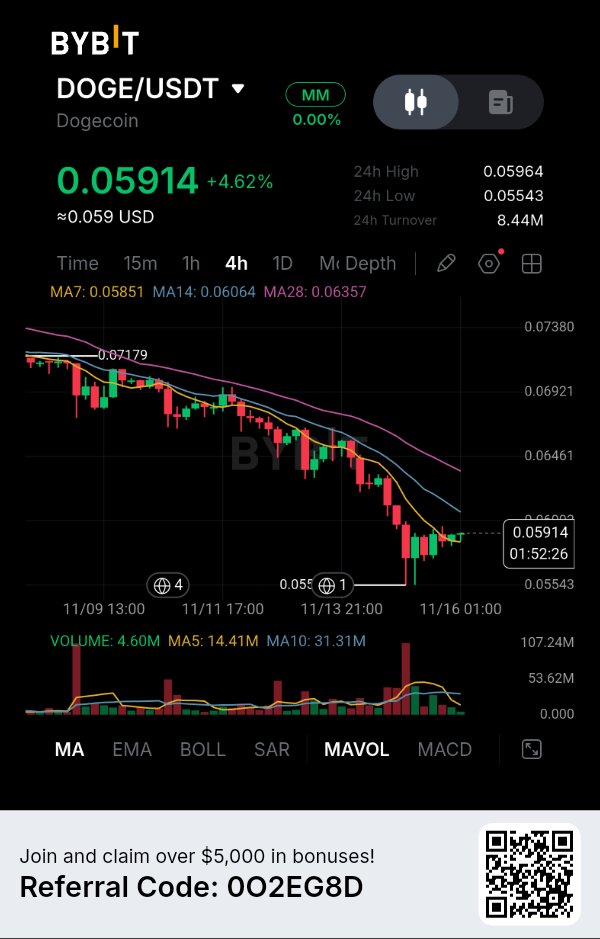
$DOGEUSDT — Dogecoin 正在回升,但大趨勢尚未改變。 Dogecoin 在您的 4 小時截圖中上漲了 4.62%,但我並不認為買方已經重新奪回控制權。有趣的是,DOGE 從近期低點反彈,但仍低於兩條重要的移動平均線。 同時,該項目背後正在發生變化:開發人員正致力於透過應用生態系統賦予 DOGE 更多實際用途。這在不斷提升的實用性與技術上疲軟的市場結構之間,形成了有趣的對比。 市場數據 — BYBIT 4 小時圖 根據您的圖表: * 價格:$0.05914 * 24 小時漲跌幅:+4.62% * 24 小時最高價:$0.05964 * 24 小時最低價:$0.05543 * 24 小時成交額:$844 萬 * MA7:$0.05851 * MA14:$0.06064 * MA28:$0.06357 在 11 月 16 日今日的獨立市場快照中,CoinMarketCap 顯示 DOGE 價格約為 $0.05895,市值約為 92.4 億美元,24 小時交易量為 11.5 億美元。流通供應量約為 1,567.6 億 DOGE,無固定最大供應量。 圖表顯示了什麼 DOGE 一直處於下跌結構中,從可見的 $0.07179 區域跌向 $0.05543。 買方近期守住了低位區域,並將價格推回 MA7($0.05851)上方。 然而,MA14($0.06064)和 MA28($0.06357)仍是上方阻力。 另一個細節值得關注:目前顯示的成交量為 460 萬,而 MA5 成交量為 1441 萬,MA10 成交量為 3131 萬。 這表明最近的反彈尚未吸引到與以往交易活動相當的參與度。 對我來說,$0.06064 是買方需要收復的第一個重要關卡。 大家應該關注的進展 Dogecoin 的生態系統正試圖超越單純的轉帳和支付功能。 11 月 11 日,DogeOS 宣佈其第一個版本已經開發完成並經過審計,據稱主網即將推出,但尚未提供確切的發布日期。 該項目旨在引入一個與以太坊兼容的應用層,支持 DeFi、交易、借貸和遊戲。據報導,有超過 100 名開發者正在開發相關應用。 最令人感興趣的是,DogeOS 打算使用 DOGE 來支付交易手續費,而不是引入另一個原生代幣。 然而,這有一個重要的限制:DogeOS 是一個獨立的應用層,並非 Dogecoin 基礎區塊鏈的直接升級。其當前的安全模型仍然依賴於選定的驗證節點,而針對原生零知識證明驗證的升級提案尚未獲得批准。 代幣價值問題 我一直在思考一個問題。 如果 DogeOS 成功吸引開發者和應用程序,DOGE 可能會透過交易手續費和應用活動獲得額外的實用性。 但開發完成並不保證用戶會採用。 真正的證據將來自實際的應用使用情況、交易需求以及透過這些新服務流通的 DOGE 數量。 Dogecoin 擁有成熟的網絡和充足的流動性,但其通膨性的供應結構也意味著需求需要長期維持相關性。 我的交易計劃 — 條件式做空 儘管近期有反彈,但更廣泛的 4 小時結構仍然有利於賣方。 觸發條件:在 $0.0600–$0.0606 附近出現拒絕,隨後 4 小時線收盤低於 $0.0585。 進場位:$0.0582–$0.0585。 止損位:$0.0600。 目標 1:$0.0565。 目標 2:$0.05543。 目標 3:$0.0535。 使用 $0.05835 的代表性進場位: 潛在下行空間至 TP3:8.32%。 設定風險:2.83%。 預估盈虧比:2.94:1。 此設置為條件式交易。如果沒有出現阻力位拒絕和隨後的跌破,我不會進場。 我的最終看法 Dogecoin 正進入一個有趣的發展階段。DogeOS 可能會為 DOGE 提供額外的金融應用,但市場仍需要證據證明開發者能將此基礎設施轉化為持續的用戶活動。 我認為最重要的問題不在於 Dogecoin 是否能吸引更多關注。 而是在於 Dogecoin 能否從一種人們主要用來持有和轉帳的資產,演變成一種人們有更多理由去主動使用的資產。 這種轉變對於 DOGE 的長期價值來說,可能比又一次短暫的價格回升更重要。$DOGEUSDT #ByXIMPACT


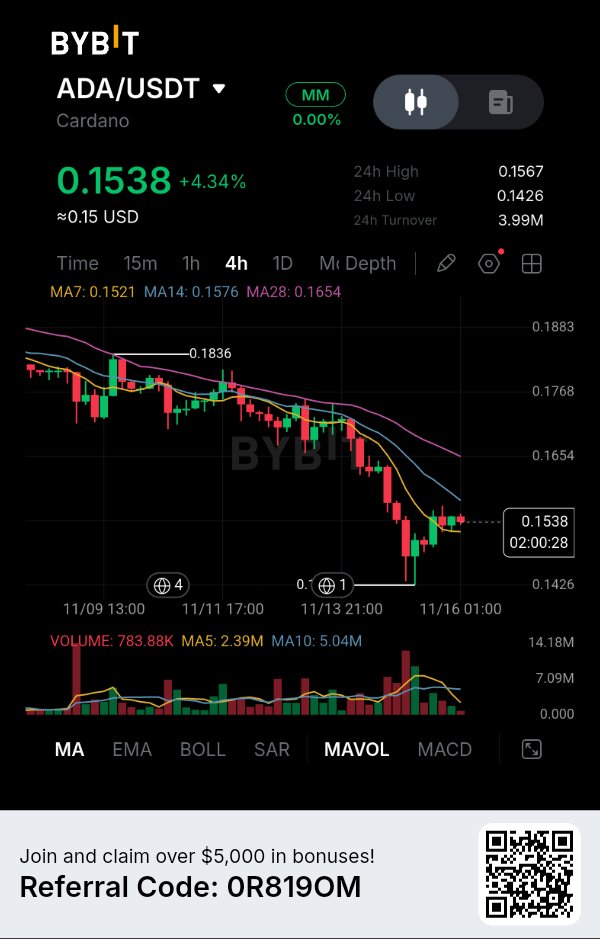
$ADAUSDT — CARDANO 上漲了 4.34%,但真正的考驗是買家能否收復 $0.1576。我不會把技術性反彈與趨勢反轉混為一談。 ADA 在經歷了長時間的下跌後,終於展現出了一些買盤意願。價格已從 $0.1426 的區域回升,目前在 $0.1538 附近交易。 這種反應令人鼓舞,但一個重要的細節讓我保持謹慎:買家雖然收復了短期移動平均線,但上方的阻力結構依然存在。 技術面分析 4 小時移動平均線展現了一個有趣的現象: MA7: $0.1521 MA14: $0.1576 MA28: $0.1654 ADA 已經收復了 MA7,顯示出短期的改善。 然而,MA14 和 MA28 仍高於當前價格。在買家展現出更強勢的復甦之前,大格局依然有利於賣方。 我關注的細節 $0.1426 水位是最近賣壓吸引買盤介入的位置。 但這次反彈有一個我不願忽視的弱點。 目前的成交量約為 783.88K,而 MA5 為 2.39M,MA10 為 5.04M。 與這兩條成交量均線相比,買盤的參與度仍然相對疲軟。 這使得 $0.1576 的阻力位變得特別重要。我想觀察買家是否能以更強的參與度收復該位置,或者賣家是否會再次發動防守。 我的執行策略 我正在關注「一個」條件性的空單機會。 進場區間:$0.1575–$0.1600 確認訊號:此區域出現 4 小時級別的看跌拒絕訊號。 停損點:$0.1665 目標價 1 (TP1):$0.1500 目標價 2 (TP2):$0.1426 目標價 3 (TP3):$0.1380(預計延伸目標) 我不會在反彈後立即進場。在考慮此佈局之前,我希望價格接近阻力位並顯示出明顯的賣壓。 什麼情況會導致我的觀點失效? 若 4 小時線強勢突破 $0.1654,將會削弱我的看跌延續論點。 如果 ADA 在 $0.1665 上方站穩,我將作廢此空單設置並重新評估市場。 我的觀點 ADA 最讓我感興趣的是短期動能改善與尚未恢復的較大趨勢之間的博弈。 買家已經守住了 $0.1426,但現在他們需要證明自己能夠克服上方的阻力。 我將 $0.1576 視為下一個重要的決策點。 我寧願錯過進場機會,也不願在未經確認的情況下追漲。 你會相信這次 ADA 的反彈並期待突破 $0.1576,還是會等待賣家確認再次拒絕上漲?$ADAUSDT #ByXIMPACT